New Methodological Approach towards a Complete Characterization of Structural Fiber Reinforced Concrete by Means of Mechanical Testing Procedures


Abstract
Featured Application
Abstract
1. Introduction
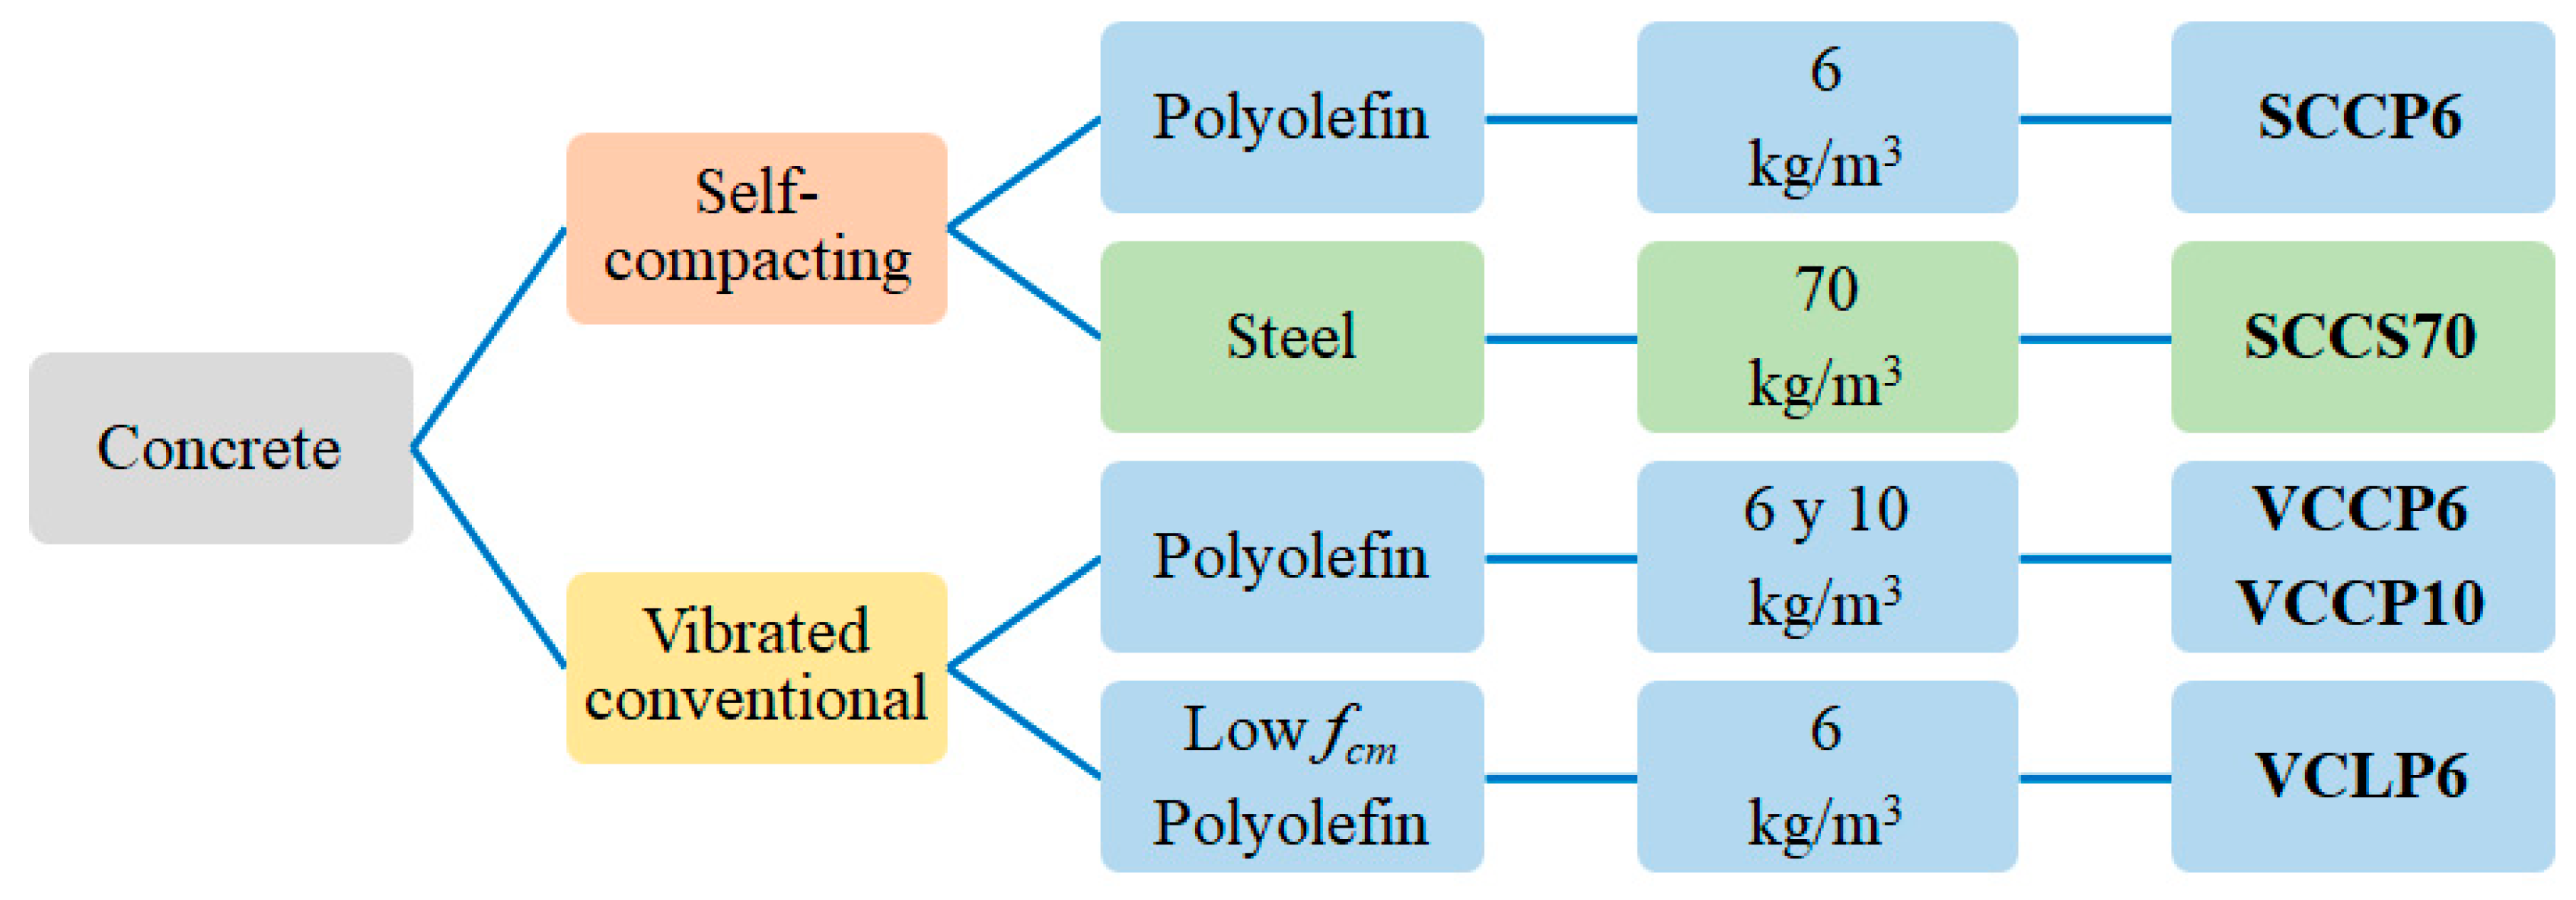
2. Materials
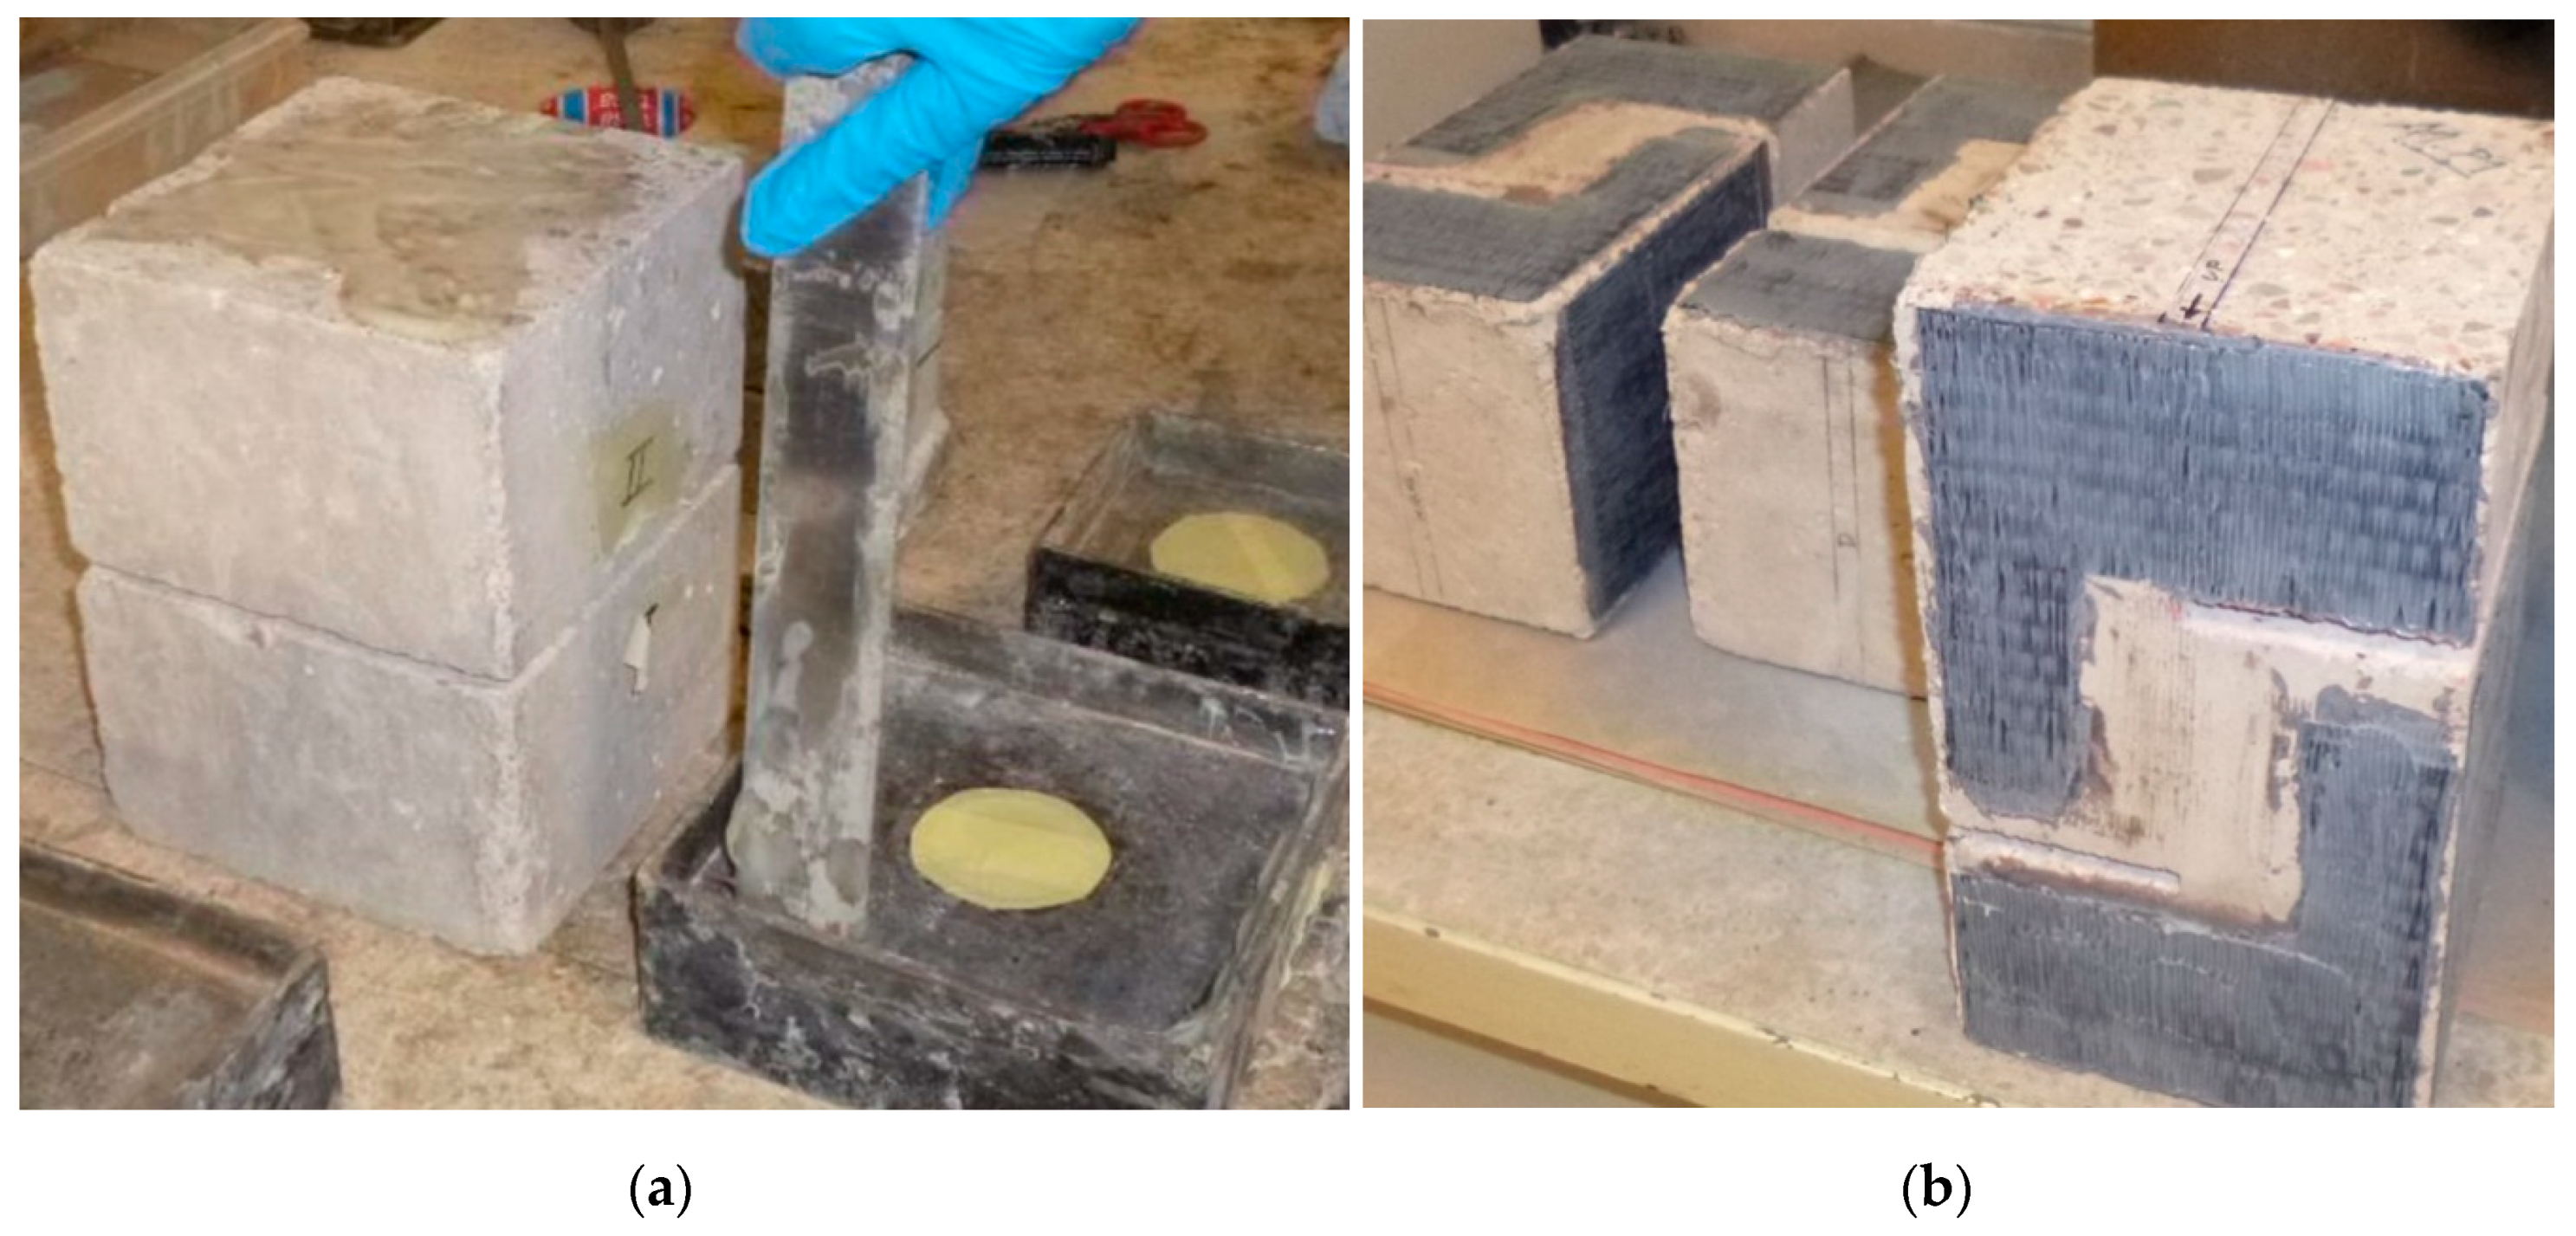
3. Specimen Preparation and Testing Procedures
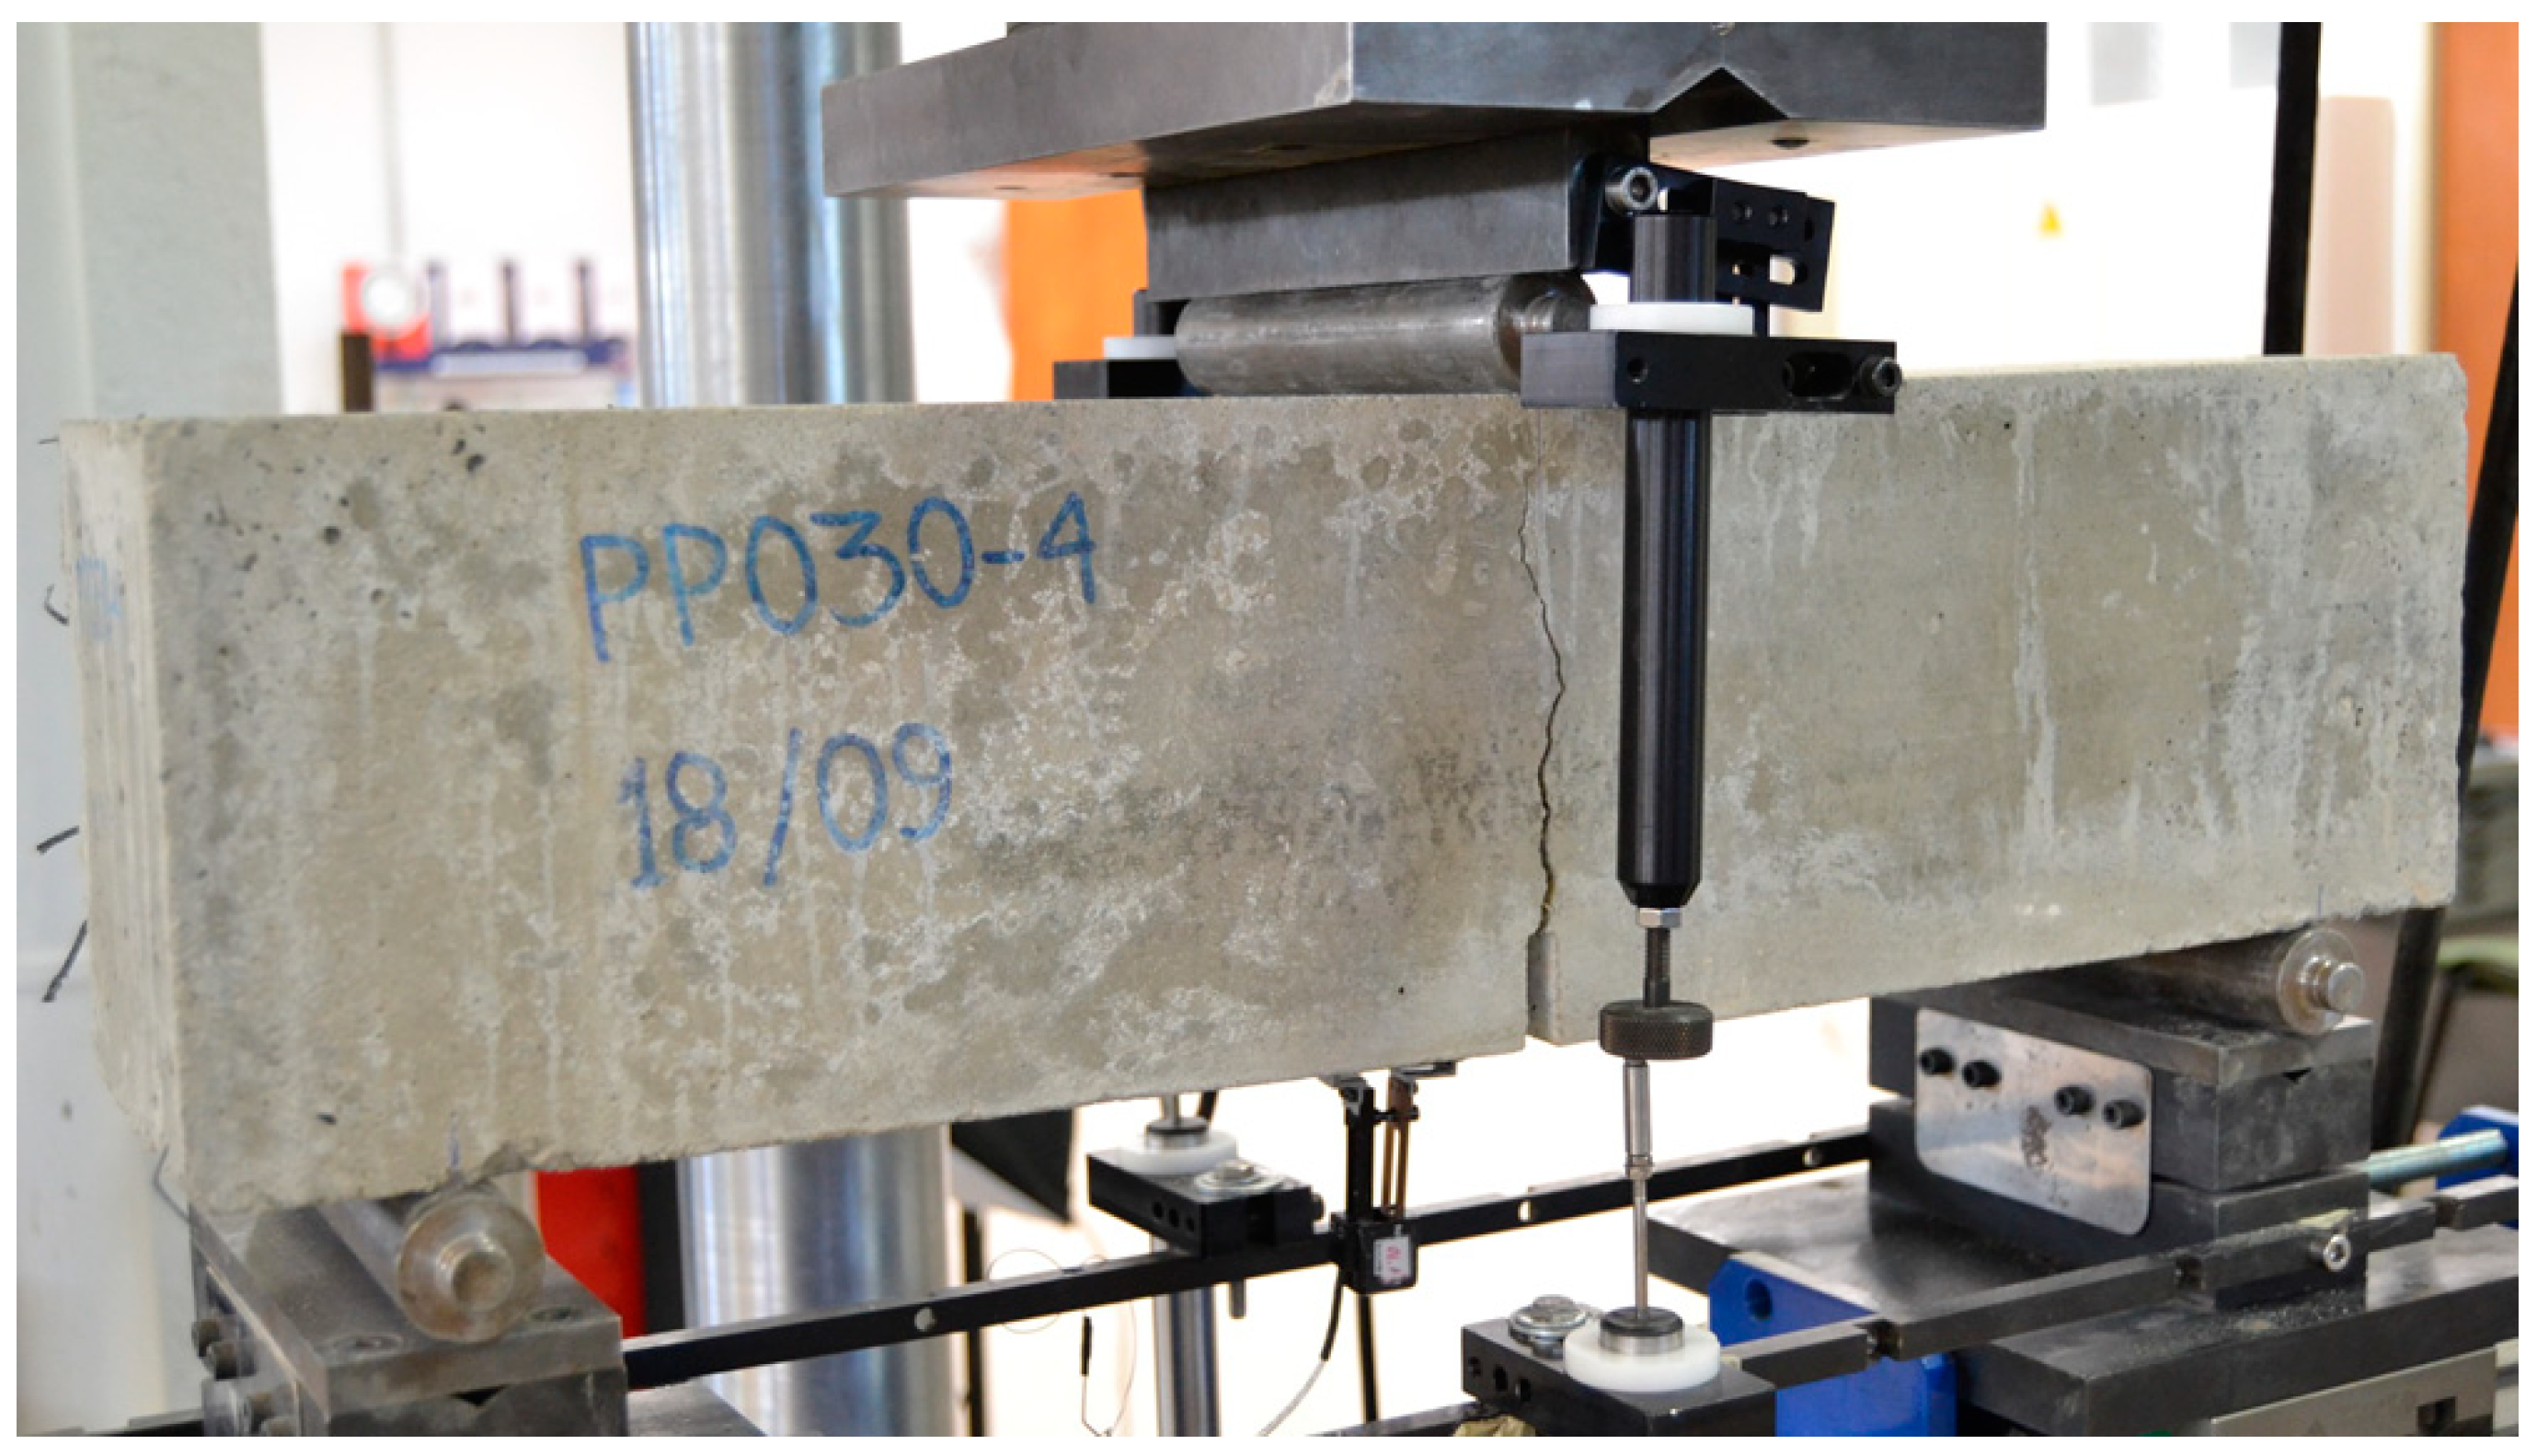
3.1. Three-Point Bending Tests on Notched Specimens
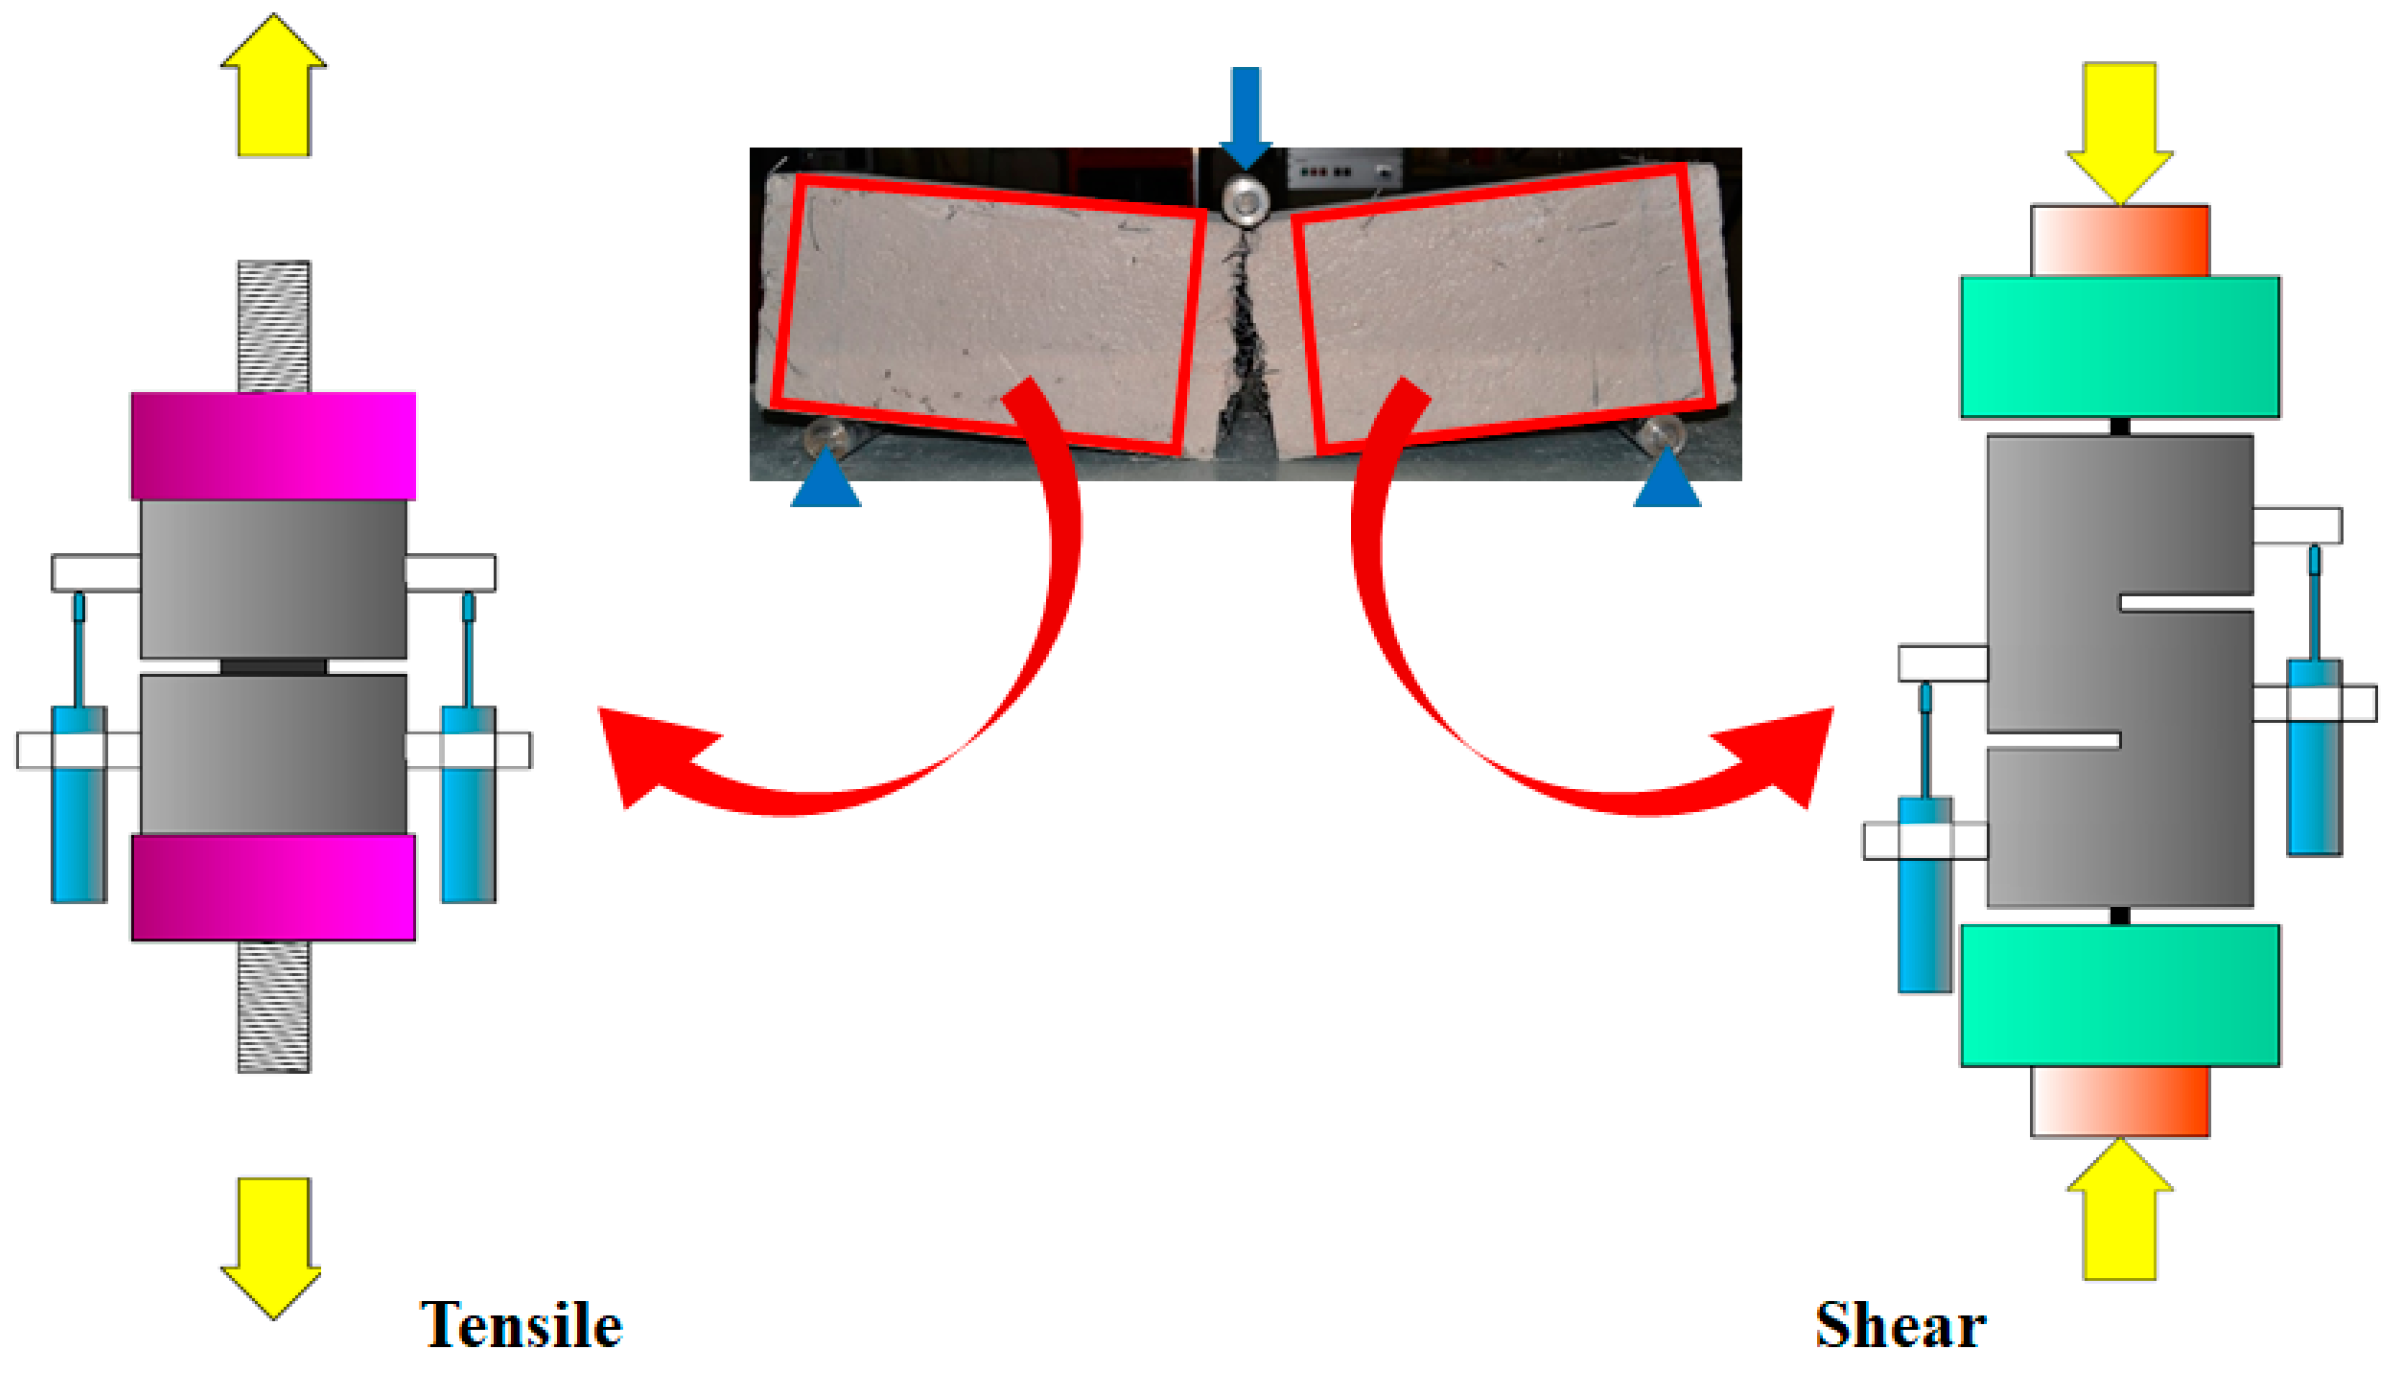
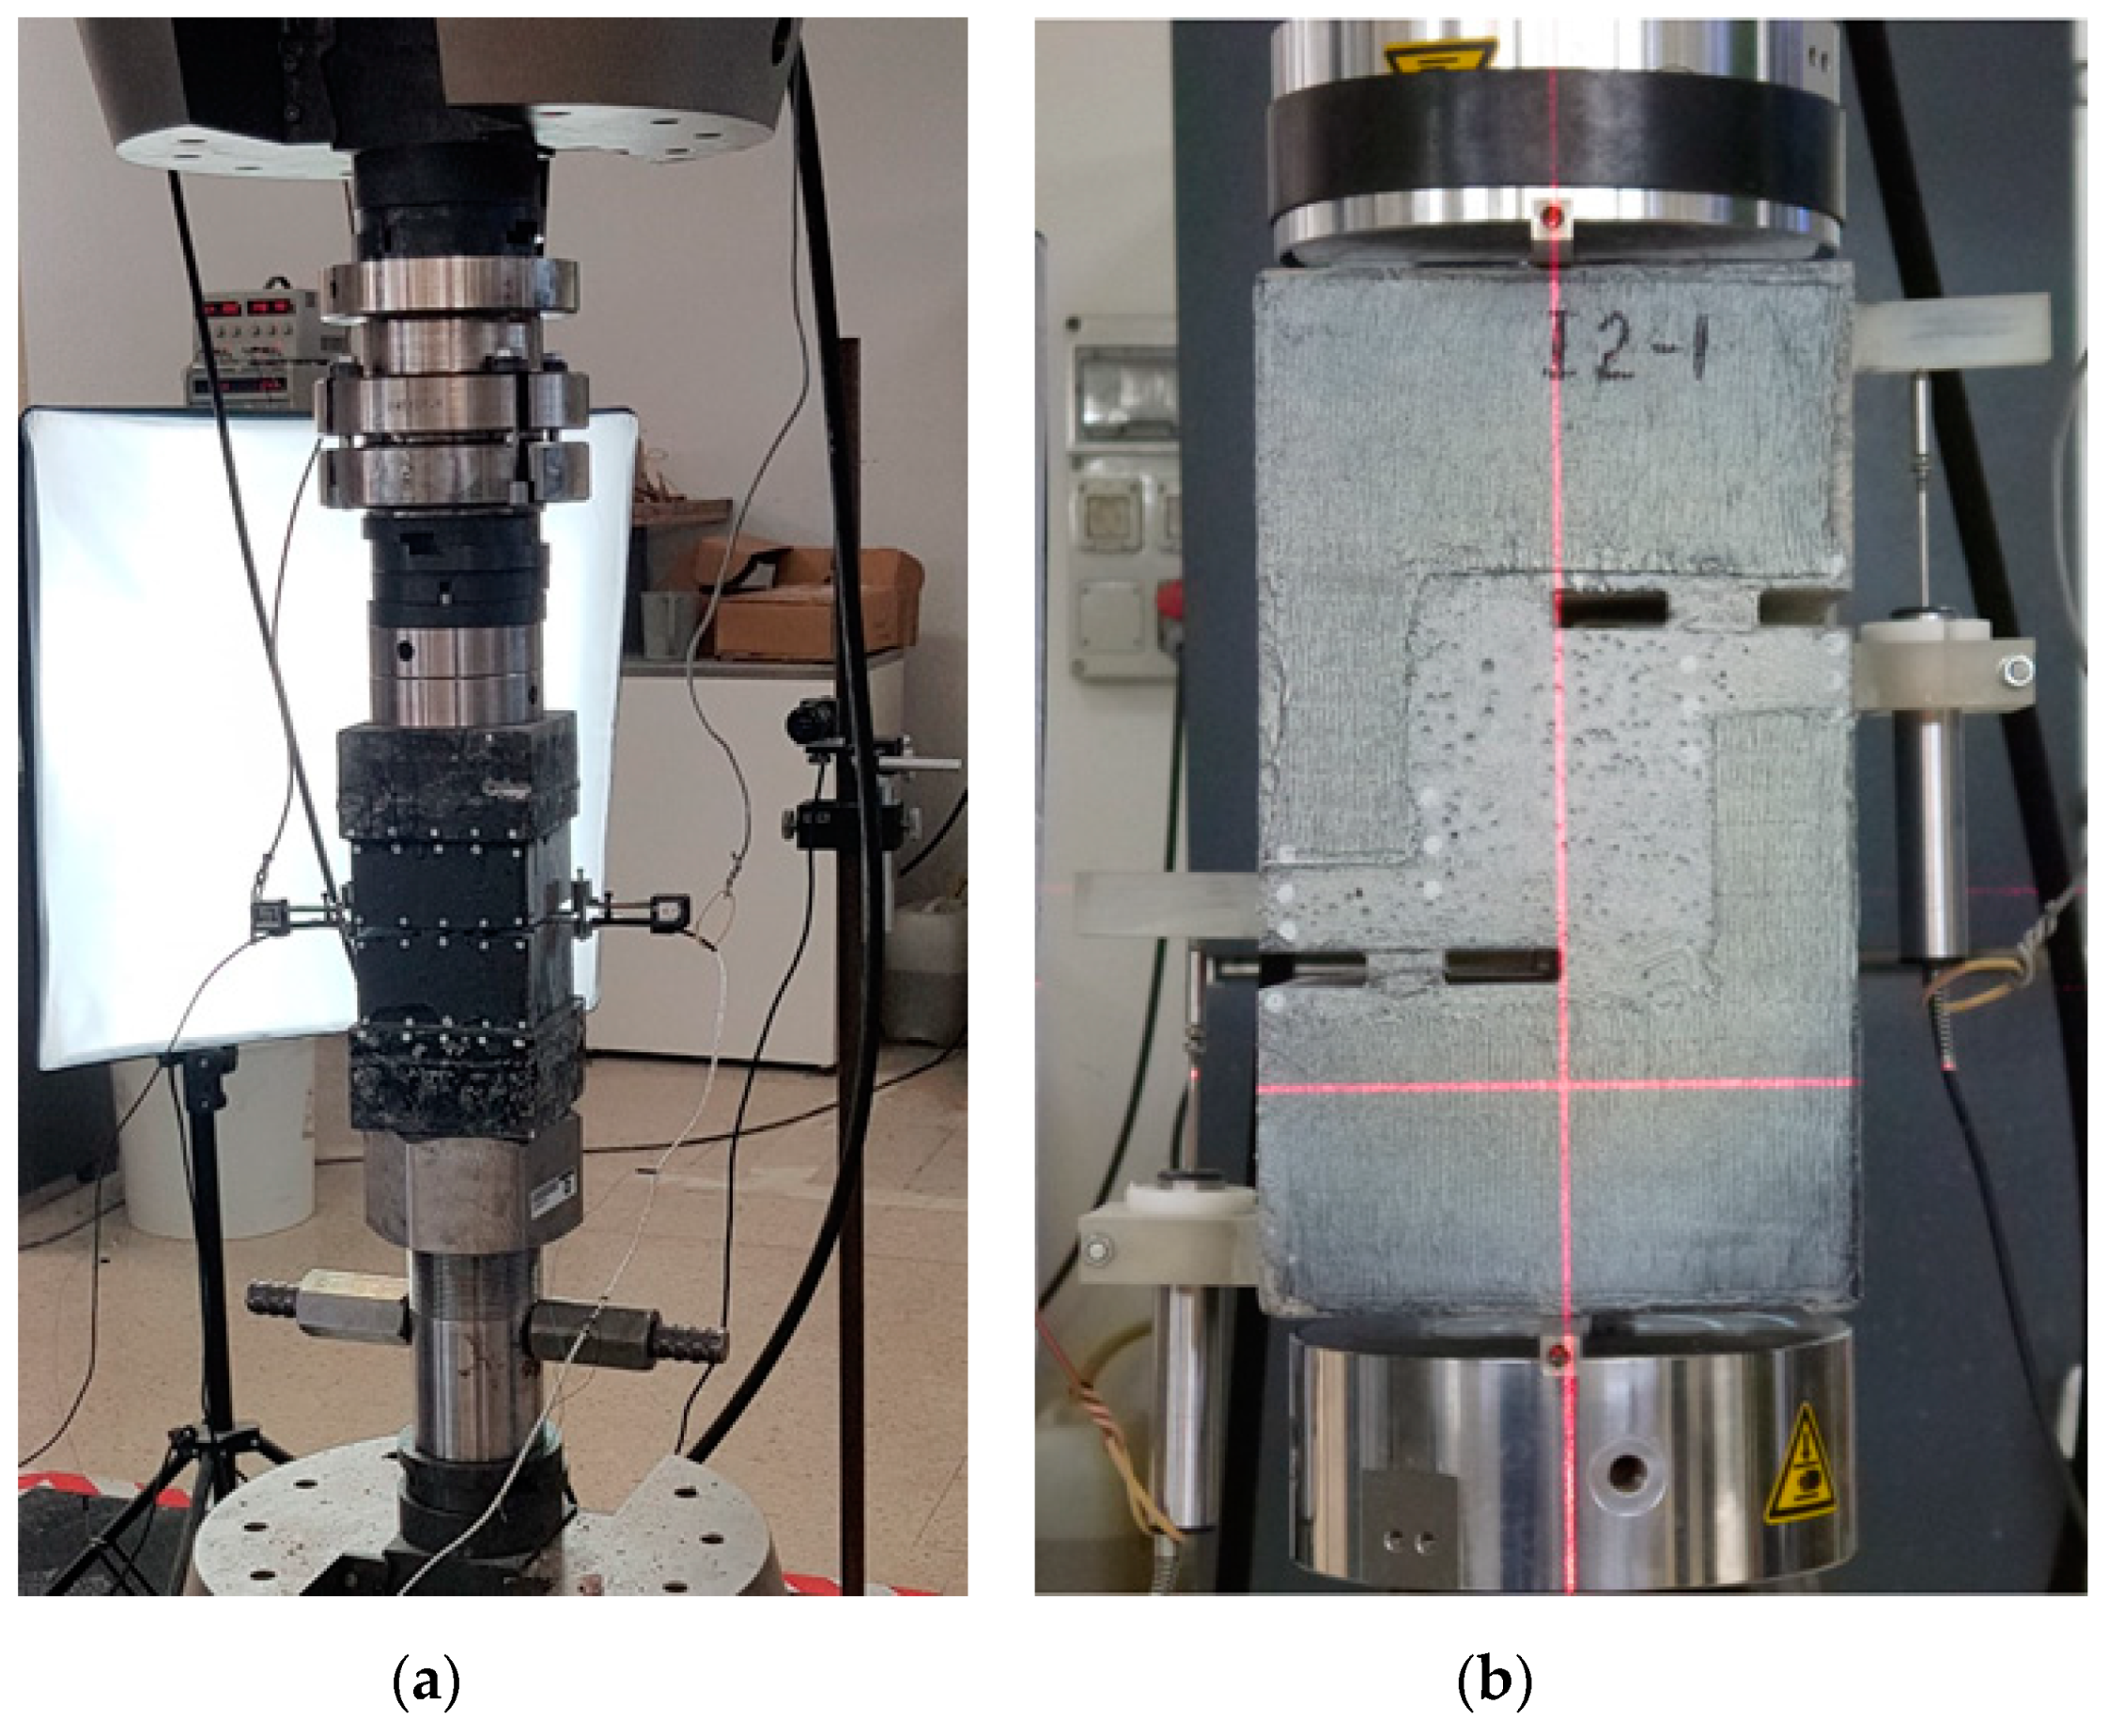
3.2. Tensile Strength Tests
3.3. Direct Shear Tests
4. Results and Discussion
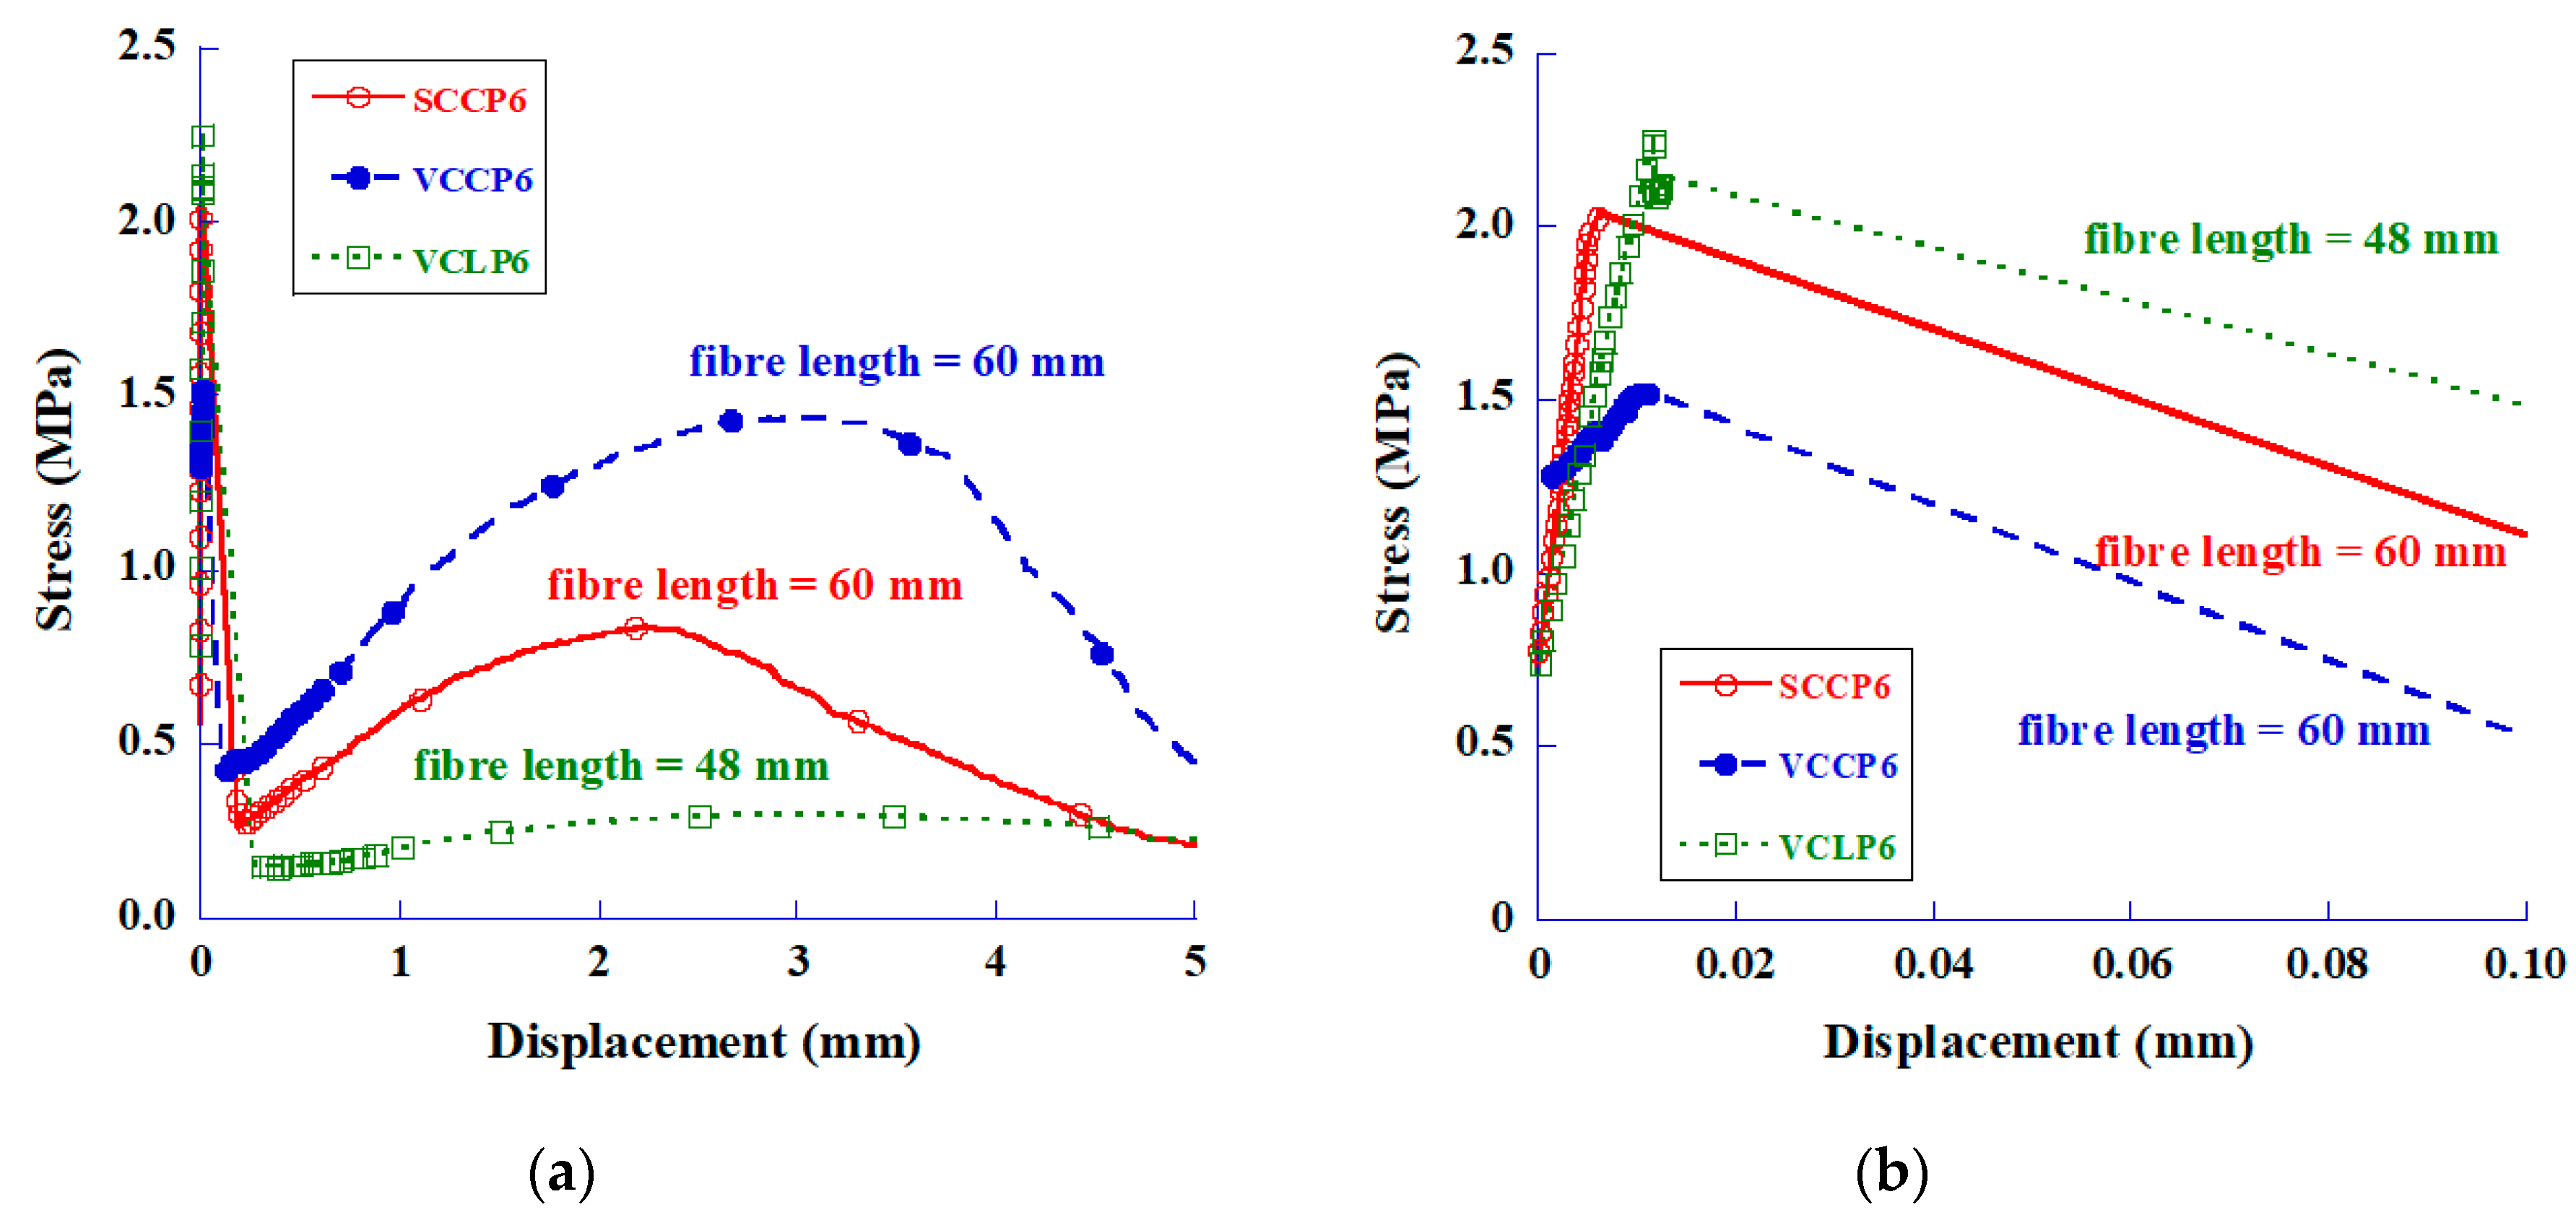
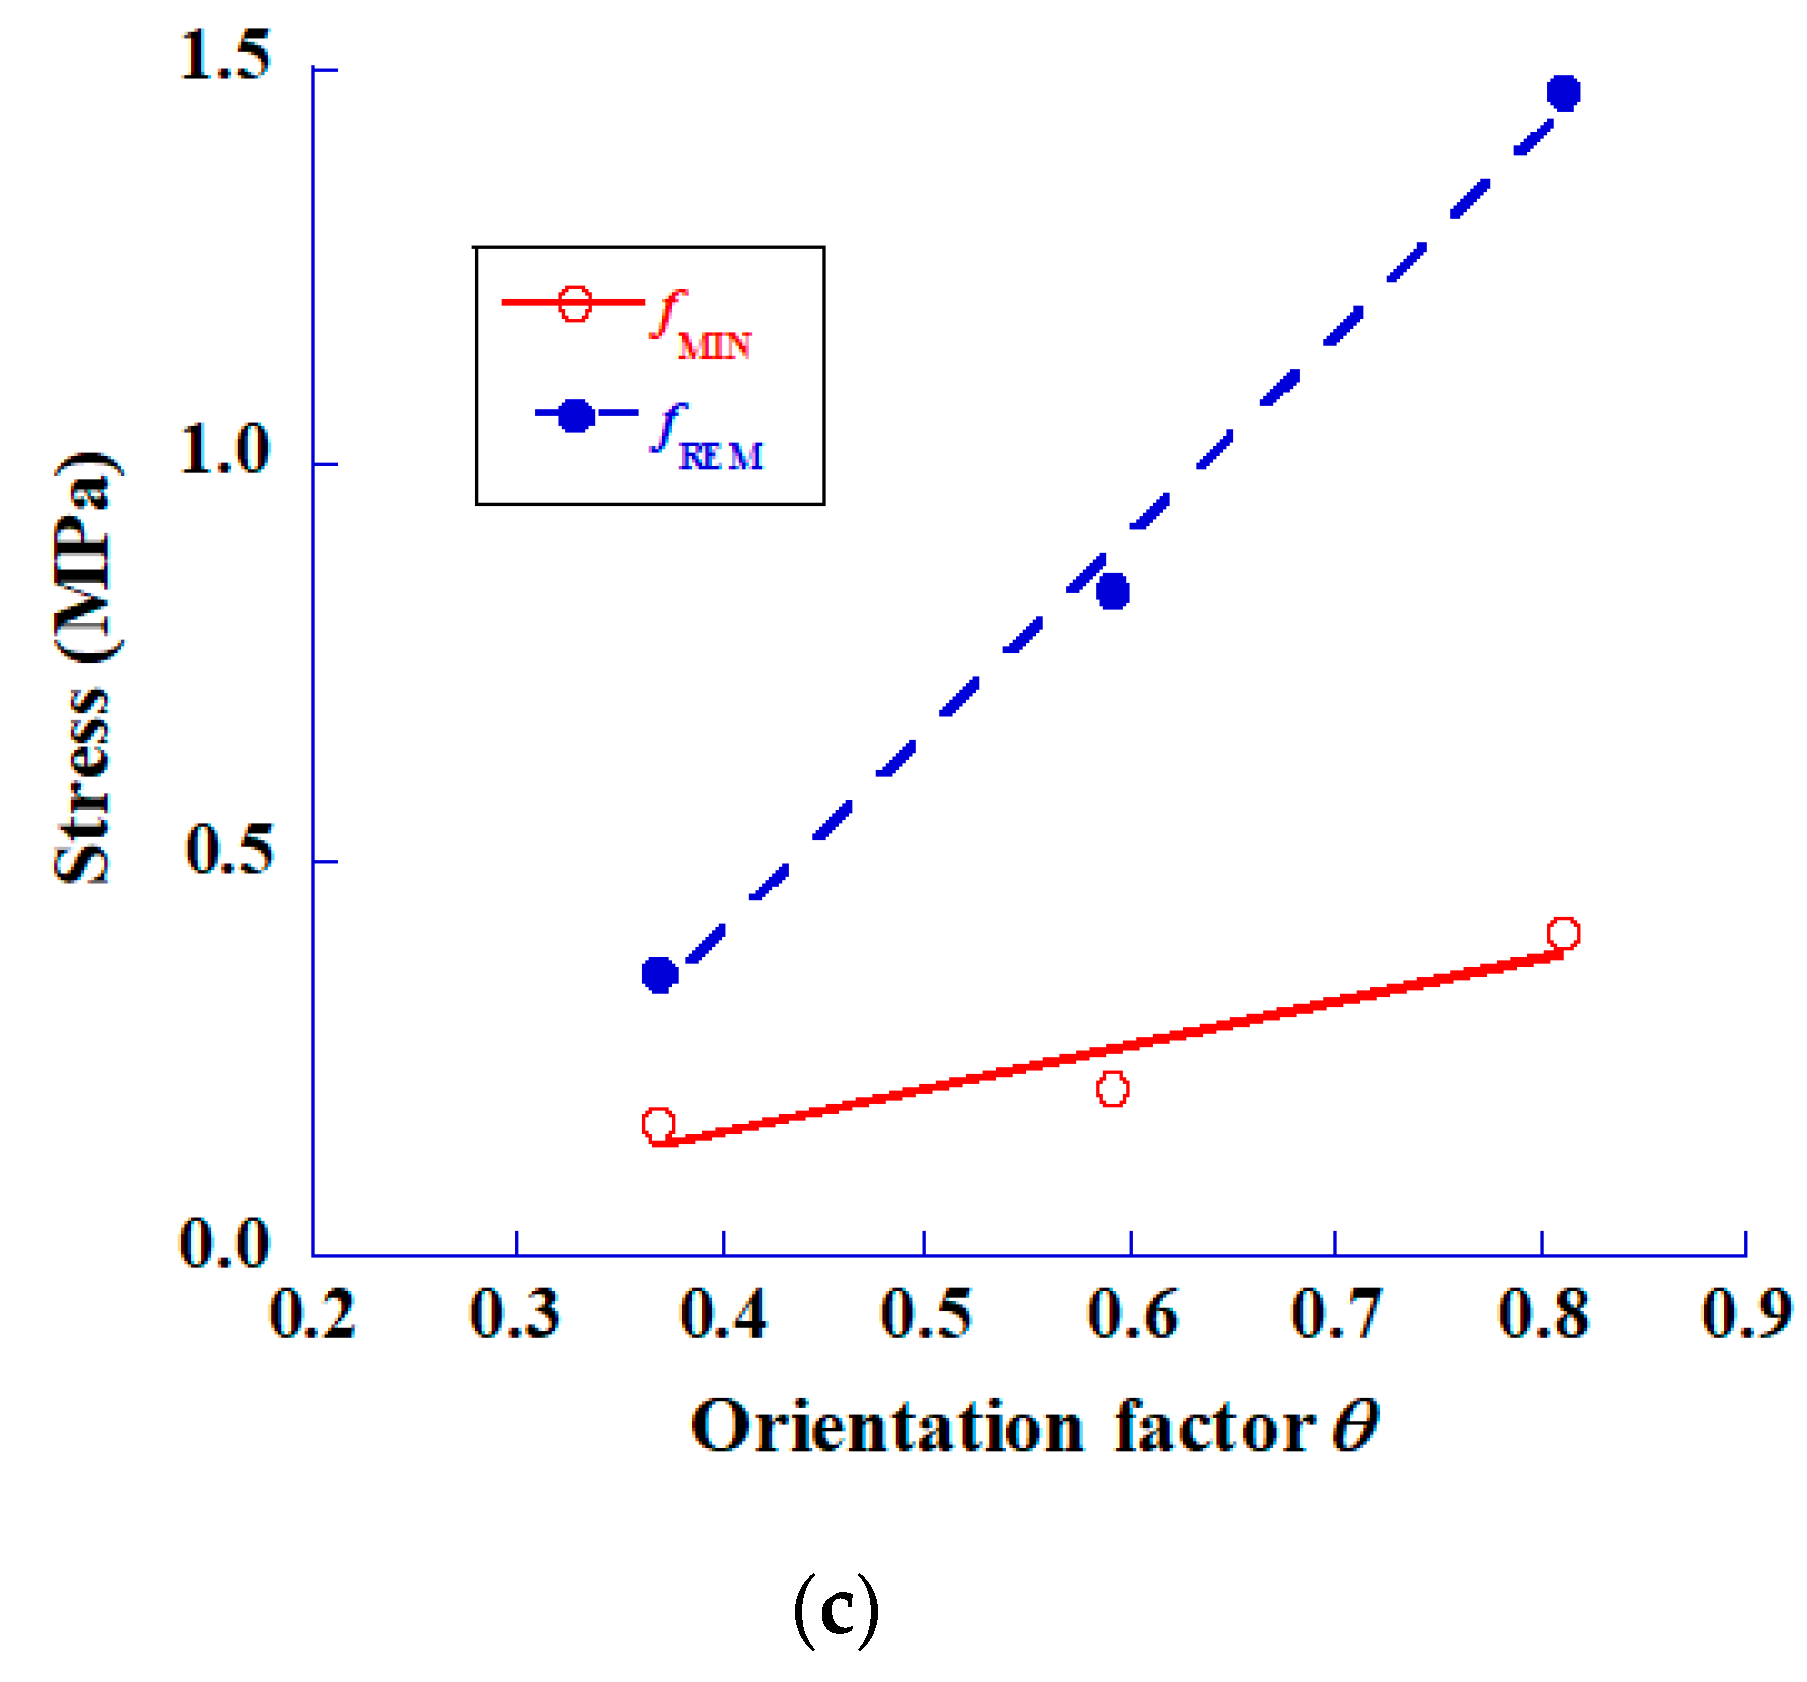
4.1. Tensile Tests
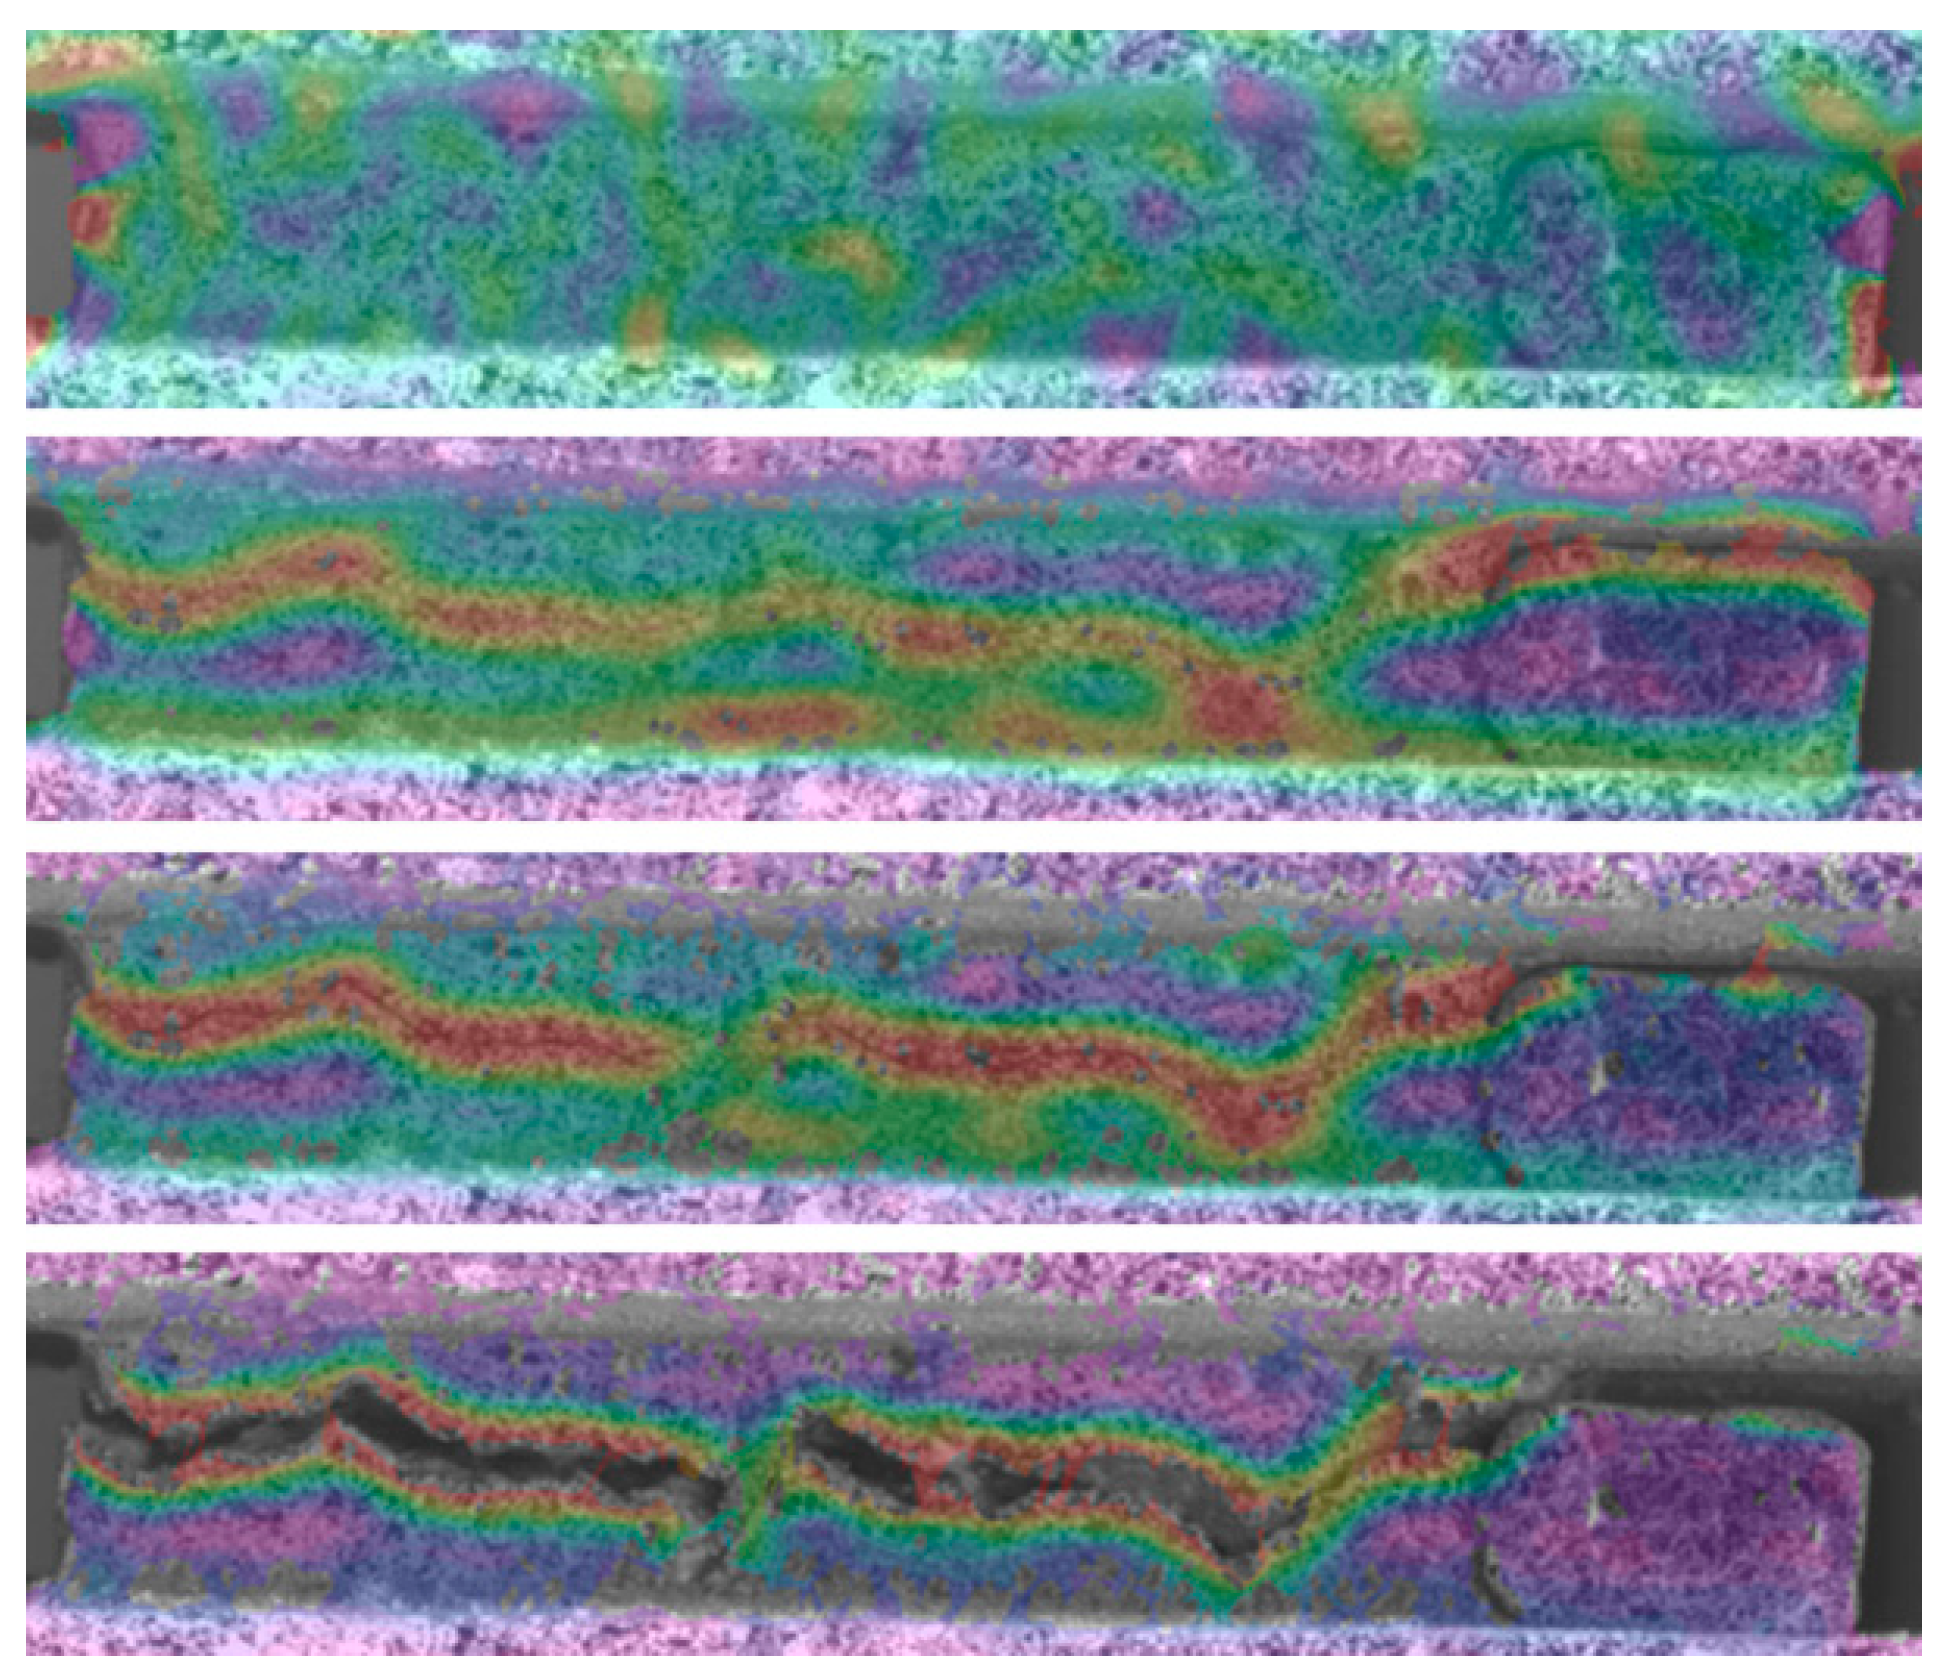
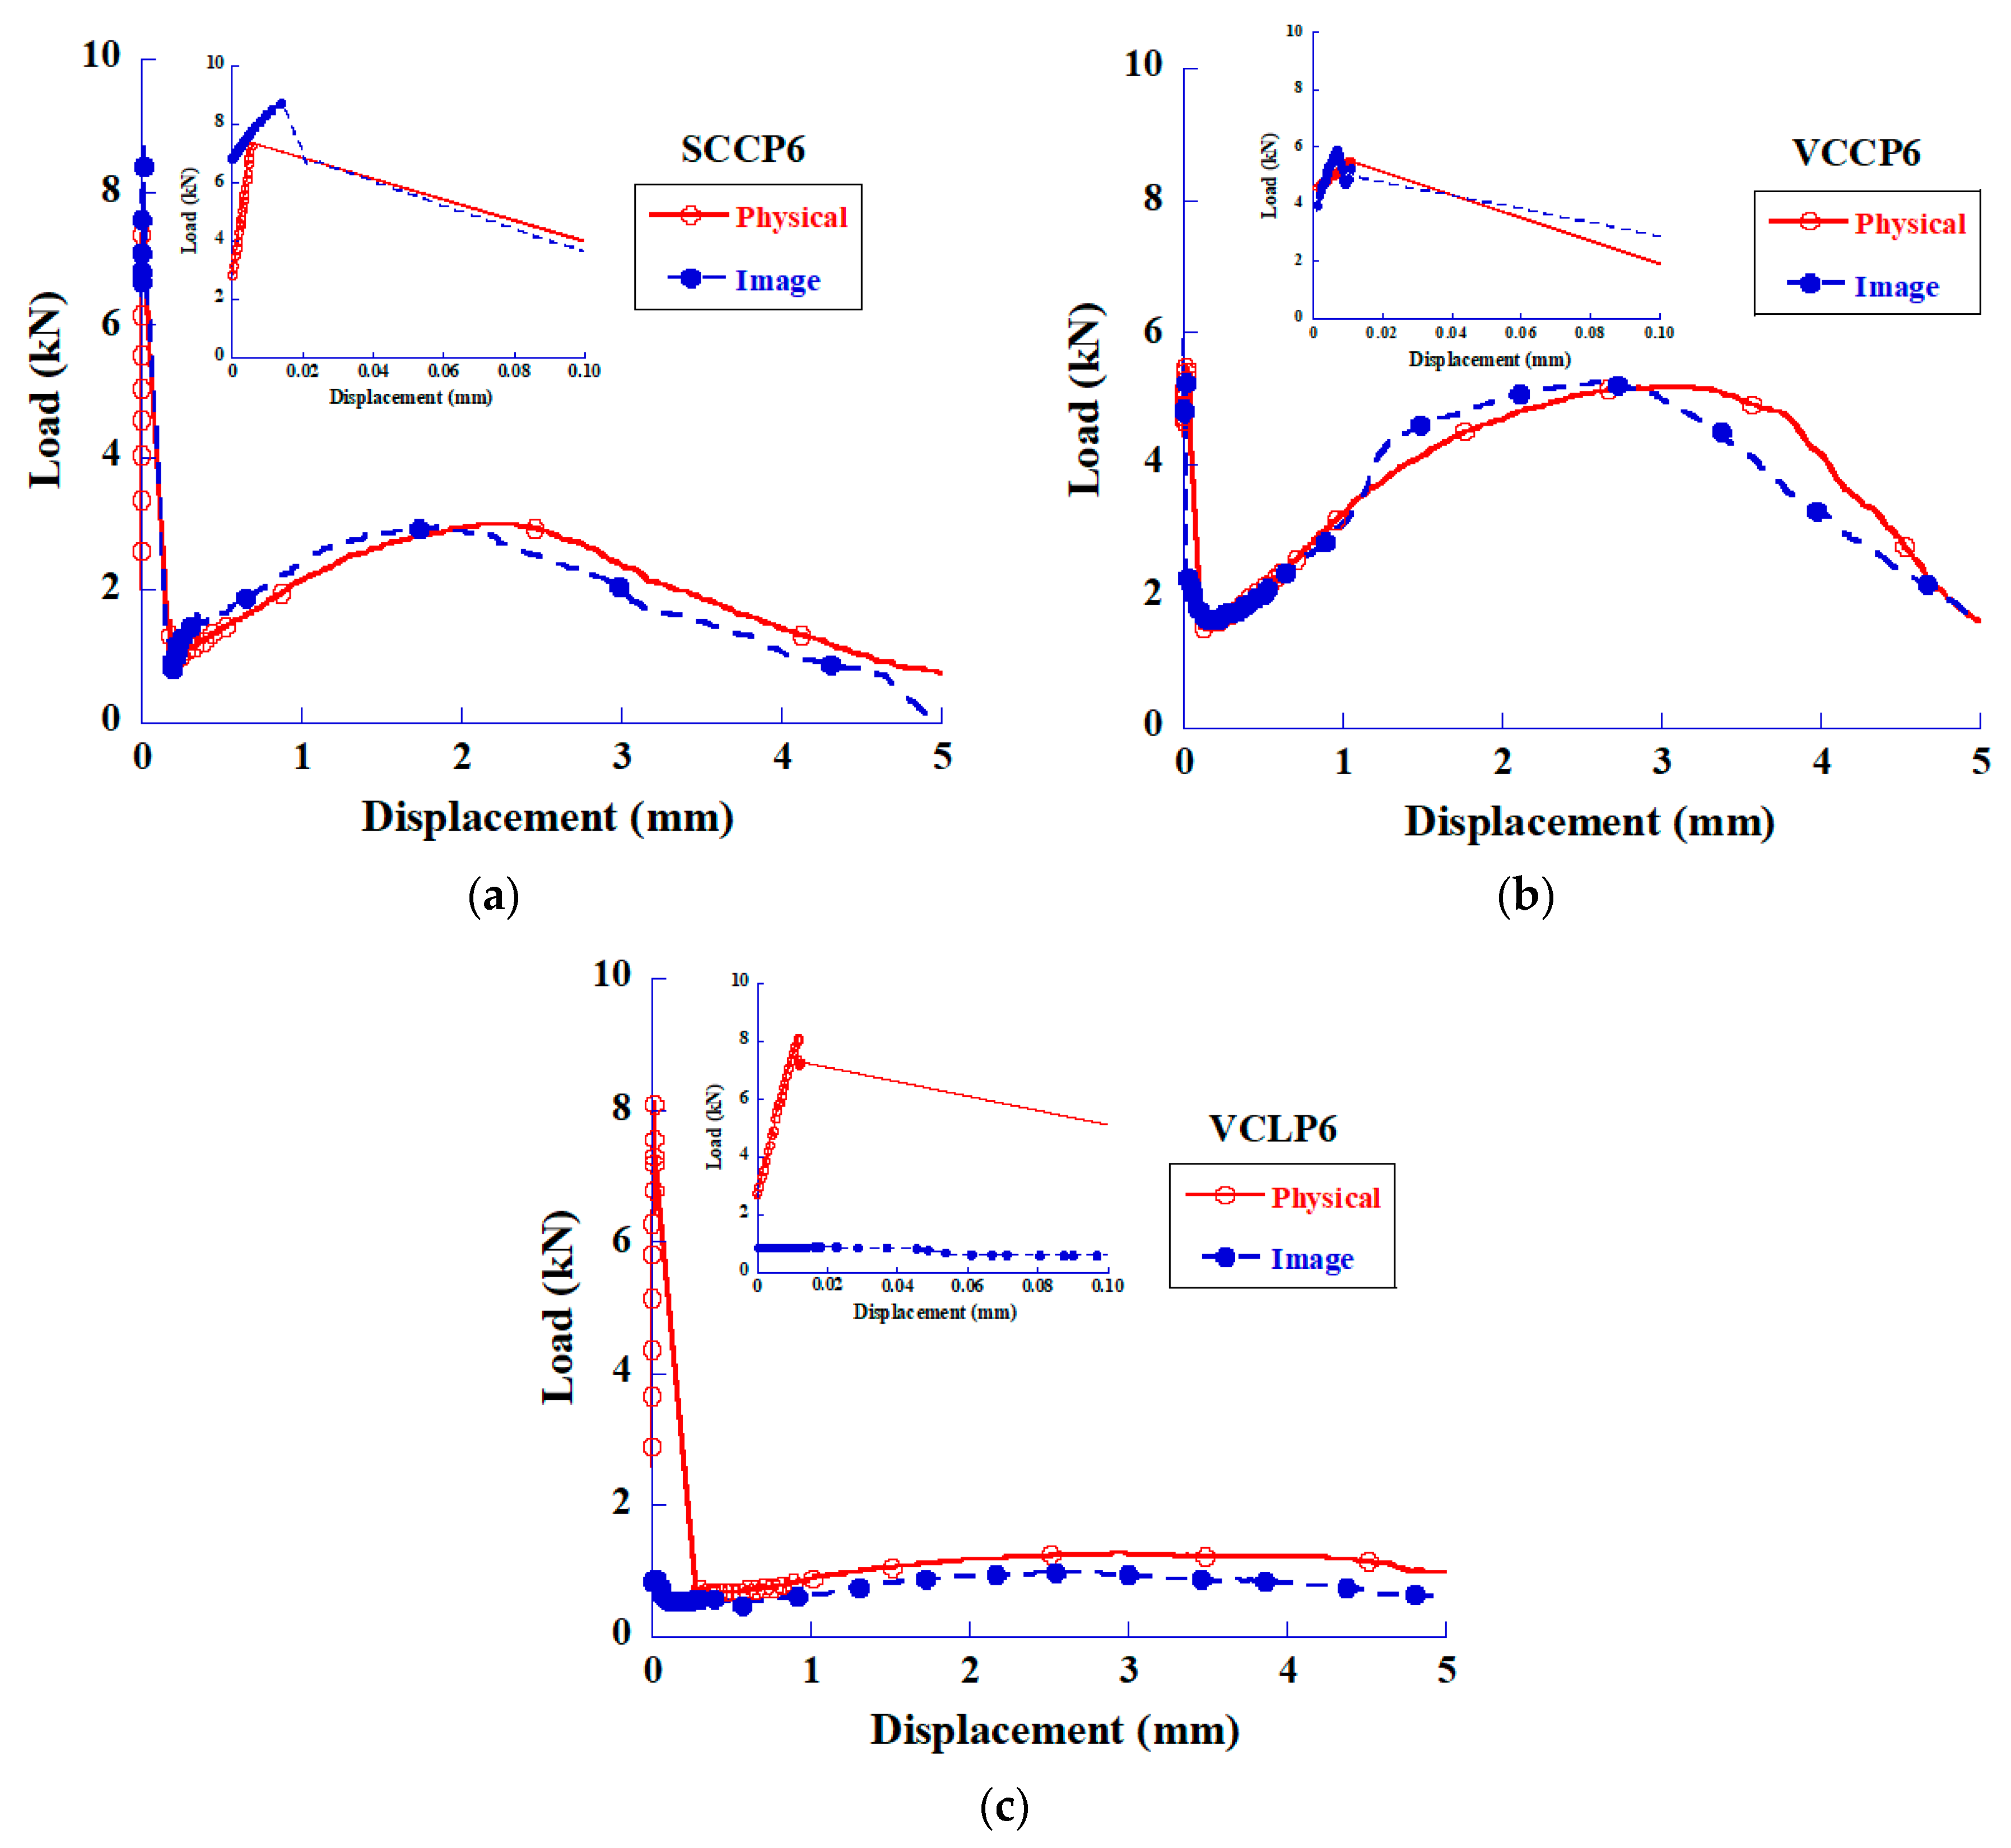
4.2. Validation of Video-Extensometry Technic for Use in Testing
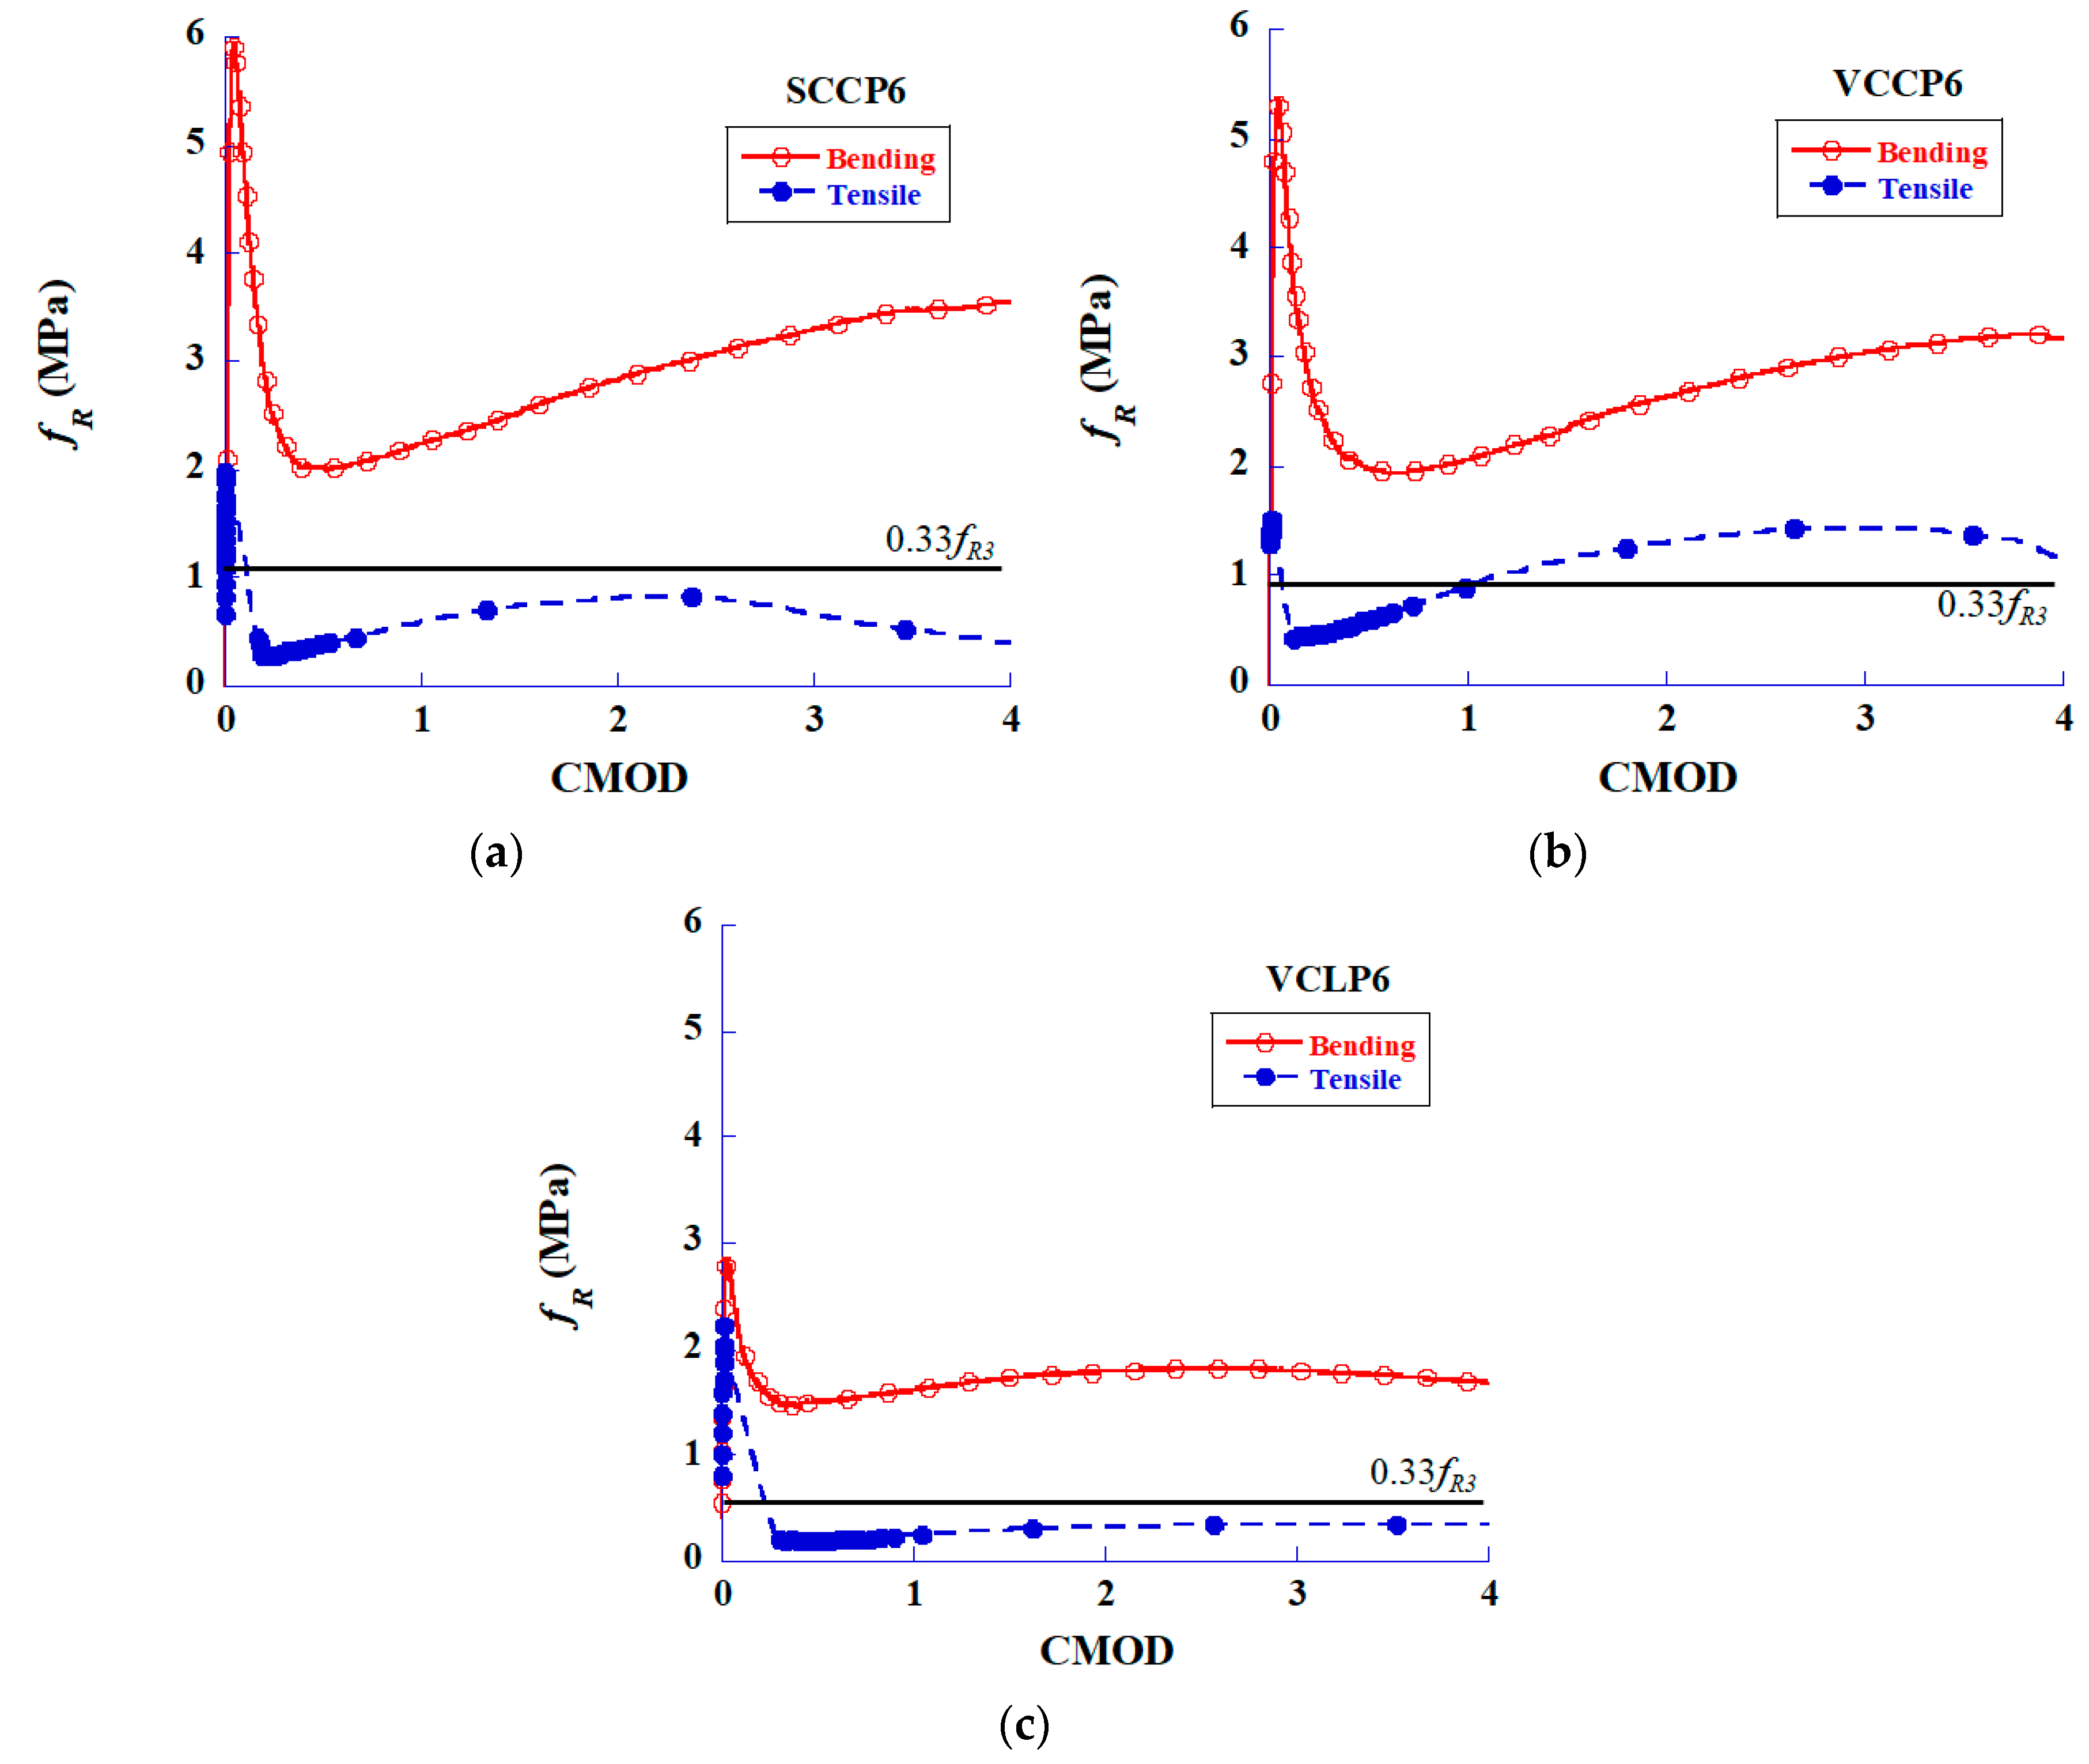
4.3. Comparison of Bending and Tensile Test
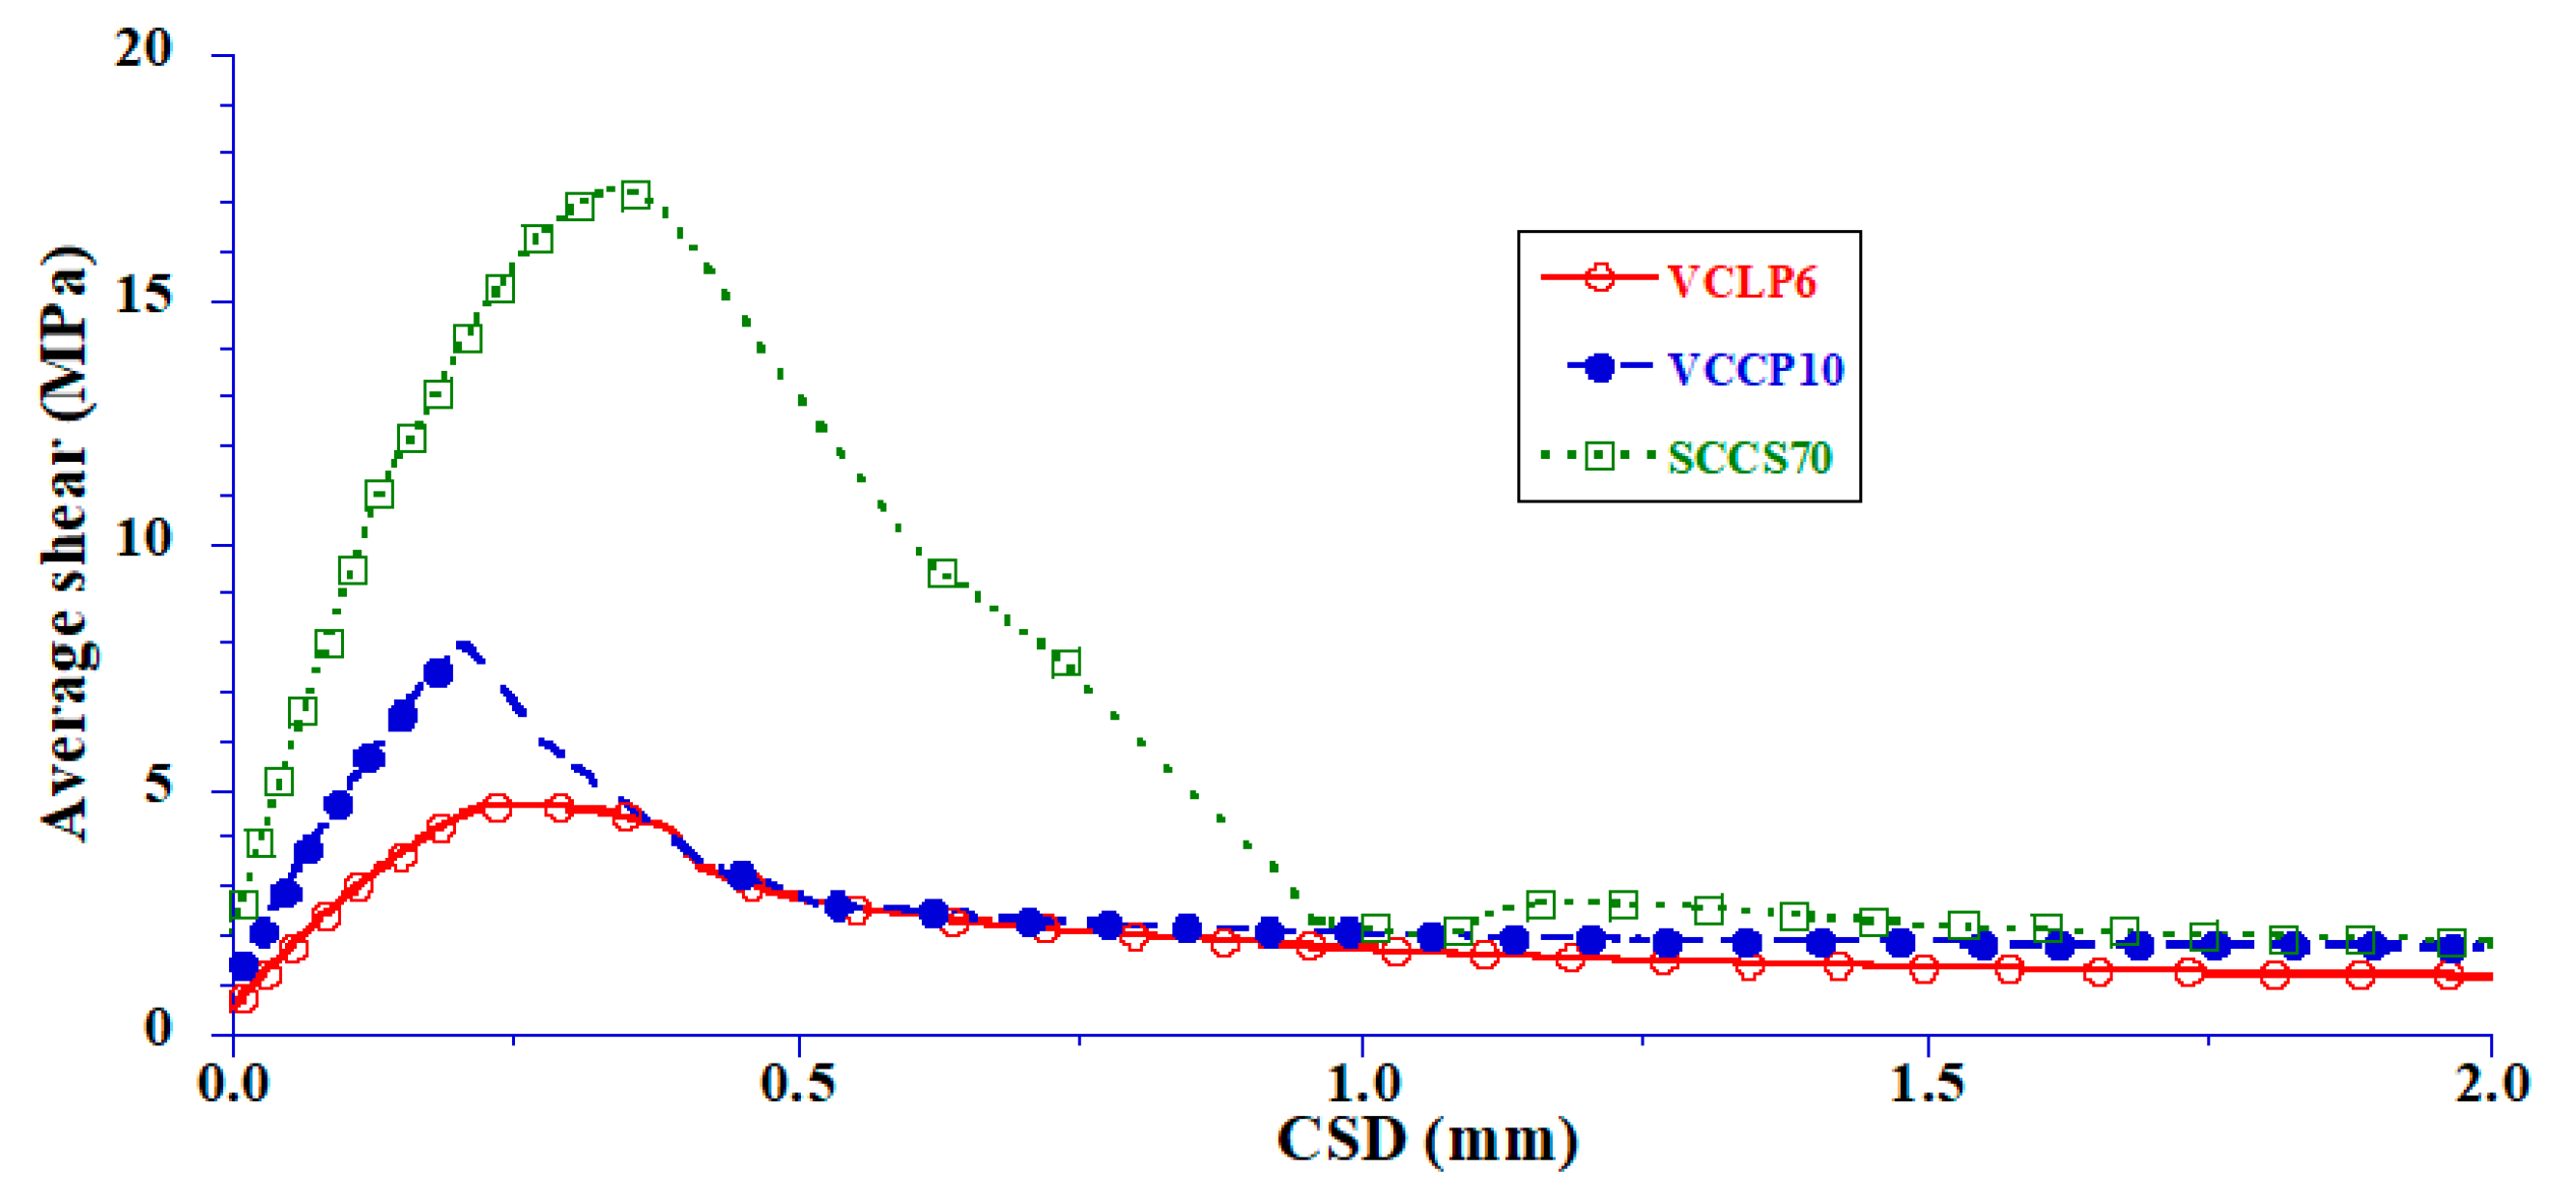
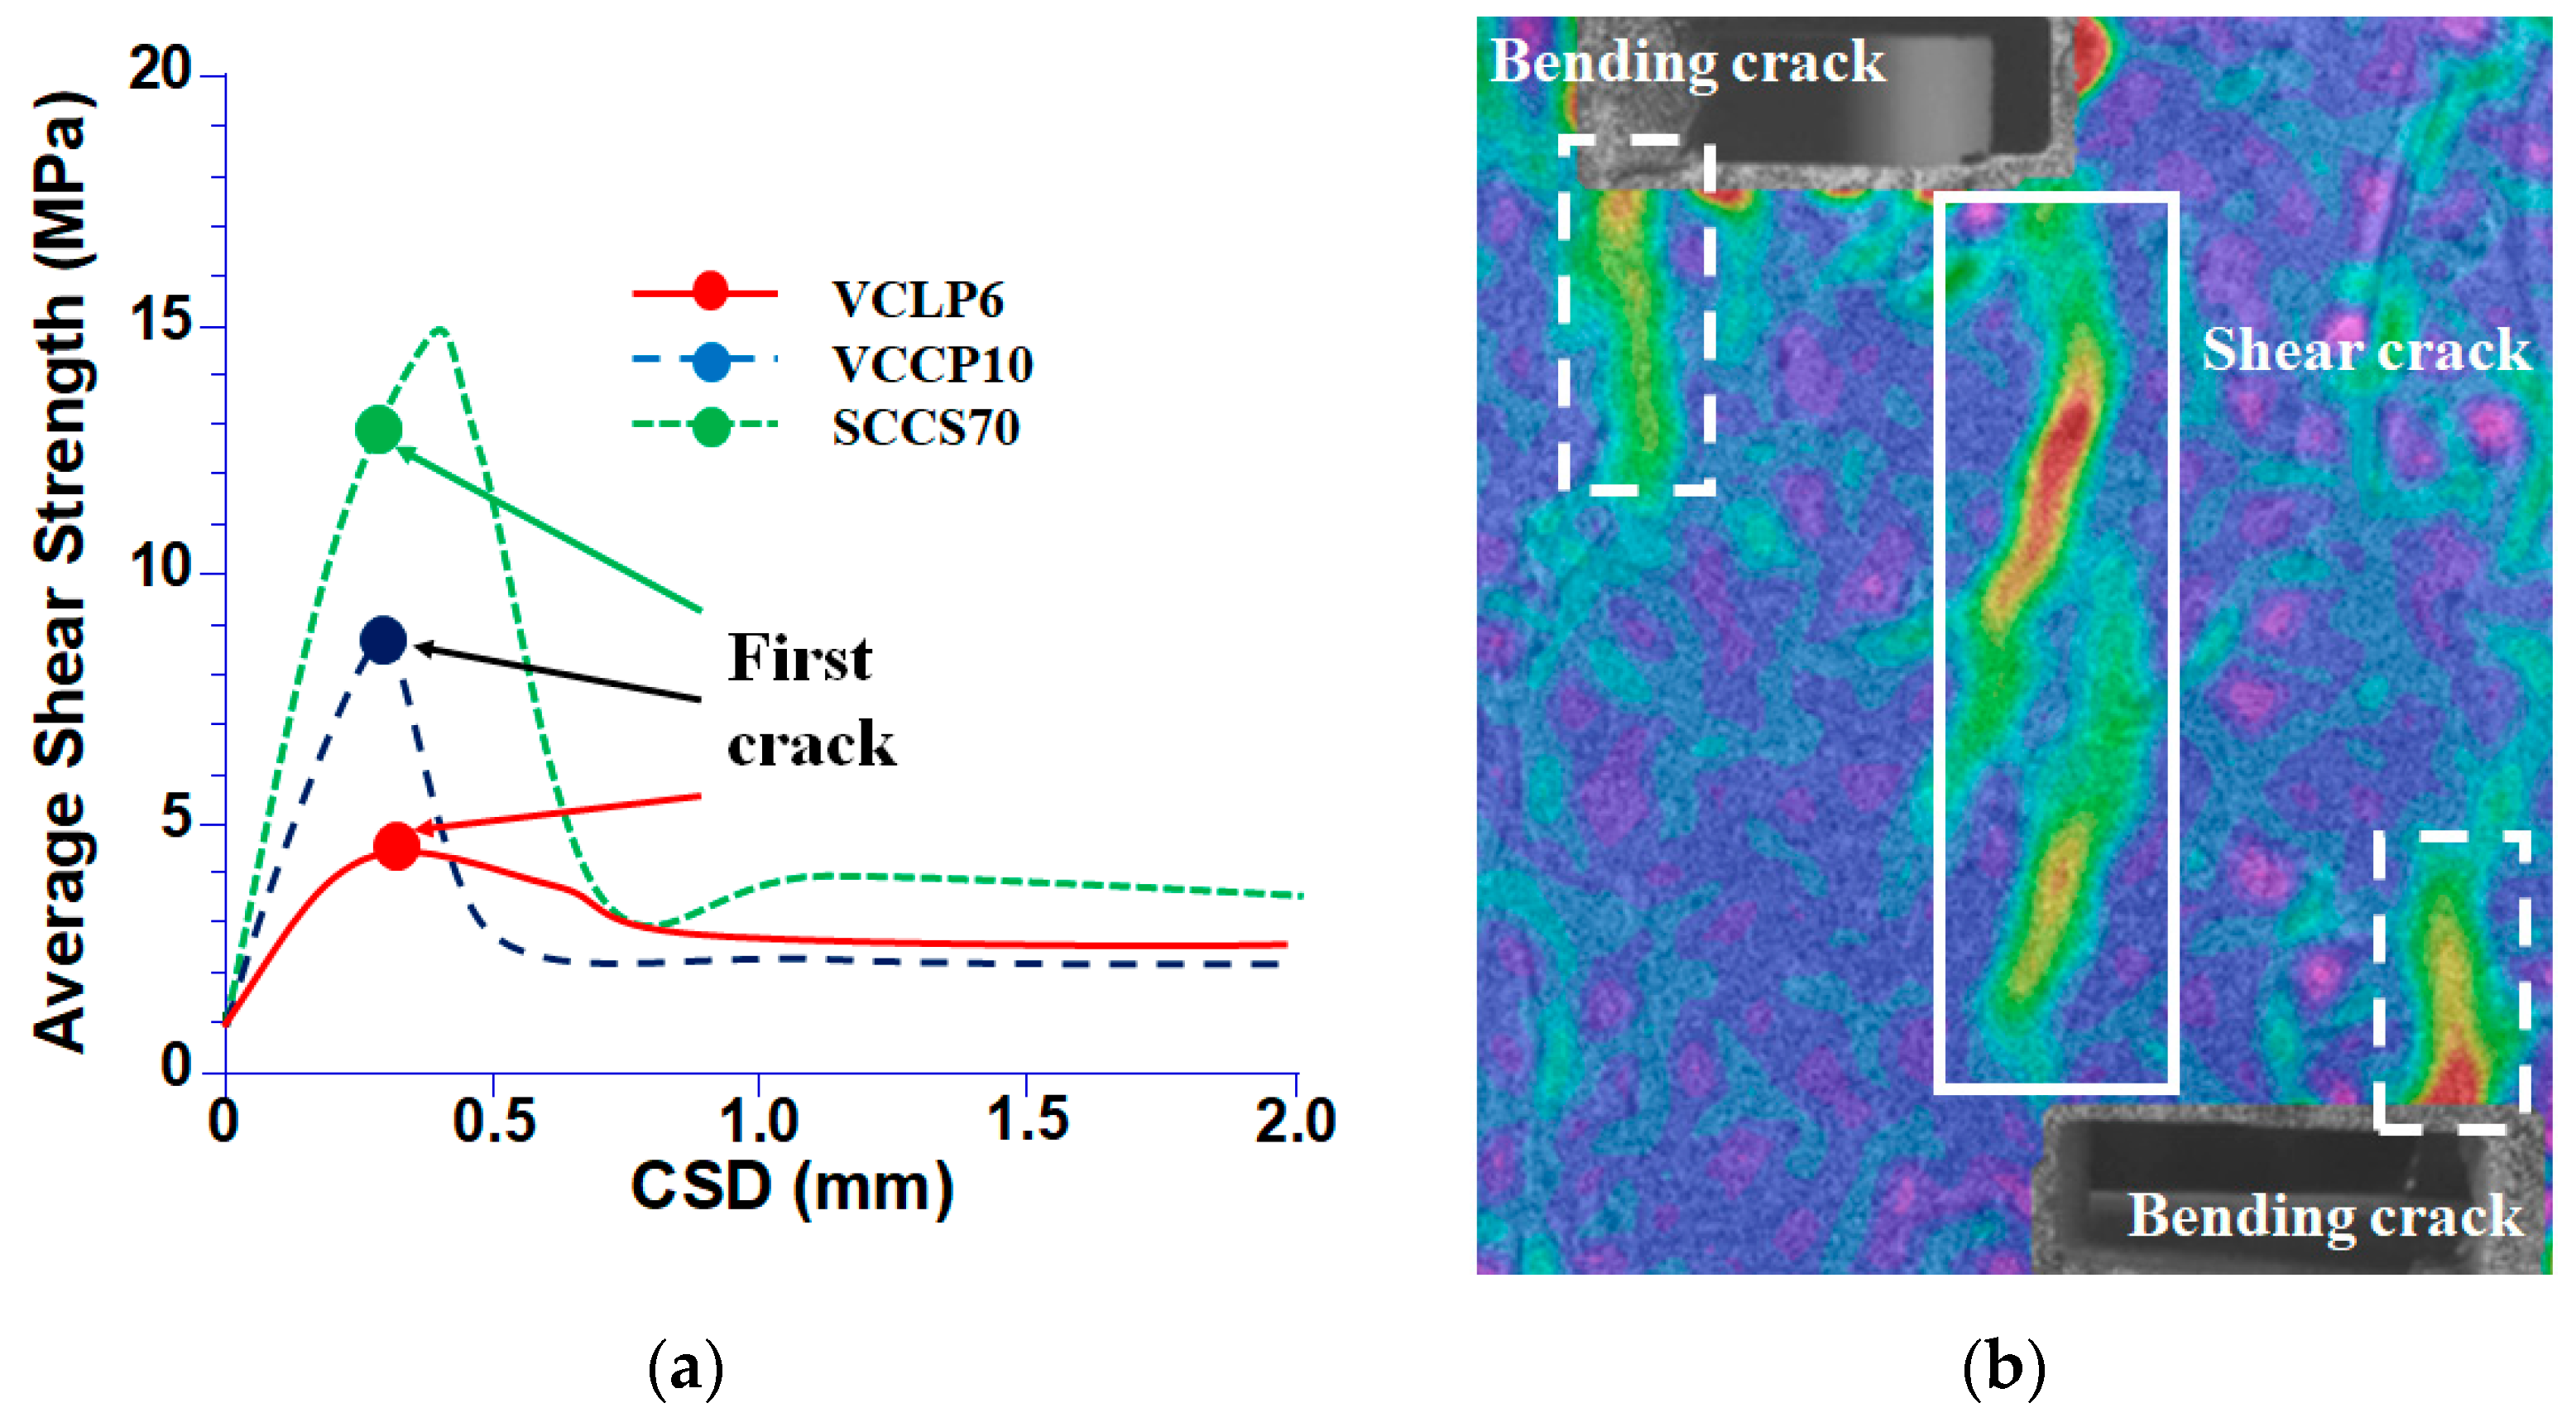
4.4. Push-Off Shear Tests
5. Conclusions
Author Contributions
Funding
Acknowledgments
Conflicts of Interest
References
- Banthia, N.; Sheng, J. Fracture toughness of micro-fiber reinforced cement composites. Cem. Concr. Compos. 1996, 18, 251–269. [Google Scholar] [CrossRef]
- Grünewald, S.; Laranjeira, F.; Walraven, J.; Aguado, A.; Molins, C. Improved tensile performance with fiber reinforced self-compacting concrete. High Perform. Fiber Reinf. Cem. Compos. 2012, 6, 51–58. [Google Scholar]
- Blanco, A.; Pujadas, P.; De La Fuente, A.; Cavalaro, S.; Aguado, A. Application of constitutive models in European codes to RC–FRC. Constr. Build. Mater. 2013, 40, 246–259. [Google Scholar] [CrossRef]
- Serna, P.; Arango, S.; Ribeiro, T.; Núñez, A.; Garcia-Taenguam, E. Structural cast-in-place SFRC: Technology, control criteria and recent applications in Spain. Mater. Struct. 2009, 42, 1233–1246. [Google Scholar] [CrossRef]
- Alberti, M.G.; Enfedaque, A.; Gálvez, J.C.; Pinillos, L. Structural Cast-in-Place Application of Polyolefin Fiber–Reinforced Concrete in a Water Pipeline Supporting Elements. J. Pipeline Syst. Eng. Pract. 2017, 8, 05017002. [Google Scholar] [CrossRef]
- Serna, P.; López, J.Á.; Coll, H.; Camacho, E.; Navarro-Gregori, J.; Galán, F. Pasarela de hormigón de muy alto rendimiento sobre el Barranco de las Ovejas (Alicante). Hormigón y Acero 2015, 66, 23–42. [Google Scholar] [CrossRef][Green Version]
- Lancha, J. “FRC wind Towers”, in 2nd FRC International Workshop Fiber Reinforced Concrete: From design to Structural Applications. In Proceedings of the 1st ACI-FIB Joint Workshop, Montreal, QC, Canada, 24–25 July 2014. [Google Scholar]
- International Federation for Structural Concrete (fib). The fib Model Code for Concrete Structures 2010; Wiley Online Library: Hoboken, NJ, USA, 2013. [Google Scholar]
- American Concrete Institute. 544.3R-08: Guide for Specifying, Proportioning, and Production of Fiber-Reinforced Concrete; American Concrete Institute (ACI): Farmington Hills, MI, USA, 2008. [Google Scholar]
- Consiglio Nazionale delle Riserche, National Research Council-Advisory Committee on Technical Recommendations for Construction. Guide for the Design and Construction of Fibre-Reinforced Concrete Structures; SN: CNR-DT; Consiglio Nazionale delle Riserche, National Research Council-Advisory Committee on Technical Recommendations for Construction: Rome, Italy, 2006. [Google Scholar]
- DBV Merkblatt Stahlfaserbeton. Technologie des Stahlfaser-betons und Stahlfaserprit; Deutsche Beton Vereins: Heidelberg, Germany, 2001. [Google Scholar]
- Spanish Minister of Public Works. Spanish Structural Concrete Code EHE-08; Spanish Minister of Public Works: Madrid, Spain, 2008. [Google Scholar]
- Di Prisco, M.; Plizzari, G.; Vandewalle, L. Fibre reinforced concrete: New design perspectives. Mater. Struct. 2009, 42, 1261–1281. [Google Scholar] [CrossRef]
- Mirsayah, A.A.; Banthia, N. Shear strength of steel fiber-reinforced concrete. Mater. J. 2002, 99, 473–479. [Google Scholar]
- Cuenca, E.; Serna, P. Failure modes and shear design of prestressed hollow core slabs made of fiber-reinforced concrete. Compos. Part. B-Eng. 2013, 45, 952–964. [Google Scholar] [CrossRef]
- Ortiz Navas, F.; Navarro-Gregori, J.; Herdocia, G.L.; Serna, P.; Cuenca, E. An experimental study on the shear behaviour of reinforced concrete beams with macro-synthetic fibres. Constr. Build. Mater. 2018, 169, 888–899. [Google Scholar] [CrossRef]
- Cuenca, E.; Serna, P. Shear behavior of prestressed precast beams made of self-compacting fiber reinforced concrete. Constr. Build. Mater. 2013, 45, 145–156. [Google Scholar] [CrossRef]
- Aoude, H.; Belghiti, M.; Cook, W.D.; Mitchell, D. Response of Steel Fiber-Reinforced Concrete Beams with and without Stirrups. ACI Struct. J. 2012, 109, 359–368. [Google Scholar]
- Kwak, Y.K.; Eberhard, M.O.; Kim, W.S.; Kim, J. Shear strength of steel fiber-reinforced concrete beams without stirrups. ACI Struct. J. 2002, 99, 530–538. [Google Scholar]
- Minelli, F.; Conforti, A.; Cuenca, E.; Plizzari, G. Are steel fibres able to mitigate or eliminate size effect in shear? Mater. Struct. 2014, 47, 459–473. [Google Scholar] [CrossRef]
- Alberti, M.G.; Enfedaque, A.; Gálvez, J.C.; Picazo, Á. Recent advances in structural fibre-reinforced concrete focused on polyolefin-based macro-synthetic fibres. Mater. Constr. 2020, 70, e206. [Google Scholar] [CrossRef]
- Alberti, M.G.; Enfedaque, A.; Gálvez, J.C. On the mechanical properties and fracture behavior of polyolefin fiber-reinforced self-compacting concrete. Constr. Build. Mater. 2014, 55, 274–288. [Google Scholar] [CrossRef]
- C. European Committee for Standardization. Test. Method for Metallic Fiber Concrete. Measuring the Flexural Tensile Strength (Limit of Proportionality (LOP), Residual); EN14651:2005+A1; European Committee for Standardization: Bruxelles, Belgium, 2005. [Google Scholar]
- RILEM. Bending Test: Final Recommendations; RILEM TC-162-TDF. Mater. Struct. 2002, 35, 579–582. [Google Scholar]
- Picazo, A. Experimental and Numerical Study of the Shear Behaviour of Polyolefin and Steel Fiber Reinforced Concrete (in Spanish). Ph.D. Thesis, Universidad Politécnica Madrid, Madrid, Spain, 2020. [Google Scholar]
- Alberti, M.G.; Enfedaque, A.; Gálvez, J.C.; Reyes, E. Numerical modelling of the fracture of polyolefin fibre reinforced concrete by using a cohesive fracture approach. Compos. Part B-Eng. 2017, 111, 200–210. [Google Scholar] [CrossRef]
- .Rodriguez, I.; Rodríguez, I. Diseño y Caracterización de Hormigones Autocompactantes Reforzados Con Fibras de Acero. Master’s Thesis, Master Degree in Civil Engineering, Universidad Politecnica Madrid, Madrid, Spain, 2013. [Google Scholar]
- Alberti, M.G.; Enfedaque, A.; Gálvez, J.C.; Álvarez, C.; Picazo, Á. Moderate-strength concrete reinforced with polyolefin fibres: Considerations and design of a competitive structural concrete. DYNA 2020, 95, 322–326. [Google Scholar]
- Lecompte, D.; Smits, A.; Bossuyt, S.; Sol, H.; Vantomme, J.; Van Hemelrijck, D.; Habraken, A.M. Quality assessment of speckle patterns for digital image correlation. Opt. Lasers Eng. 2006, 44, 1132–1145. [Google Scholar] [CrossRef]
- Su, Y.; Zhang, Q. International Digital Imaging Correlation Society; Quality Assessment of Speckle Patterns by Estimating RMSE; Springer International Publishing: Cham, Switzerland, 2017; Chapter 17. [Google Scholar]
- Alam, S.; Loukili, A.; Grondin, F.; Rozière, E. Use of the digital image correlation and acoustic emission technique to study the effect of structural size on cracking of reinforced concrete. Eng. Fract. Mech. 2015, 143, 17–31. [Google Scholar] [CrossRef]
- Alberti, M.G.; Enfedaque, A.; Gálvez, J.C.; Agrawal, V. Fibre distribution and orientation of macro-synthetic polyolefin fibre reinforced concrete elements. Constr. Build. Mater. 2016, 122, 505–517. [Google Scholar] [CrossRef]
- Cintron, R.; Saouma, V. Strain Measurements with the Digital Image Correlation System Vic-2D; Document CU-NEES-08-06; University of Colorado: Boulder, CO, USA, 2008; Volume 23. [Google Scholar]
- Soetens, T.; Matthys, S. Shear-stress transfer across a crack in steel fibre-reinforced concrete. Cem. Concr. Compos. 2017, 82, 1–13. [Google Scholar] [CrossRef]
- Picazo, Á.; Gálvez, J.C.; Alberti, M.G.; Enfedaque, A. Assessment of the shear behaviour of polyolefin fibre reinforced concrete and verification by means of digital image correlation. Constr. Build. Mater. 2018, 181, 565–578. [Google Scholar] [CrossRef]
- Walraven, J.C. Aggregate Interlock: A Theoretical and Experimental Analysis. Ph.D. Thesis, Delft University Press, Delft, The Netherlands, 1980. [Google Scholar]
- Fardis, M.N.; Buyukozturk, O. Shear transfer model for reinforced concrete. J. Eng. Mech. 1979, 105, 255–275. [Google Scholar]


| Materials | SCCP6 | VCCP6 | VCLP6 | VCCP10 | SCCS70 |
|---|---|---|---|---|---|
| Cement 52.5 | 375 | 375 | -- | 375 | 425 |
| Cement 32.5 | -- | -- | 312 | -- | -- |
| Water | 188 | 188 | 216 | 188 | 199 |
| w/c | 0.50 | 0.50 | 0.69 | 0.50 | 0.47 |
| Sand | 918 | 916 | 875 | 916 | 947 |
| Grit | 245 | 300 | 198 | 300 | -- |
| Gravel | 367 | 450 | 519 | 450 | 486 |
| Limestone | 200 | 100 | -- | 100 | 210 |
| Superplasticizer | 4.7 | 2.8 | -- | 3.1 | 5.6 |
| Fiber P48 (Vf%) | -- | -- | 0.66 | -- | -- |
| Fiber P60 (Vf %) | 0.66 | 0.66 | -- | 1.10 | -- |
| Fiber S35 (Vf %) | -- | -- | -- | -- | 0.44 |
| Fiber S50 (Vf %) | -- | -- | -- | -- | 0.44 |
| Compacting | Self-compacting | Vibrated conventional | Vibrated conventional | Vibrated conventional | Self-compacting |
| P48 | P60 | S35 | S50 | |
|---|---|---|---|---|
| Density (g/cm3) | 0.91 | 0.91 | 7.85 | 7.85 |
| Length (mm) | 48 | 60 | 35 | 50 |
| Eq. Ø (mm) | 0.903 | 0.903 | 0.550 | 0.600 |
| Aspect ratio (L/D) | 53 | 66 | 64 | 83 |
| Tensile strength (MPa) | >400 | >500 | 1100 | 1100 |
| Modulus of elasticity (GPa) | >6 | >9 | 210 | 210 |
| Fibers per kg | 32,895 | 27,000 | 14,500 | 8500 |
| Surface structure | Rough | Rough | Smooth | Smooth |
| Step | 1 | 2 | 3 | 4 | 5 | 6 | 7 | 8 | 9 | 10 |
|---|---|---|---|---|---|---|---|---|---|---|
| Rate (mm/s) | 0.005 | 0.006 | 0.007 | 0.008 | 0.009 | 0.010 | 0.020 | 0.040 | 0.080 | 0.160 |
| Displacement (mm) | 10 | 0.1 | 0.1 | 0.1 | 0.1 | 0.1 | 0.1 | 0.1 | 0.1 | 30 |
| Concrete Type | MC-2010 | EHE-08 | CSD 2.5 mm | CSD 0.5 mm |
|---|---|---|---|---|
| VCLP6 | 100.00% (0.19) | 92.98% (0.19) | 74.94% (0.14) | 200.33% (0.09) |
| VCCP10 | 100.00% (0.11) | 99.92% (0.11) | 97.47% (0.07) | 161.11% (0.01) |
| SCCS70 | 100.00% (0.13) | 132.37% (0.13) | 60.56% (0.09) | 491.27% (0.04) |
© 2020 by the authors. Licensee MDPI, Basel, Switzerland. This article is an open access article distributed under the terms and conditions of the Creative Commons Attribution (CC BY) license (http://creativecommons.org/licenses/by/4.0/).
Share and Cite
Alberti, M.G.; Picazo, Á.; Gálvez, J.C.; Enfedaque, A. New Methodological Approach towards a Complete Characterization of Structural Fiber Reinforced Concrete by Means of Mechanical Testing Procedures. Appl. Sci. 2020, 10, 4811. https://doi.org/10.3390/app10144811
Alberti MG, Picazo Á, Gálvez JC, Enfedaque A. New Methodological Approach towards a Complete Characterization of Structural Fiber Reinforced Concrete by Means of Mechanical Testing Procedures. Applied Sciences. 2020; 10(14):4811. https://doi.org/10.3390/app10144811
Chicago/Turabian StyleAlberti, Marcos G., Álvaro Picazo, Jaime C. Gálvez, and Alejandro Enfedaque. 2020. "New Methodological Approach towards a Complete Characterization of Structural Fiber Reinforced Concrete by Means of Mechanical Testing Procedures" Applied Sciences 10, no. 14: 4811. https://doi.org/10.3390/app10144811
APA StyleAlberti, M. G., Picazo, Á., Gálvez, J. C., & Enfedaque, A. (2020). New Methodological Approach towards a Complete Characterization of Structural Fiber Reinforced Concrete by Means of Mechanical Testing Procedures. Applied Sciences, 10(14), 4811. https://doi.org/10.3390/app10144811