Article

Effect of Strain Hardening on Increase in Collapse Pressure during the Manufacture of ERW Pipe

1
Department of Infrastructure Safety Research, Korea Institute of Civil Engineering and Building Technology, Gyeonggi-do 10223, Korea
2
Department of Civil and Environmental Engineering, Hannam University, Daejeon 34430, Korea
3
Department of Civil and Environmental Engineering, Seoul National University, Seoul 08826, Korea
4
Institute of Construction and Environmental Engineering, Seoul National University, Seoul 08826, Korea
5
Steel Structure Research Group, POSCO, Incheon 21985, Korea
*
Author to whom correspondence should be addressed.
Appl. Sci. 2020, 10(14), 5005; https://doi.org/10.3390/app10145005
Submission received: 17 June 2020 / Revised: 19 July 2020 / Accepted: 20 July 2020 / Published: 21 July 2020
(This article belongs to the Special Issue Advances on Structural Engineering)

Abstract

:
Plastic deformation during the manufacture process of electric resistance welded (ERW) pipe determines the stress–strain relationship of the steel pipe, which affects the collapse pressure of offshore pipelines. To track the deformation history of the pipe, the entire process was simulated via finite element analysis using a solid element. A material model that considered both the Bauschinger effect and strain hardening was adopted. Various sizes of pipe cross-sections were simulated. As greater compression was applied during the sizing process, the strain hardening effect became more significant, so that the compressive yield strength was increased in the circumferential direction. The strain hardening effect was most prominent for a smaller diameter-to-thickness ratio (D/t), so that an increase in the collapse pressure could be obtained with a larger sizing ratio. Therefore, current design criteria for the collapse pressure recommended by Det Norske Verita (DNV) and API could be enhanced for a smaller D/t to consider the strain hardening effect during the sizing process.

1. Introduction

Electric resistance welded (ERW) pipes have excellent productivity and economic efficiency because they are manufactured in a single continuous process from beginning to end. Thus, demand has increased for ERW pipes as the material of choice for deep-water offshore pipelines [1,2,3]. Due to extremely high pressure in deep-water applications, the collapse pressure governs the design of offshore pipelines. Since ERW pipes are manufactured via a cold-forming process, variation in the material properties of the ERW pipes due to plastic deformation is an important factor for evaluating the collapse pressure. The nature of the continuous manufacture process of ERW pipes, however, creates difficulties in tracking the plastic deformation [4].
The manufacture process of an ERW pipe generally involves the sequences of leveling, breakdown, finpass, welding, and sizing. In the leveling process, the coil supplied from the steel mill is uncoiled, and the uncoiled steel plate simultaneously passes through a breakdown roller to form both sides of the steel plate. In the finpass process, the curvature of the plate becomes constant while the cross-section is formed into a circular shape. The welding surfaces are brought into contact with the fin of the roller to increase the quality of the welding surfaces before the welding. During this process, there is compression in the circumferential direction of the pipe. During welding, both surfaces are welded by a high frequency current and are bounded by a physical external pressure as they pass through the squeezing roller. Finally, the pipe passes through sizing rollers to improve the out-of-roundness of the cross-section by compressing the steel pipe circumferentially to match the final target diameter.
During manufacture, plastic deformation is governed by the Bauschinger effect and strain hardening occurs with repeated cyclic loading [3,5,6,7]. Since this plastic deformation changes the yield strength of the steel plate, evaluation of the post-manufacture yield strength is essential to accurately determine the quality of the pipe. Recent studies on changes in the yield strength during manufacture have confirmed that changing the stress–strain curve by manipulating the compression during the sizing process increases the longitudinal tensile yield strength [6,7,8]. On the other hand, there are several limitations in evaluating yield strength in the circumferential direction. While a specimen can be extracted directly from the pipe to evaluate yield strength in the longitudinal direction, flattening is required in order to evaluate the yield strength in the circumferential direction. However, it is questionable whether the actual stress–strain curve in the circumferential direction of the pipe can be obtained because plastic deformation during the flattening process could have caused changes in the material properties [9,10]. Moreover, the flattening process is not standardized, which places limitations on compensating for the plastic deformation caused by the flattening when attempting to trace the steps that determine the yield strength of the pipe [10,11]. Repeated cyclic loading during cold forming creates differences between the tensile and compressive yield strengths in the circumferential direction. Therefore, the stress–strain curves in establishing the tensile and compressive stresses should be individually evaluated. Due to these limitations, it could be effective to derive a compressive stress–strain curve in the circumferential direction using finite element analysis.
Establishing the collapse pressure is essential for designing offshore pipelines, because this determines the buckling strength against external pressure, which is significantly influenced by the circumferential compressive stress–strain curve of the pipe [4]. A hardening of the stress–strain curve could increase the collapse pressure and affect the post-buckling behavior, but the effect of hardening depends on the slenderness of the pipe, which is the diameter-to-thickness ratio [12]. In the case of UOE pipes, which are manufactured by the sequential processes of U-forming, O-forming and expansion, compression could be used instead of expansion to accomplish the strain hardening effect at the end of the manufacture process [4,13]. Offshore Standard DNV-OS-F101 [11] also mentions the possibility that collapse pressure may increase when external cold compression is applied, but how much the collapse pressure could be increased is unclear.
Han et al. [3] conducted three-dimensional finite element analysis to simulate the actual manufacture of an ERW pipe and used the sizing portion of the process to evaluate the possibility of improving the collapse pressure. That study confirmed that improving the out-of-roundness of the cross-section via the sizing process leads to an increase in the collapse pressure. The roundness was affected by the compression rate during sizing, which is called the sizing ratio. However, the effect of residual stress was minor. In that study, a finite element model was established using a shell element for the initial part of the manufacture process and a solid element was used for the sizing portion of the process. Thus, deformation and residual stresses in the shell model were transferred to the solid element. Stress conditions and a deformed shape at the middle section of the shell model were mapped to the solid model. This led to a conservative evaluation of the collapse pressure.
The advantages of the external cold compression by sizing process on the collapse pressure of the ERW pipe was evaluated. To reflect the continuity of the ERW pipe manufacture process, the entire process was simulated using a single finite element model with a solid element. The analysis model incorporated the material model that included both the Bauschinger effect and strain hardening. Actual shapes of the rollers and the contact conditions between the roll and the steel plate were considered. That simulation resulted in modifications to the compressive stress–strain curve in the circumferential direction to accommodate various compression rates in the sizing process. Collapse pressure was evaluated by focusing on changes to the circumferential compressive stress–strain curve. In particular, the relationship between the collapse pressure and the sizing process was investigated with respect to the slenderness of the pipe. Moreover, the possibility of increasing the collapse strength of the ERW pipe by using the recommended current design standards was discussed.

2. Change in the Material Stress–Strain Curve during Manufacture

Prior to simulating the manufacture process, a material model that included the Bauschinger effect and strain hardening was established. The process used to manufacture the ERW pipe was simulated using commercial finite element analysis software, ABAQUS 2018 [14], to examine changes in the circumferential stress–strain curve due to the manufacture process.

2.1. Material Model

Simulation was performed using API-5L-X70 steel, which is a popular choice for steel pipes. During the manufacture process, repeated cyclic loadings between tension and compression creates kinematic and isotropic terms of hardening, which results in translation and expansion of the yield surface, respectively, and changes the stress–strain curve of a steel plate. The modified Chaboche model, which is suitable for the simulation of cyclic loading, was adopted [3,15]. The kinematic and isotropic hardenings of the yield surface are defined by the von Mises function as represented by Equation (1).
f = σ χ η
In Equation (1), σ is stress and χ and η are terms representing the kinematic and isotropic forms of hardening, respectively.
The kinematic and isotropic terms of hardening are defined by Equations (2) and (3), respectively.
χ = ± C γ + ( χ 0 C γ ) e x p ( γ | ε p ε p 0 | )
η = {   σ 0 + ( σ a σ 0 ) · ( 1 e x p ( b a p ) ) ,   p Δ ε p l a t e a u   ψ + Q · ( 1 e x p ( b p ) ) ,   p Δ ε p l a t e a u  
In Equations (2) and (3), C , γ , σ a ,   b a and ψ are the material hardening parameters. Q and σ 0 are the saturated isotropic hardening stress and the initial yield strength, respectively. ε p and   ε p 0 are the plastic strain and the plastic strain at the beginning of the manufacture process, respectively. Δ ε p l a t e a u is the length of the yield plateau. p is the accumulated plastic strain.
The kinematic and isotropic hardenings can be calculated by the strain that occurred during manufacture. The material model was calibrated by the stress–strain curve obtained from the tension–compression–tension cyclic loading test, as shown in Figure 1. The test was conducted for a dog bone specimen with a thickness of 10 mm. Maximum strains of ±2% were applied. The material model showed good agreement with the experimental result including the Bauschinger effect and strain hardening. The yield strength at an offset strain of 0.5% and the tensile strength of the tested specimen were 555 MPa and 620 MPa, respectively.

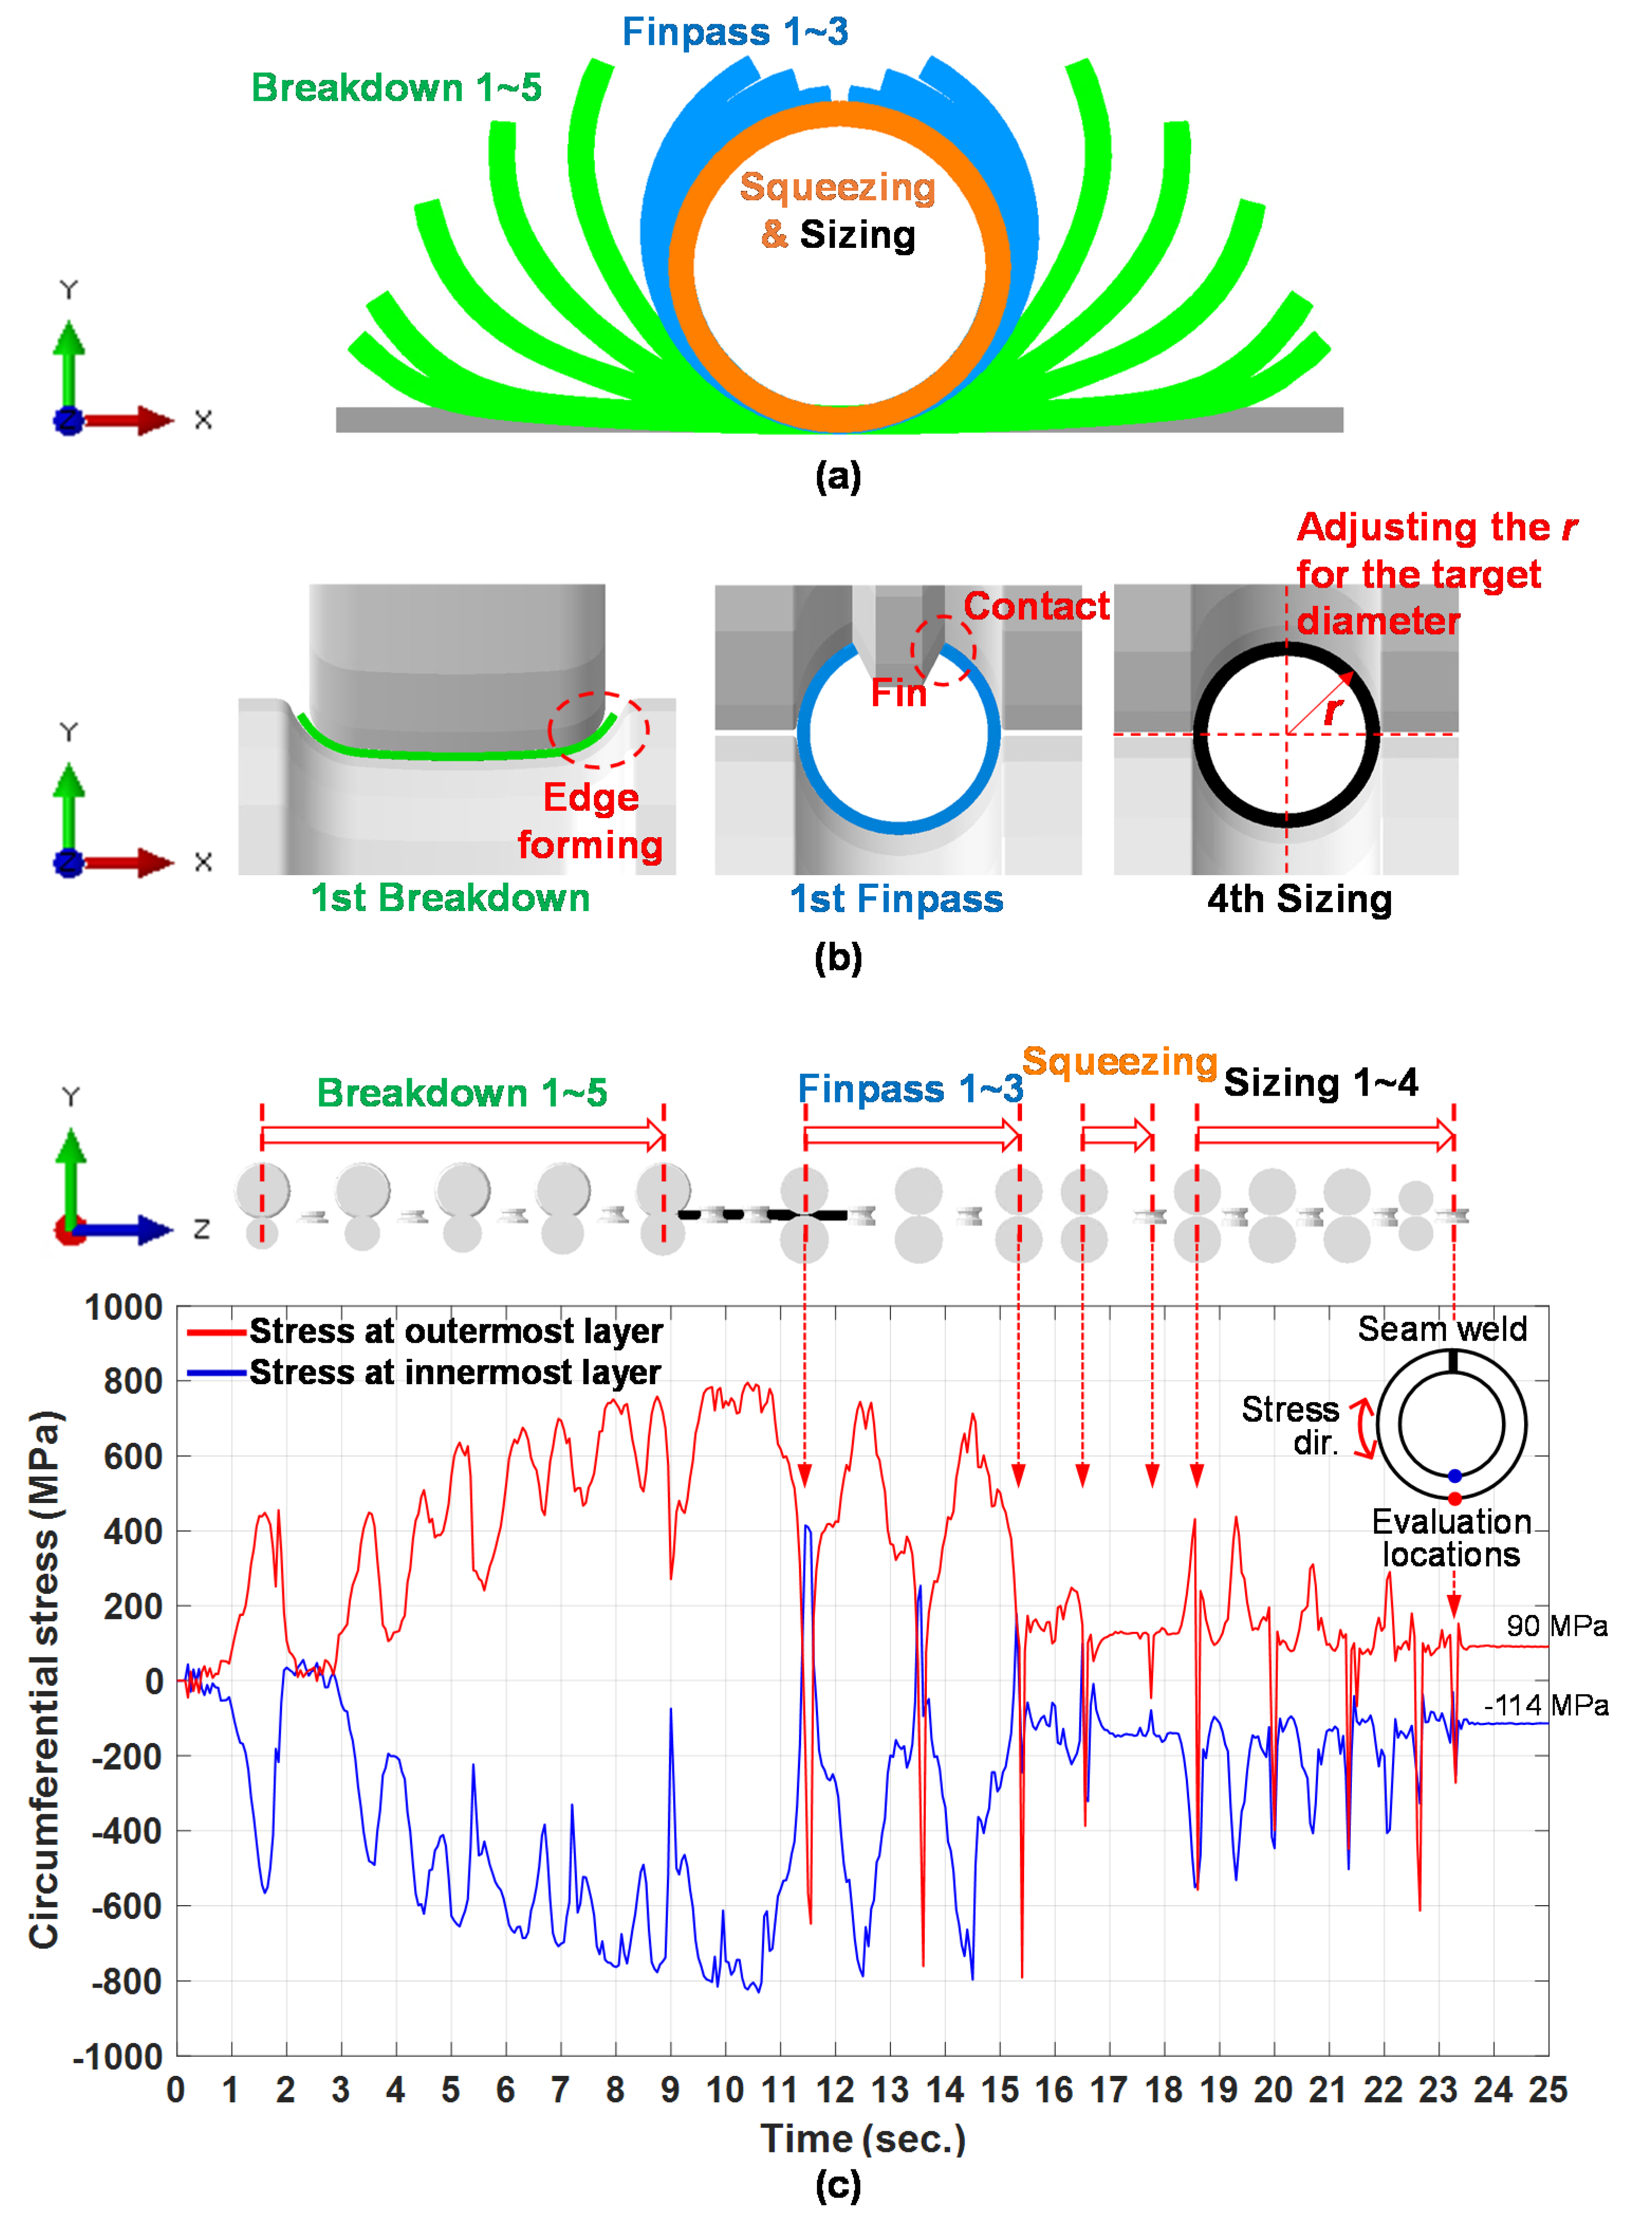
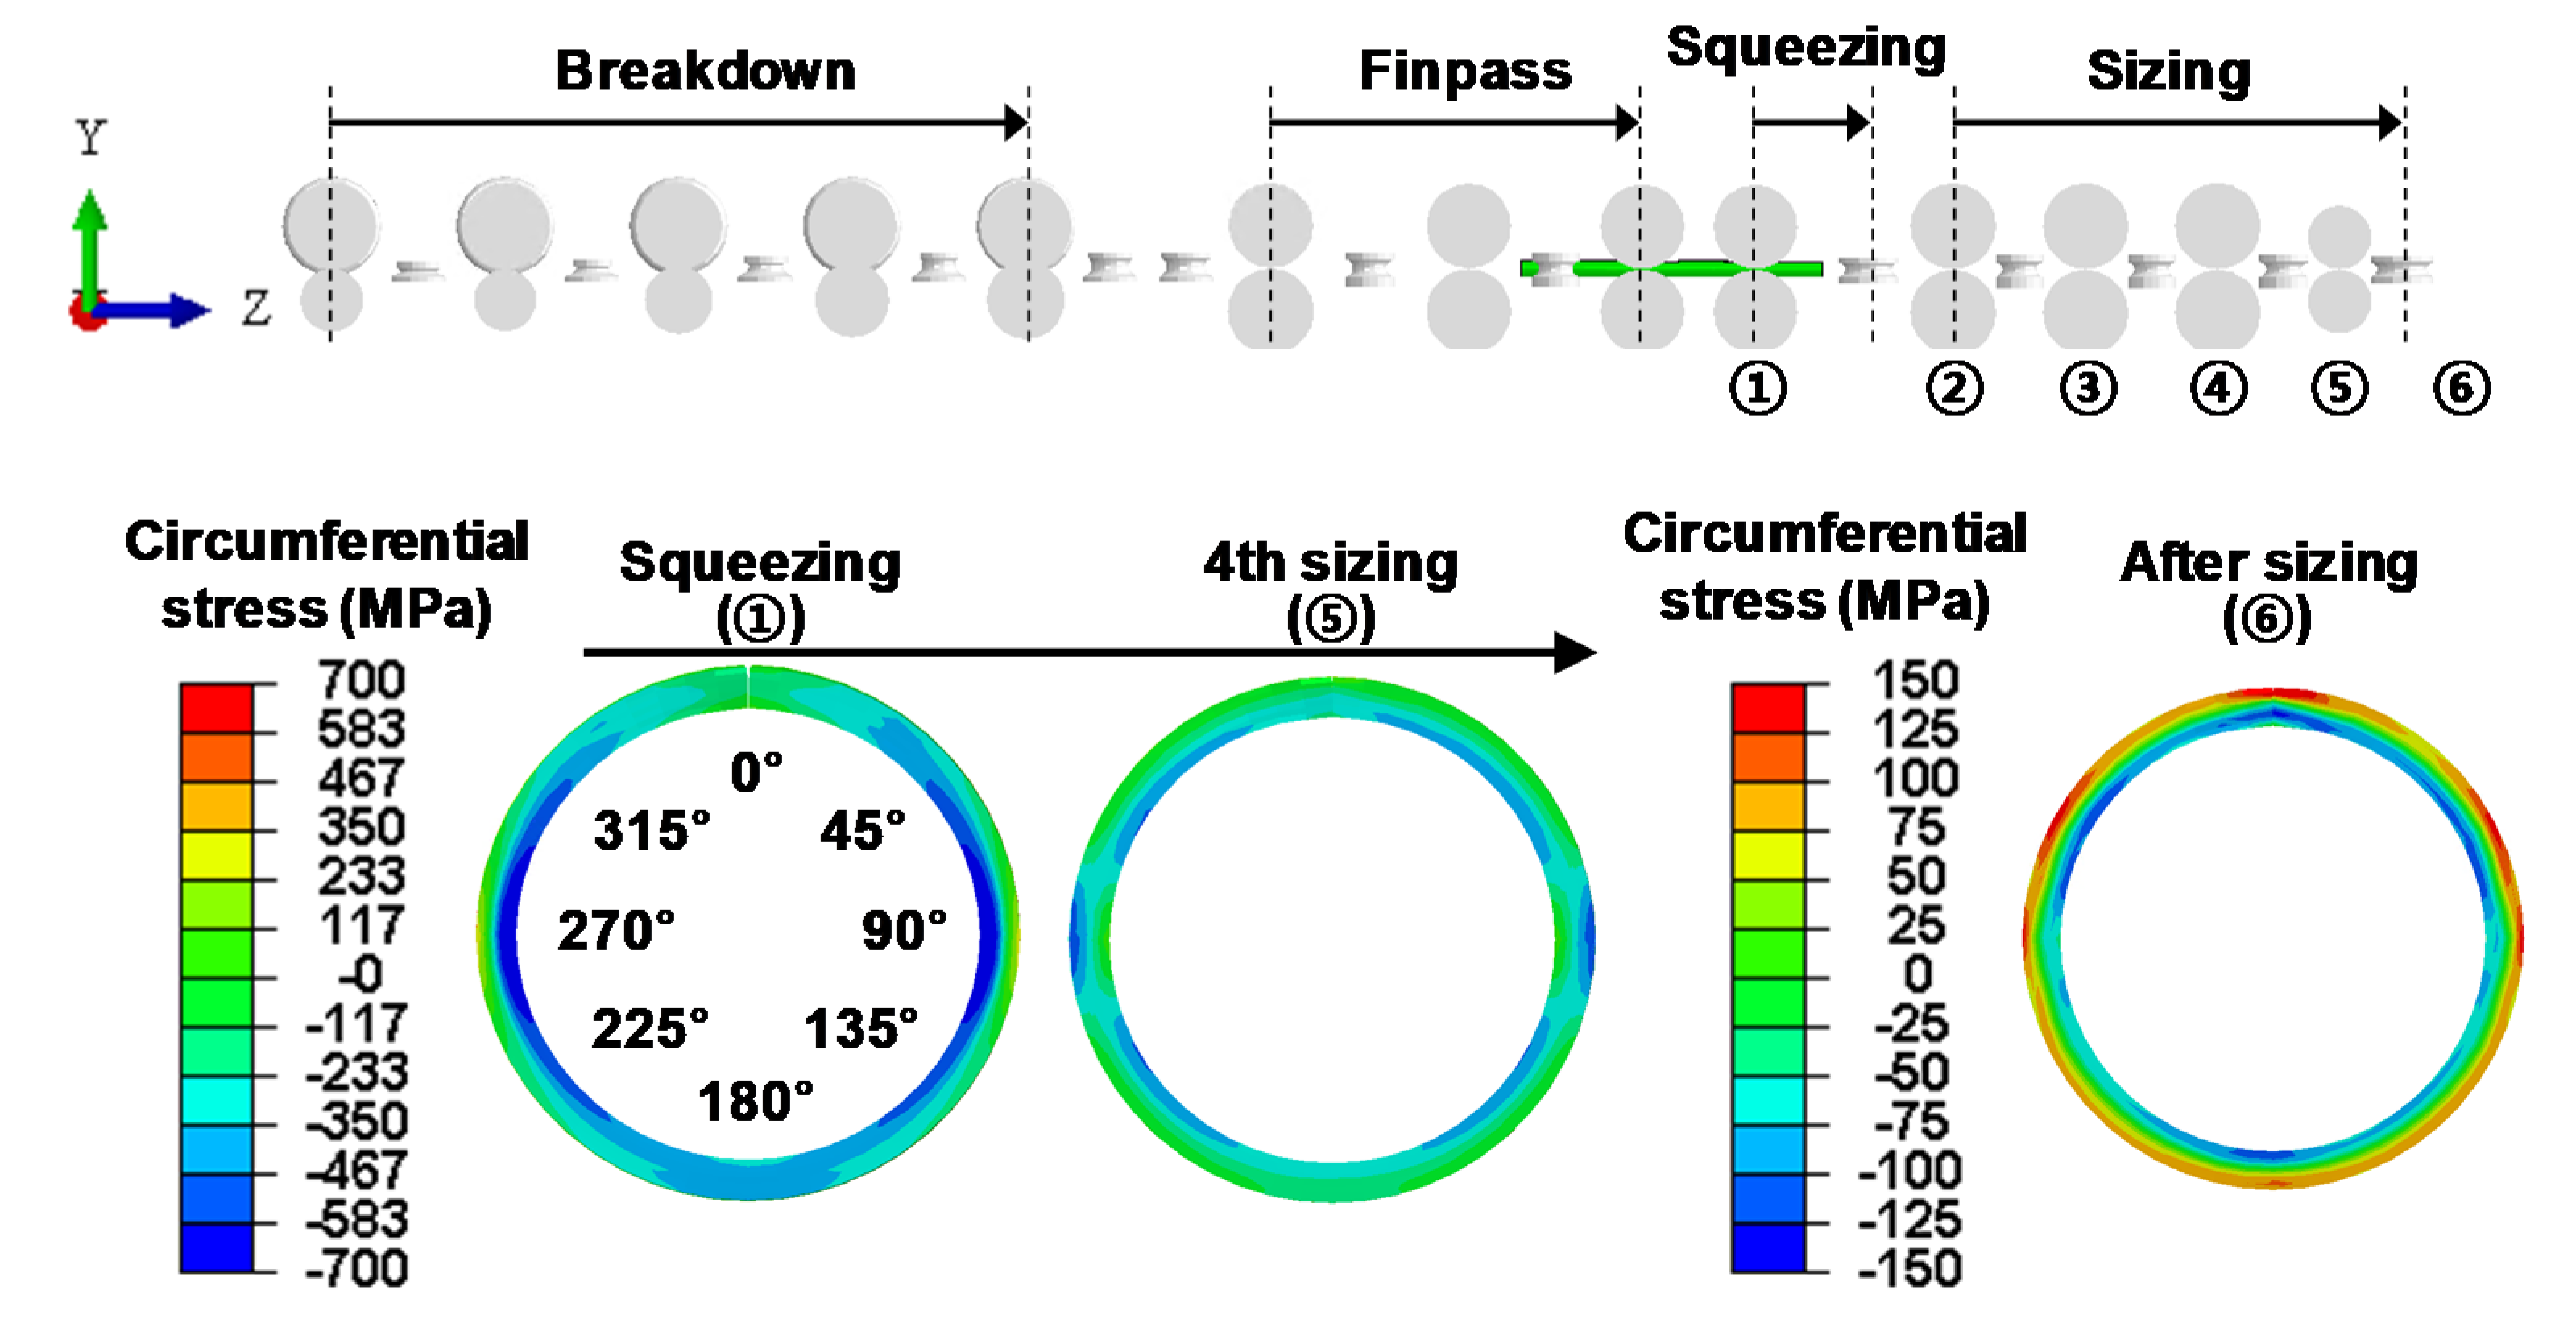
2.2. Simulation of the Manufacture Process for ERW Pipe

As shown in Figure 2, a three-dimensional finite element model was constructed to simulate the manufacture process from breakdown to sizing. The rollers were rigid, and the dimensions, arrangement and spacing of the rollers were determined based on the information obtained from the manufacturer. The specific information of the rollers provided by the company is confidential. The steel plate was modeled using an eight-node linear brick element with reduced integration, which is referred to as C3D8R in ABAQUS [14]. When uncoiled, the steel plates are much longer than their width. However, the length of the steel plate in the simulation was limited to seven times the width. Seven layers of elements were applied through the thickness direction, and 52 and 110 equally spaced elements were applied along the width and the length directions, respectively. Convergence testing confirmed that the number of elements in each direction was sufficient to provide converged stresses.
The ERW pipe is formed by passing a steel plate through the rollers in a fixed position. Numerical simulation, however, is conducted in the opposite way. Rigid rollers are passed over the steel plate to avoid any development of stresses caused by moving the steel plate. As shown in Figure 3, the front surface of the plate was constrained in the longitudinal direction, and movement in the transverse direction of the cross-section along the center line was also constrained. The roller was moved at a velocity of 30 m/min, which is within the range used in practice. Explicit dynamic analysis was performed using a time increment (Δt) of 2.0 × 10⁻⁶ s, which was confirmed by convergence testing.
During the simulation, as shown in Figure 4, two surfaces were tied together to simulate welding in the squeezing process. Neither separation nor slip occurred after the tying. Elastic friction was applied between the rollers and the steel plate. The friction coefficient was determined using various factors such as the roughness of the roller surface, the moving speed of the plate, and the type of lubricant. In this study, a friction coefficient of 0.15 was applied [16,17].

2.3. Results of Simulation

Simulation results for a 5.46 mm thick pipe with a diameter of 236 mm are shown in Figure 5. The width of the uncoiled steel plate was 220 mm. Figure 5a is a roll-flower that represents the gradual changes of the cross-section at the center of the plate along the longitudinal direction. Deformed shapes of the cross-section were captured when the cross-section passed the rollers.
Figure 5b shows a cross-section of the plate in contact with the roller to show the functions of each roller type. Since the squeezing process is similar to sizing, it was not shown in the figure. The manufacture process consists of 26 roller sets with each roller set composed of either upper and lower rollers or left and right rollers. The role of the upper and lower rollers is to form the plate, and the left and right rollers guide the movement of the plate between the upper and lower rollers. The breakdown process consisted of five sets of the upper and lower rollers. The width of the upper rollers was gradually decreased to form the plate from the edge to the center, as shown in Figure 5a. The finpass process consisted of three sets of upper and lower rollers. The plate was formed to achieve the curvature prior to welding by gradually reducing the size of the rollers and the width of the fin in the upper roller. The squeezing process was composed of one set of upper and lower rollers, and the welding surface was bonded. The sizing process consisted of four sets of upper and lower rollers, and the radii of the upper and lower rollers were adjusted to gradually decrease the outer diameter.
Figure 5c shows the stress history in the circumferential direction of the pipe at the opposite line of the seam weld. It was assumed that there was no initial residual stress on the plate since the circumferential stress applied by the leveling process would have been insignificant [5]. During the manufacture process, significant increases in, and releases of, stress occurred repeatedly when passing through each roller set. As the plate passed through the breakdown process, the edges of the plate formed first, and tensile and compressive stresses occurred at the outermost and innermost layers, respectively, due to bending. Residual stresses gradually increased as the process progressed. In the finpass process, the fins in the finpass rollers significantly compressed the steel plate in the circumferential direction developing reverse bending in the plate. Due to the reverse bending, the stress conditions were opposite in the innermost and outermost layers. After passing through each finpass roller set, the springback restored the stress conditions to compression in the innermost layer and tension in the outermost layer. Compression occurred in both the innermost and outermost layers when passing through the squeezing and sizing rollers. Since the welding surfaces of the plate were bonded, the fluctuation of the stress due to springback was relatively small, and the change in the residual stress before and after the sizing process was minimal.
Figure 6 shows the distribution of the circumferential stress during the squeezing and sizing processes. When the section was compressed by the rollers, the entire cross-section was mostly under compression. Significant compressive stress concentration was identified in some portions of the cross-section. The concentrated stress was spread out through the entire cross-section by stress redistribution after the last sizing roller, and the magnitude of the stress was reduced. Finally, compressive and tensile residual stresses remained in the inner and outer layers, respectively.
After sizing, both the tensile and compressive stresses were maximum at 0, 60 and 300 degrees from the seam weld. Stress at the opposite side of the seam weld is the next highest. According to API Specification 5L: Specification for line pipe [18], the yield strength of a steel pipe should be evaluated at least 90 degrees away from the seam weld. In addition, the yield strength is generally evaluated opposite the seam weld where the influence of the welding is minimal and the deformation history is most complex [13,15,19]. Therefore, evaluating stress and strains at the opposite side of the seam weld could be justified.
The stress–strain histories of the innermost and outermost layers were evaluated at the opposite line of the seam weld, as shown in Figure 7. During the breakdown process, the innermost and outermost layers showed compressive and tensile stress, respectively. On the other hand, during the finpass and sizing processes, both the innermost and outermost layers fluctuated between tension and compression, but mostly showed compression. In the finpass process, the state of loading–unloading–loading was repeated as the compressed outermost layer was tensioned by the springback right after passing through the finpass rollers. At this time, as shown in Figure 5, the direction of the stress was opposite on the innermost and outermost layers during cyclic loading, and stress migrated to the elastic region. In other words, during the finpass process, strain hardening and the Bauschinger effect occurred alternately at the innermost and outermost layers. During the sizing process, we compared the stress–strain histories of the two sizing ratios, which amounted to the changing rate of the outer diameter of the pipe before and after the sizing process, as follows.
S i z i n g   r a t i o = O u t e r   d i a m e t e r b e f o r e   s i z i n g O u t e r   d i a m e t e r a f t e r   s i z i n g O u t e r   d i a m e t e r b e f o r e   s i z i n g
When the sizing ratio was 0.1%, stresses at the innermost and outermost layers varied in the elastic region. When the sizing ratio was 1.0%, however, there was distinct compressive plastic deformation in both the innermost and outermost layers. Large amounts of compression occurred during the sizing process due to strain hardening, which resulted in the translation and expansion of the initial yield surface in the compression direction. Therefore, the compressive yield strength could be increased with sizing. The behavior was not observed for a sizing ratio of 0.1%, which suggests the effect is larger as the sizing ratio becomes greater.
As shown in Figure 8, the circumferential strain history during manufacture was plotted for each layer in the thickness direction. During the breakdown process, the deformation of the center layer (i.e., layer 4) was insignificant by pure bending, but the outer layers (i.e., layers 1–3) were tensioned and the inner layers (i.e., layers 5–7) were compressed. As Figure 7 shows, during the finpass process, the compression and tension on the inner and outer layers occurred in alternating fashion. Springback occurred immediately after passing through each finpass roller, and the farther from the center layer, the greater the fluctuation of the strain due to springback. In the squeezing and sizing processes, all layers were compressed, and the magnitude of the compression at each layer was similar. Following manufacture, we confirmed that the layers were compressed overall by the squeezing and sizing processes.

3. Evaluating Collapse Pressure

In this chapter, the effect of the sizing ratio on the collapse pressure of the ERW pipe was examined. Various sizes of the ERW pipes were considered. Variations in the strength of the compressive yield and in the out-of-roundness due to the changing sizing ratios were discussed. Moreover, the collapse pressure of the ERW pipe was compared with the design standards to evaluate the advantage of the sizing process.

3.1. Collapse Analysis after Manufacture

Collapse pressures were examined for pipes with various dimensions and sizing ratios. After simulating the manufacture process, new boundary conditions and external pressure was applied as is. Thus, the residual stress, deformed configuration and modified stress–strain curve after manufacture could be directly transferred. A pipe diameter four times longer than the length direction from both ends of the pipe was fixed in all directions, as shown in Figure 9a. Uniform external pressure was applied to the remaining part of the pipe, which was 14 times the diameter. According to Bastola et al. [20], collapse pressure is not affected by the boundary conditions if the minimum length of the pipe exposed to the external pressure is ten times that of the diameter. The deformed shape of the pipe and the stress contour shown in Figure 9a confirmed that the length of the pipe exposed to the uniform pressure was long enough not to have been affected by the boundary conditions. Modified Riks method was used to perform nonlinear analysis to consider negative stiffness after buckling [21].
As shown in Figure 9b, the stiffness of the pipe gradually decreased under the external pressure near the peak, and the displacement rapidly increased even though the external pressure decreased. Decreasing stiffness near the peak indicates the yielding of the pipe so that the collapse pressure could be influenced by the compressive stress–strain curve after the elastic region. Local buckling occurred when the maximum external pressure was applied. The maximum external pressure was defined as the collapse pressure. The stress distribution of the deformed configuration of a cross-section of the pipe, after collapse, is also shown in Figure 9a.

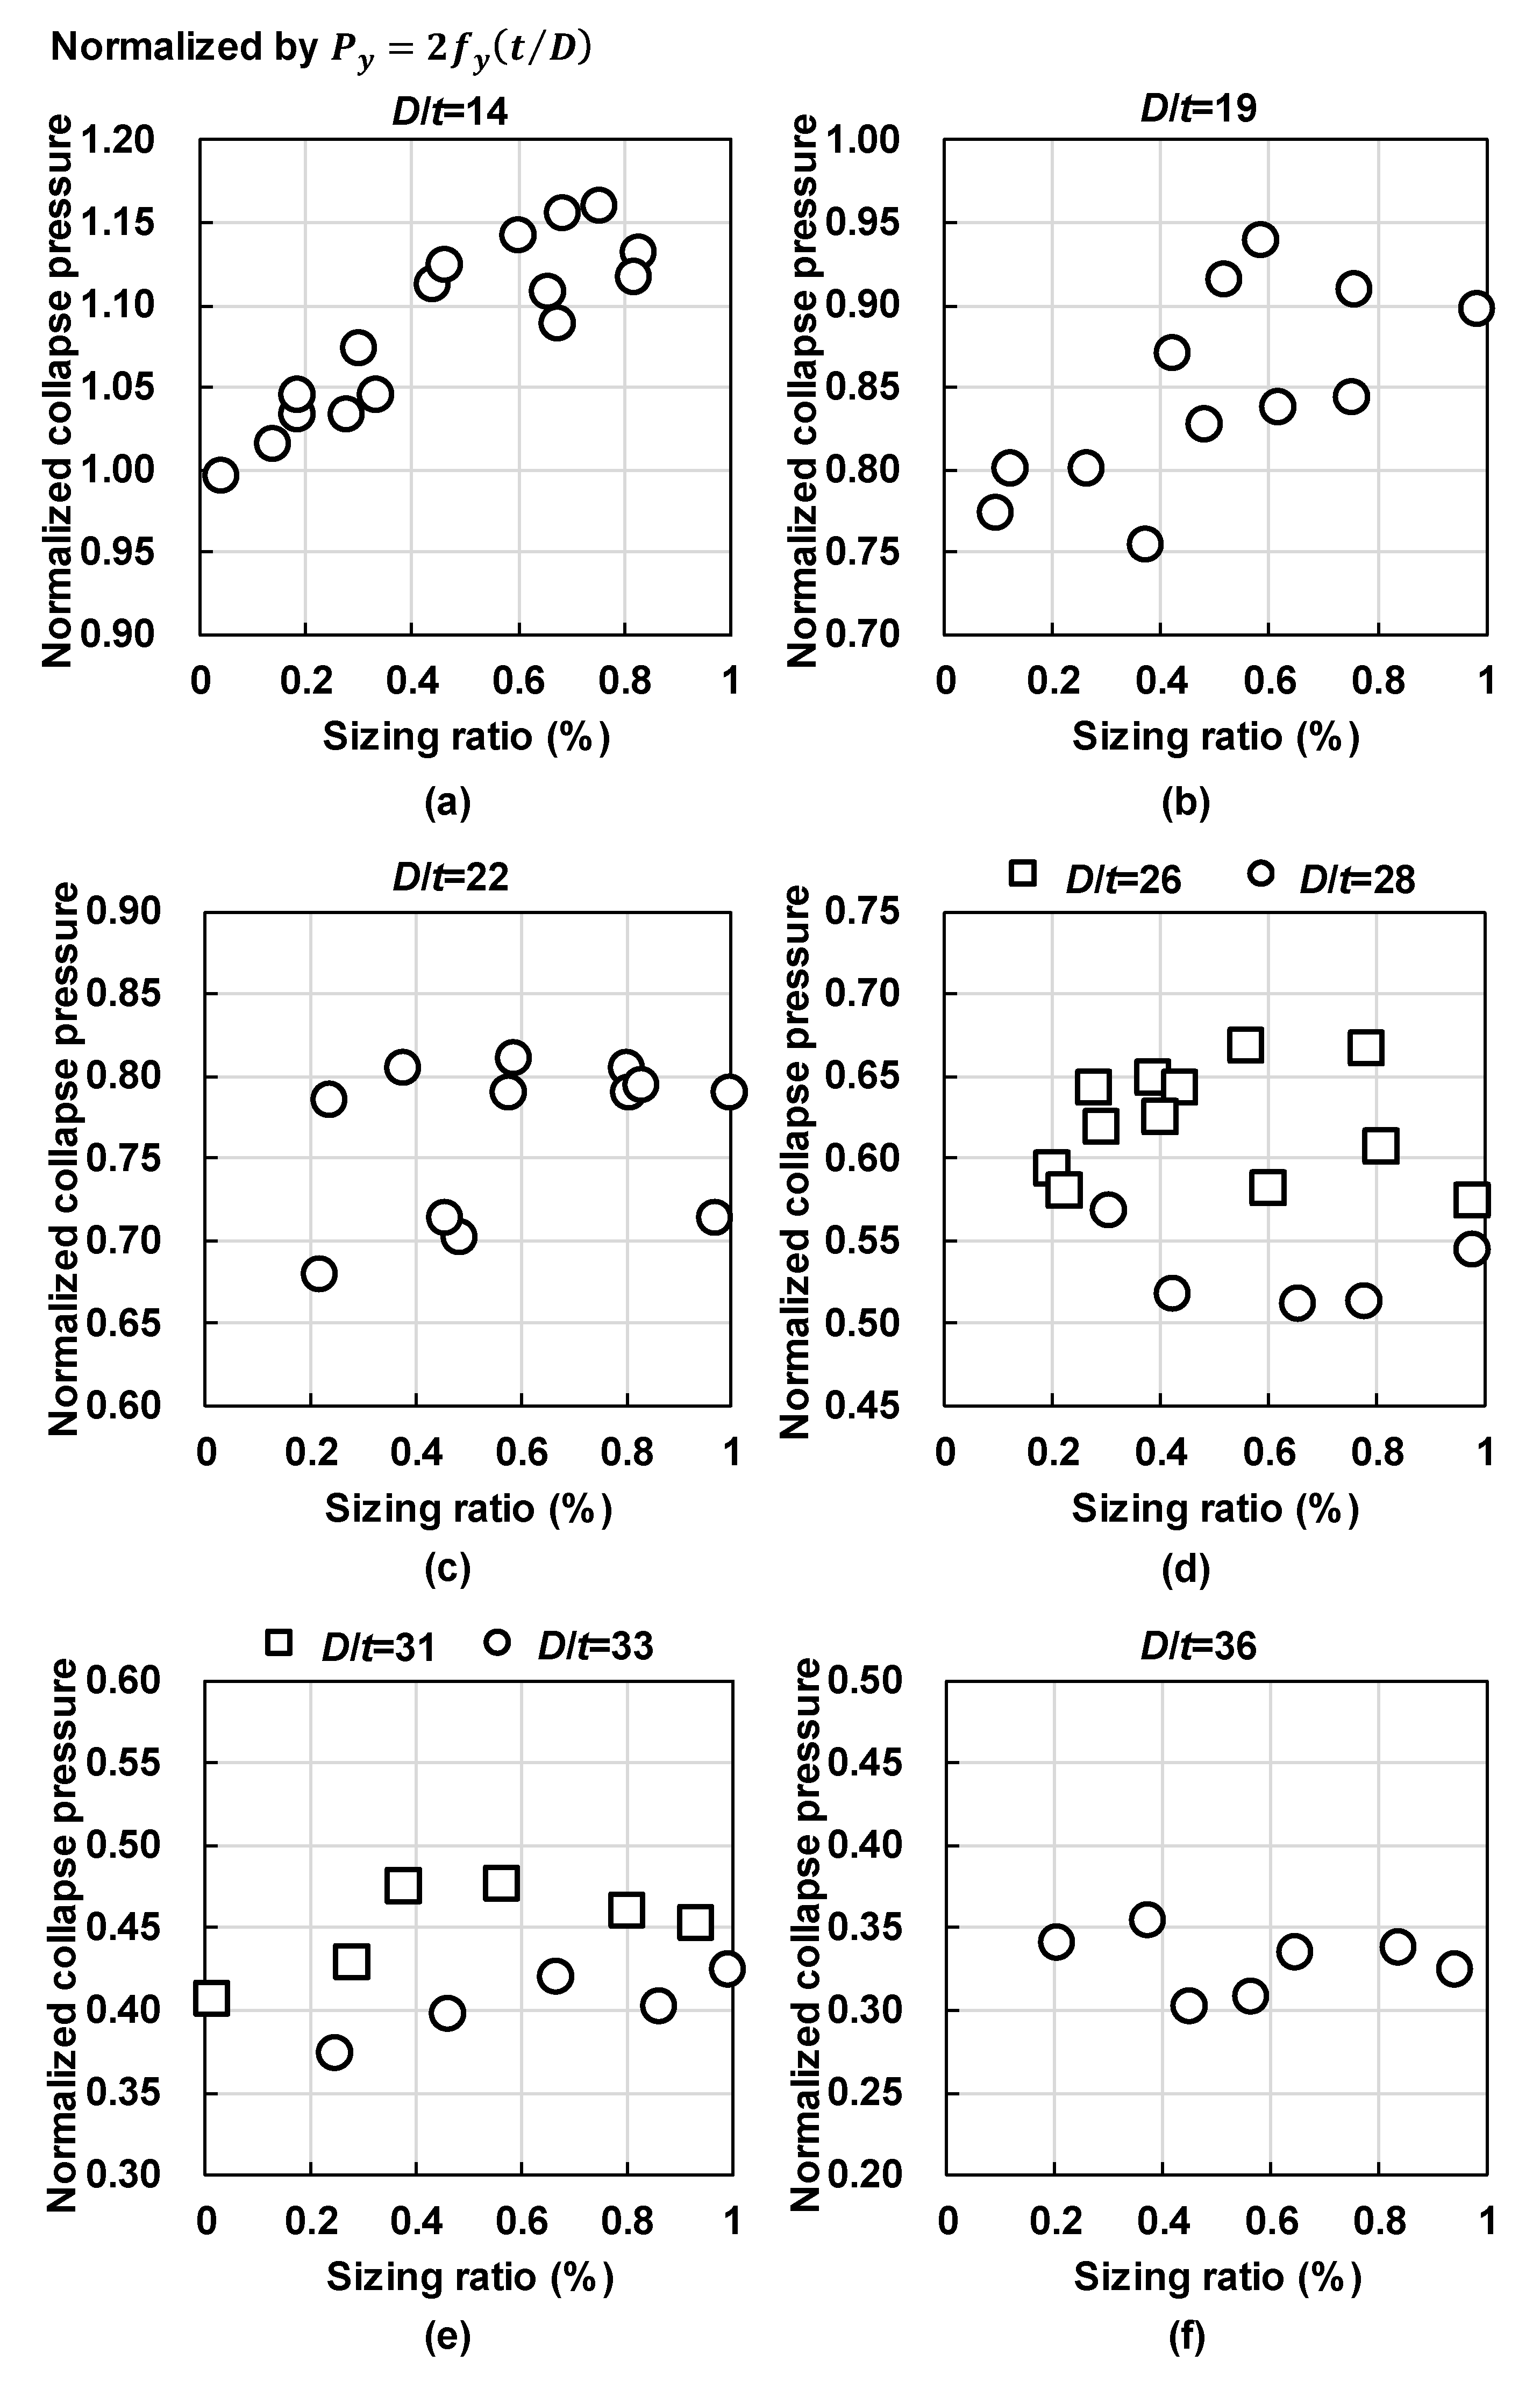
3.2. Effect of the Sizing Process

The effect of the sizing ratio on the collapse pressure of pipes with various sizes was compared, as shown Figure 10. The collapse pressure was normalized by the nominal yield strength and the diameter-to-thickness ratio (D/t). The maximum sizing ratio was approximately 1.0%, and the D/t ratio ranged from 14 to 36, which is commonly used in practice. The results clearly show that the collapse pressure was greater for a smaller D/t. Moreover, the correlation between the sizing ratio and the collapse pressure was more distinct for a smaller D/t. When the D/t was 14, the collapse pressure increased with an increase in the sizing ratio. An approximate 10 to 15% increase in the collapse pressure could be achieved with sizing ratios greater than 0.4%, because inelastic local buckling occurs for a smaller D/t so that the collapse pressure could be additionally affected by the plastic behavior of the material, as well as by the improved out-of-roundness of the cross-section. Han et al. [3] confirmed an improvement in out-of-roundness due to a larger sizing ratio. For a D/t greater than 22, there was no clear correlation between the sizing ratio and the collapse pressure. Dispersion of the collapse pressure became smaller with a greater D/t, because elastic local buckling was dominant for a larger D/t. Since improvement in the collapse pressure due to a larger sizing ratio was unclear, either the sizing process is unnecessary or only a smaller sizing ratio is needed for a D/t greater than 22.
As shown in Figure 11, the maximum strains that initiated collapse for various D/t ratios are marked on the stress–strain curves in the circumferential direction. The sizing ratios of all cases were approximately 1.0%. The results clearly show that the maximum strain at the point of collapse was greater for a smaller D/t. This observation indicates that a smaller D/t could withstand more strain energy because the collapse pressure is greater. When D/t is 31 or greater, the maximum strains were located before the yield plateau due to elastic buckling. Thus, the influence of the sizing was minor.

3.3. Factors That Improve the Collapse Pressure

The factors that increase the collapse pressure were analyzed for the pipe with a D/t of 14, and those factors were heavily influenced by the sizing ratio. To evaluate the plastic behavior of the material in the circumferential direction, a finite element model with a square cross-section was constructed to simulate a compression test, as shown in Figure 12a [22]. Residual stresses and modified stress–strain curves after manufacture were applied as an initial condition to maintain continuity of the analysis. Since the pipe had seven element layers in the thickness direction, the specimen model also had seven element layers to take into account the different plastic deformation histories in the thickness direction. The mapping length of the specimen was 1.4 times the width of the cross-section. If the length of the specimen was too long, a global buckling could occur before securing sufficient deformation to derive a stress–strain curve [4]. Convergence testing confirmed that the mesh size of the mapping region was constructed as 3640 elements divided into 10 and 52 equal parts along the width and length directions, respectively.
The difference between the stress–strain curves before and after manufacture was examined, as shown in Figure 12b. To evaluate the effect of the compression during the sizing process, sizing ratios of 0.1, 0.3, 0.7, and 1.0% were considered. The results showed that the slope of the strain hardening beyond the elastic region was increased following manufacture. Depending on the sizing ratio, however, there was a difference in the stress–strain curve in the vicinity of a 0.5% offset strain, which was the yield strength evaluation position suggested by API Specification 5L: Specification for line pipe [18]. When the sizing ratio was 0.1%, the Bauschinger effect appeared immediately after the elastic region due to the intense effect of the breakdown and to the finpass processes that caused compression and tension at the inner and outer layers, respectively. As the sizing ratio was increased, on the other hand, the Bauschinger effect disappeared, and the strain hardening showed an increased slope directly after the elastic region. Thus, the strength of the compressive yield became greater as the sizing ratio increased. This is because the yield surface was gradually moved and expanded in the compressive direction by the kinematic and isotropic hardenings with an increase in the sizing ratio.
To examine the effect of the sizing ratio in more detail for a D/t of 14, the collapse pressure with respect to the sizing ratio was compared together with the ovality and the compressive yield strength, as shown in Figure 13. Ovality is a widely used indicator of out-of-roundness, as follows.
O v a l i t y = O u t e r   d i a m e t e r max . O u t e r   d i a m e t e r m i n . O u t e r   d i a m e t e r a v g .
Up to a sizing ratio of 0.4%, the collapse pressure was increased by approximately 10%, and this tendency between the collapse pressure and the sizing ratio seemed to follow improvement of the ovality, as shown in Figure 13a. At a sizing ratio of more than 0.4%, however, the collapse pressure continued to increase, but little improvement was shown for ovality. Thus, ovality could not explain the increase in collapse pressure when the sizing ratio was greater than 0.4%. On the other hand, compressive yield strength was increased for a greater sizing ratio, as shown in Figure 13b. The correlation coefficient between the collapse pressure and the compressive yield strength was 0.67 when the sizing ratio was greater than 0.4%. The correlation coefficient between the collapse pressure and the ovality for the same range, however, was −0.36, which indicated low correlation. Therefore, improvement in the collapse pressure due to the sizing process for a sizing ratio greater than 0.4% could be caused by the increase in compressive yield strength.

3.4. Comparison with Design Standards

Figure 14 compares the results of the collapse analysis with the design criteria recommended by two design standards: API Recommendation Practice 111 [23] and Offshore Standard DNV-OS-F101 [11]. Both standards use a combination of the elastic and inelastic collapse pressure to make recommendations for the collapse pressure of offshore pipelines. Both standards define the elastic and inelastic collapse pressures as identical, but the equations determining the design collapse pressure and modification factors are different. For example, DNV-OS-F101 [11] introduces a fabrication factor to deduct the inelastic collapse pressure by 7% by considering the effect of changing material properties due to cold-forming. The difference between the two design standards was small for a large D/t where the elastic buckling is dominant. At a D/t of 17 or less, however, DNV-OS-F101 [11] suggests a slightly lower design collapse pressure.
The comparison indicates that the minimum collapse pressures obtained in the simulation of the manufacture process approximated the design criteria for a larger D/t. There was a difference of approximately 25%, however, between the minimum collapse pressure obtained from the simulation and that of the design criteria for a D/t of 14. This is because the current design standards do not factor in the advantage from the increased slope of the strain hardening that is caused by the sizing process. Thus, a larger margin exists for a smaller D/t, for which inelastic buckling governs the collapse pressure of the ERW pipe.

4. Conclusions

The manufacture process for ERW pipes made of API-5L-X70 was simulated via finite element analysis using a solid element. The effect that the manufacture process, particularly the sizing process, exerts on collapse pressure was evaluated. A material model that could account for the Bauschinger effect and strain hardening was adopted for analysis. The main conclusions of this study are as follows.
  • The compressive stress–strain curve in the circumferential direction was modified by plastic deformation during the manufacture of the ERW pipe. The slope of strain hardening was increased following manufacture, and either the Bauschinger effect or strain hardening could be factors depending on the sizing ratio. When the sizing ratio was small, the Bauschinger effect was strong. When the sizing ratio increased, on the other hand, strain hardening appeared immediately after the elastic region resulting in a higher level of compressive yield strength.
  • The sizing process improved both the ovality and the compressive yield strength for a D/t smaller than 19, so that a larger sizing ratio increased the collapse pressure. In particular, when the sizing ratio was larger than 0.4%, improvement in ovality was minor and the increased compressive yield strength increased the collapse pressure.
  • When D/t was greater than or equal to 22, there was no clear correlation between the sizing ratio and the collapse pressure. In particular, elastic buckling governed the collapse for a D/t greater than 31.
  • Considering both elastic and inelastic buckling, minimum sizing ratio of 0.4% could be recommended to improve the collapse pressure.
  • Comparison between the analysis results and the current design criteria showed a significant margin for smaller values of D/t, in which inelastic buckling governed the collapse pressure. If inelastic material behavior was considered, an increase in collapse pressure of approximately 25% could be obtained with a D/t of 14.

Author Contributions

Conceptualization, S.-W.H., Y.C.P., and H.-K.K.; methodology, S.-W.H., and Y.C.P.; software, S.-W.H., Y.C.P., and S.-C.K.; validation, S.-W.H, Y.C.P., H.-K.K., and S.-C.K.; formal analysis, S.-W.H.; investigation, S.-W.H. and Y.C.P.; resources, S.-C.K.; writing—original draft preparation, S.-W.H.; writing—review and editing, Y.C.P. and H.-K.K.; supervision, Y.C.P. and H.-K.K.; project administration, H.-K.K. and S.-C.K. All authors have read and agreed to the published version of the manuscript.

Funding

This research was supported by grants (Project no. 2019 × 005) from the POSCO.

Acknowledgments

The third author was supported by the POSCO Chair Professor Program.

Conflicts of Interest

The authors declare no conflict of interest.

References

  1. Tsuru, E.; Tomioka, K.; Shitamoto, H.; Ozaki, M.; Karjadi, E.; Boyd, H.; Demmink, H. Collapse resistance of HF-ERW line pipe installed in deepwater by R-lay. In Proceedings of the 25th International Ocean and Polar Engineering Conference, Kona, HI, USA, 21–26 June 2015. [Google Scholar]
  2. Nagata, Y.; Tsuru, E. Geometry and collapse pressure of HF-ERW line pipe reel-laid in deepwater. In Proceedings of the 26th International Ocean and Polar Engineering Conference, Rhodes, Greece, 26 June–2 July 2016. [Google Scholar]
  3. Han, S.-W.; Park, Y.C.; Kang, S.-C.; Jung, S.; Kim, H.-K. Collapse analysis of ERW pipe based on roll-forming and sizing simulations. J. Mar. Sci. Eng. 2019, 7, 410. [Google Scholar] [CrossRef] [Green Version]
  4. Kyriakides, S.; Corona, E. Mechanics of Offshore Pipelines: Volume 1 Buckling and Collapse, 1st ed.; Elsevier: Oxford, UK, 2007; ISBN 9780080467320. [Google Scholar]
  5. Nishimura, N.; Takeuchi, S.; Murakami, S.; Sanui, K. The effect manufacturing processes on residual stress and yield stress of erw pipes. Kou kouzou rombunshuu 1997, 4, 53–62. [Google Scholar] [CrossRef]
  6. Kim, D.; Quagliato, L.; Lee, W.; Kim, N. Yield strength mapping in the cross section of ERW pipes considering kinematic hardening and residual stress. J. Phys. Conf. Ser. 2017, 896, 012066. [Google Scholar] [CrossRef] [Green Version]
  7. Lee, J.; Kim, D.; Quagliato, L.; Kang, S.; Kim, N. Change of the yield stress in roll formed ERW pipes considering the bauschinger effect. J. Mater. Process. Technol. 2017, 244, 304–313. [Google Scholar] [CrossRef] [Green Version]
  8. Jo, M.C.; Lee, S.G.; Sohn, S.S.; Kim, K.-S.; Kim, W.-K.; Lee, C.S.; Lee, S. Effects of coiling temperature and pipe-forming strain on yield strength variation after erw pipe forming of API X70 and X80 linepipe steels. Mater. Sci. Eng. 2017, 682, 304–311. [Google Scholar] [CrossRef]
  9. Cooreman, S.; Hoecke, V.D.; Liebeherr, M.; Thibaux, P.; Luccioni, H. Advanced constitutive model for the accurate evaluation of the structural performance of welded pipes in offshore applications. In Proceedings of the 12th International Pipeline Conference, Calgary, AB, Canada, 24–28 September 2018. [Google Scholar]
  10. Rashid, M.; Chen, S.; Collins, L. Standardization of flattening procedure of transverse to pipe axis strap tensile samples. In Proceedings of the 12th International Pipeline Conference, Calgary, AB, Canada, 24–28 September 2018. [Google Scholar]
  11. Det Norske Verita (DNV), GL. Offshore Standard DNV-OS-F101: Submarine Pipeline Systems; Det Norske Veritas AS: Oslo, Norway, 2013. [Google Scholar]
  12. Gong, S.-F.; Ni, X.-Y.; Bao, S.; Bai, Y. Asymmetric collapse of offshore pipelines under external pressure. Ships Offshore Struct. 2013, 8, 176–188. [Google Scholar] [CrossRef]
  13. Yi, J. Optimal Design Procedure for Offshore Pipelines Based on Computational Simulation of Pipe Forming Process. Ph.D. Thesis, Department of Civil and Environmental Engineering, Seoul National University, Seoul, Korea, 2017. [Google Scholar]
  14. Dassault Systemes. ABAQUS (Version 2018); Dassault Systemes Simulia Corp.: Johnston, RI, USA, 2018. [Google Scholar]
  15. Zou, T.; Li, D.; Wu, G.; Peng, Y. Yield strength development from high strength steel plate to UOE pipe. Mater. Des. 2016, 89, 1107–1122. [Google Scholar] [CrossRef]
  16. McConnell, C.; Lenard, J.G. Friction in cold rolling of a low carbon steel with lubricants. J. Mater. Process. Technol. 2000, 99, 86–93. [Google Scholar] [CrossRef]
  17. Berglund, J.; Brown, C.A.; Rosen, B.-G.; Bay, N. Milled die steel surface roughness correlation with steel sheet friction. CIRP Ann. Manuf. Technol. 2010, 59, 577–580. [Google Scholar] [CrossRef]
  18. American Petroleum Institute (API). API Specification 5L: Specification for Line Pipe; American Petroleum Institute: Washington, DC, USA, 2018. [Google Scholar]
  19. Yi, J.; Kang, S.-C.; Park, W.; Choo, J.F. Yield strength tracking of UOE pipe considering various thickness-to-diameter ratios. Mar. Struct. 2019, 68, 102616. [Google Scholar] [CrossRef]
  20. Bastola, A.; Wang, J.; Mirzaee-Sisan, A.; Njuguna, J. Predicting hydrostatic collapse of pipes using finite element analysis. In Proceedings of the 33rd International Conference on Ocean, Offshore and Arctic Engineering, San Francisco, CA, USA, 8–13 June 2014. [Google Scholar]
  21. Ramm, E. Strategies for tracking the nonlinear response near limit points. In Nonlinear Finite Element Analysis in Structural Mechanic; Wunderlich, E., Stein, E., Bathe, K.J., Eds.; Springer: Berlin, Germany, 1981. [Google Scholar]
  22. American Society of Testing and Materials (ASTM). ASTM E9 Standard Test Method for Compression Testing of Metallic Materials at Room Temperature; American Society of Testing and Materials: West Conshohocken, PA, USA, 2012. [Google Scholar]
  23. American Petroleum Institute (API). API Recommended Practice 1111: Design, Construction, Operation, and Maintenance of Offshore Hydrocarbon Pipelines (Limit State Design); American Petroleum Institute: Washington, DC, USA, 2015. [Google Scholar]
Figure 1. Adopted stress–strain curve in simulation.
Applsci 10 05005 g001
Figure 2. Simulation of the manufacture process using a three-dimensional finite element method.
Applsci 10 05005 g002
Figure 3. Size and boundary conditions of a steel plate in the finite element model.
Applsci 10 05005 g003
Figure 4. Contact conditions between the plate and rollers.
Applsci 10 05005 g004
Figure 5. Typical results of the simulation: (a) roll-flower; (b) shapes of the cross-sections under each roller; (c) circumferential stress.
Applsci 10 05005 g005
Figure 6. Distribution of circumferential stress along the circumferential direction in squeezing and sizing processes.
Applsci 10 05005 g006
Figure 7. Stress–strain curve at the outer and inner layers during manufacture.
Applsci 10 05005 g007
Figure 8. Strain history of each layer during the manufacture process.
Applsci 10 05005 g008
Figure 9. Collapse analysis: (a) boundary and load conditions; (b) displacement under external pressure.
Applsci 10 05005 g009
Figure 10. Effect of the sizing ratio on the collapse pressure: (a) D/t = 14; (b) D/t = 19; (c) D/t = 22; (d) D/t = 26 and 28; (e) D/t = 31 and 33; (f) D/t = 36.
Applsci 10 05005 g010
Figure 11. Range of maximum compressive strain when collapse occurs.
Applsci 10 05005 g011
Figure 12. Compression test: (a) specimen model for the compression test; (b) compressive stress–strain curves for various sizing ratios.
Applsci 10 05005 g012
Figure 13. Correlation according to sizing ratio (diameter-to-thickness ratio (D/t) = 14) between: (a) collapse pressure and ovality; (b) compressive yield strength and collapse pressure.
Applsci 10 05005 g013
Figure 14. Comparison between analysis results and design standards.
Applsci 10 05005 g014

