Article

Application of Hyperspectral Imaging for Assessment of Tomato Leaf Water Status in Plant Factories

1
Department of Agro-Food Science, Niigata Agro-Food University, Faculty of Agro-Food Science, Tainai Campus, Hiranedai 2416, Tainai, Niigata 959-2702, Japan
2
Chiba University Innovation Management Organization, Chiba University, Kashiwano-ha Campus 6-2-1, Kashiwano-ha, Kashiwa-shi, Chiba 277-0882, Japan
3
Tohoku Agricultural Research Center, NARO, 4 Akahira, Shimo-kuriyagawa, Morioka, Iwate 020-0198, Japan
4
College of Bioresource Sciences, Nihon University, 1866 Kameino, Fujisawa, Kanagawa 252-0880, Japan
*
Author to whom correspondence should be addressed.
Appl. Sci. 2020, 10(13), 4665; https://doi.org/10.3390/app10134665
Submission received: 10 May 2020 / Revised: 1 July 2020 / Accepted: 2 July 2020 / Published: 6 July 2020
(This article belongs to the Special Issue Application of Hyperspectral Imaging for Nondestructive Measurement)

Abstract

:
Irrigation management continues to be an important issue for tomato cultivation, especially in plant factories. Accurate and timely assessment of tomato leaf water status is a key factor in enabling appropriate irrigation, which can save nutrition solution and labor. In recent decades, hyperspectral imaging has been widely used as a nondestructive measurement method in agriculture to obtain plant biological information. The objective of this research was to establish an approach to obtain the tomato leaf water status—specifically, the relative water content (WC) and equivalent water thickness (MC)—for five different tomato cultivars in real time by using hyperspectral imaging. The normalized difference vegetation index (NDVI) and two-band vegetation index (TBI) analyses were performed on the tomato leaf raw relative reflection (RAW), the inversion-logarithm relative reflection (LOG), and the first derivative of relative reflection (DIFF) from wavelengths of 900 nm to 1700 nm. The best regression model for WC assessment was obtained by TBI regression using DIFF at wavelengths of 1410 nm and 1520 nm, and the best regression model for MC assessment was obtained by NDVI regression using RAW at wavelengths of 1300 nm and 1310 nm. Higher model performance was obtained with MC assessment than with WC assessment. The results will help improve our understanding of the relationship between hyperspectral reflectance and leaf water status.

1. Introduction

Plant factories are widely used for tomato cultivation. The corresponding automation and precise management are also becoming increasingly important issues. In particular, precise irrigation management is a challenge. To ensure that the plants have adequate moisture, irrigation management is improved by making adjustments considering the growth stage and status of the tomato; however, the solution waste rate remains at approximately 20–30%, which causes considerable wastage of nutrition solution and labor. To achieve more precise irrigation management, many studies have focused on the accurate monitoring the leaf water status dynamics in real time through nondestructive measurements.
In recent decades, with the advancements in spectroscopy and imaging technologies, hyperspectral imaging (HSI) technology has emerged as a highly efficient nondestructive measurement method. This technology was originally developed for remote sensing and is widely used in resource management, agriculture, mineral exploration, and environmental monitoring [1,2,3].
Certain properties of the tomato leaf enable the possibility of assessing its water status using HSI. Tomatoes lose more than 90% of the water they absorb by transpiration from their leaves [4]; therefore, the leaves are more susceptible to water stress than other organs, such as the fruit. Leaf water stress is usually indicated by the leaf water status, including the leaf water content (WC) and equivalent water thickness (MC) [5,6]. There are differences in terms of the physics between WC and MC, where WC is a percentage, which can be calculated based on the fresh and dry weights of a tomato leaf (FW and DW, respectively), while MC has units of weight per area (g/cm2 or g/dm2) and is calculated based on the weight of the water contained in the leaf and the leaf area (LA) [7].
Previous studies have shown that the histological structures and specific components of plant leaves are the main factors affecting the reflectance spectral characteristics. The high reflectance in the near-infrared band of 780–1300 nm is due to the structure of plant tissues and cells. The low reflectance above a wavelength of 1300 nm is due to the absorption of water. Furthermore, numerous studies have indicated that there are four water absorption bands for all angiosperm leaves, which occur at wavelengths of approximately 970, 1200, 1400, and 1920 nm [2,3,8,9]. These discoveries enable water status assessment using HSI.
In HSI, information from across the electromagnetic spectrum is collected and processed, and conventional imaging and spectroscopy are integrated to obtain both spatial and spectral information from an object. This information can be used to characterize objects with great precision and detail. However, preprocessing of hyperspectral data is necessary to reduce random noise and improve the accuracy of the assessment model. The preprocessing methods employed for this purpose include normalization processing [2,10]; the spectral derivative technique, including first-order, second-order, and fractional differential processing [2,11,12]; and the logarithmic transformation of the inverse of the reflectance [10,12,13], among others.
To establish a water status assessment model based on hyperspectral data, numerous researchers have focused on hyperspectral indices using two wavelength bands, such as (1) λ 1 / λ 2 , which is also called the water index [14], sample ratio water index [15], simple ratio water index [16], or moisture stress index (MSI) [17]; and (2) ( λ 1 λ 2 ) / ( λ 1 + λ 2 ) , which is called the normalized difference water index (normalized difference vegetation index (NDVI) [18], normalized difference infrared index (NDII) [19], normalized difference water index [20], normalized multi-band drought index [21], or short-wave infrared water stress index [22]. In addition, new wavelength combinations for leaf water status (WC and MC) are constantly being proposed using the above model expression [2,7]. However, the relationships between the wavelength bands and water status indicators (WC and MC) have not been well investigated to date. Furthermore, the study of different objects requires the use of different wavelength combinations that correspond to them.
Based on the aforementioned background, the main objectives of this research were to (1) perform statistical analysis on the leaf water status (WC and MC); (2) investigate the impact of hyperspectral data preprocessing on improving the model accuracy, and identify the best combination of wavelength bands for leaf water status (WC and MC) assessment based on the NDVI and two-band index (TBI); (3) evaluate the performance of the leaf water status model based on various types of indices; and (4) establish an approach for obtaining the tomato leaf water status (WC and MC) in real time using HSI technology for tomato plant irrigation management in plant factories.

2. Materials and Methods

2.1. Research Site and Tomato Cultivation

The experiment in this study was conducted in the sunlight-type plant factory of the National Agriculture and Food Research Organization (36.025399° N, 140.101125° E), Tsukuba, Ibaraki, Japan. The eave height of the plant factory was 5.1 m, and the total area was 2551 m2 (63 m × 40.5 m). The whole building was covered with an ethylene tetrafluoroethylene film (F-clean GR diffused type, AGC Greentech, Tokyo, Japan), including the roof and the glass on the walls. The plant factory was divided into eight small compartments to accommodate several hydroponic systems and crops [23]. One small compartment with a growing area of 162 m2 (9 m × 18 m) was employed for cultivating the tomato plants used in this experiment. The Ubiquitous Environment Control System was adopted to control the environment in the growing house. The temperature target was set between 14 °C and 25 °C. An automatic shade curtain (LS screen, XLS16, Seiwa Co., Ltd., Tochigi, Japan) was used to shield the light when the outdoor solar radiation was greater than 1.2 kW·m−2.
The tomato plant samples were selected from five tomato cultivars for investigation in this experiment. They included “CF Momotarou”, “Rinnka 409”, and “DR03-103”, which are Japanese tomato cultivars that are produced for consumption as raw food; and “Tomimaru mucyo” and “Endeavour”, which are tomato cultivars from the Netherlands that are produced for processing and cooking. All of the samples were seeded on July 13, 2016. After three days of processing under a dark condition at 28 °C, with hastening by sprouting equipment, all the tomato plants were moved to a “Nae Terrace” to raise the seedlings for 21 days. They were then transplanted in sunlight in a plant-factory growing house on August 12 after secondary raising of the seedlings in the grow room. A rock wall slab and high wire (3.4 m) were adopted in this experiment. The nutrient solution was initially set to 1.0 dS/m−1 and then gradually increased to 2.8 dS/m−1. The fruit setting was increased by using 4-cholorophenoxy acetic acid (4-CPA), a plant growth hormone (0.15%, Ishihara), until the third fruit setting. Then the pollination was conducted by bees.

2.2. Tomato Leaf Sampling and Leaf Water Content Measurement

For nondestructive measurement of the tomato leaf water status using a portable hyperspectral camera, the measuring zone was divided into three parts (Figure 1): the top leaf position (LP) (near the growing point, 250 cm from the ground, LP-1), middle leaf position (150 cm from the ground, LP-2), and bottom leaf position (60 cm from the ground, LP-3). The distribution differences of the tomato plants under a year-round cultivation condition were considered. All three plants from the five tomato cultivars described above were chosen for the tomato leaf sampling.
Tomato leaf sampling was conducted on April 6, 2017 (267 days after seeding), for a total of 45 samples. Three groups worked as a line operation for leaf sampling to ensure measurement accuracy and to make all the measurements simultaneous. Firstly, the compound leaf was sampled in accordance with the different measuring zones. Secondly, the terminal leaflet was separated from the compound leaf, and its fresh weight (FW) was immediately measured. Thirdly, the HSI data of the terminal leaflet were obtained using a hyperspectral camera. The leaf sampling was initiated at 10:00 a.m. after irrigation and completed in two hours. All leaf samples were dried in a drying machine at 105 °C for 72 h. Then, the dry weight (DW) of the terminal leaflet was measured. The tomato leaf WC and equivalent water thickness (MC) were calculated in terms of the fresh weight, dry weight, and leaf area (LA) by using Formulas (1) and (2), respectively, as follows [5,6,7]:
WC   ( % ) = F W D W F W × 100 % ,
MC = F W D W L A .

2.3. Hyperspectral Imaging and Data Analysis

2.3.1. Leaf Hyperspectral Measurement

A portable hyperspectral camera (SIS-I, EBA Japan Co., LTD., Tokyo), standard reflector, and halogen lamp (CHP-500, Caster) were employed to obtain the spectral data of the tomato leaves from the bottom, middle, and top leaf positions. The wavelength range of the hyperspectral camera is 900 nm to 1700 nm, which is within the near-infrared (NIR) region. A dedicated NIR CCTV lens was set up in front of the camera using a C mount. A standard reflector (White Balance, X-Rite) and a halogen lamp were adopted in this experiment to reduce experimental errors. The hyperspectral image data of the terminal leaflet were immediately obtained after measuring the FW by using NIR Capture software (SIS-I, EBA Japan Co., LTD., Tokyo). The camera was set to a frame rate below 80 fps and to the maximum exposure time of 4.5 ms. The spectral resolution and image resolution of the hyperspectral camera were 10 nm and 400 × 320 pixels, respectively.

2.3.2. Image Processing for Hyperspectral Data

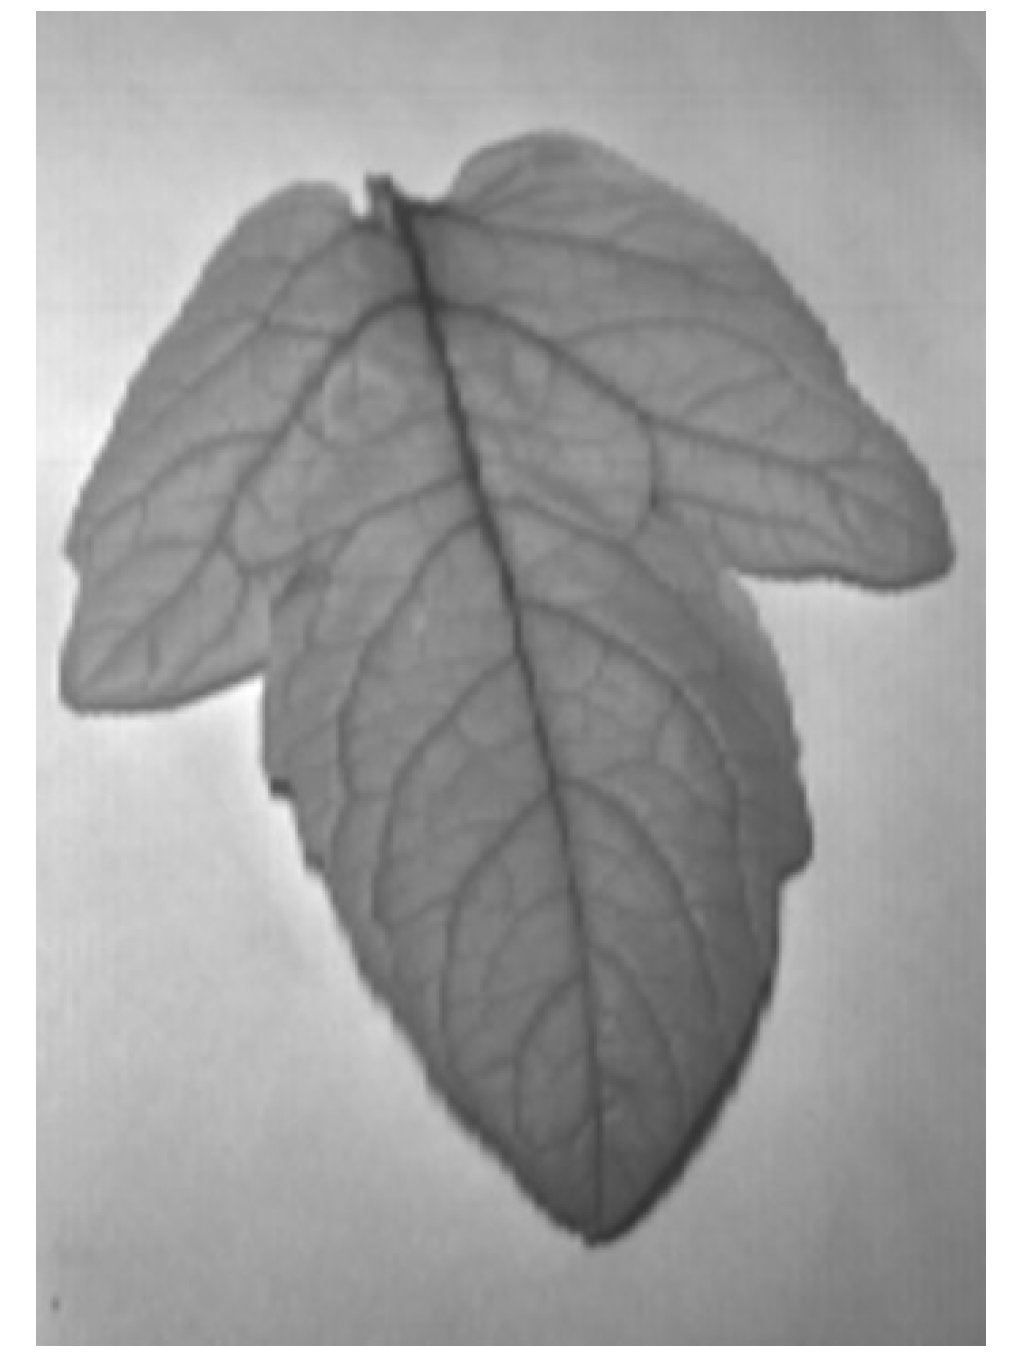
HSAnalyzer (EBA Japan Co., Ltd.) software was employed to preprocess the hyperspectral data, whose format was NIR and which were based on the band interleaved by the line data arrangement format. Further processing and data analysis were conducted using a MATLAB (MathWorks) program, which was developed for this study. Each leaf image was extracted from the hyperspectral data by image processing with MATLAB. To determine the leaf morphological characteristics, a region of interest (ROI) was selected, and a single wavelength of 1390 nm was used to construct a two-dimensional image (Figure 2).
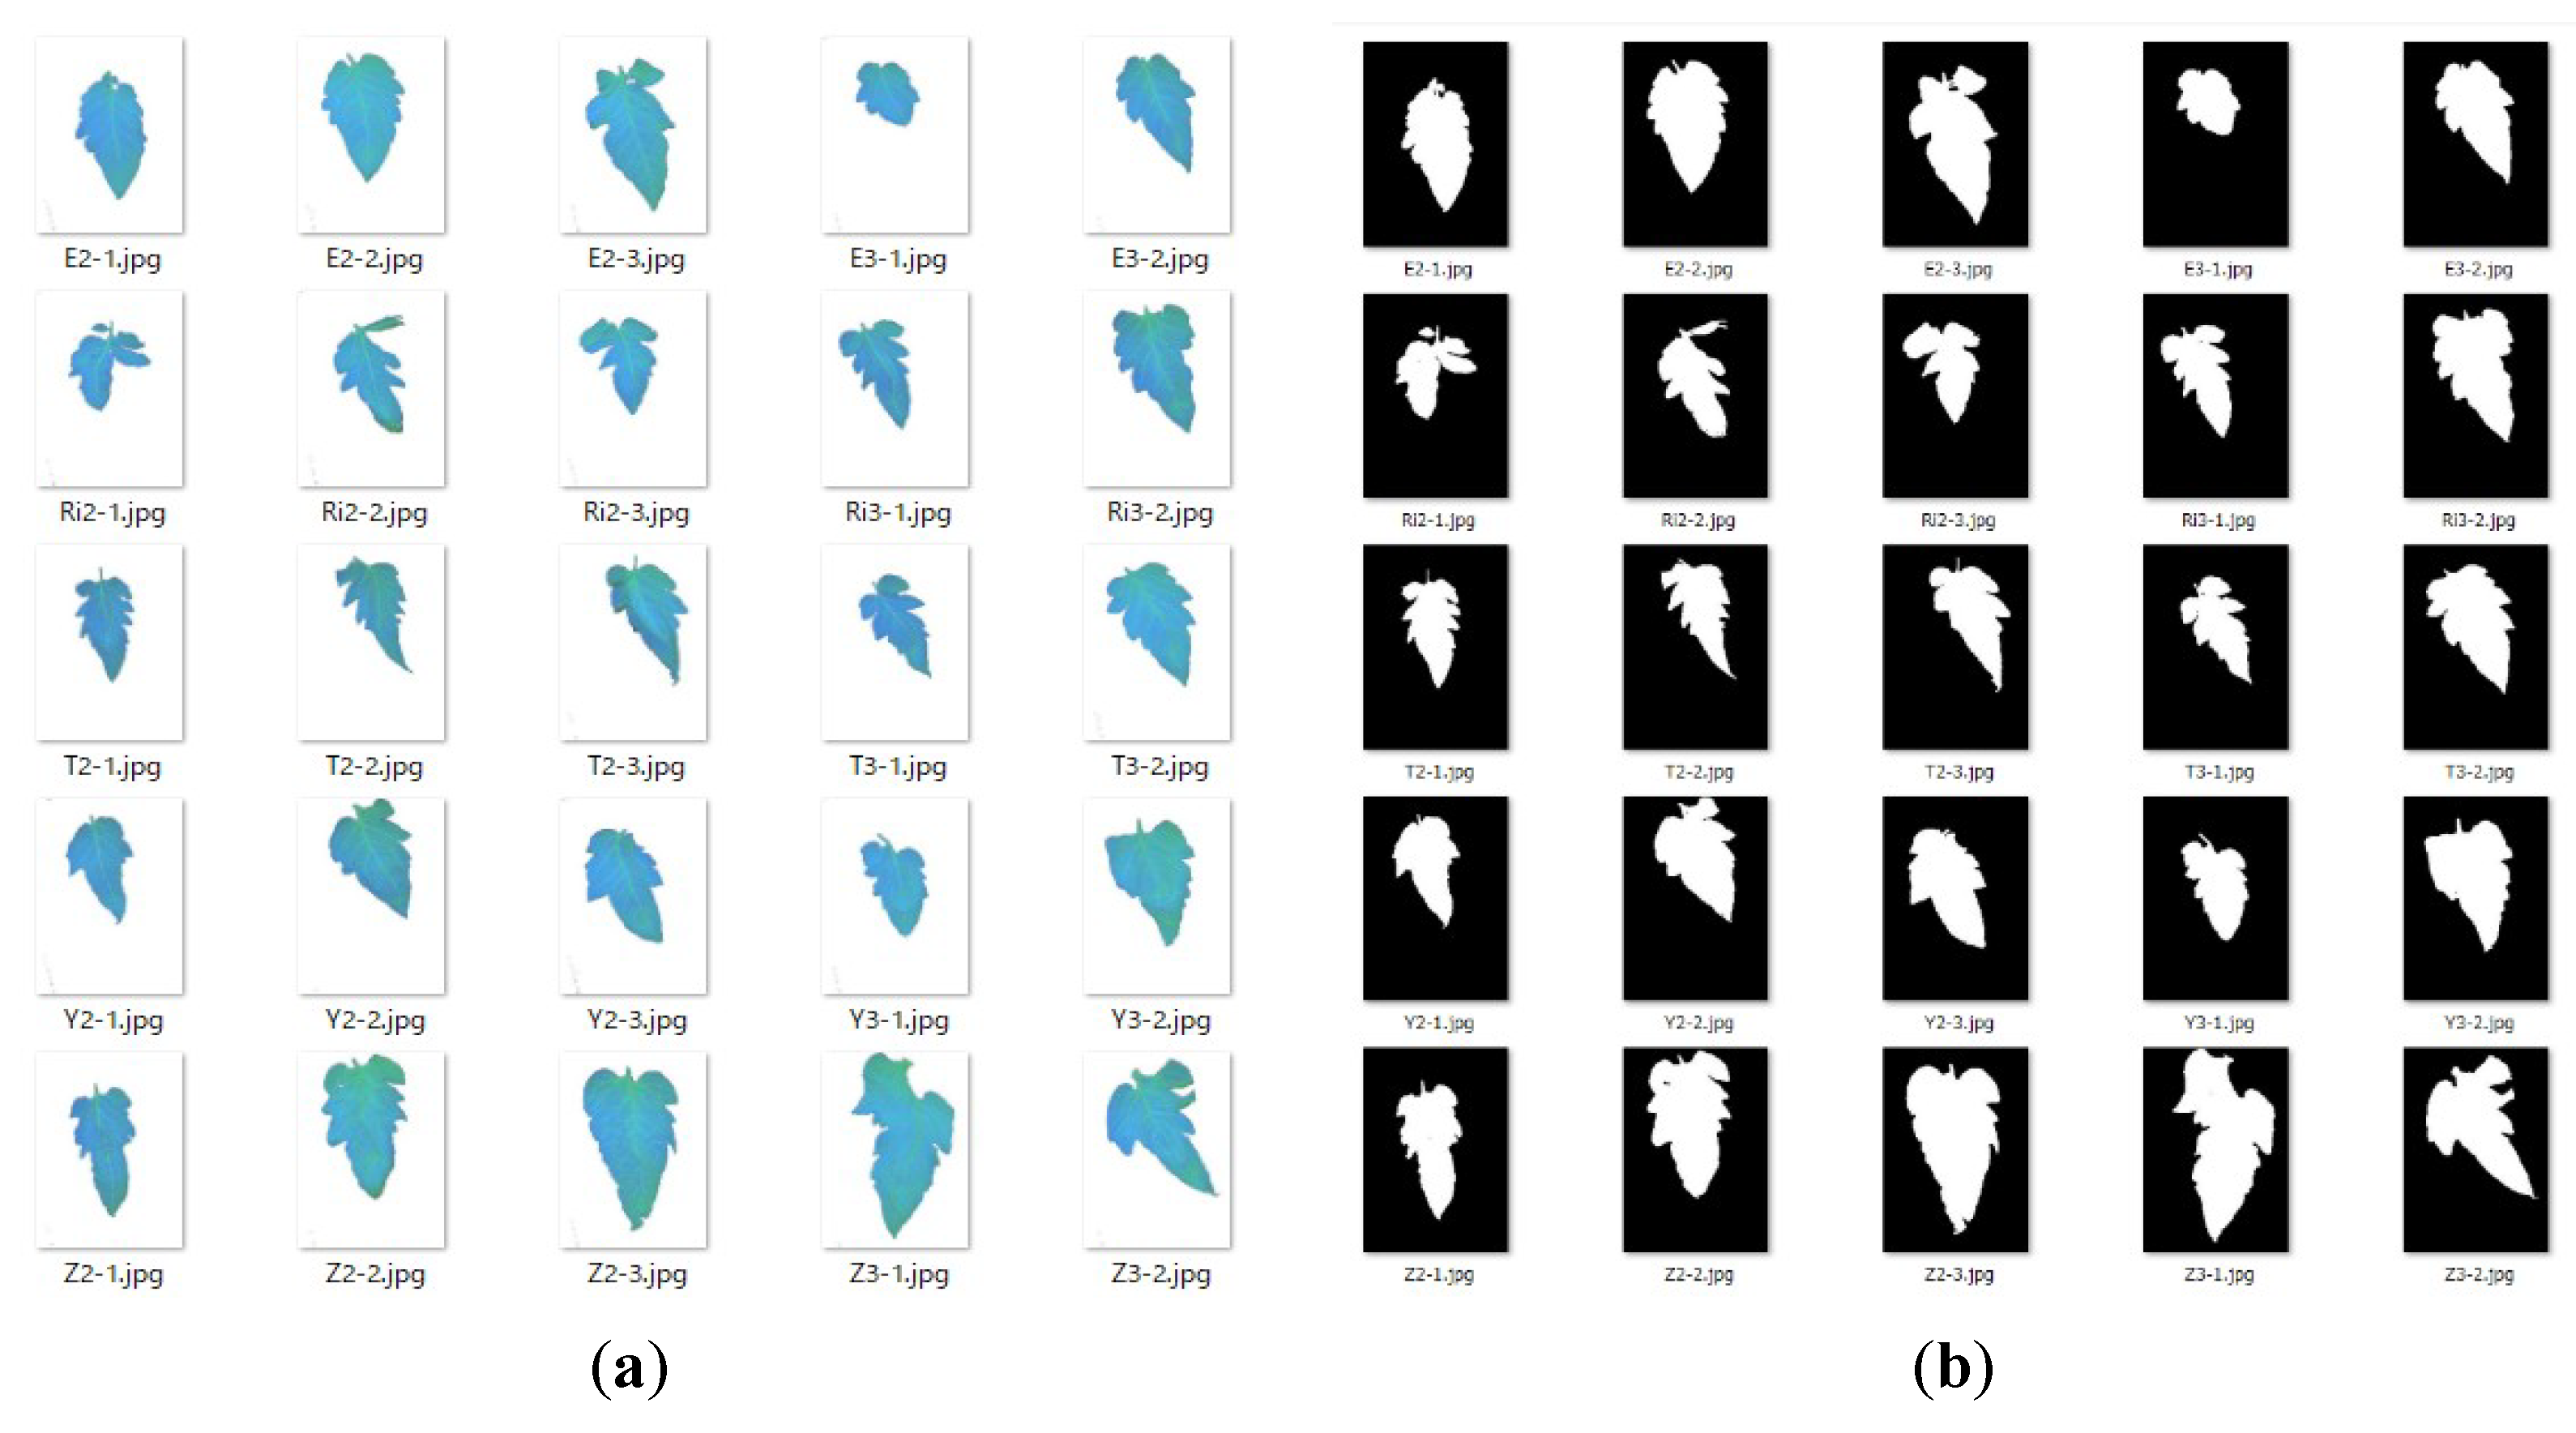
To produce a red–green–blue (RGB) format image file, wavelengths of 1000 nm, 1430 nm, and 1530 nm were respectively chosen as the special wavelengths to produce the individual fake colors of red, green, and blue. Then, the combined RGB image was transformed into a Lab (CIELAB) color space image to reduce the noise by threshold filtering. Subsequently, the grayscale image (Lab) was converted into a binary image to obtain binary statistics, which were used to calculate the LA (Figure 3).

2.3.3. Hyperspectral Data Analysis and Waveband Selection

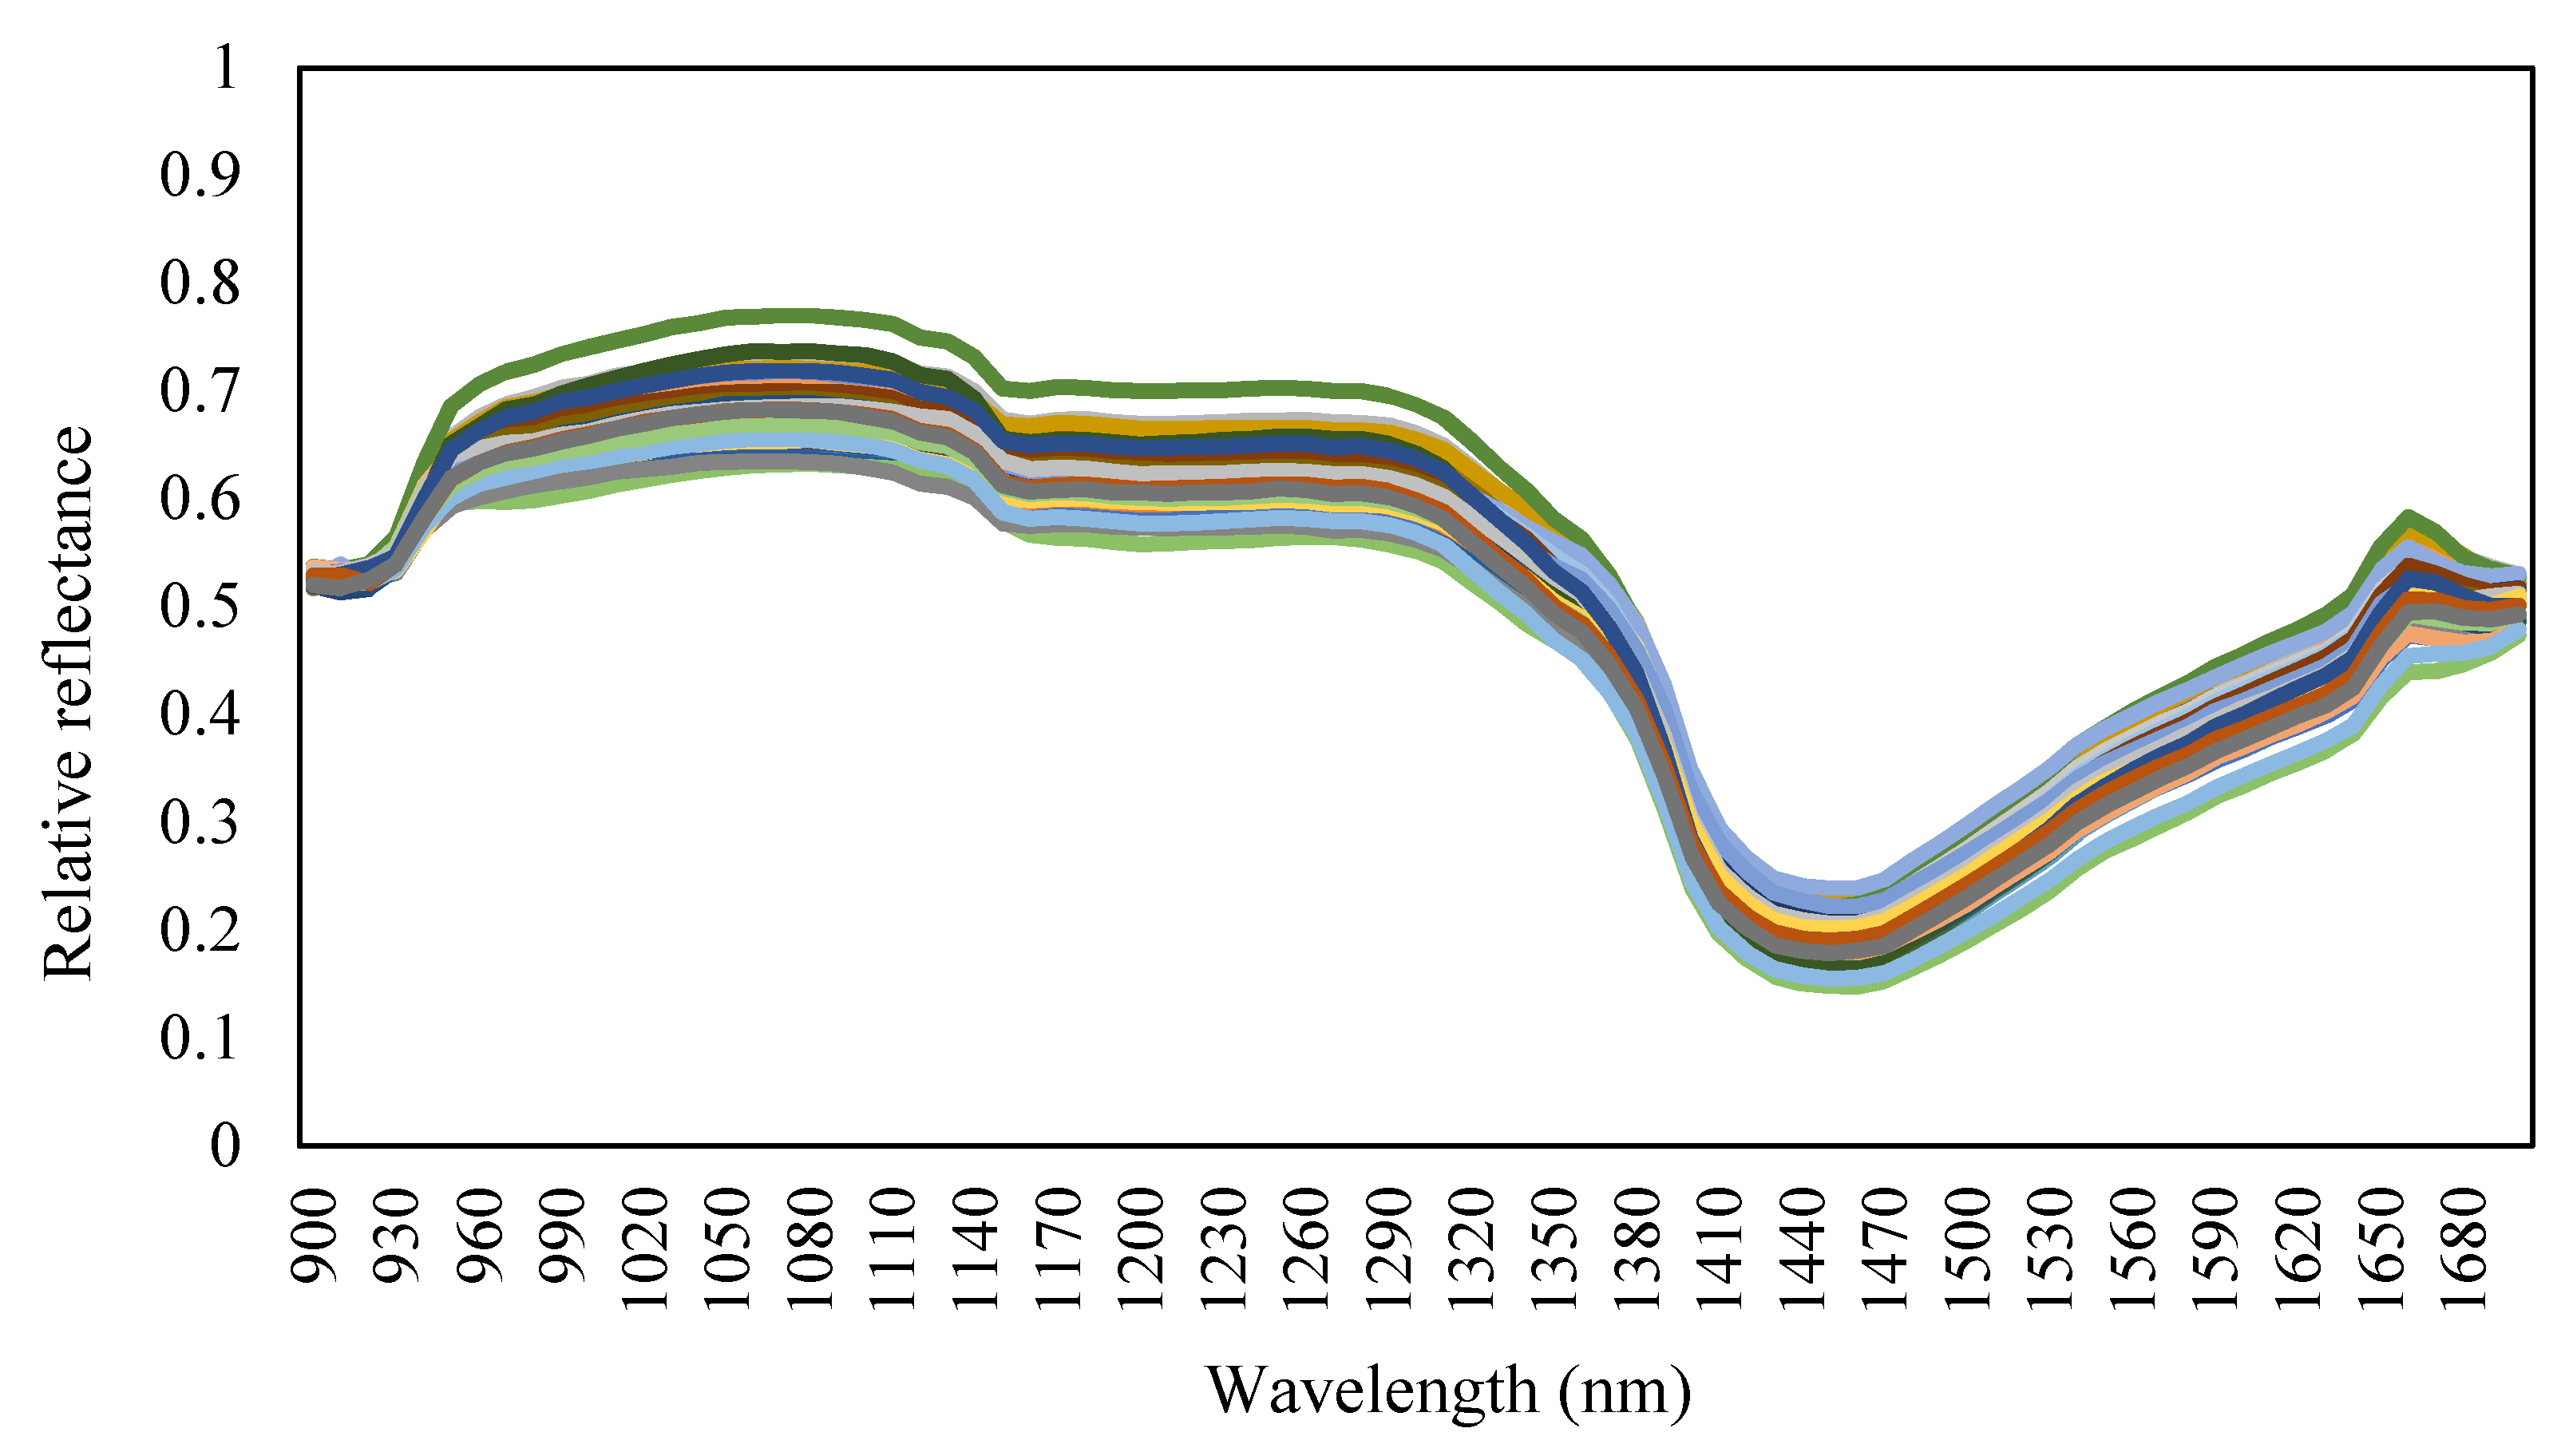
The tomato leaf ROI was 15 × 15 pixels (225 pixels) and it was selected from the tip of each terminal leaflet. For each sample, the spectral data were calculated using the average ROI of the spectral data. The relative reflectance (Figure 4) and the standardized spectrum of the tomato leaf were calculated for each leaf sample by using Formulas (3) and (4), respectively [10].
R = r l e a f r r e f e r ,
N i = log 10 ( 1 R ) .
where
  • r l e a f : Spectrum of the tomato leaf sample, raw spectral data;
  • r r e f e r : Spectrum of the standard reflector;
  • R : Relative reflectance of the standard reflector;
  • N i :   Standardized spectrum of the tomato leaf (i = 1–81 wavelength bands).
The first-order derivative of spectral reflectance (DR) and second-order derivative of spectral reflectance (SR), based on the raw reflectance, were calculated using Formulas (5) and (6) with the Norris gap method [24].
ρ ( λ i ) = ρ ( λ i + 1 ) ρ ( λ i 1 ) 2 Δ λ ,
ρ ( λ i ) = ρ ( λ i + 1 ) 2 ρ ( λ i ) + ρ ( λ i 1 ) Δ λ 2 .
where ρ is the spectral reflectance, λ i denotes the wavelength of each band, and Δ λ represents the interval from λ i 1 to λ i .
Partial least squares regression analysis was employed to assess the tomato leaf water status (WC and MC) by using all wavelengths from 900 nm to 1700 nm. For this purpose, Unscrambler X software (CAMO Software Inc., Oslo, Norway) was used because it is effective for multivariate analysis. Kernel partial least squares and cross-validation were employed in the regression analysis. NDVI and TBI were also adopted to assess the tomato leaf water status by using Formulas (7) and (8), respectively.
N D V I = λ 1 λ 2 λ 1 + λ 2 ,
T B I = λ 1 + λ 2 λ 1 λ 2 .
where λ 1 is the wavelength of Band 1, from 900 nm to 1700 nm, and λ 2 denotes the wavelength of Band 2, from 900 nm to 1700 nm. In the wavelength range from 900 nm to 1700 nm, 81 bands were identified by the 10 nm spectral resolution. All 6561 combinations of λ 1 with λ 2 were calculated for NDVI and TBI modeling by using MATLAB. Autocorrelation analysis was employed to improve the model accuracy and ensure model stability.

3. Results and Discussion

3.1. Tomato Leaf Water Status

In the agricultural production of tomato, the increase of plant stress, especially water stress, is widely used to improve the tomato fruit quality. However, it is difficult to accurately control the amount of plant stress given. The desired effect cannot be achieved with insufficient plant stress; on the other hand, excessive increase of plant stress will cause damage to the plant, even if the amount of plant stress is slightly larger than optimal. Tomato leaf water status has been adopted as an index to evaluate plant stress because leaves are the most susceptible organs to water stress compared with other organs, such as the fruit, as noted earlier. Although the leaf water potential can be a strong indicator for assessing the tomato leaf water status, WC was employed as an indicator in this experiment because it is easy to measure and is a stable parameter [25].
The tomato leaf from Leaf Position 1 (LP-1) (Table 1) has a significantly lower FW than those from Leaf Position 2 (LP-2) and Leaf Position 3 (LP-3). This is considered to be owing to the LP-1 tomato leaf being a new leaf and being located much closer to the growth point. There are significantly different WCs among the LP-1, LP-2, and LP-3 tomato leaves, the averages of which are 86.88%, 89.12%, and 90.25%, respectively. The higher the leaf position is, the smaller the leaf area (LA). The fresh weight per unit leaf area (FW/LA) and equivalent water thickness (MC) in LP-1 are significantly smaller than those in LP-2 and LP-3.
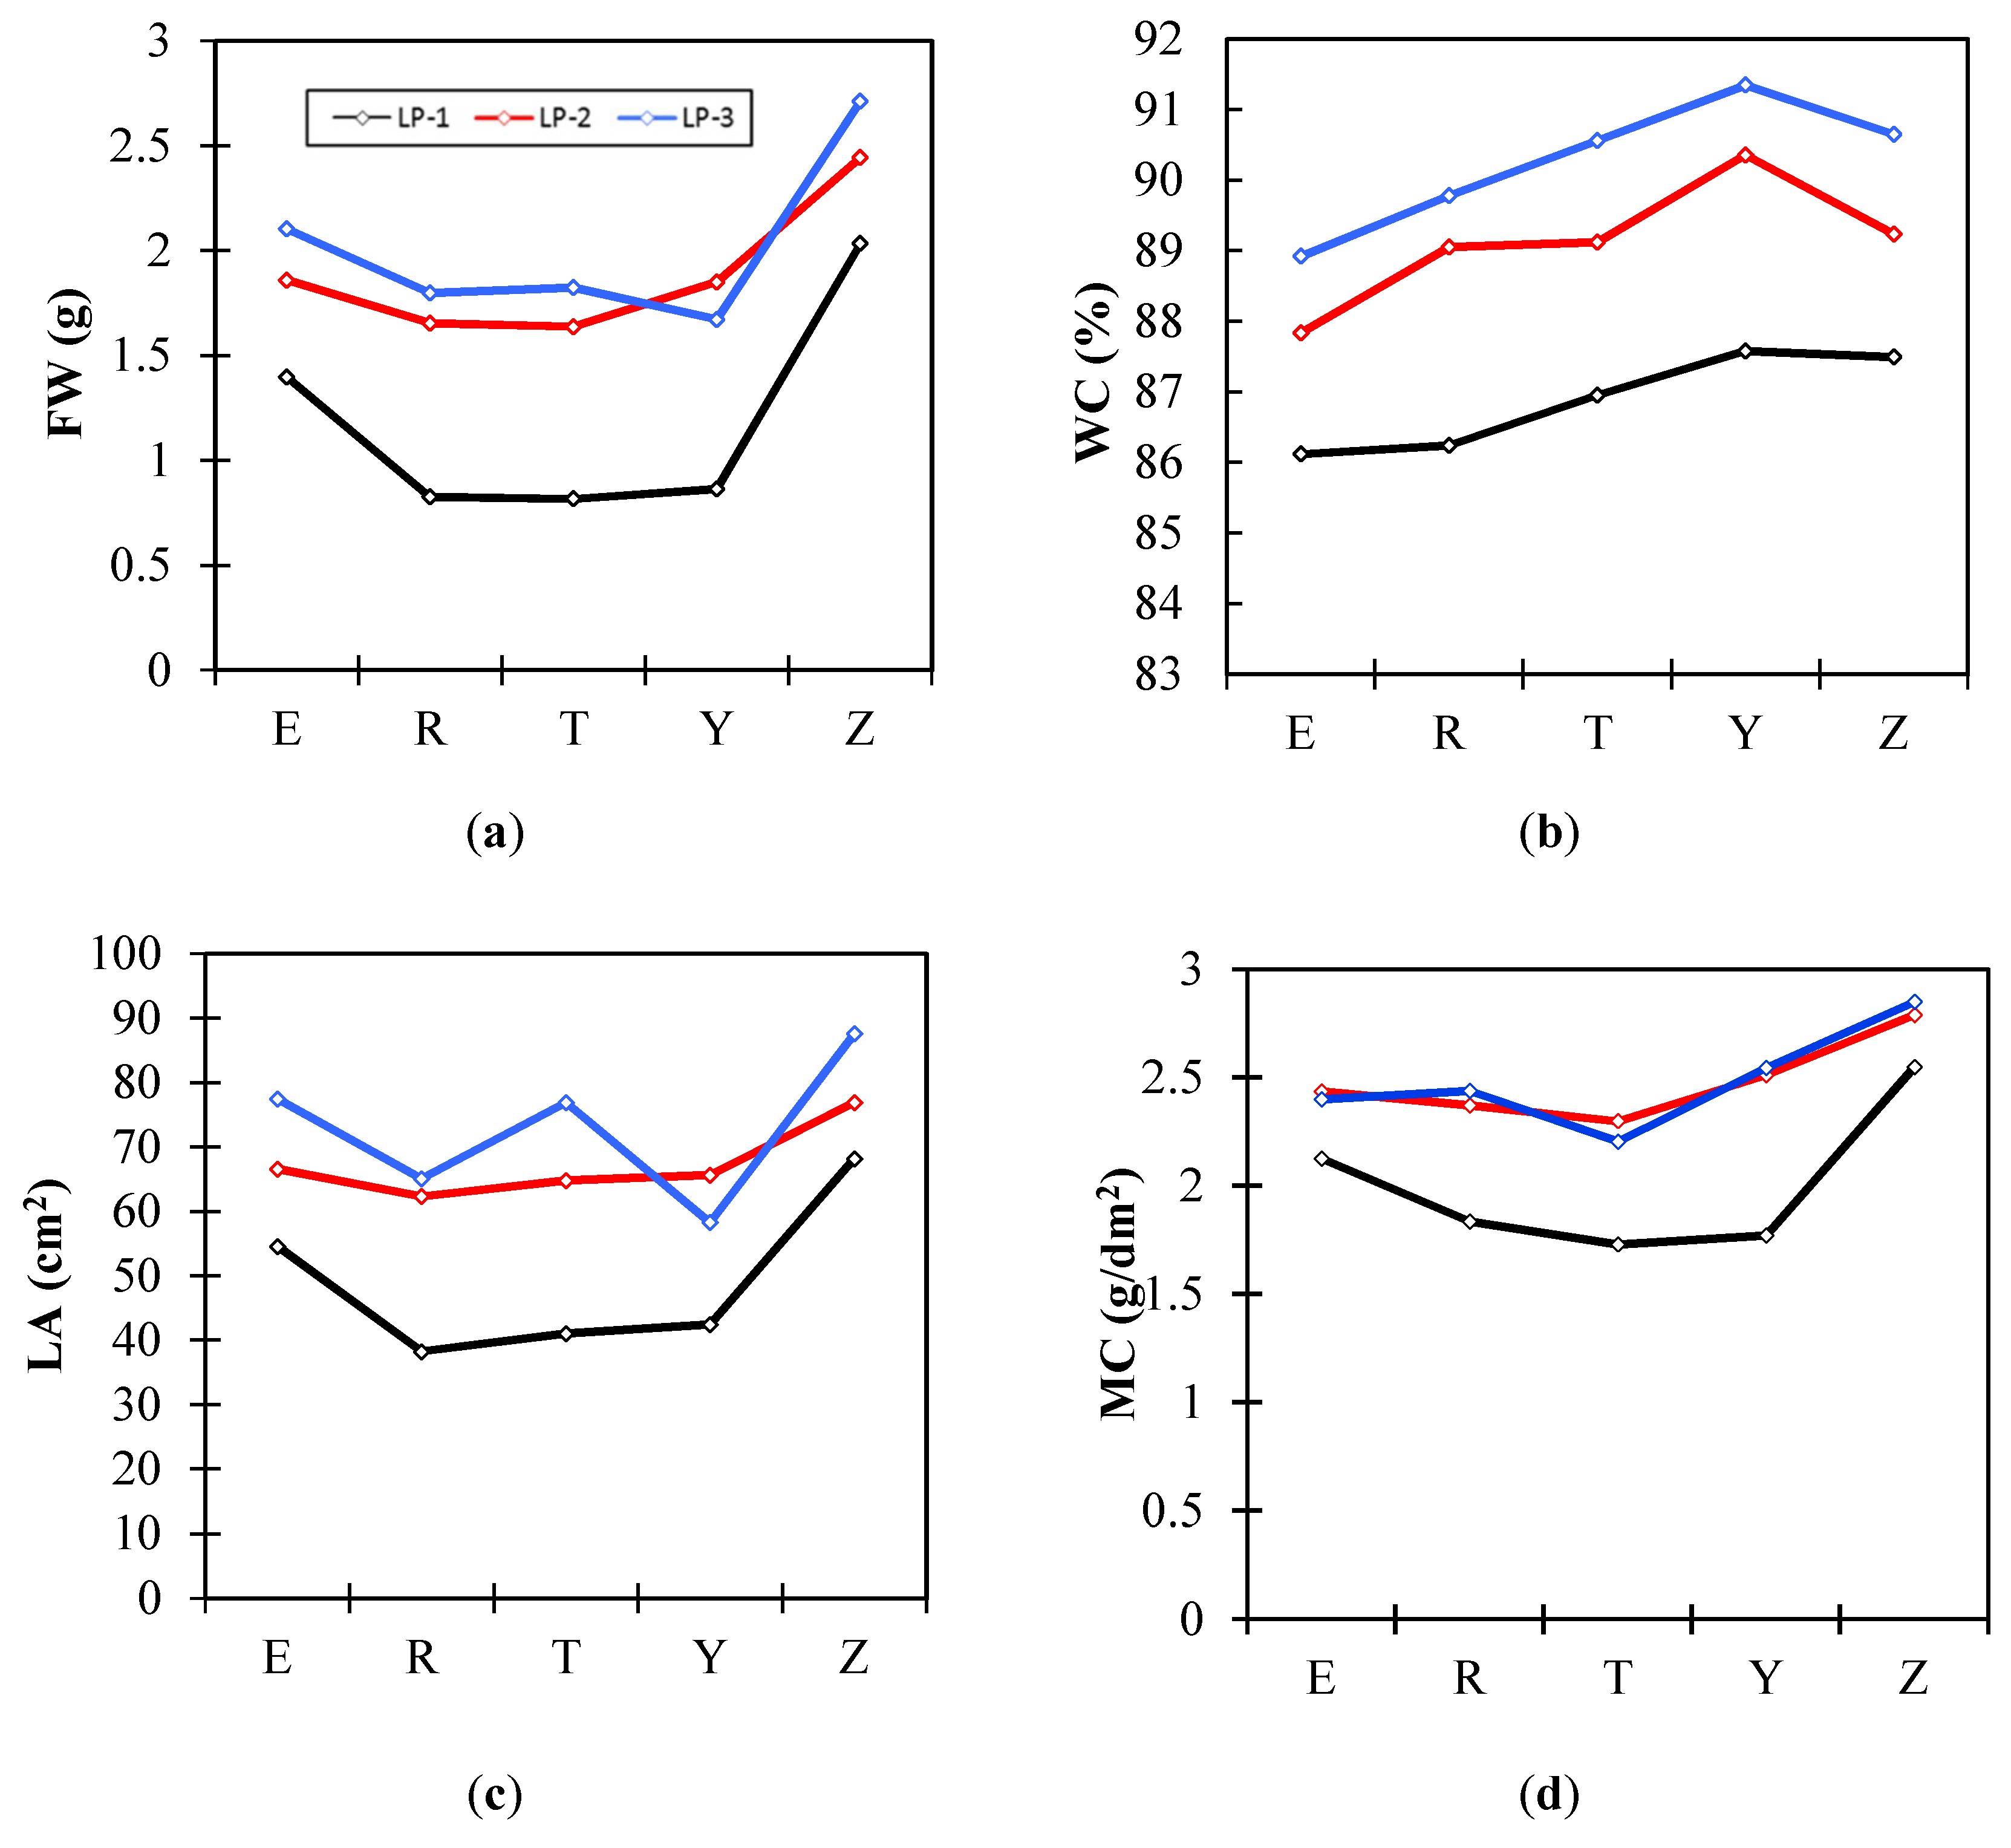
For the different tomato cultivars (Figure 5), “DR03-103” shows a higher leaf FW and leaf area than the other tomato cultivars. Differences in WC are observed among the different cultivars. The highest leaf WC is observed in the typical Japanese cultivar “CF Momotarou”, with a 3.77% difference between LP-3 (87.58%) and LP-1 (91.35%). The lowest leaf WC is observed in the Dutch “Endeavour” tomato cultivar, with a difference of 2.80% between LP-3 (86.12%) and LP-1 (88.92%). The equivalent water thickness (MC) shows almost the same value in LP-2 and LP-3, whereas the WC in the LP-3 leaf is on average 1.13% higher than the WC in the LP-2 leaf. This difference is considered to be due to the influence of the water potential, which may depend on the height difference of the leaf position.

3.2. Relationship between Individual Wavelength and Water Status

Many different types of random noise exist in an HSI system, including a dark current from the camera, light from the environment, noise from digitization owing to analog to digital conversion, and so on. These noise values will obviously impact the results obtained from subsequent image analysis [26]. To improve the assessment accuracy of the leaf water status, the spectral derivative technique and the logarithmic transformation (log (1/R)) of the inverse of the reflectance method were adopted for proper HSI preprocessing. The study reported in [13] showed that low-order differential processing of the spectrum has a low sensitivity to noise and is more effective in practical applications. Thus, first-order differential processing technology was adopted in this study to remove part of the linear or near-linear background and the influence of the noise spectrum on the target spectrum [2,24]. The logarithmic transformation (log (1/R)) of the inverse of the reflectance method was employed to address the nonlinear problem. The logarithmic transformation of the reciprocal of the spectral reflectance tends to not only enhance the spectral difference in the visible and infrared region, but also reduce the effects of multiplicative factors caused by changes in lighting conditions [11].
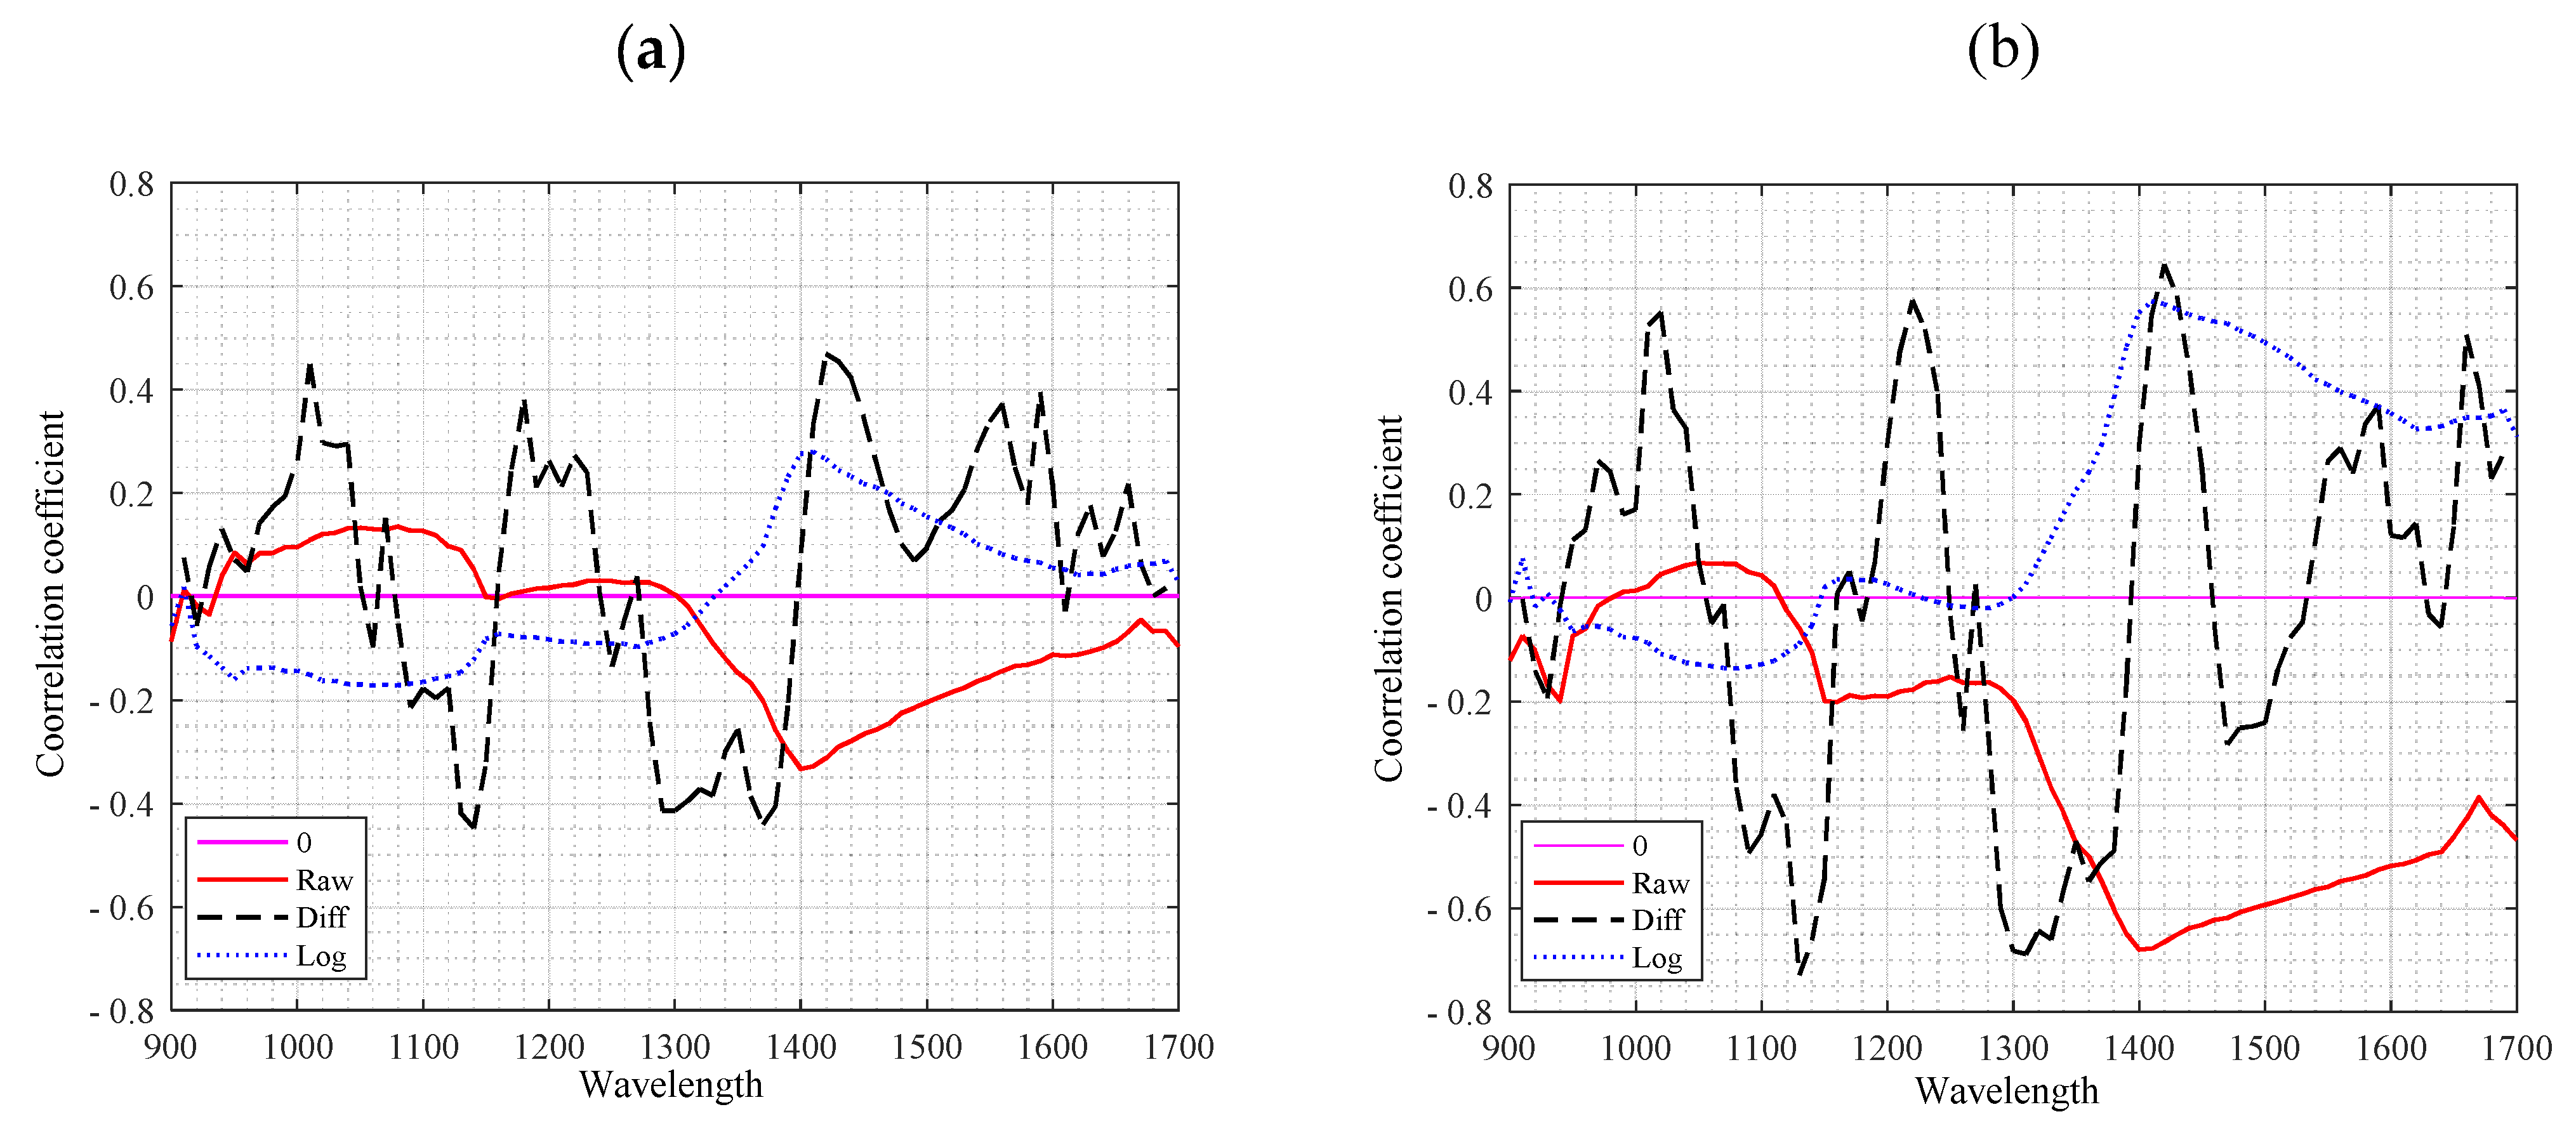
To determine the correlation coefficient between the tomato leaf water status (WC and MC) and individual wavelengths of the raw relative reflection (RAW), the first derivative of relative reflectance (DIFF) and the inverse-logarithm relative reflectance (LOG) were calculated from 900 nm to 1700 nm (Figure 6).
The maximum negative correlation coefficient between the raw relative reflectance and WC is observed at 1410 nm, where the coefficient value is r = 0.3334 . Regarding the relationship between the raw relative reflectance and MC, the maximum negative correlation coefficient is obtained at 1410 nm with the coefficient value of r = 0.6803 . The maximum positive correlation coefficient between the inverse-logarithm relative reflectance and WC is observed at 1420 nm with a low coefficient value of r = 0.2795 . With regard to the relationship between the inverse-logarithm relative reflectance and MC, the maximum positive correlation coefficient is obtained at 1420 nm, and the coefficient value is r = 0.5745 . For the relationship between the first derivative of relative reflectance and WC, the maximum positive correlation coefficient value is r = 0.4694 at 1430 nm. Moreover, the maximum negative correlation coefficient is obtained at 1140 nm with r = 0.7298 , and the second largest correlation coefficient value is obtained at 1430 nm with r = 0.6457 .
It should be noted that, as indicated by Pu [2], compared to other plant biochemical parameters, water has several obvious absorption bands at 970, 1200, 1400, and 1940 nm. Of these bands, 1400 nm and 1900 nm are considered the main bands that characterize water absorption [9]. The maximum negative or positive correlation coefficient in this experiment was thus concentrated in the range from 1410 nm to 1430 nm owing to the high water absorption in this region.
Recent studies have revealed that reflectance is related to changes in MC rather than to changes in WC. It is considered that WC depends on two independent leaf variables: the leaf equivalent water thickness and leaf dry mass area, both of which affect the leaf optical properties [6,7,27]. The correlation value between MC and wavelength was always observed to be higher than that between WC and wavelength in the present experiment.

3.3. Partial Least-Squares Regression Applied to Wavelength and Water Status

Partial least squares (PLS) regression is an alternative statistical regression technique that employs data compression to reduce the number of independent variables. PLS regression, followed by a calibration regression stage consisting of a least-squares fit of the parameters to the obtained regression factors [2,28], was employed to calibrate the relationships between the spectral variables derived from the hyperspectral data (RAW, DIFF, and LOG) and the tomato leaf water status (WC and MC).
To evaluate the effectiveness of the PLS regression model, cross-validation was employed in this experiment. Moreover, the root-mean-square error (RMSE) was calculated by using the following formula:
R M S E = 1 n i = 1 n ( y i y ^ i ) 2 .
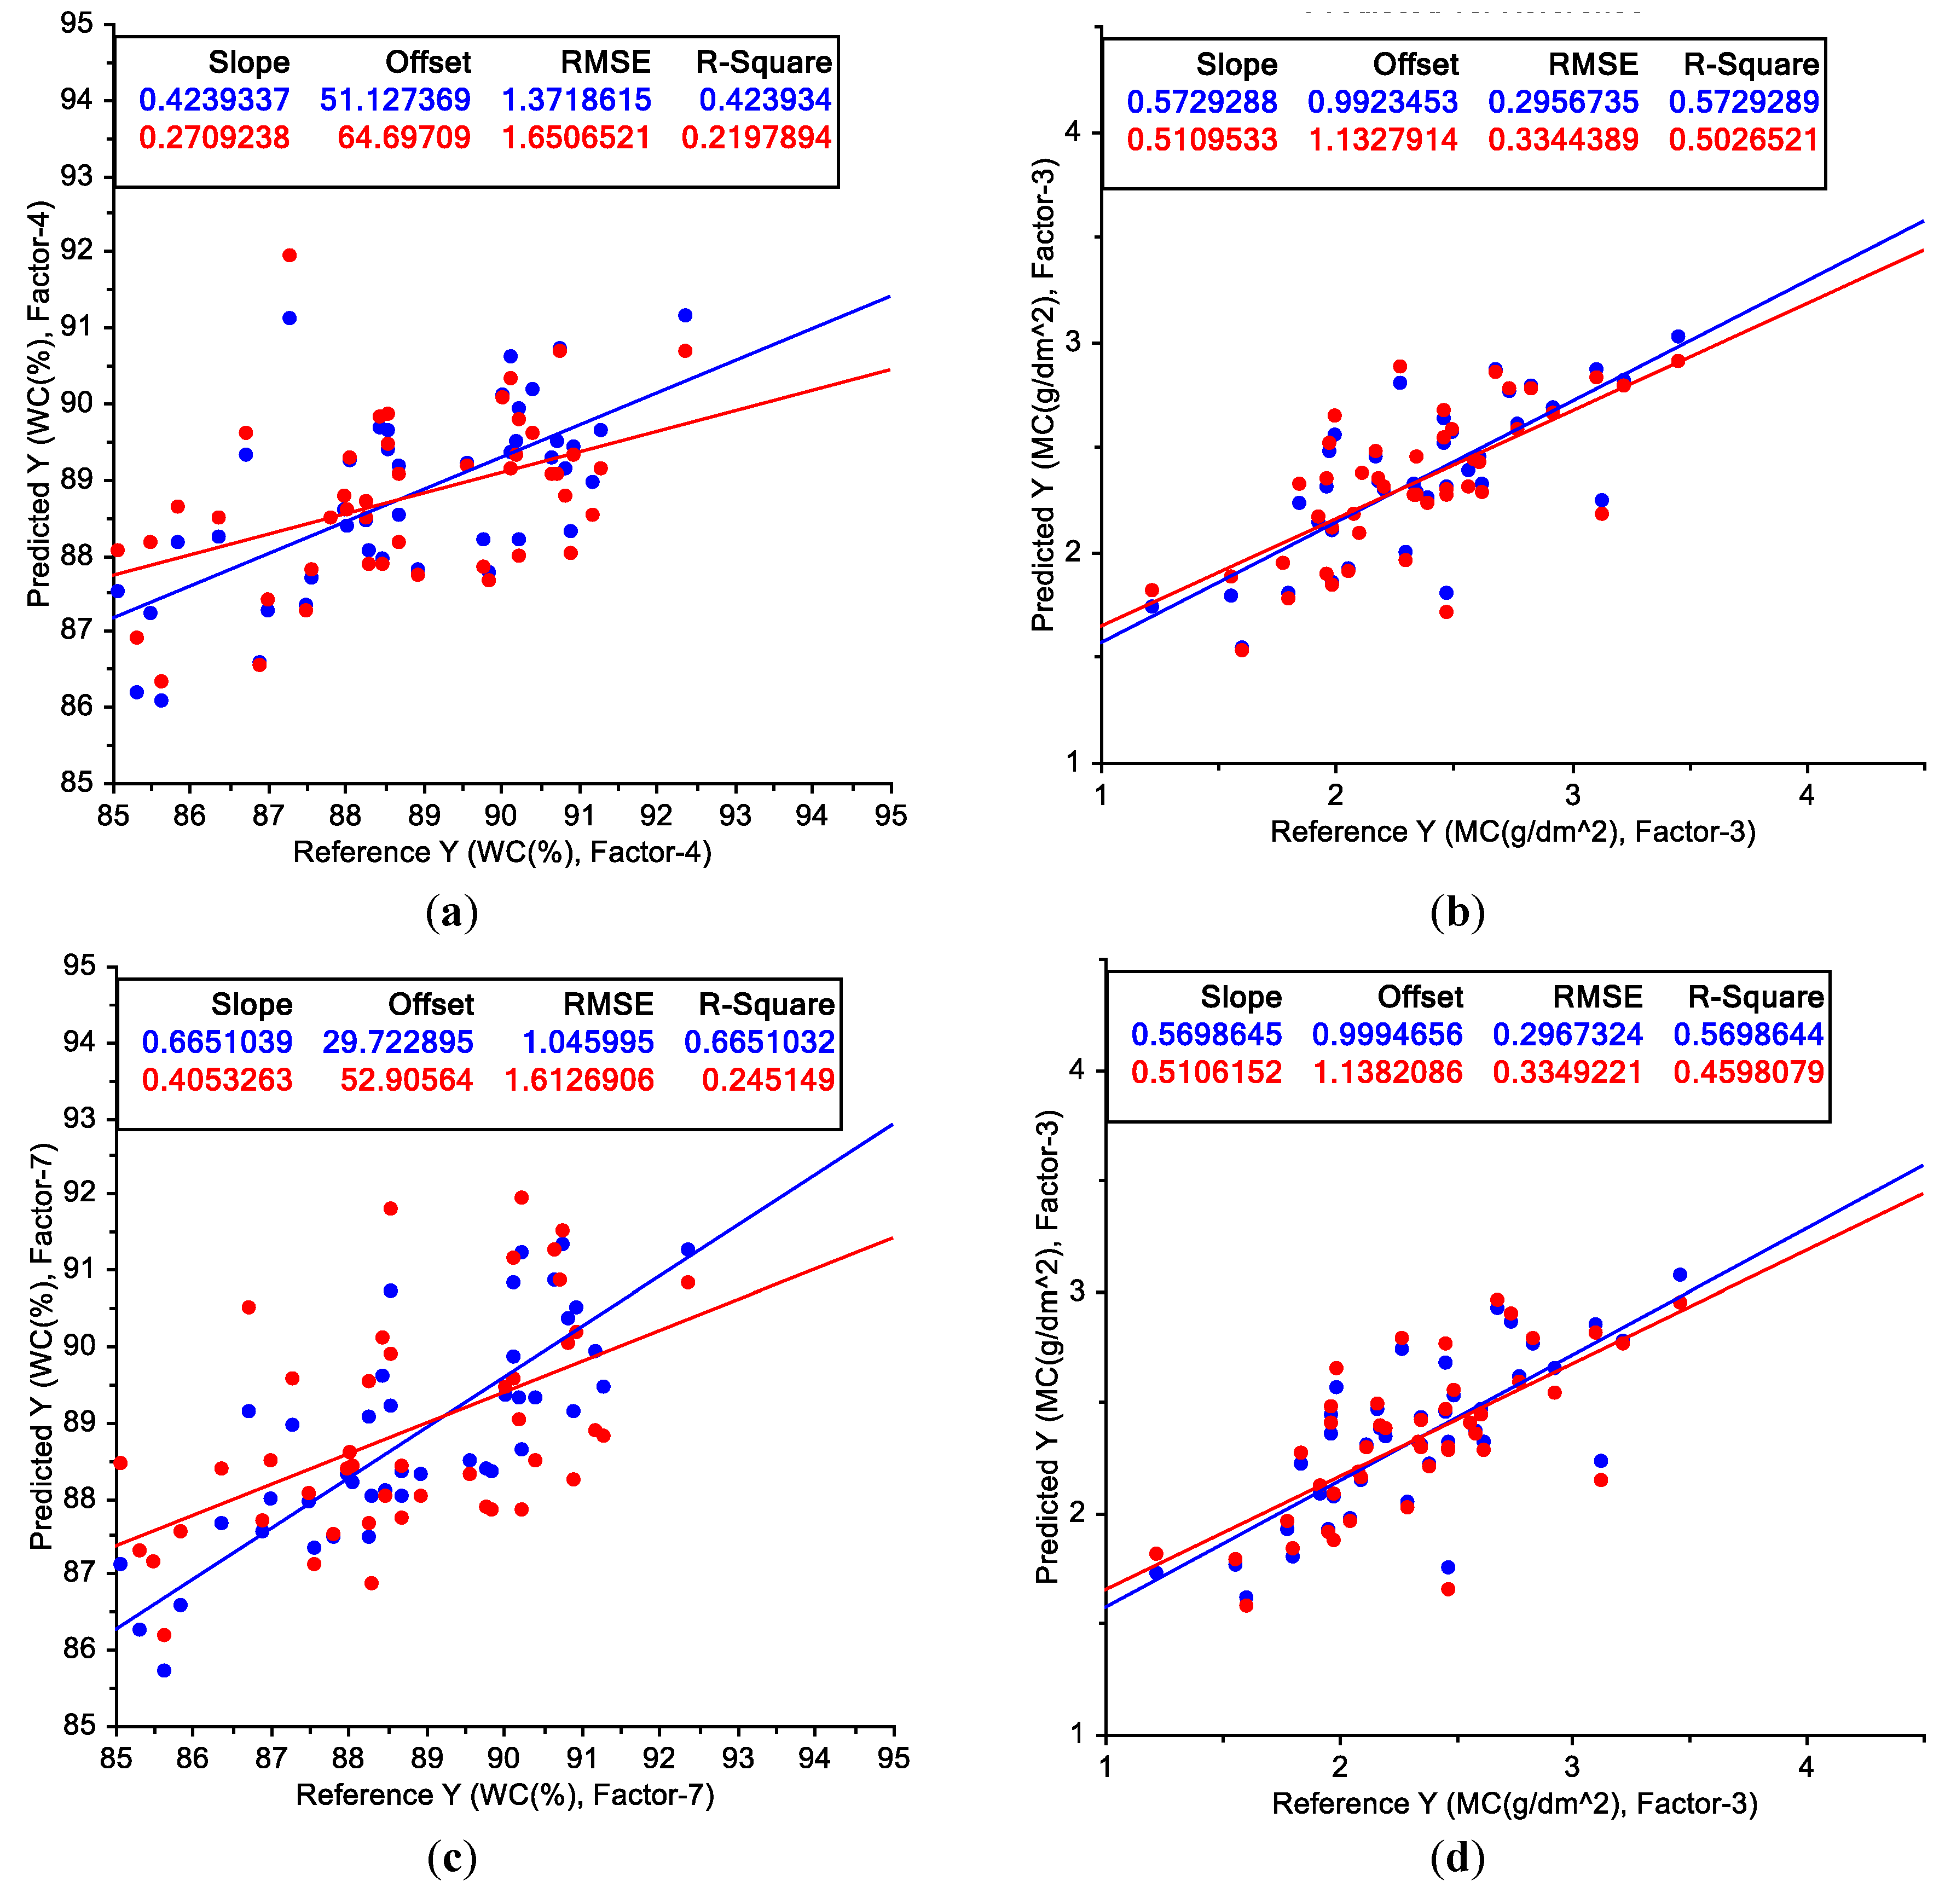
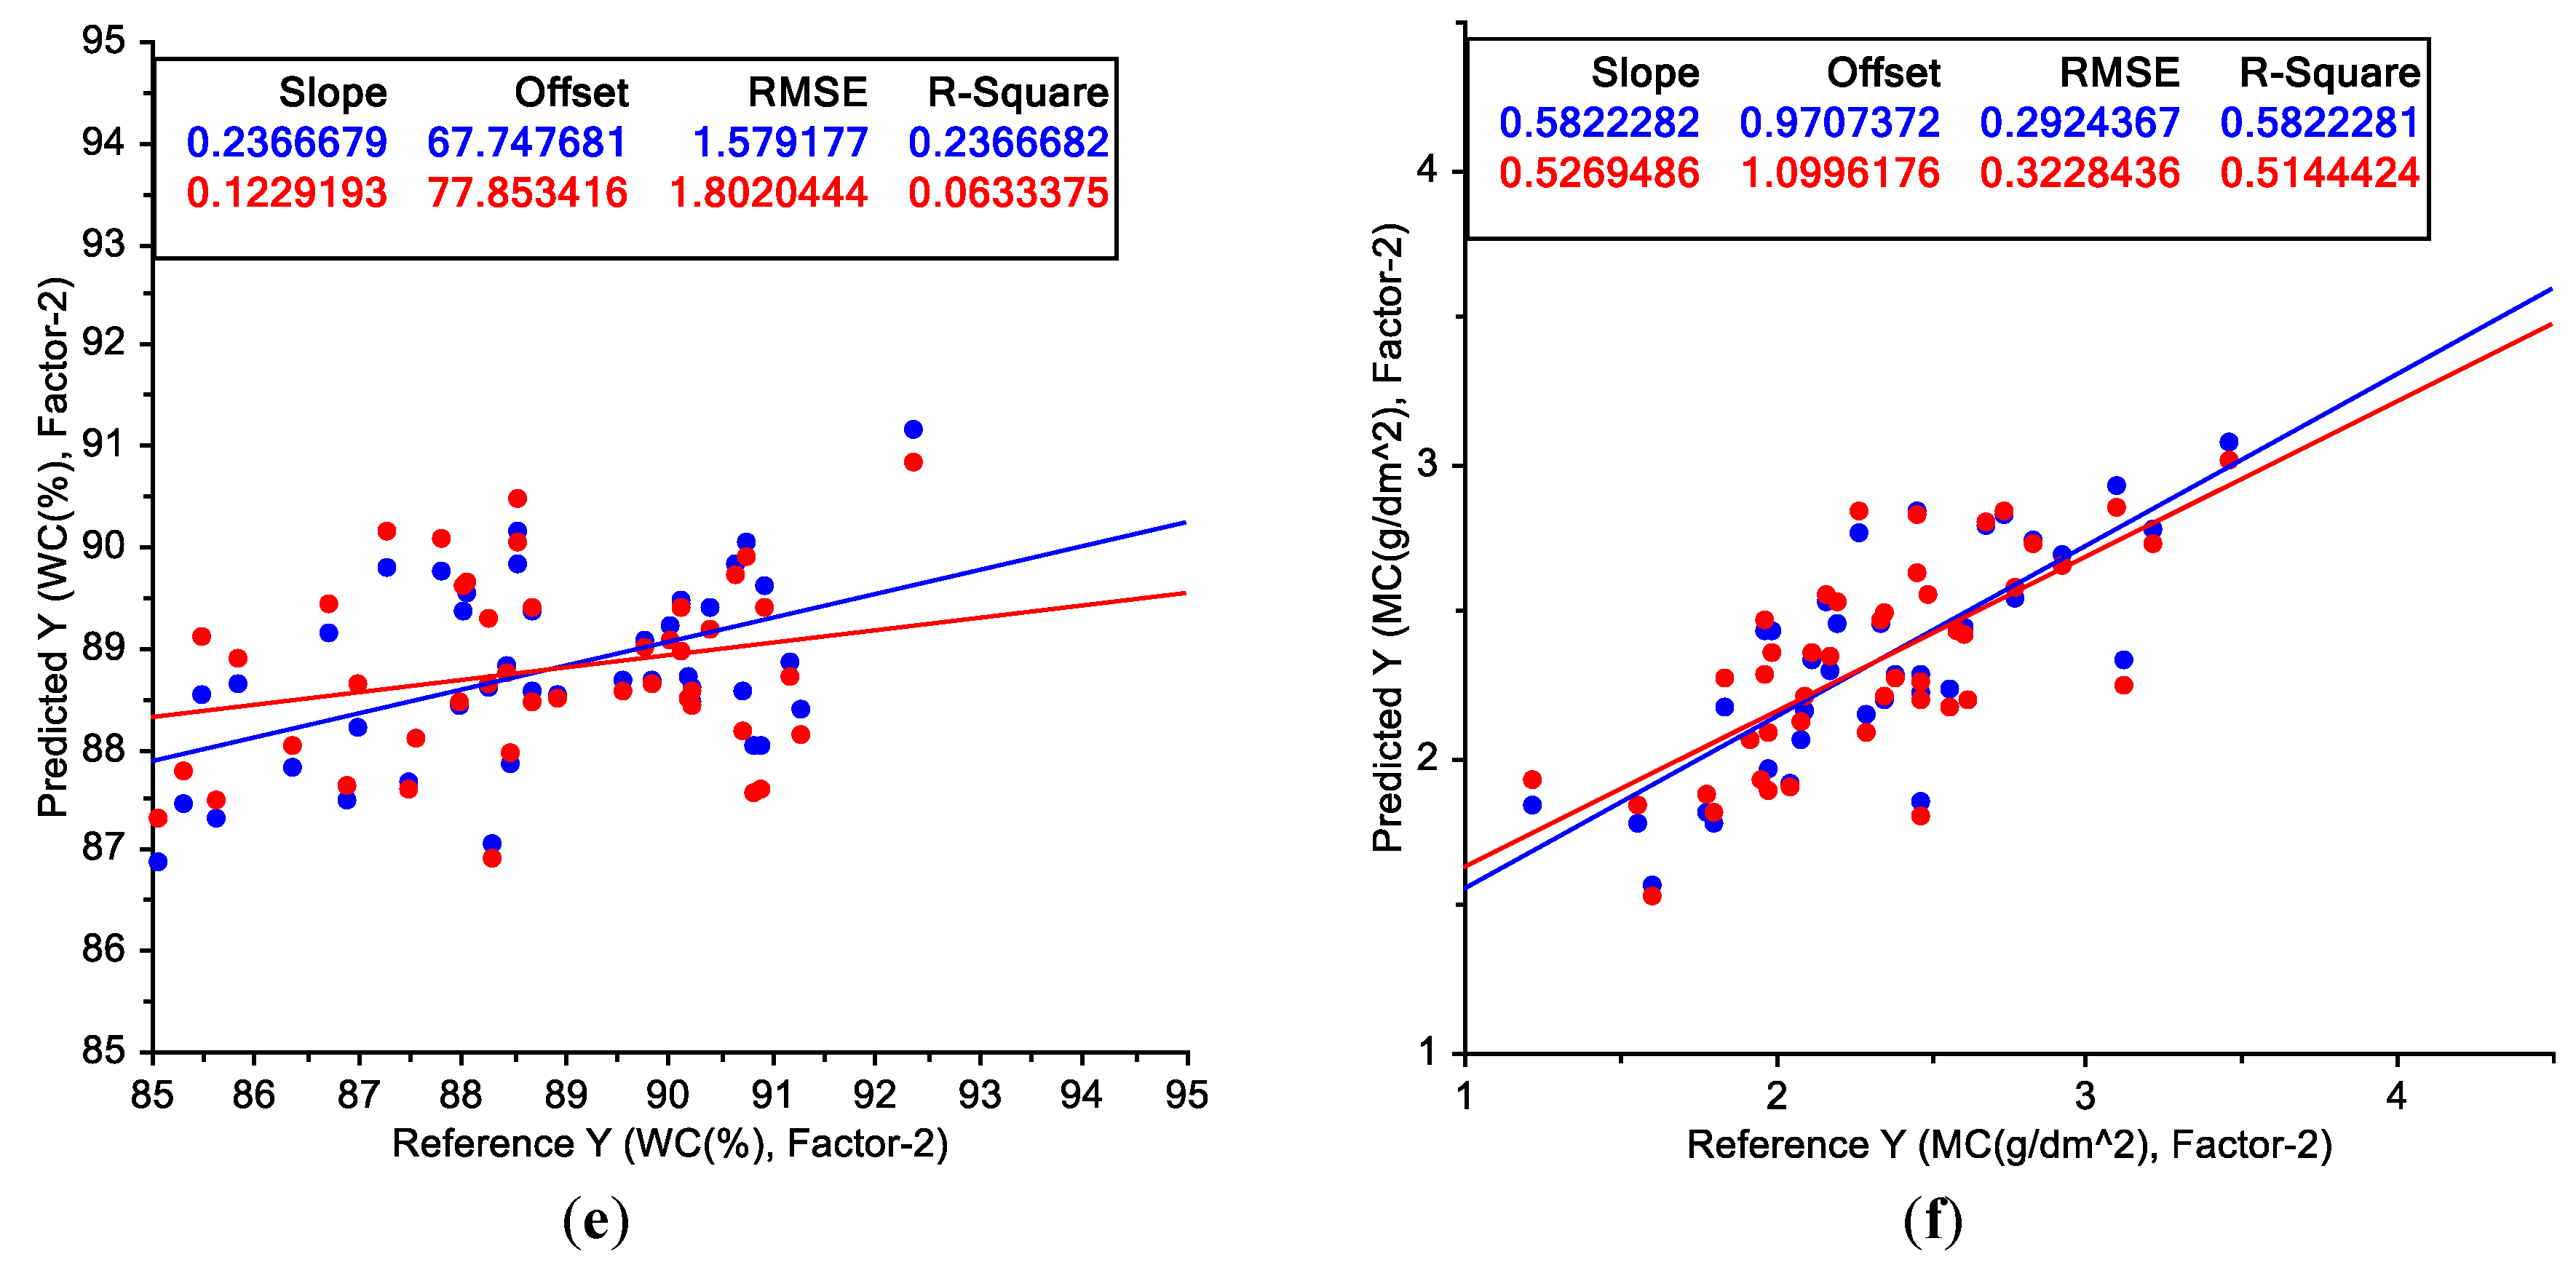
The largest coefficient of determination of PLS regression for the wavelength and water status was obtained by the analysis of DIFF and MC, as shown in Figure 7f, where the coefficient of determination for calibration is R 2 = 0.5822 and that for the validation is r 2 = 0.5144 . In addition, the two wavelength bands are the only two factors adopted in this model. The use of fewer factors will ensure model stability in practical applications. This is because the use of fewer factors will decrease the noise that always accompanies wavelength acquisition. The PLS regression results show a higher coefficient of determination for MC than that for WC.
Some conclusions can be drawn in terms of the effect of hyperspectral data preprocessing before PLS regression: (1) Inverse-logarithm relative reflectance transformation helped improve the model performance, enabling a higher coefficient of determination and lower RMSE compared with RAW in WC modeling. Furthermore, the opposite effect was observed in MC modeling. (2) The first derivative of relative reflectance transformation degraded the model performance, leading to a lower coefficient of determination and higher RMSE compared with RAW in WC modeling. Meanwhile, the opposite effect was observed in MC modeling. The aforementioned aspects are considered the differences between WC and MC in terms of physics and the applicability of the data processing methods.

3.4. Autocorrelation Coefficient of Wavelength Bands

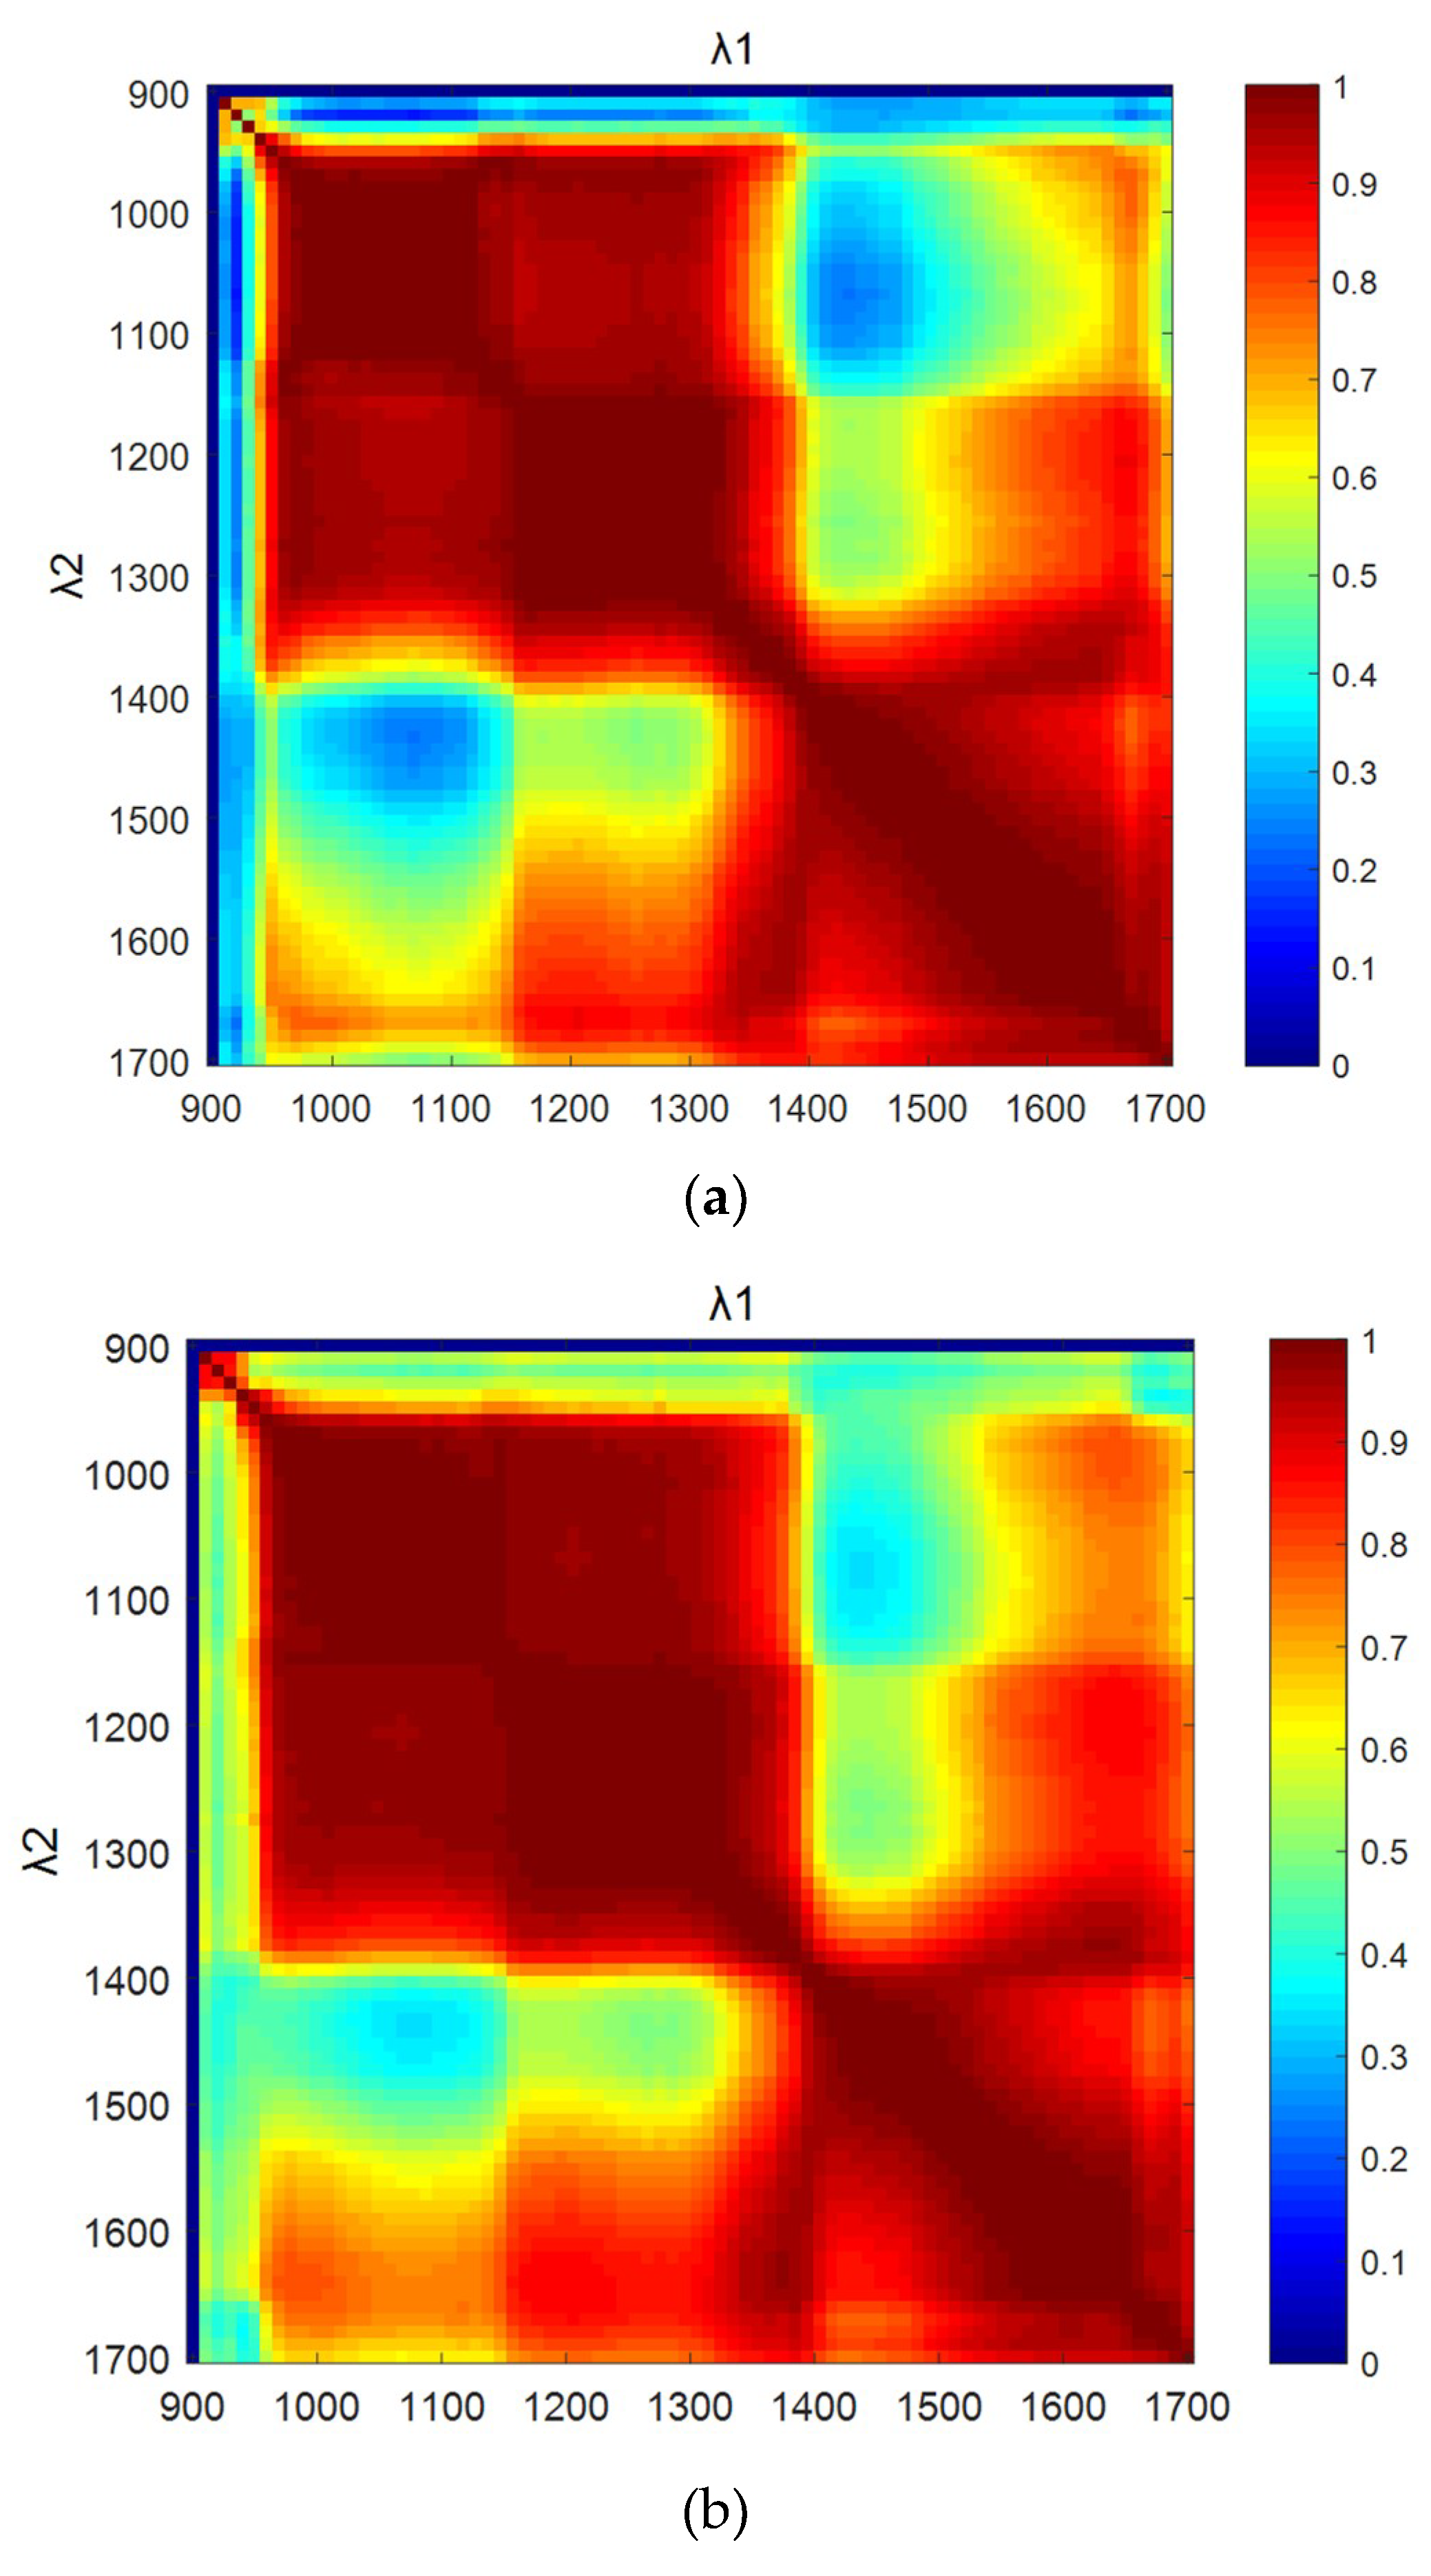
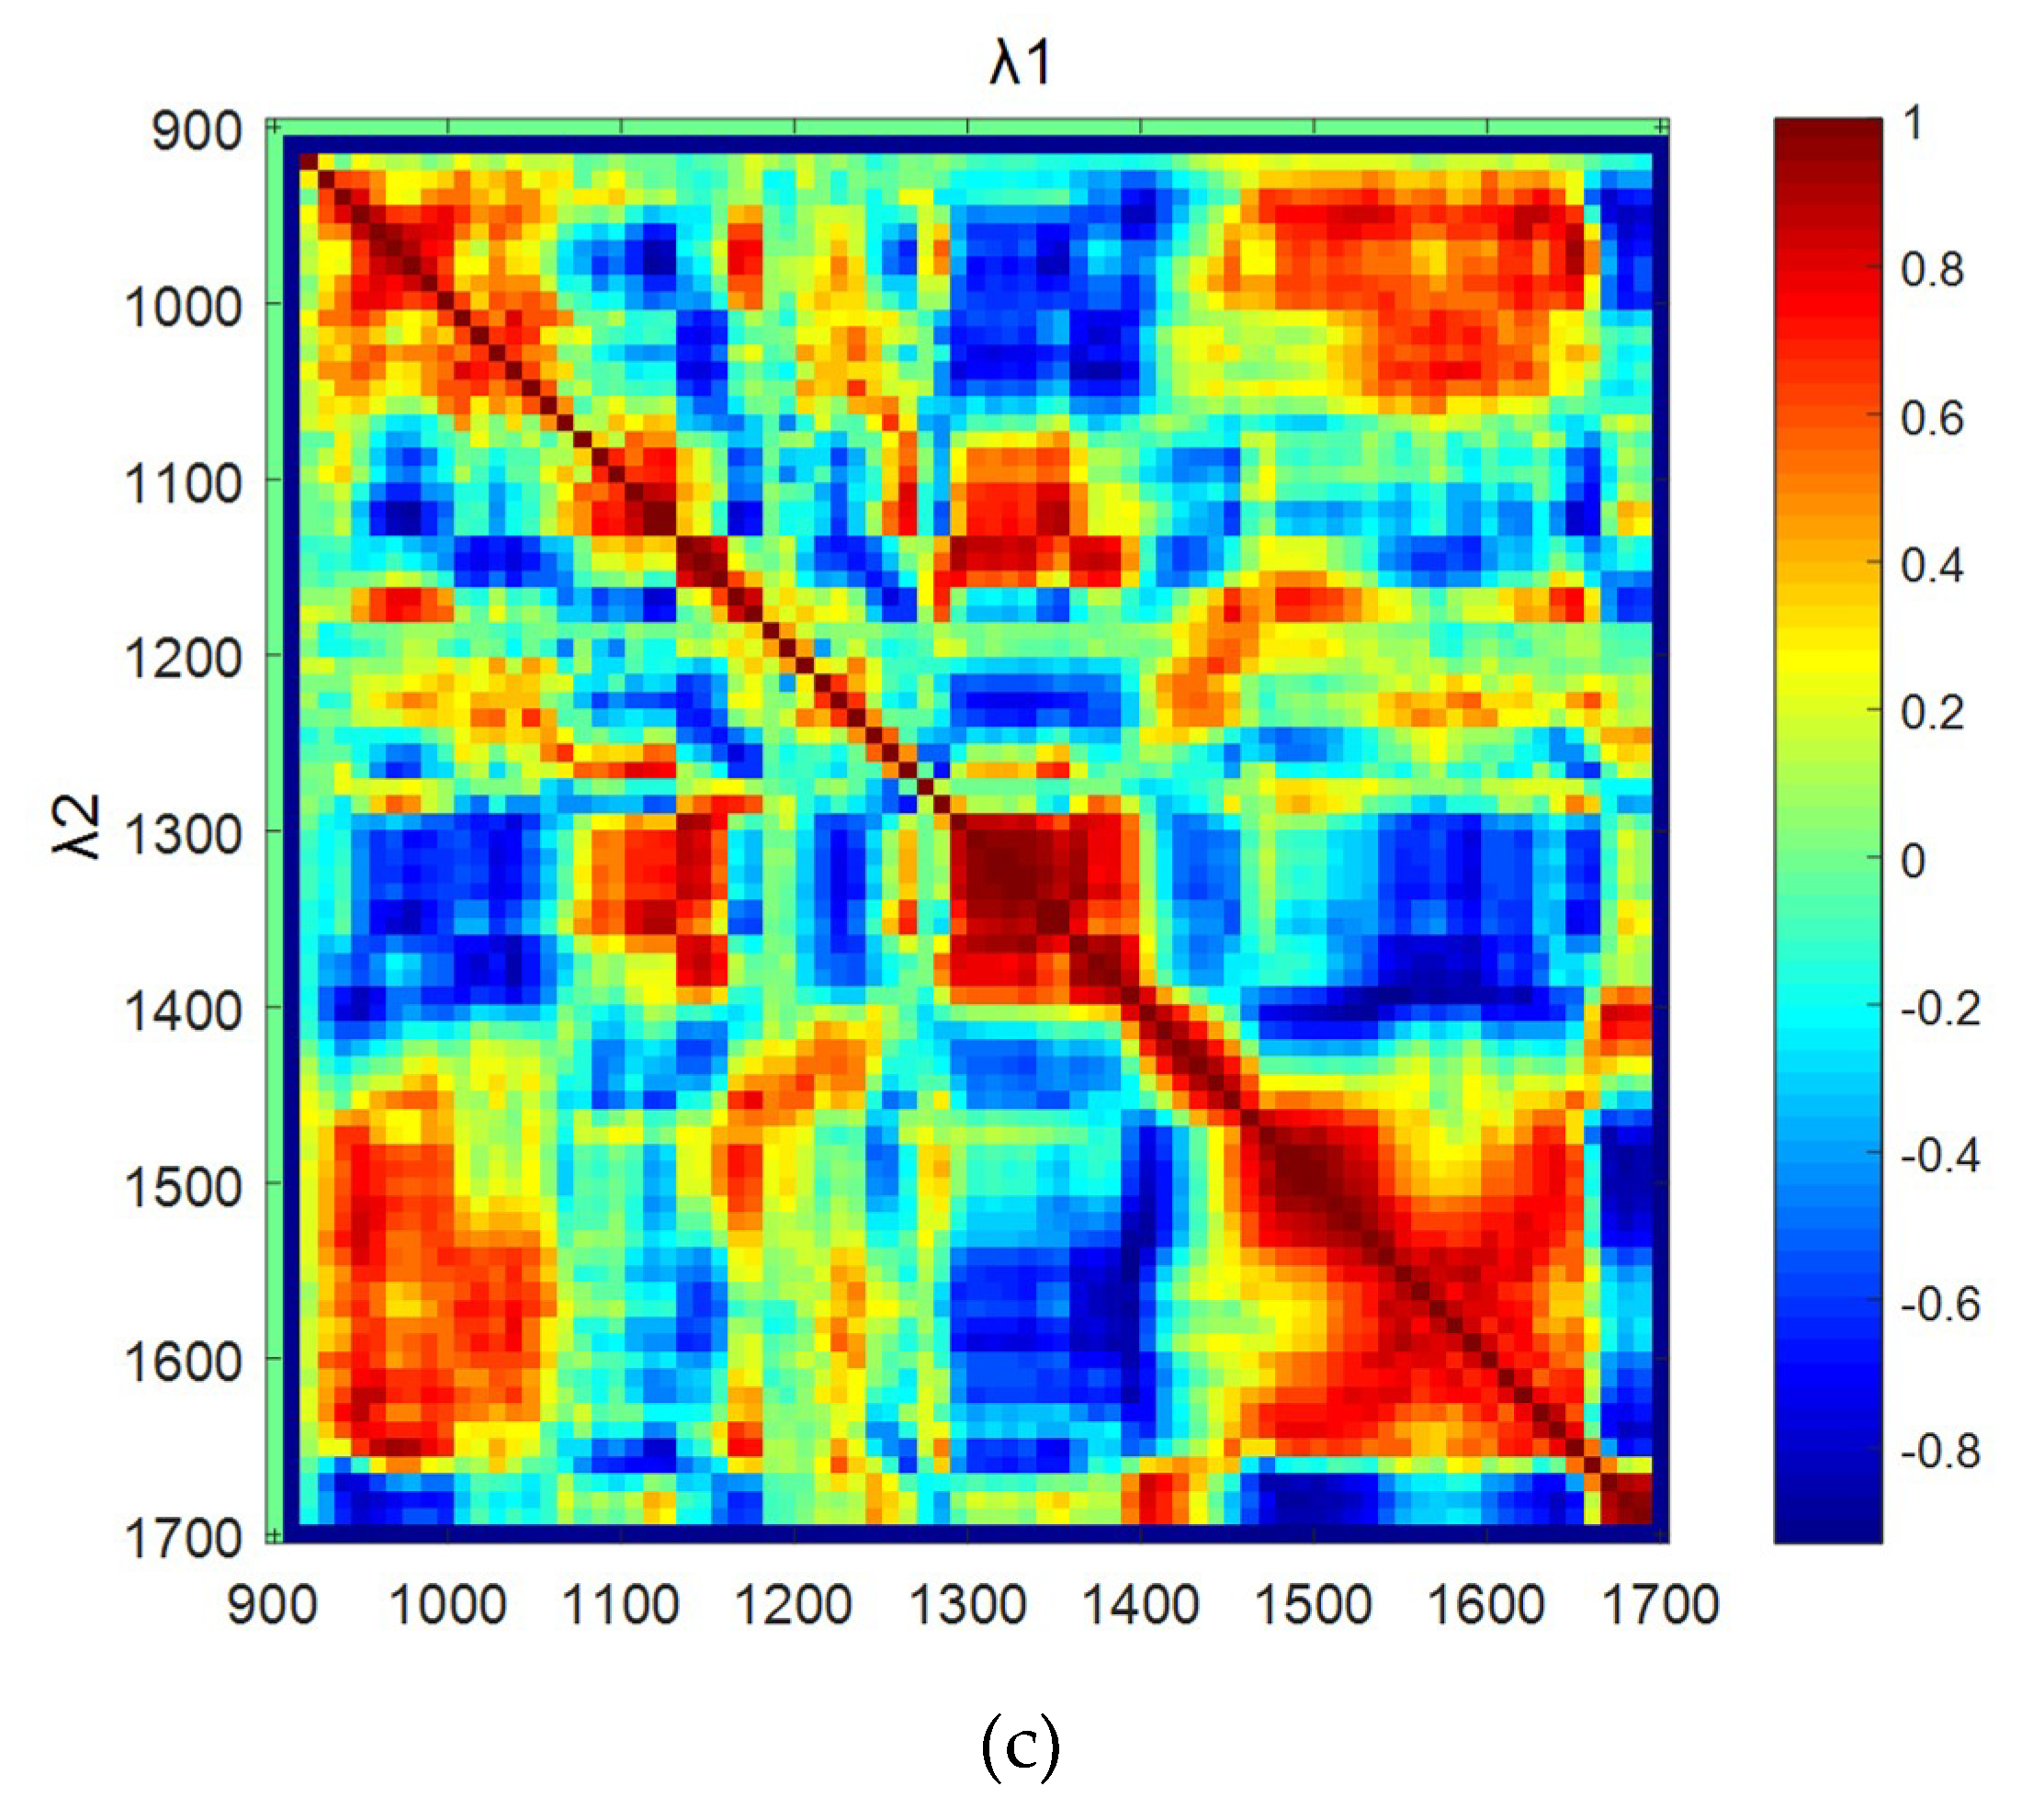
Hyperspectral data include extensive image and spectral information. However, not only do these spectra contain a considerable amount of redundant information, but a strong autocorrelation exists among different wavelength bands. To reasonably increase the amount of useful information and optimum index factors for modeling, a spectral autocorrelation calculation was employed to assist in selecting the characteristic spectra (Figure 8). For RAW and LOG, two strong autocorrelation zones are observed in the wavelength bands of 950–1350 nm and 1400–1700 nm. In contrast with the autocorrelation coefficient of RAW, the inverse-logarithm processing enhances the correlation between the wavelength bands. Nevertheless, first-order differential processing decreases the correlation between wavelengths in most wavelength bands.

3.5. Application of NDVI and TBI to Wavelength and Water Status

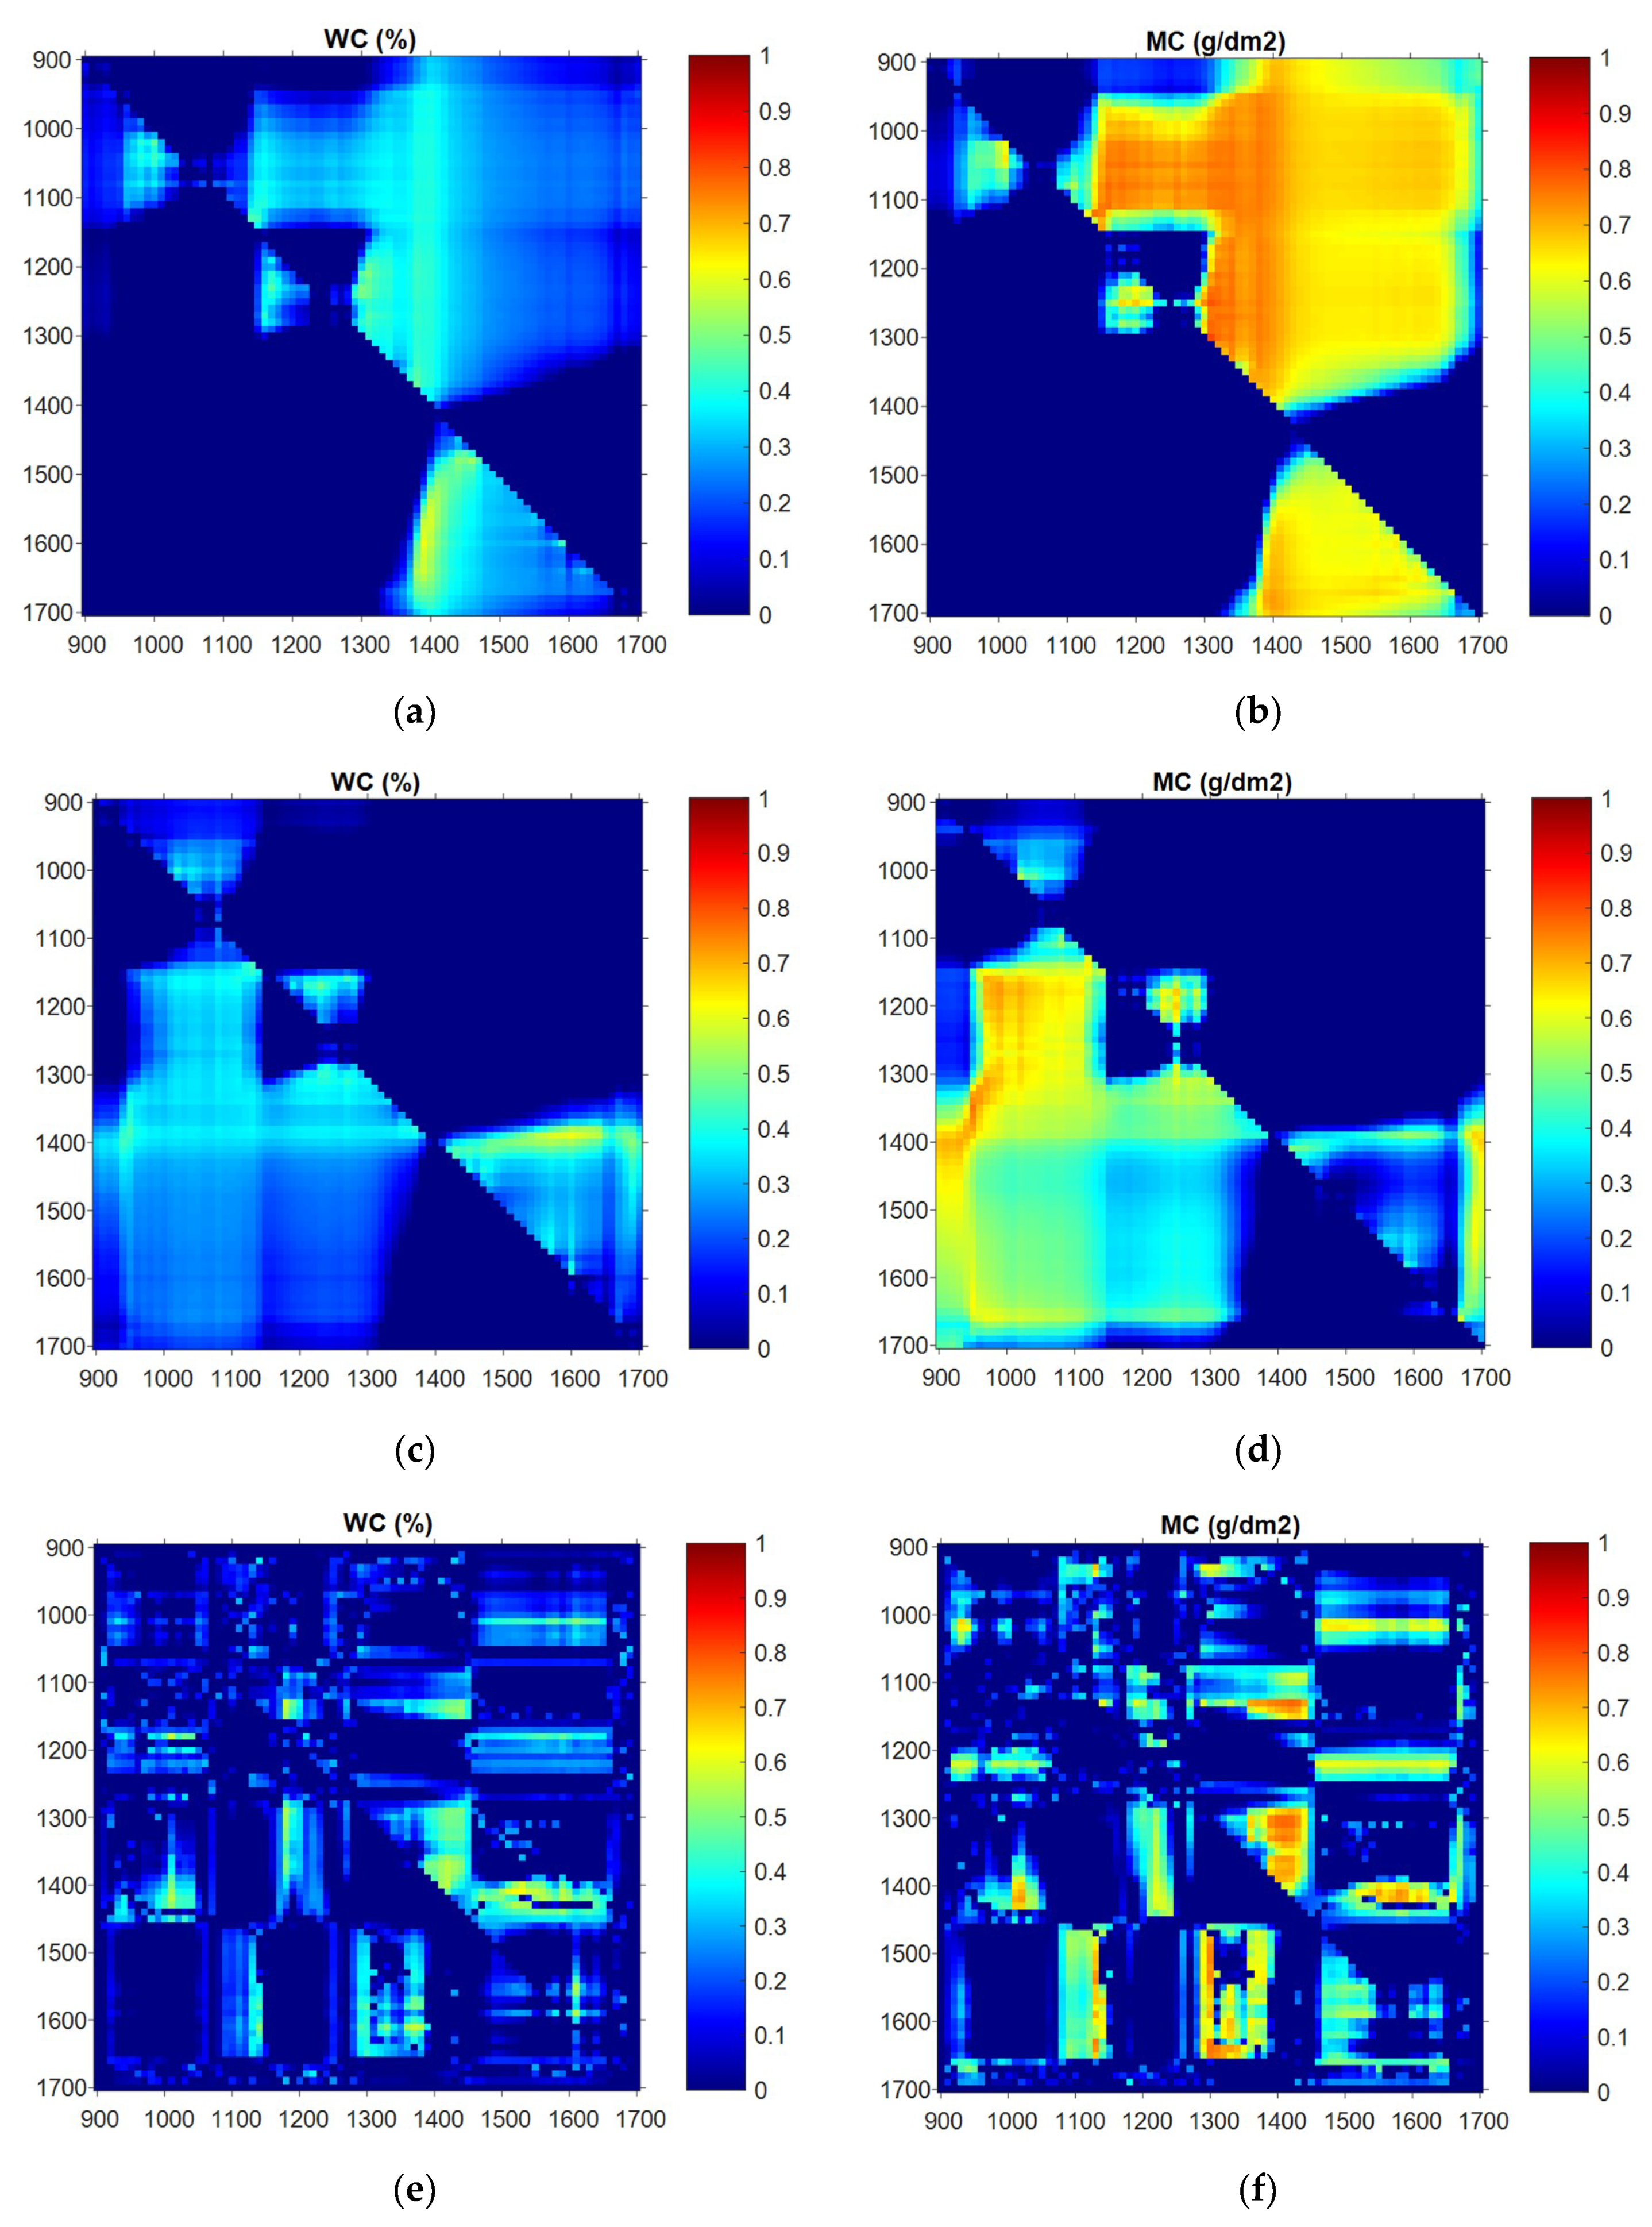
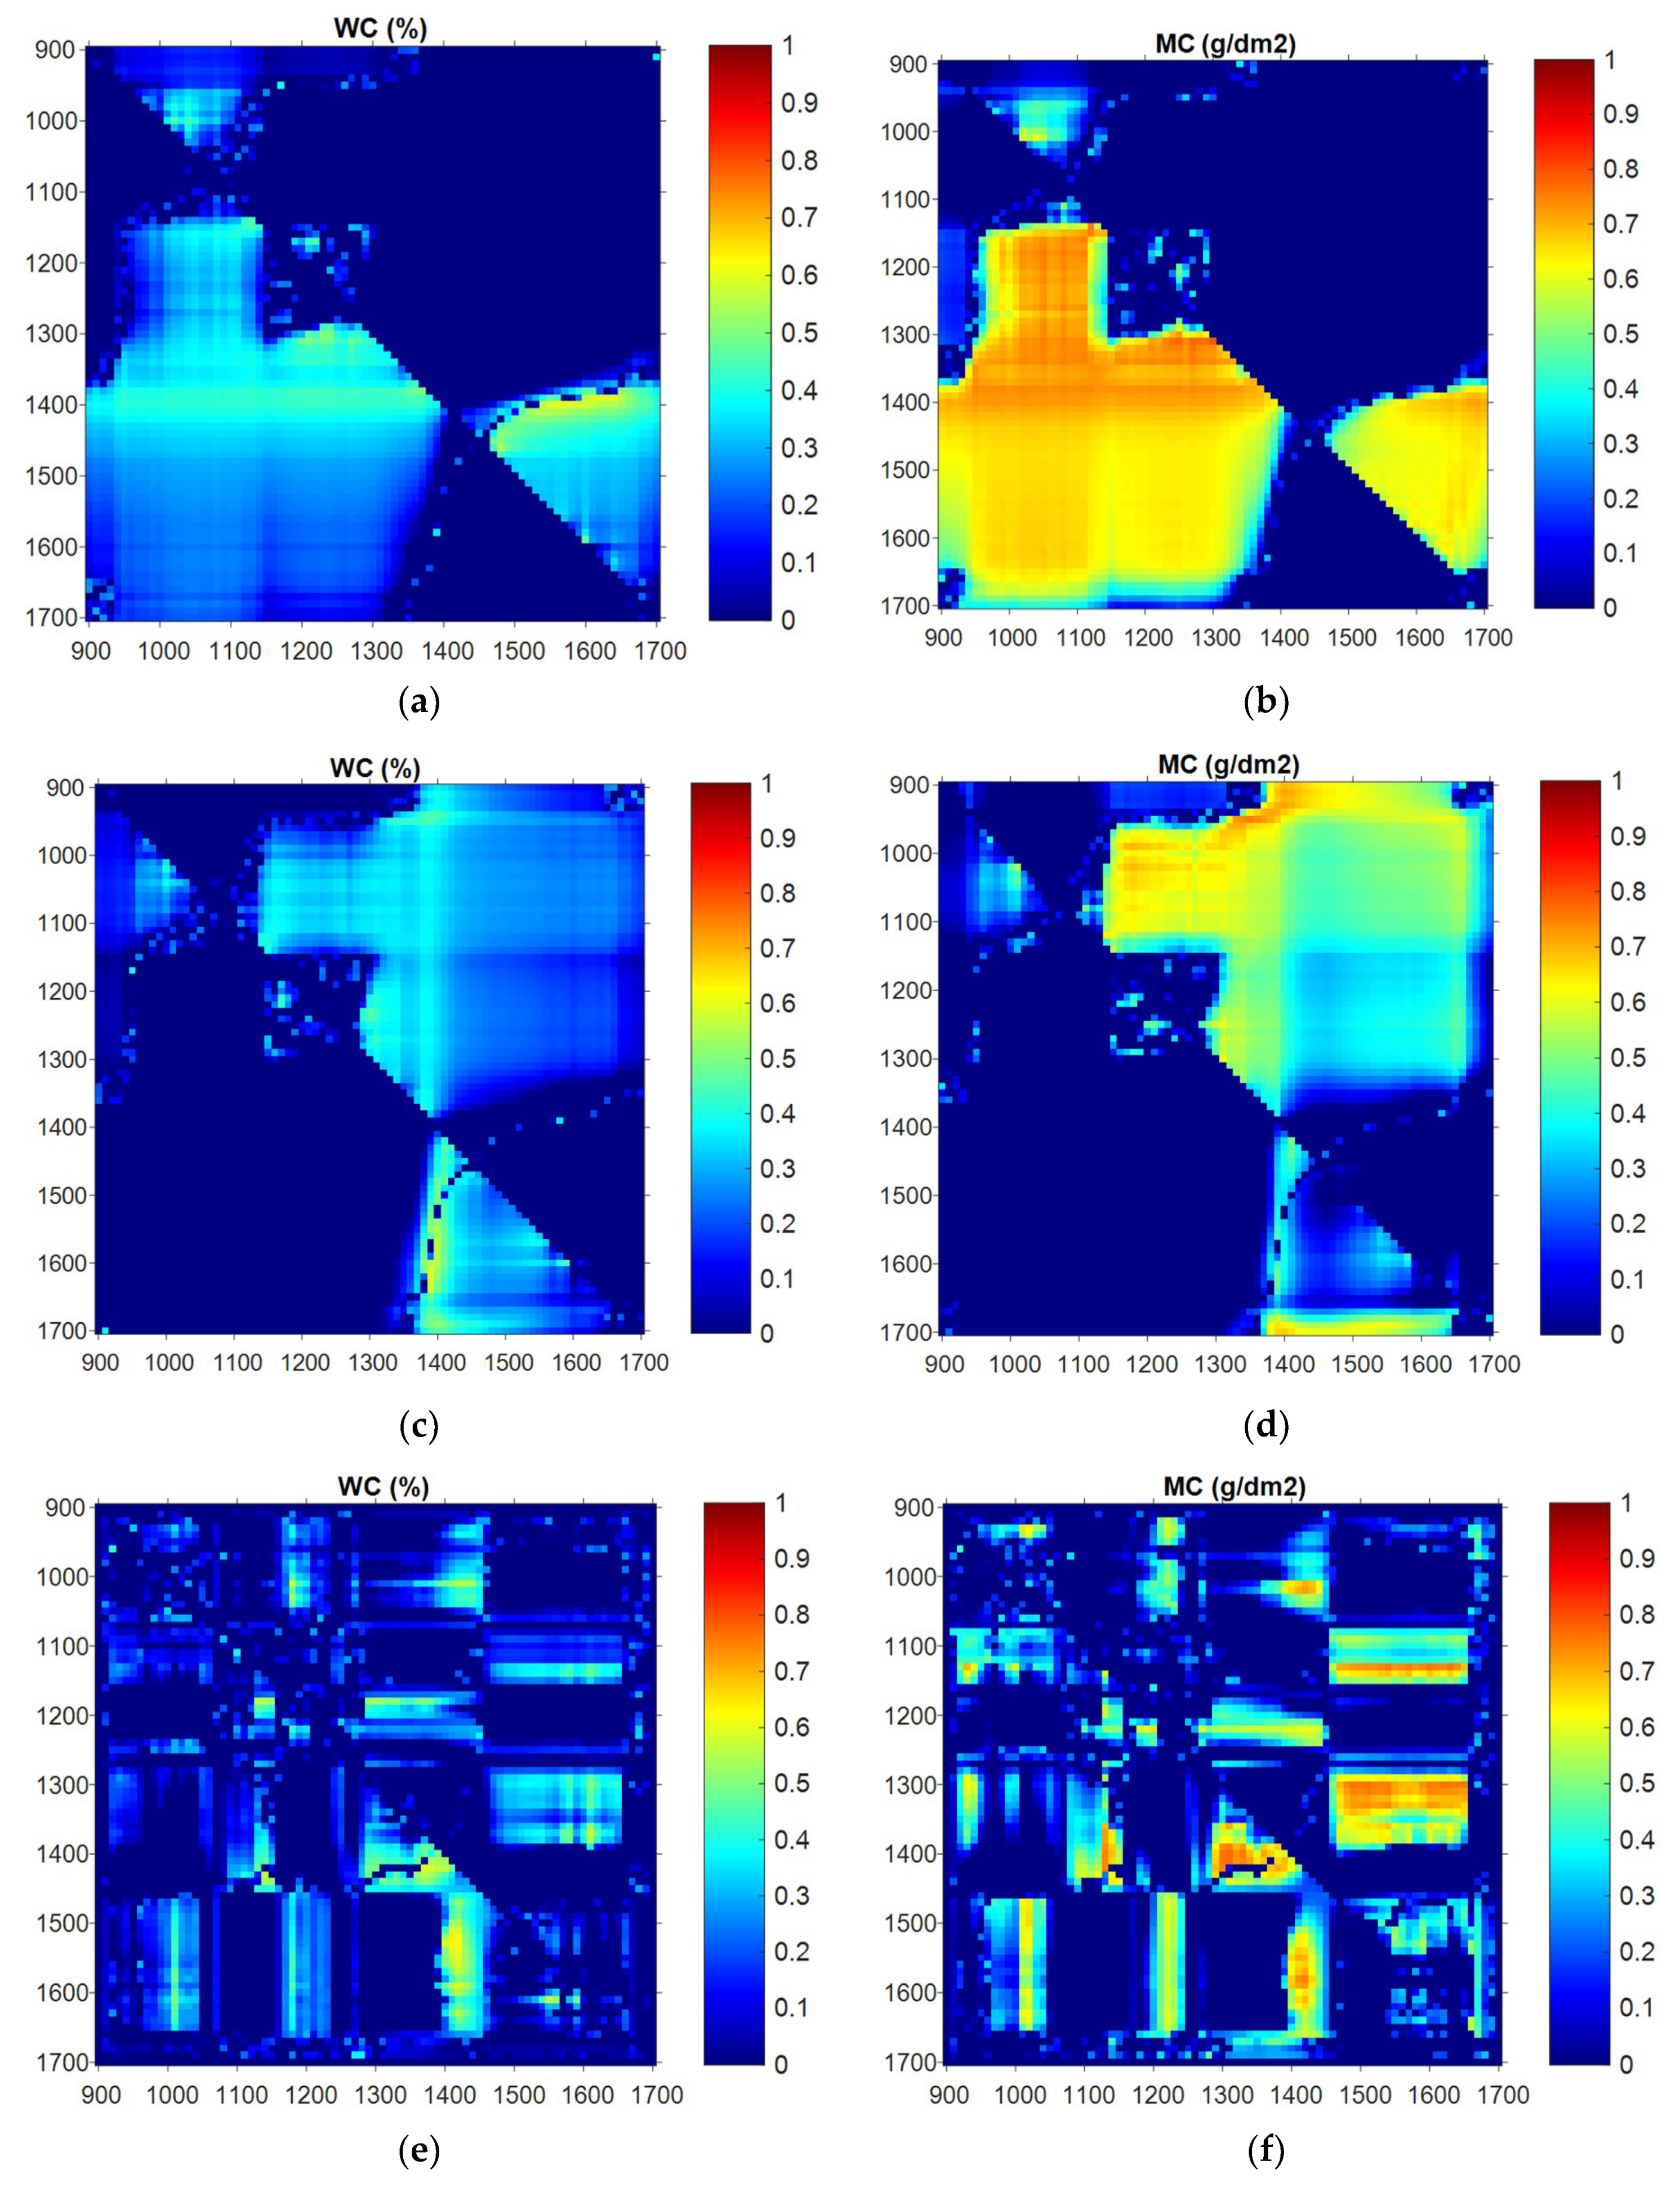
For leaf water status assessment, studies have been conducted to establish a regression model using different wavelength bands. In addition to the multiple-band models employed in some studies [14,29,30,31], the two-band model has been the focus of many studies in applications with different mathematical expressions, where λ 1 / λ 2 [6,14,15,16,17,32] and ( λ 1 λ 2 ) / ( λ 1 + λ 2 ) [6,18,19,20,33,34] have been employed. In the present experiment, NDVI and TBI were adopted to establish the regression model. The results are shown in Figure 9 and Figure 10, respectively.

3.5.1. NDVI

With regard to WC assessment, a region corresponding to a higher coefficient of determination is observed with λ 1 near 1400 nm and with λ 2 at approximately 1450–1650 nm (Figure 9). Better NDVI regression model performance is obtained with LOG, where the model is y = 87.995 x + 85.649 , the coefficient of determination for calibration is R 2 = 0.6080 , the coefficient of determination for validation is r 2 = 0.3696 , and the root-mean-squared error is R S M E = 1.44 (Table 2) at the wavelengths λ 1   = 1370   nm   and   λ 2 = 1610   nm . For MC assessment, better NDVI (Figure 9) regression model performance is obtained with RAW, when λ 1   = 1300   nm   and λ 2 = 1310 nm, where the model is y = 317.11 x 0.3247 ( R 2 = 0.8042 , r 2 = 0.6467 , RSME = 0.2689 ).

3.5.2. TBI

Compared with NDVI, almost the same characteristic wavelength bands were obtained for the TBI of the wavelength and water status (Figure 10). Better performance of the TBI regression model for WC was obtained with DIFF, where the model is y = 56.752 x + 109.12 , the coefficient of determination for calibration is R 2 = 0.6369 , the coefficient of determination for validation is r 2 = 0.4057 , and the root-mean-square error is RMSE = 1.39 at the wavelengths λ 1   = 1620   nm   and   λ 2 = 1390   nm . Better performance of the TBI regression model for MC was observed with RAW at wavelengths λ 1   = 1310   nm and λ 2 = 1300   nm , where the model is y = 0.0202 x + 4.7953 ( R 2 = 0.7886 , r 2 = 0.6389 , RMSE = 0.2720 ).
Overall, for WC assessment, the spectral preprocessing affected the model accuracy to varying degrees. The best model was obtained using TBI with DIFF (Table 2). It is considered that the combination of first-order differential processing and TBI helped improve the model performance. For MC assessment, the best model performance was obtained using NDVI with RAW; LOG and DIFF preprocessing did not help improve the regression model performance.

3.5.3. Characteristic Wavelength Bands

Numerous studies have demonstrated that the wavelengths that are the most sensitive to leaf water status are in the 900–2500 nm range, which includes four water absorption bands for all angiosperm leaves around 970 nm, 1200 nm, 1400nm, and 1900 nm [2,8]. Nevertheless, owing to equipment limitations in the present experiment, wavelengths ranging from 1700 nm to 2500 nm were not addressed. Only several different characteristic wavelength bands in the 900–1700 nm range were employed to establish models based on spectral preprocessing for different water statuses (Table 2).
For WC assessment, one of the two characteristic wavelengths for NDVI or TBI was concentrated at 1390 nm, very close to 1400 nm, which is well known as the main water absorption band of the leaf [9]. Another characteristic wavelength was concentrated at 1600 nm, which is a wavelength band that is also often chosen by researchers. By using the wavelengths of 1600 nm and 819 nm, Hardinsky et al. [19] and Hunt and Rock [17] developed a normalized difference infrared index (NDII) model and moisture stress index (MSI) model for detecting variations in the leaf WC with different respective expressions. All of the above proved that the wavelengths around 1400 nm and 1600 nm have a strong correlation with leaf WC. However, on account of the different characteristics of the leaf itself, the measuring equipment, and other factors, the characteristic wavelength selection may be slightly offset in the actual application.
The best model for WC assessment was obtained in this experiment using TBI with DIFF and the 1410 nm and 1520 nm wavelengths. Similar results were demonstrated by Cao et al. [35]. To identify the best indices for relative water content (RWC) and equivalent water thickness (EWT) based on the first-derivative reflectance, they chose the wavelengths of 1415 nm and 1530 nm for RWC by using the same NDVI expression, and 1530 nm and 1895 nm for EWT by using a simple ratio expression.
For MC assessment, several characteristic wavelengths exist for NDVI or TBI models with high performances in this experiment. They are concentrated around 950 nm, 1300 nm, 1350 nm, and 1400 nm. The wavelength bands of 950 nm and 1400 nm are very close to or equal the central wavelengths of the water absorption bands of 970 nm and 1400 nm [2,8]. It is well explained why these two bands are chosen as characteristic wavelengths for high performance modeling. Regarding the wavelength of 1350 nm, in 2007, Jose et al. developed a simple ratio vegetation index using wavelengths of 1070 and 1340 nm, and a moisture stress index using wavelengths of 870 and 1350 nm, to detect the MC for grape leaves, and both quantities exhibited excellent correlations with MC, with R > 0.90 [36]. It is known that obvious high reflectance occurs at 1300 nm for a leaf with sufficient moisture [37]. However, few studies have adopted 1300 nm as the characteristic wavelength band in a model, except Seelig et al. [38], who reported the plant WC parameter and the remote sensing leaf water index by using 1300 nm and 1450 nm wavelengths.
Furthermore, many studies have focused on estimating the leaf water status using a leaf dehydration dataset. The difference in leaf water status can assist in easily selecting the wavelength bands that correspond to strong absorption by water. However, in the present experiment, all leaf samples were obtained under normal conditions with sufficient moisture but without water stress. The fewer differences in leaf water status among the samples resulted in the decreased influence of water absorption on wavelength, duo to which the wavelengths of 1300 nm and 1350 nm, both of which are not water absorption bands, were chosen in this experiment. Meanwhile, the smaller leaf water status difference makes modeling much more difficult.
In this experiment, the best model for MC assessment was attained using NDVI with RAW and 1300 nm and 1310 nm wavelengths. Previous studies have shown that the NIR plateau between 800 nm and 1300 nm, as well as water absorption bands above 1300 nm, are common characteristics of reflectance spectra of all healthy green plants. The high reflectivity in the NIR region of 800 nm to 1300 nm is due to the porous plant leaf structure (tissues and cells), whereas the low reflectivity above 1300 nm is caused by water absorption [3,39]. The 1300 nm wavelength is the dividing line of the histological structures and the specific components of plant leaves, both of which are the main factors affecting the reflectance spectral characteristics of the leaves. That causes the reflectance of tomato leaf to start changing from the reflectivity peak to the absorption valley at 1300 nm. This may also have resulted in 1300 nm and 1310 nm being adopted in modeling as the characteristic wavelength bands. In addition, a higher autocorrelation coefficient exists in the 1300 nm and 1310 nm wavelengths (Figure 8). Although this combination is not suitable for a model, non-linear stretching by using NDVI enhances the contrast ratio of these two bands, which may assist in modeling.

4. Conclusions

Irrigation management is an important issue in tomato cultivation, especially in plant factories. Accurate and timely tomato leaf water status assessment is essential for determining appropriate irrigation management. The aim of this study is to establish an approach to obtain tomato leaf water status in real time by using HSI technology. The results demonstrate the strong potential of using HSI technology for tomato leaf water status monitoring in plant factories, the application of MC assessment showed higher model performance compared with WC, and the best model for MC assessment was observed with NDVI–RAW in this study. In a subsequent study, other formulas will be used to achieve a higher prediction accuracy in tomato leaf water status assessment. To ensure the accuracy of that assessment, the optimal combination with the fewest wavelength bands will be selected. Accordingly, the applicability of the model for assessing different plants under various environmental conditions will be enhanced by directly using a portable hyperspectral camera. This approach is expected to reduce equipment costs and improve equipment stability in the development of visualization equipment in the future.

Author Contributions

Conceptualization, T.Z., A.N., Y.I. and H.U.; methodology, T.Z., A.N., Y.I. and H.U.; software, T.Z.; validation, T. Z. and A.N.; formal analysis, T.Z.; investigation, T.Z., A.N., Y.I. and H.U.; resources, T.Z., A.N., Y.I. and H.U.; data curation, T.Z., A.N., Y.I. and H.U.; writing—original draft preparation, T.Z., and A.N.; writing—review and editing, T.Z., and A.N.; visualization, T.Z., A.N., Y.I. and H.U.; supervision, T.Z., A.N., Y.I. and H.U.; project administration, A.N.; funding acquisition, T.Z., A.N., Y.I. and H.U. All authors have read and agreed to the published version of the manuscript.

Funding

This research received no external funding. This work were supported by Cabinet Office, Government of Japan, Cross-ministerial Strategic Innovation Promotion Program (SIP), and MAFF with the funding number is ‘16932971’.

Acknowledgments

We would like to thank Hiroki KURIBARA and Hikaru OKUCHI (NARO) for support in the implementation of this project.

Conflicts of Interest

The authors declare no conflict of interest. The funders had no role in the design of the study; in the collection, analyses, or interpretation of data; in the writing of the manuscript, or in the decision to publish the results.

References

  1. Amigo, J. Data Handling in Science and Technology. Hyperspectral Imaging; Elsevier: Amsterdam, The Netherlands, 2019; Volume 32, ISBN 978-0444639776. [Google Scholar]
  2. Pu, R. Hyperspectral Remote Sensing: Fundamentals and Practices; CRC Press: Boca Raton, FL, USA, 2017. [Google Scholar] [CrossRef]
  3. Zhao, T.; Nakano, A. Agricultural Product Authenticity and Geographical Origin Traceability. Jpn. Agric. Res. Q. JARQ 2018, 52, 115–122. [Google Scholar] [CrossRef] [Green Version]
  4. Heuvelink, E.; Kierkels, T. Plant Physiology in Greenhouses; Horti-Text: Woerden, The Netherlands, 2015; p. 127. [Google Scholar]
  5. Zhang, J.; Xu, Y.; Yao, F.; Wang, P.; Guo, W.; Li, L.; Yang, L. Advances in estimation methods of vegetation water content based on optical remote sensing techniques. Sci. China Technol. Sci. 2010, 53, 1159–1167. [Google Scholar] [CrossRef]
  6. Yi, Q.; Bao, A.; Qi, W.; Zhao, J. Estimation of leaf water content in cotton by means of hyperspectral indices. Comput. Electron. Agric. 2013, 90, 144–151. [Google Scholar] [CrossRef]
  7. Danson, F.M.; Bowyer, P. Estimating live fuel moisture content from remotely sensed reflectance. Remote Sens. Environ. 2004, 92, 309–321. [Google Scholar] [CrossRef]
  8. Jabbari, E.; Kim, D.H.; Lee, L.P. Handbook of Biomimetics and Bioinspiration: Biologically Driven Engineering of Materials, Processes, Devices, and Systems; World Scientific Publishing Company: Singapore, 2014; p. 1462. [Google Scholar]
  9. Tong, Q.; Zhang, B.; Zheng, L. Hyperspectral Remote Sensing; Higher Education Press: Beijing, China, 2006. [Google Scholar]
  10. Zhao, T.; Komatsuzaki, M.; Okamoto, H.; Sakai, K. Cover Crop Nutrient and Biomass Assessment System Using Portable Hyperspectral Camera and Laser Distance Sensor. Eng. Agric. Environ. Food 2010, 3, 105–112. [Google Scholar] [CrossRef]
  11. Ting, H.; Jing, W.; Zongjian, L.; Ye, C. Spectral features of soil moisture. Acta Pedol. Sin. 2006, 43, 1027–1032, (In Chinese with English abstract). [Google Scholar]
  12. Zheng, Y.; Zhang, T.; Zhang, J.; Chen, X.; Shen, X. Influence of Smooth, 1st Derivative and Baseline Correction on the Near-Infrared Spectrum Analysis with PLS. Spectrosc. Spectr. Anal. 2004, 1546–1548. [Google Scholar]
  13. Cloutis, E.A. Hyperspectral geological remote sensing: Evaluation of analytical techniques. Int. J. Remote Sens. 1996, 17, 2215–2242. [Google Scholar] [CrossRef]
  14. Peñuelas, J.; Filella, I.; Biel, C.; Serrano, L.; Save, R. The reflectance at the 950–970 nm region as an indicator of plant water status. Int. J. Remote Sens. 1993, 14, 1887–1905. [Google Scholar] [CrossRef]
  15. Jordan, C.F. Derivation of leaf area index from quality of light on the forest floor. Ecology 1969, 50, 663–666. [Google Scholar] [CrossRef]
  16. Zarco-Tejada, P.J.; Rueda, C.A.; Ustin, S.L. Water content estimation in vegetation with MODIS reflectance data and model inversion methods. Remote Sens. Environ. 2003, 85, 109–124. [Google Scholar] [CrossRef]
  17. Hunt, E.R.; Rock, B.N. Detection of changes in leaf water content using near and middle-infrared reflectance. Remote Sens. Environ. 1989, 30, 43–54. [Google Scholar]
  18. Deering, D.W. Rangeland Reflectance Characteristics Measured by Aircraft and Spacecraft Sensors. Ph.D. Thesis, Texas A&M University, College Station, TX, USA, 1978. [Google Scholar]
  19. Hardinsky, M.A.; Lemas, V.; Smart, R.M. The influence of soil salinity, growth form, and leaf moisture on the spectral reflectance of Spartina alternifolia canopies. Photogramm. Eng. Remote Sens. 1983, 49, 77–83. [Google Scholar]
  20. Gao, B.C. NDWI—A normalized difference water index for remote sensing of vegetation liquid water from space. Remote Sens. Environ. 1996, 58, 257–266. [Google Scholar] [CrossRef]
  21. Wang, L.; Qu, J.J. NMDI: A normalized multi-band drought index for monitoring soil and vegetation moisture with satellite remote sensing. Geophys. Res. Lett. 2007, 34, L20405. [Google Scholar] [CrossRef]
  22. Fensholt, R.; Sandholt, I. Derivation of a shortwave infrared water stress index from MODIS nearand shortwave infrared data in a semiarid environment. Remote Sens. Environ. 2003, 87, 111–121. [Google Scholar] [CrossRef]
  23. Higashide, T.; Oshio, T.; Nukaya, T.; Yasuba, K.; Nakano, A.; Suzuki, K.; Ohmori, H.; Kaneko, S. Light Transmission of a Greenhouse (NARO Tsukuba Factory Farm) Built to Meet Building and Fire Standards. Bull. Natl. Inst. Veg. & Tea Sci. 2013, 13, 27–33. [Google Scholar]
  24. Pu, R.L.; Gong, P. Hyperspectral Remote Sensing and Its Applications; Higher Education Press: Beijing, China, 2000. [Google Scholar]
  25. Sade, N.; Gebremedhin, A.; Moshelion, M. Risk-taking plants: Anisohydric behavior as a stress-resistance trait. Plant Signal. Behav. 2012, 7, 767–770. [Google Scholar] [CrossRef] [Green Version]
  26. Sun, D.-W. Hyperspectral Imaging for Food Quality Analysis and Control; Elsevier: Amsterdam, The Netherlands, 2010. [Google Scholar] [CrossRef]
  27. Ceccato, P.; Flasse, S.; Tarantola, S.; Jacquemoud, S.; Gregoire, J.M. Detecting vegetation leaf water content using reflectance in the optical domain. Remote Sens. Environ. 2001, 77, 22–33. [Google Scholar] [CrossRef]
  28. Basantia, N.C.; Kamruzzaman, M.; Nollet, L.M.; Leo, M.L. Hyperspectral Imaging Analysis and Applications for Food Quality; CRC Press: Boca Raton, FL, USA, 2019; pp. 109–112. [Google Scholar]
  29. Pu, R.; Ge, S.; Kelly, N.M.; Gong, P. Spectral absorption features as indicators of water status in Quercus Agrifolia leaves. Int. J. Remote Sens. 2003, 24, 1799–1810. [Google Scholar] [CrossRef]
  30. Zhang, J.H.; Guo, W.J. Studying on spectral characteristics of winter wheat with different soil moisture condition. In Proceedings of the 2nd International Symposium on Recent Advances in Quantitative Remote Sensing: RAQRS’II, Valencia, Spain, 25–29 September2006. [Google Scholar]
  31. Peñuelas, J.; Pinol, J.; Ogaya, R.; Filella, I. Estimation of plant water concentration by the reflectance water index WI (R900/R970). Int. J. Remote Sens. 1997, 18, 2869–2875. [Google Scholar] [CrossRef]
  32. Schlerf, M.; Atzberger, C.; Hill, J. Remote sensing of forest biophysical variables using HyMap imaging spectrometer data. Remote Sens. Environ. 2005, 95, 177–194. [Google Scholar] [CrossRef] [Green Version]
  33. Chen, D.; Huang, J.F.; Jackson, T.J. Vegetation water content estimation for corn and soybeans using spectral indices derived from MODIS near- and short-wave infrared bands. Remote Sens. Environ. 2005, 98, 222–236. [Google Scholar] [CrossRef]
  34. Galvão, L.S.; Formaggio, A.R.; Tisot, D.A. Discrimination of sugarcane varieties in Southeastern Brazil with EO-1 Hyperion data. Remote Sens. Environ. 2005, 94, 523–534. [Google Scholar] [CrossRef]
  35. Cao, Z.; Wang, Q.; Zheng, C. Best hyperspectral indices for tracing leaf water status as determined from leaf dehydration experiments. Ecol. Indic. 2015, 54, 96–107. [Google Scholar] [CrossRef]
  36. José, R.; Riaño, D.; Carlisle, E.; Ustin, S.; Smart, D. Evaluation of Hyperspectral Reflectance Indexes to Detect Grapevine Water Status in Vineyards. Am. J. Enol. Viticult. 2007, 58, 302–317. [Google Scholar]
  37. Yamamoto, H.; Suzuki, Y.; Kojima, T.; Hayakawa, S.; Inoue, Y.; Tanaka, M. Estimation of Leaf Water Content of Plants by Spectral Reflectance of Near Infrared Range. J. Remote Sens. Soc. Jpn. 1994, 14, 293–301. [Google Scholar]
  38. Seelig, H.D.; Hoehn, A.; Stodieck, L.S.; Klaus, D.M.; Adams, W.W.; Emery, W.J. Plant water parameters and the remote sensing R 1300/R 1450 leaf water index: Controlled condition dynamics during the development of water deficit stress. Irrig. Sci. 2009, 27, 357–365. [Google Scholar] [CrossRef]
  39. Margaret, K. Hyperspectral Remote Sensing of Tropical and Sub-Tropical Forests; CRC Press_Taylor & Francis Ltd.: Boca Raton, FL, USA, 2008; p. 350. [Google Scholar]
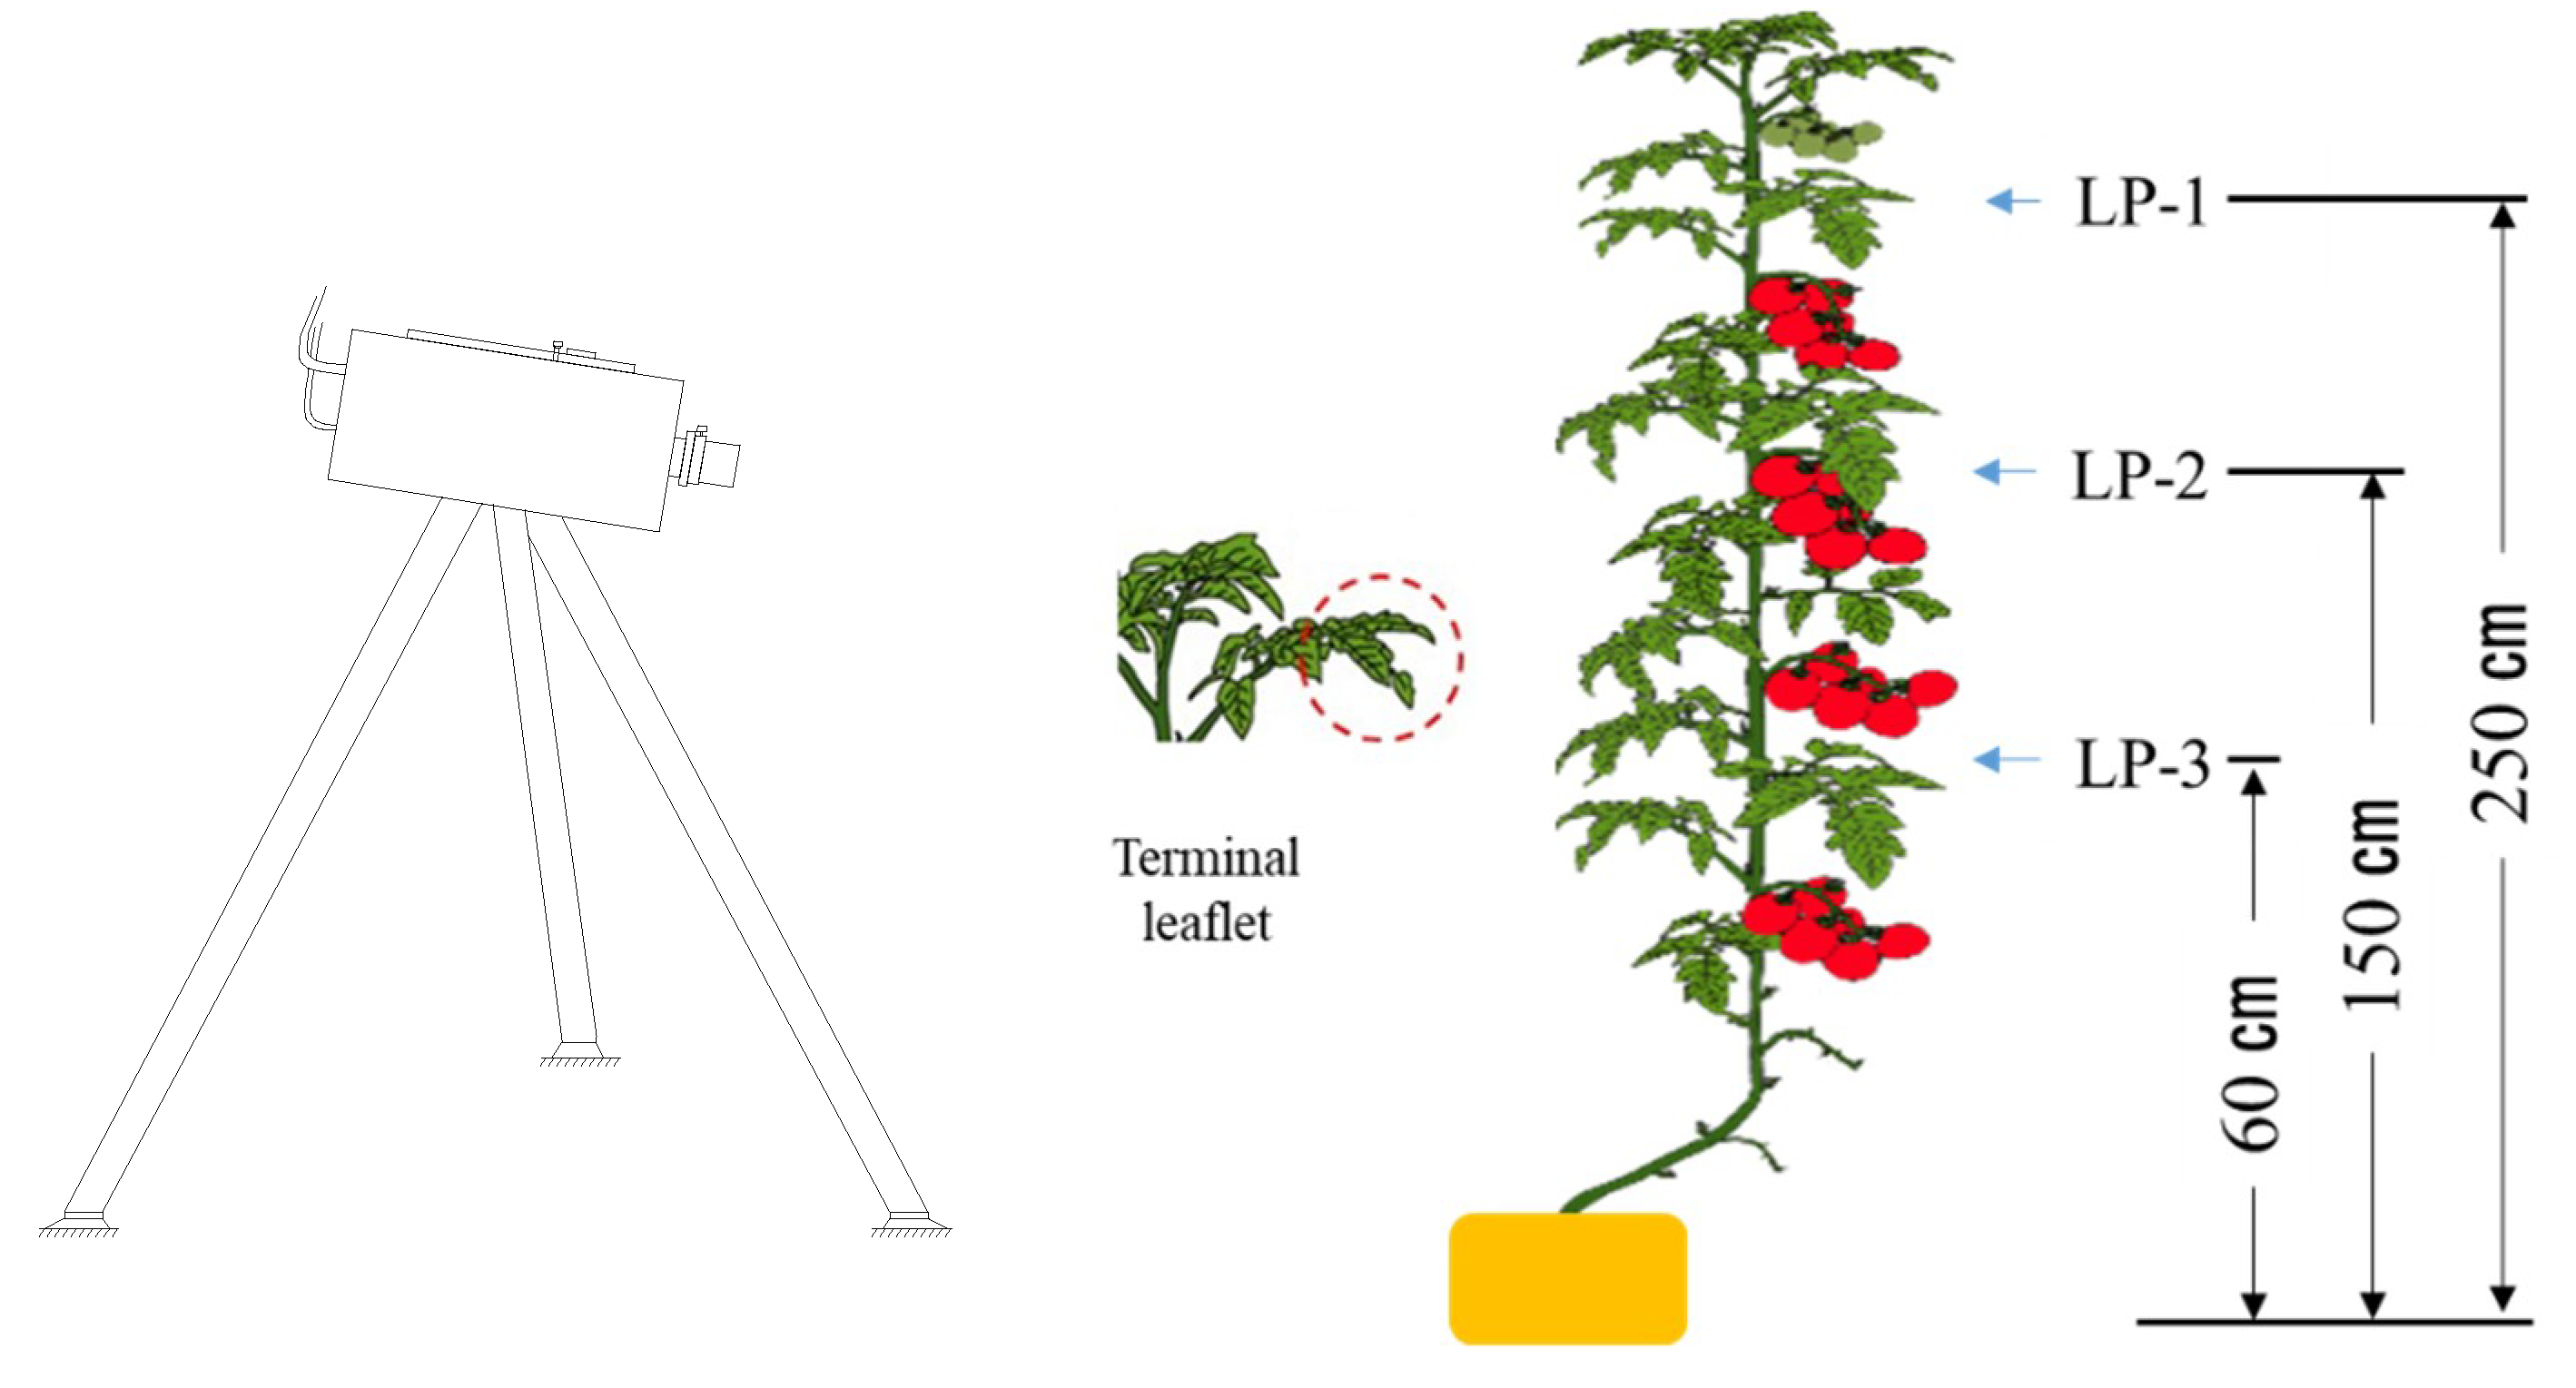
Figure 1. Overview of the tomato leaf sampling at varying leaf positions (LPs). LP-1: Top; LP-2: Middle; LP-3: Bottom.
Applsci 10 04665 g001
Figure 2. Hyperspectral image at a 1390 nm wavelength.
Applsci 10 04665 g002
Figure 3. Hyperspectral image processing and data analysis. (a) Extraction of the leaf image (R: 1000 nm, G: 1430 nm, B: 1530 nm). (b) Leaf area calculation.
Applsci 10 04665 g003
Figure 4. Relative reflectance of the tomato leaf samples.
Applsci 10 04665 g004
Figure 5. Tomato leaf characteristics of five cultivars under different height layers. (a) Fresh weight; (b) water content; (c) leaf area; (d) equivalent water thickness (g/dm2). E: Endeavour; R: Rinnka409; T: Tomimaru mucyo; Y: CF Momotarou; Z: DR03-103.
Applsci 10 04665 g005
Figure 6. Correlation coefficient between the leaf water status and individual wavelength. (a) Leaf WC; (b) equivalent water thickness (g/dm2). RAW: raw relative reflectance; DIFF: first derivative of relative reflectance; LOG: inverse-logarithm relative reflectance (1og(1/R)).
Applsci 10 04665 g006
Figure 7. PLS regression for wavelength and water status. (a) RAW and WC; (b) RAW and MC; (c) LOG and WC; (d) LOG and MC; (e) DIFF and WC; (f) DIFF and MC. RMSE: root mean squared error. R-Square: coefficient of determination (blue denotes the calibration and red represents the validation).
Applsci 10 04665 g007aApplsci 10 04665 g007b
Figure 8. Autocorrelation coefficient of wavelengths. (a) RAW; (b) LOG; (c) DIFF.
Applsci 10 04665 g008aApplsci 10 04665 g008b
Figure 9. Normalized difference vegetation index (NDVI) of tomato wavelength and leaf water status. (a) RAW and WC; (b) RAW and MC; (c) LOG and WC; (d) LOG and MC; (e) DIFF and WC; (f) DIFF and MC.
Applsci 10 04665 g009
Figure 10. Two-band index (TBI) of tomato wavelength and leaf water status. (a) RAW and WC; (b) RAW and MC; (c) LOG and WC; (d) LOG and MC; (e) DIFF and WC; (f) DIFF and MC.
Applsci 10 04665 g010
Table 1. Characteristic differences of the tomato leaves according to height layers.
FW (g)WC (%)LA (cm2)FW/LA (g/dm2)MC (g/dm2)
LP-11.19 b86.88 c48.96 b2.30 b2.00 b
LP-21.89 a89.12 b67.31 a2.75 a2.48 a
LP-32.02 a90.25 a73.11 a2.79 a2.49 a
FW: fresh weight, WC: water content, LA: leaf area, FW/LA: fresh weight per unit leaf area; MC: equivalent water thickness. Values with different letters are significantly different according to Tukey’s test at p < 0.05.
Table 2. Model performance by using NDVI and TBI according to wavelength and water status.
Regression ModelsData SetsWC (%)MC (g/dm2)
Wavelength Bands (nm)R2r2RMSEWavelength Bands (nm)R2r2RMSE
NDVIRAW1390, 16000.60600.36721.441300, 13100.80420.64670.2689
LOG1390, 16000.60800.36961.44950, 13500.75500.56990.2967
DIFF1370, 16100.56430.31851.491310, 14100.77330.59800.2869
TBIRAW1400, 15700.59500.35401.451300, 13100.78860.63890.2720
LOG1390, 16200.58510.34301.47950, 13500.75000.57070.2971
DIFF1410, 15200.63690.40571.391310, 14000.77160.59720.2878
R2: coefficient of determination for calibration, r2: coefficient of determination for validation, RMSE: root-mean-square error.