Article

In Vitro Assessment of Kurdish Rice Genotypes in Response to PEG-Induced Drought Stress

1
Department of Biotechnology and Crop Science, College of Agricultural Engineering Sciences, University of Sulaimani, Kurdistan Region of Iraq, Sulaymaniyah 46001, Iraq
2
Department of Plant Biology, Faculty of AgriSciences, Mendel University in Brno, Zemědělská 1, 613 00 Brno, Czech Republic
3
Department of Horticulture, College of Agricultural Engineering Sciences, University of Sulaimani, Kurdistan Region of Iraq, Sulaymaniyah 46001, Iraq
4
Department of Phytochemistry Centre of Region Haná for Biotechnological and Agricultural Research Faculty of Science, Palacky University in Olomouc Slechtitelu 27, 78371 Olomouc, Czech Republic
*
Author to whom correspondence should be addressed.
Appl. Sci. 2020, 10(13), 4471; https://doi.org/10.3390/app10134471
Submission received: 30 May 2020 / Revised: 23 June 2020 / Accepted: 23 June 2020 / Published: 28 June 2020
(This article belongs to the Special Issue Applied Agri-Technologies)

Abstract

:
Rice (Oryza sativa L.) is productively affected by different environmental factors, including biotic and abiotic stress. The objectives of this research were to evaluate the genetic distinction among Kurdish rice genotypes using the simple sequence repeats (SSRs) molecular markers and to perform in vitro tests to characterize the drought tolerance of six local rice genotypes. The polymorphic information content (PIC) varied from 0.38 to 0.84 with an average of 0.56. The genetic distance ranged from 0.33 to 0.88. Drought stress had a significant impact (p ≤ 0.05) on callus growth parameters. Enzymatic antioxidant systems were predicted and exhibited a significant variation. The findings revealed that proline levels increase in proportion to polyethylene glycol (PEG) concentrations. Kalar and Gwll Swr genotypes showed the worst performances in phenotypic and biochemical traits, while Choman and Shawre exhibited the best phenotypic and biochemical performances. A positive and substantial relationship between callus fresh weight (CFW) and callus dry weight (CDW) was found under stressful and optimized conditions. Callus induction (CI) was positively and significantly associated with the catalase activity (CAT) in all stressed treatments. Based on the results for callus growth and the biochemical parameters under stress conditions, a remarkable genotype distinction, based on the tolerance reaction, was noted as follows: PEG resistant > susceptible, Choman > Shawre > White Bazyan > Red Bazyan > Gwll Swr > Kalar. The CI and CAT characteristics were considered as reliable predictors of drought tolerance in rice genotypes.

1. Introduction

Rice (Oryza sativa L.) refers to the Poaceae (Gramineae) family of monocotyledonous plants. It is one of the world’s three strategic crops and forms the staple diet of more than half of the world’s population. The global cultivation of rice has been evaluated to be about 850 million tons, and the rice-growing area is estimated to be 256 million hectares. Asia is the leading producer of rice in the world, accounting for around 90% of the world’s crops [1]. Over 75% of global production is consumed by people in Asian countries, and, thus, rice has great importance to the food security of Asia. It is used mainly for human consumption [1]. The United States Department of Agriculture (USDA) estimated Iraq’s rice production in 2014 to be 267,000 tons, decreasing to 110,000 tons in 2015. Iraq’s rice cultivation is well below its national consumption [2]. Several strategies have been used to evaluate the genetic distance among genotypes, including phenotypic, cytological, isoenzyme, and molecular analysis [3,4].
Globally, water disputes have a long history, due to shortages of natural water, early development of irrigated agriculture, and religious and ethnic diversity. The link between forced migration, conflict, and climate change is particularly strong in countries of Western Asia and Northern Africa. Moreover, the critical problem in the Iraqi Kurdistan region is increased temperature compared with previous decades. Similar to other places in the world, the Kurdistan region is affected by global warming, pollution factors, unstable environmental conditions, and reduction in the level of different water resources, as well as variability and instability of the average precipitation per year [5]. In 2018, the cultivated area and production of rice in Iraqi Kurdistan was 2000 ha and 14.49 tons, respectively.
The yield and consistency of rice are seriously impaired by physiological and environmental tension, as well as by insects and diseases. In Iraq, as well as in other parts of the world, the development of rice that minimizes irrigation requirements has become a priority due to the growing constraint of a limited water supply. Abiotic stress induced by drought, salinity, cold, and heat is a significant environmental factor that impacts plant development and also poses a severe challenge to agriculture. Drought causes many physiological and biochemical modifications at levels ranging from subcellular to the whole plant. One such modification is the production of reactive oxygen species (ROS), which are harmful to plant metabolism. ROS production is controlled by various enzymatic and non-enzymatic antioxidant defense systems, including catalase (CAT), ascorbate peroxidase (APX), proline oxidase (POX), superoxide dismutase (SOD), monodehydro ascorbate reductase (MDHAR), dehydroascorbate reductase (DHAR), and glutathione reductase (GR), while non-enzymatic catalysts include ascorbate, glutathione, carotenoids, phenolic compounds, proline, glycine betaine, and sugars. These different defense responses cause other changes, for example, in the content of inorganic elements [6,7]. Recognizing the biochemical mechanisms associated with rice drought stress resistance is still a significant obstacle, for biology and agriculture, to the early identification of an effective trait that would aid plant breeders and, in particular, breeding programs. The accumulation of compatible solutes, such as proline and glycine betaine, represents a basic strategy used by plants to protect against osmotic stress. Similarly, the consequences show that drought influences metabolite levels differently in a genotype-dependent manner. Proline is also thought to play a positive role in maintaining membrane integrity under various stresses [8,9]. Usually, proline accumulation is considered to be higher in stress-tolerant plant species [10]. Analyses of rice plants in response to drought stress and recognition of drought tolerance mechanisms for the production of drought-adapted crops will potentially result in higher crop yields per unit of water input.
Drought tolerance may thus be considered as a developmentally regulated stage-specific phenomenon such that tolerance at one stage of plant development may not be linked to tolerance at other developmental stages [11]. The selection of plants under field conditions is tedious due to low heritability, the time required, and the interaction between environmental factors and genotypes.
The utility of rice drought-tolerant callus is to improve the selection efficiency and accuracy in terms of drought tolerance in genotypes due to the condition of callus growth, which is not affected by environmental factors. In vitro cultures can be used to achieve drought-tolerant plant selection, suggesting that there is a connection between cellular and in vitro plant responses. This approach is focused on the introduction of genetic variability between cells and tissues in cultivated and regenerated plants, despite the fact that there are genomic, biochemical, and physiological limitations on the growth of stress-tolerant plants by in vitro culture. Polyethylene glycol (PEG) is a high-molecular-weight, non-ionic, and non-plasmolyzing compound that imitates drought stress in cultured cells similar to that observed in the cells of intact plants subjected to drought conditions [12,13,14]. Osmotic stress influences plant growth and creates disparities in plant mineral nutrition, resulting in secondary consequences. In rice, tissue culture techniques are well developed and used [15,16,17]. The collection of genotypes with various physiological reactions to different stresses would give growers new options under diverse environmental constraints. Thus, the objectives of this research were to test the genetic distinction among Kurdish rice genotypes using simple sequence repeats (SSRs) molecular markers and to evaluate the ability of six local rice genotypes to produce callus in polyethylene glycol (PEG)-supplemented medium

2. Materials and Methods

The present experiments were conducted at the Department of Plant Biology, Mendel University in Brno, Czech Republic.

2.1. Plant Material and Genetic Diversity

The plant material consisted of six Kurdish local genotypes of rice (Oryza sativa L.). Kernels were provided by the College of Agricultural Engineering Sciences at the University of Sulaimani, Kurdistan Region of Iraq (Table 1). These genotypes are the most cultivated cultivars in Kurdistan. To determine genetic diversity, rice kernels were germinated in aseptic conditions. The kernels were placed on moist filter paper with distilled water in Petri dishes and incubated at room temperature under a 16 h light/8 h dark cycle in an incubator. Genomic DNA was isolated from 90 mg of young seedlings (10 days) using the DNeasy Plant Mini Kit isolation kit (Qiagen, Hilden, Germany). PCR reaction mixture, electrophoretic separation, and visualization were performed as described in [18,19] with some modifications. The amplification reaction was 1× PCR, 1.80 mM MgCl2, 0.40 mM dNTP, 7.50 µM of each primer, 1.00 U Taq polymerase, and 100.00 ng template DNA. The 12 rice SSR markers tested were RM13, RM16, RM228, RM241, RM287, RM309, RM400, RM418, RM443, RM526, RM1079, and RM23818 [20].
Amplifications were achieved in a Biometra gradient thermocycler with the following cycling sequence: Initial denaturation at 94 °C for 6 min, followed by 37 cycles of 1 min at 94 °C, 1 min at 55 °C and 2 min at 72 °C, with a final extension for 8 min at 72 °C. PCR products were mixed with 1/5 volume of loading buffer and separated on a 2.50% (w/v) agarose gel in 1× TBE at 80 V for 2 h. The gels were then stained in a 0.60 μg/mL ethidium bromide bath and the DNA fragments were visualized under UV light.

2.2. Callus Induction

The basic medium used in all experiments was composed of the Murashige and Skoog medium (including vitamins). After adjusting the pH to 5.8, the medium was autoclaved at 121 °C for 20 min, then dispensed in 100 × 15 mm magenta boxes. The cultures were maintained in 16 h light/8 h dark at 25 ± 2 °C [21]. Rice kernels were dehusked manually; for each treatment, 10 rice kernels with 3 replicates were used. The kernels were surface sterilized with 70% ethanol for 1 min followed by shaking for 30 min on a gyratory shaker at 200 rpm in 2.60% (w/v) sodium hypochlorite. Then, the kernels were rinsed 4 to 6 times with sterile distilled water. The callus induction medium was supplemented with 2.50 mg/L 2, 4-D, and 1 mg/L kinetin. PEG 6000 was added to the callus induction medium at 0.00% (T0.00), 0.50% (T0.50), 1.00% (T1.00), and 1.50% (T1.50) concentrations. Medium without PEG served as a control. After 30 days, the percentage of the callus induction (CI), callus fresh weight (CFW), and callus dry weight (CDW) were calculated.

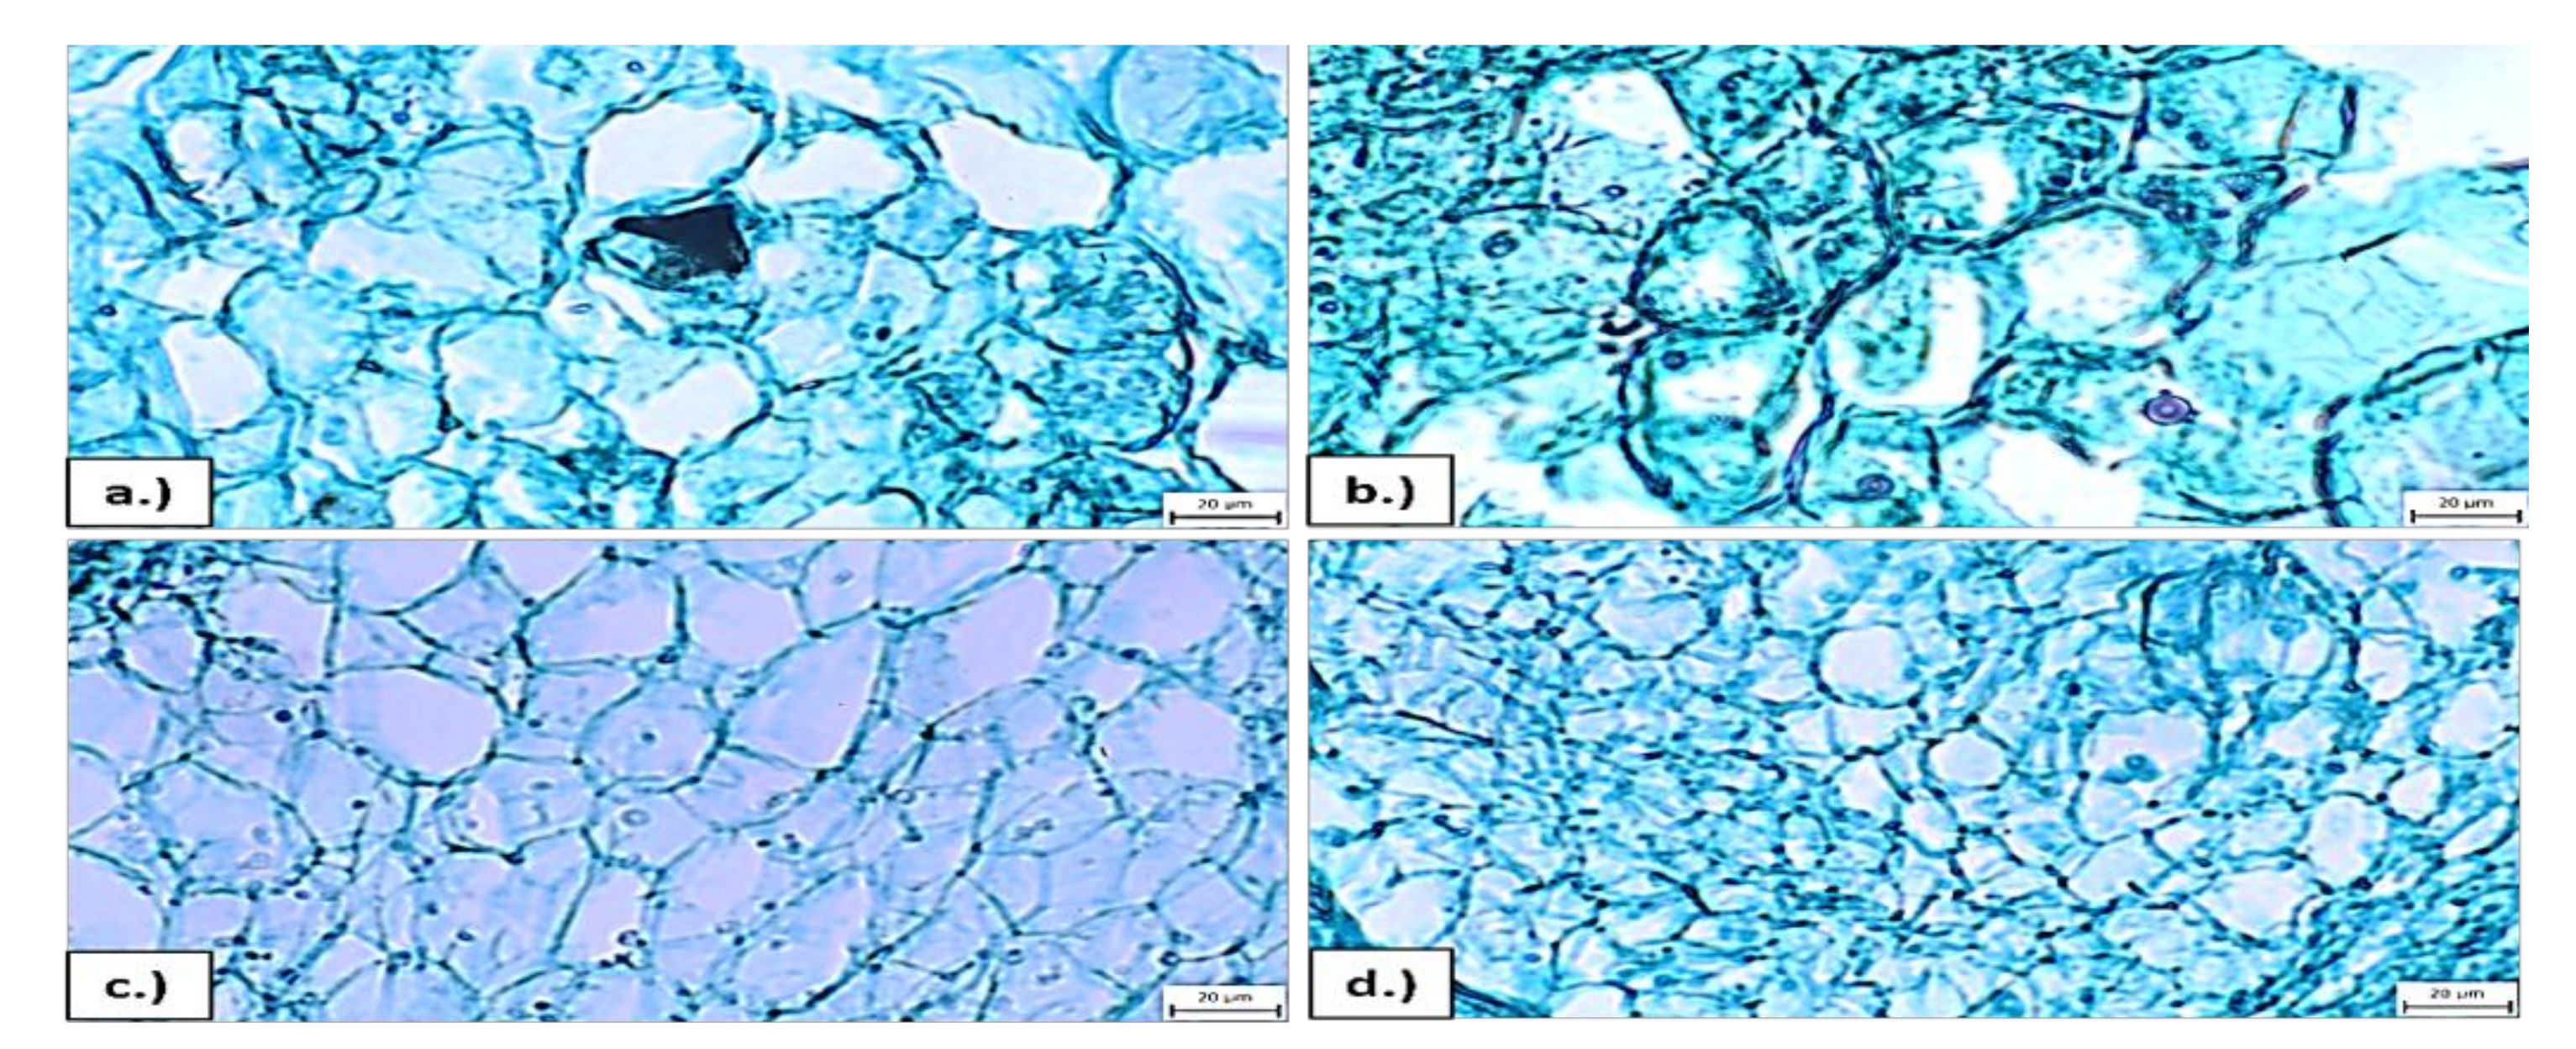
2.3. Microscopic Analyses of Cell Dimension

The samples of calli were fixed in Taylor’s modification of Navashin´s fixative at 8 °C overnight. Then, the fixative sample was washed with tap water for 12 h. The samples were dehydrated in a series of 10%, 30%, 50%, 70%, and 90% ethanol for 15 min, 2 times in 96% ethanol for 45 min, and 2 times in 100% ethanol for 1 h. Consequently, the samples were incubated in ethanol/xylene 3:1, 1:1, 1:3, and finally in 100% xylene for 1 h each. The samples were paraffined at 58 °C, using the Paraplast Plus (Leica, GE) paraffin for histology for 3 days. The samples were embedded in paraffin blocks and sectioned using a Leica RM2255 rotary microtome (Leica, GE) into 12-µm-thick serial sections. The sections were deparaffinated using 100% xylene for 20 min, transferred into ethanol using ethanol/xylene (1:1) for 10 min, and rehydrated in ethanol series, including 100%, 90%, 70%, 50%, 30%, and 10% ethanol and distilled water for 10 min. The slices were stained in 1.00% Safranin O and 0.05% Fast Green FCF according to [22]. The slides were mounted in acrylic-based resin Solakryl (Lučební závody Draslovka Ltd., Kolín, Czech Republic). Microphotographs were taken using an Olympus IX70 (Olympus Corporation, J) microscope and Canon EOS 1300D digital camera (Canon Inc., Tokyo, Iapan). Cell length (CL), cell width (CW), and cell wall thickness (CWT) were measured using Quick Photo Micro 3.2 software (Promicra CZ).

2.4. Antioxidant Enzyme Activity

The pulverized calli (about 25–30 mg) were mixed with an extraction buffer (100 mM phosphate buffer pH 7.0 containing: 0.10 mM EDTA-Na, 2.00 mM dithiothreitol (DTT), 1.00 mM Pefabloc (protease inhibitor), and 1.00% polyvinylpolypyrrolidone (PVPP) in the ratio 1:4 (w/v). Homogenates were centrifuged at 16,000× g for 20 min at 4 °C. Supernatants were used for measurements of enzyme activities.

2.4.1. Measurement of Ascorbate Peroxidase Activity (APX)

The activity of APX was assayed as the rate of ascorbate oxidation in the presence of H2O2 [23]. The reaction mixture comprised 1.75 mM ascorbate, 0.70 mM H2O2, 0.10 M potassium phosphate buffer (pH 7.0), and enzyme extract. The decrease in absorption at 290 nm was monitored for 10 min at 25 °C and the amount of oxidized ascorbate was calculated using a molar extinction coefficient of H2O2 = 2800 L·mol−1 cm−1). Enzyme activity was expressed in nkat/mg of FW.

2.4.2. Measurement of Catalase Activity (CAT)

CAT activity was assessed as the ascorbate oxidation rate in the presence of H2O2 [24]. The reaction mixture included 60 mM H2O2, 0.10 M potassium phosphate buffer (pH 7.0), and enzyme extract. The decrease in absorbance of hydrogen peroxide at λ = 240 nm was monitored for 5 min at 25 °C. For calculations, the molar extinction coefficient of hydrogen peroxide = 43.6 L·mol−1·cm−1 and correction for path length were used. Enzyme activity was described in nkat/mg of FW.

2.5. Proline Content Assay

The amino acid proline was extracted from 50 mg of fresh weight samples using cold extraction in 40% ethanol at 4 °C overnight. Then, the samples were centrifuged at 14,000× g for 5 min. The total proline content was determined spectrophotometrically by the acid ninhydrin method according to [25].

2.6. Inorganic Element Content Analyses

Dried samples were digested in a diffused microwave system (MLS 1200 Mega; Milestone S.r.L., Sorisole, Italy). The samples were weighed and placed in polytetrafluoroethylene vessels and 2 mL of HNO3 (67%, Analpure) and 1 mL of H2O2 (30%, analytical grade) were added. The power-controlled digestion program was applied: Step 1: 250 W, 2 min; Step 2: 0 W, 2 min; Step 3: 400 W, 5 min; Step 4: 0 W, 2 min; Step 5: 500 W, 2 min; Step 6: 0 W, 2 min; and Step 7: 600 W, 6 min. After the digestion, each solution was diluted to 15 mL with ultrapure water (18.2 MW∙cm, Direct-Q; Millipore, Molsheim, France) and stored at −20 °C before ICP-MS analysis. The blank samples were prepared under the same working conditions as with the same reagents. The experiments were carried out using an ICP-MS spectrometer (Agilent 7700x; Agilent Technologies, Tokyo, Japan) based on a quadrupole mass analyzer and octapole reaction system (ORS 3). A collision cell in He-mode was used for the elimination of possible polyatomic interference. The instrument was set up by using the Tuning solution (Agilent Technologies, Santa Clara, USA). Isotopes 23Na and 24Mg were measured in gas mode, whereas isotopes 31P, 34S, 39K, and 44Ca, were measured in He-mode. As internal standards were used for these elements: 45Sc, 89Y, and 115In (INT-MIX, Analytika Ltd., Prague, Czech Republic). Each plant sample was measured in six replicates. The calibration solutions were provided with the suitable dilution of the single element certified reference materials with 1.000 ± 0.002 g/L for each element (Analytika Ltd., Prague, Czech Republic) with ultrapure water (18.2 MW∙cm, Direct-Q; Millipore, Molsheim, France).

2.7. Statistical Analyses

For each SSR marker, the following parameters were evaluated: Polymorphic information content (PIC), diversity index (DI), and identity probability (PI) by POPGENE software. One-way ANOVA-CRD and Duncan’s new multiple range tests were used to determine significant differences (p ≤ 0.05) among rice genotypes and relationships among different variables using XLSTAT software version 2019.2.2. Correlation analysis was performed by Displayr software.
In addition, the ranking method was used to identify the best genotypes as per the method proposed by [26], using various measured traits. Using this method, the stress tolerance index (STI) and the average number of ranks (ASRs) were used as the criterion for choosing the best genotypes for all characteristics. In this method, each trait’s best performance recorded the lowest rank; thus, the best genotypes were identified with the highest STI and lowest ASR values [27].

3. Results

3.1. Genetic Diversity among Rice Genotypes

The first step of the current research was DNA fingerprinting as seen in Table 2. The results showed that 11 SSR markers produced 3.18 polymorphic alleles per locus across the 6 samples, and the highest number alleles (5.00) were detected in SSR RM443. The PIC varied from 0.38 (RM241, RM418, and RM309) to 0.84 (RM287), the DI ranged from 0.50 to 0.84, and the PI from 0.02 (RM287) to 0.38 (RM241, RM418, and RM309), illustrating the broad genetic variability of the local rice accessions. The RM526 marker reflected the existence of uniform genotypes. The dissimilarity matrix ranged from 0.33 to 0.88 (Table 3).

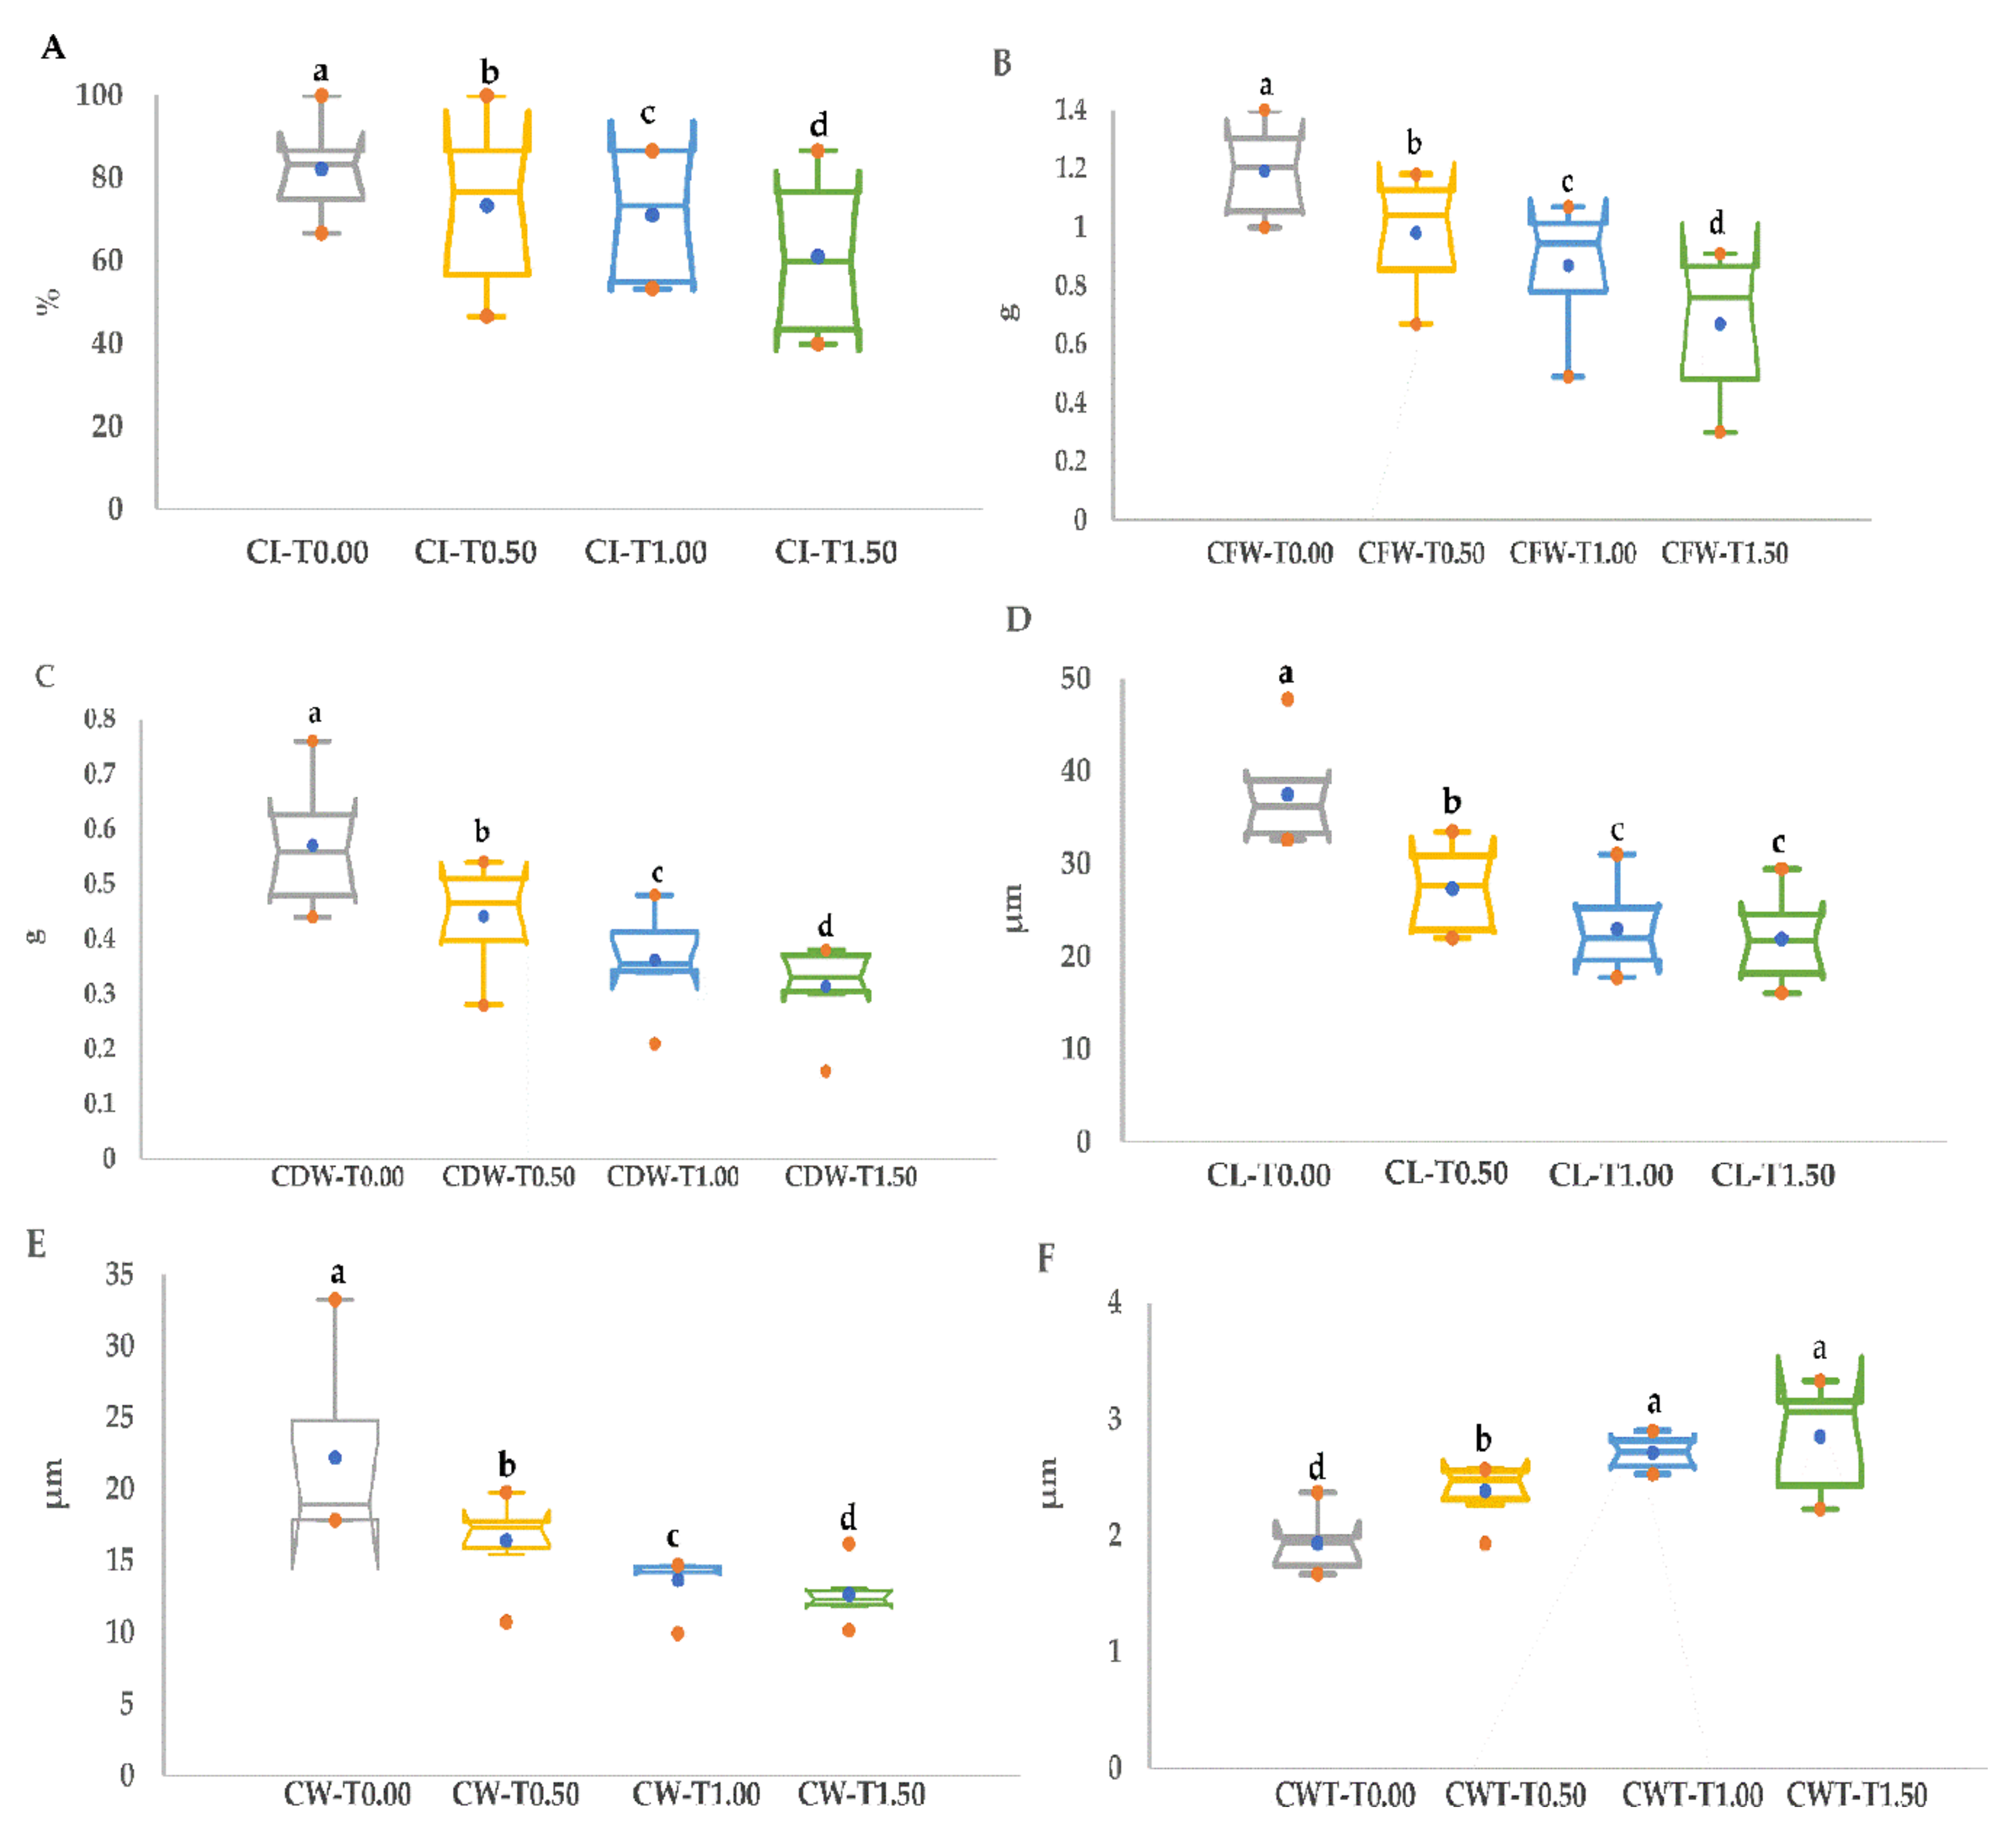
3.2. PEG Stress Tolerance Based on Callus Growth Traits

The overarching goal of this experiment was to investigate the drought tolerance of six rice genotypes under in vitro callus initiation and to test their reactions to the various amounts of PEG by estimating the characteristics of CI, CFW, and CDW. The six genotypes responded markedly to different PEG concentrations. Figure 1 illustrates the box plots of six callus growth traits and comparative analyses of variations between the control group and stress groups (T0.50, T1.0, and T1.50) across all genotypes. CI, CFW, CDW, CL, and CW traits showed significant decreases compared to the control treatment and these characteristics gradually decreased from minimal drought stress (T0.50) to severe drought stress (T1.50), while CWT showed a significant increase compared to the control group. As shown in Table 4, significant variations were illustrated among all genotypes for all callus growth parameters under control and stress conditions. In the control condition (T0.00), the data ranged from 66.67% (Red Bazyan) to 100% (White Bazyan), 1 (Red Bazyan) to 1.40 g (White Bazyan), and 0.44 (Red Bazyan) to 0.76 g (White Bazyan) for CI, CFW, and CDW, respectively. At the T0.50 condition, a highly significant difference in callus growth parameters was displayed among the tested genotypes. The highest values of CI, CFW, and CDW were found in White Bazyan (100%), Choman (1.18 g), and White Bazyan (0.54 g), respectively. For the T1.00 treatment, the maximum values were recorded by Choman, Shawre, and White Bazyan for CI; Choman for CFW; and Shawre for CDW. At a high concentration of PEG (T1.50), the responses of six genotypes varied between 53.33% and 86.67% for CI, 0.30 and 0.91 g for CFW, and 0.16 and 0.38 g for CDW. High CI, CFW, and CL were observed in the Choman genotype at a high level of PEG. As indicated by the results, the minimum values of CI, CFW, and CDW were revealed by Red Bazyan. These findings indicate that the rice genotypes react differently to drought and the responses of genotypes depend on PEG concentrations. This suggests the different genotype potentials for callus growth parameters. In addition, as the amount of PEG was increased in the medium, there was a decline in CFW and CDW.
Concerning the callus cell dimension parameters (Figure 2 and Table 5), a remarkable and important divergence was exhibited among the six rice genotypes depending on PEG concentrations. Maximum values of CL, CW, and CWT in the control condition were observed by Shawre (47.80 µm), Shware (33.23 µm), and Red Bazyan (2.37 µm), respectively. At the low PEG level (T0.50), the reaction of the six genotypes ranged from 22.03 (Kalar and Shawre) to 33.5 µm (Choman) for CL, 10.73 (Shawre) to 19.77 µm (Choman) for CW, and 1.93 (Gwll Swr) to 2.43 µm (Choman) for CWT. The Choman genotype with 47.80, 16.20, and 3.33 μm was noticed to have maximal values of CL, CW, and CWT, respectively, at the T1.50 concentration. Further, the ranking method was conducted based on the callus growth parameters to identify the best genotypes according to the method proposed by [26], using different evaluated traits. Based on this approach, the average sum of ranks (ASRs) was used as an indicator for selecting the best genotypes for growth traits [27]. The order of genotypes from PEG resistant > susceptible was White Bazyan > Choman > Shawre > Gwll Swr > Red Bazyan > Kalar for the T0.50 condition; Choman > Shawre > White Bazyan > Red Bazyan > Gwll Swr > Kalar under the T1.0 treatment; and Choman > Shawre > Kalar > White Bazyan > Red Bazyan > Gwll Swr under the T1.50 concentration. For the overall stress conditions, the genotypes’ resistance/susceptibility rating according to their callus growth parameters was as follows: PEG resistant > susceptible, Choman > Shawre > White Bazyan > Red Bazyan > Gwll Swr = Kalar (Table 6).

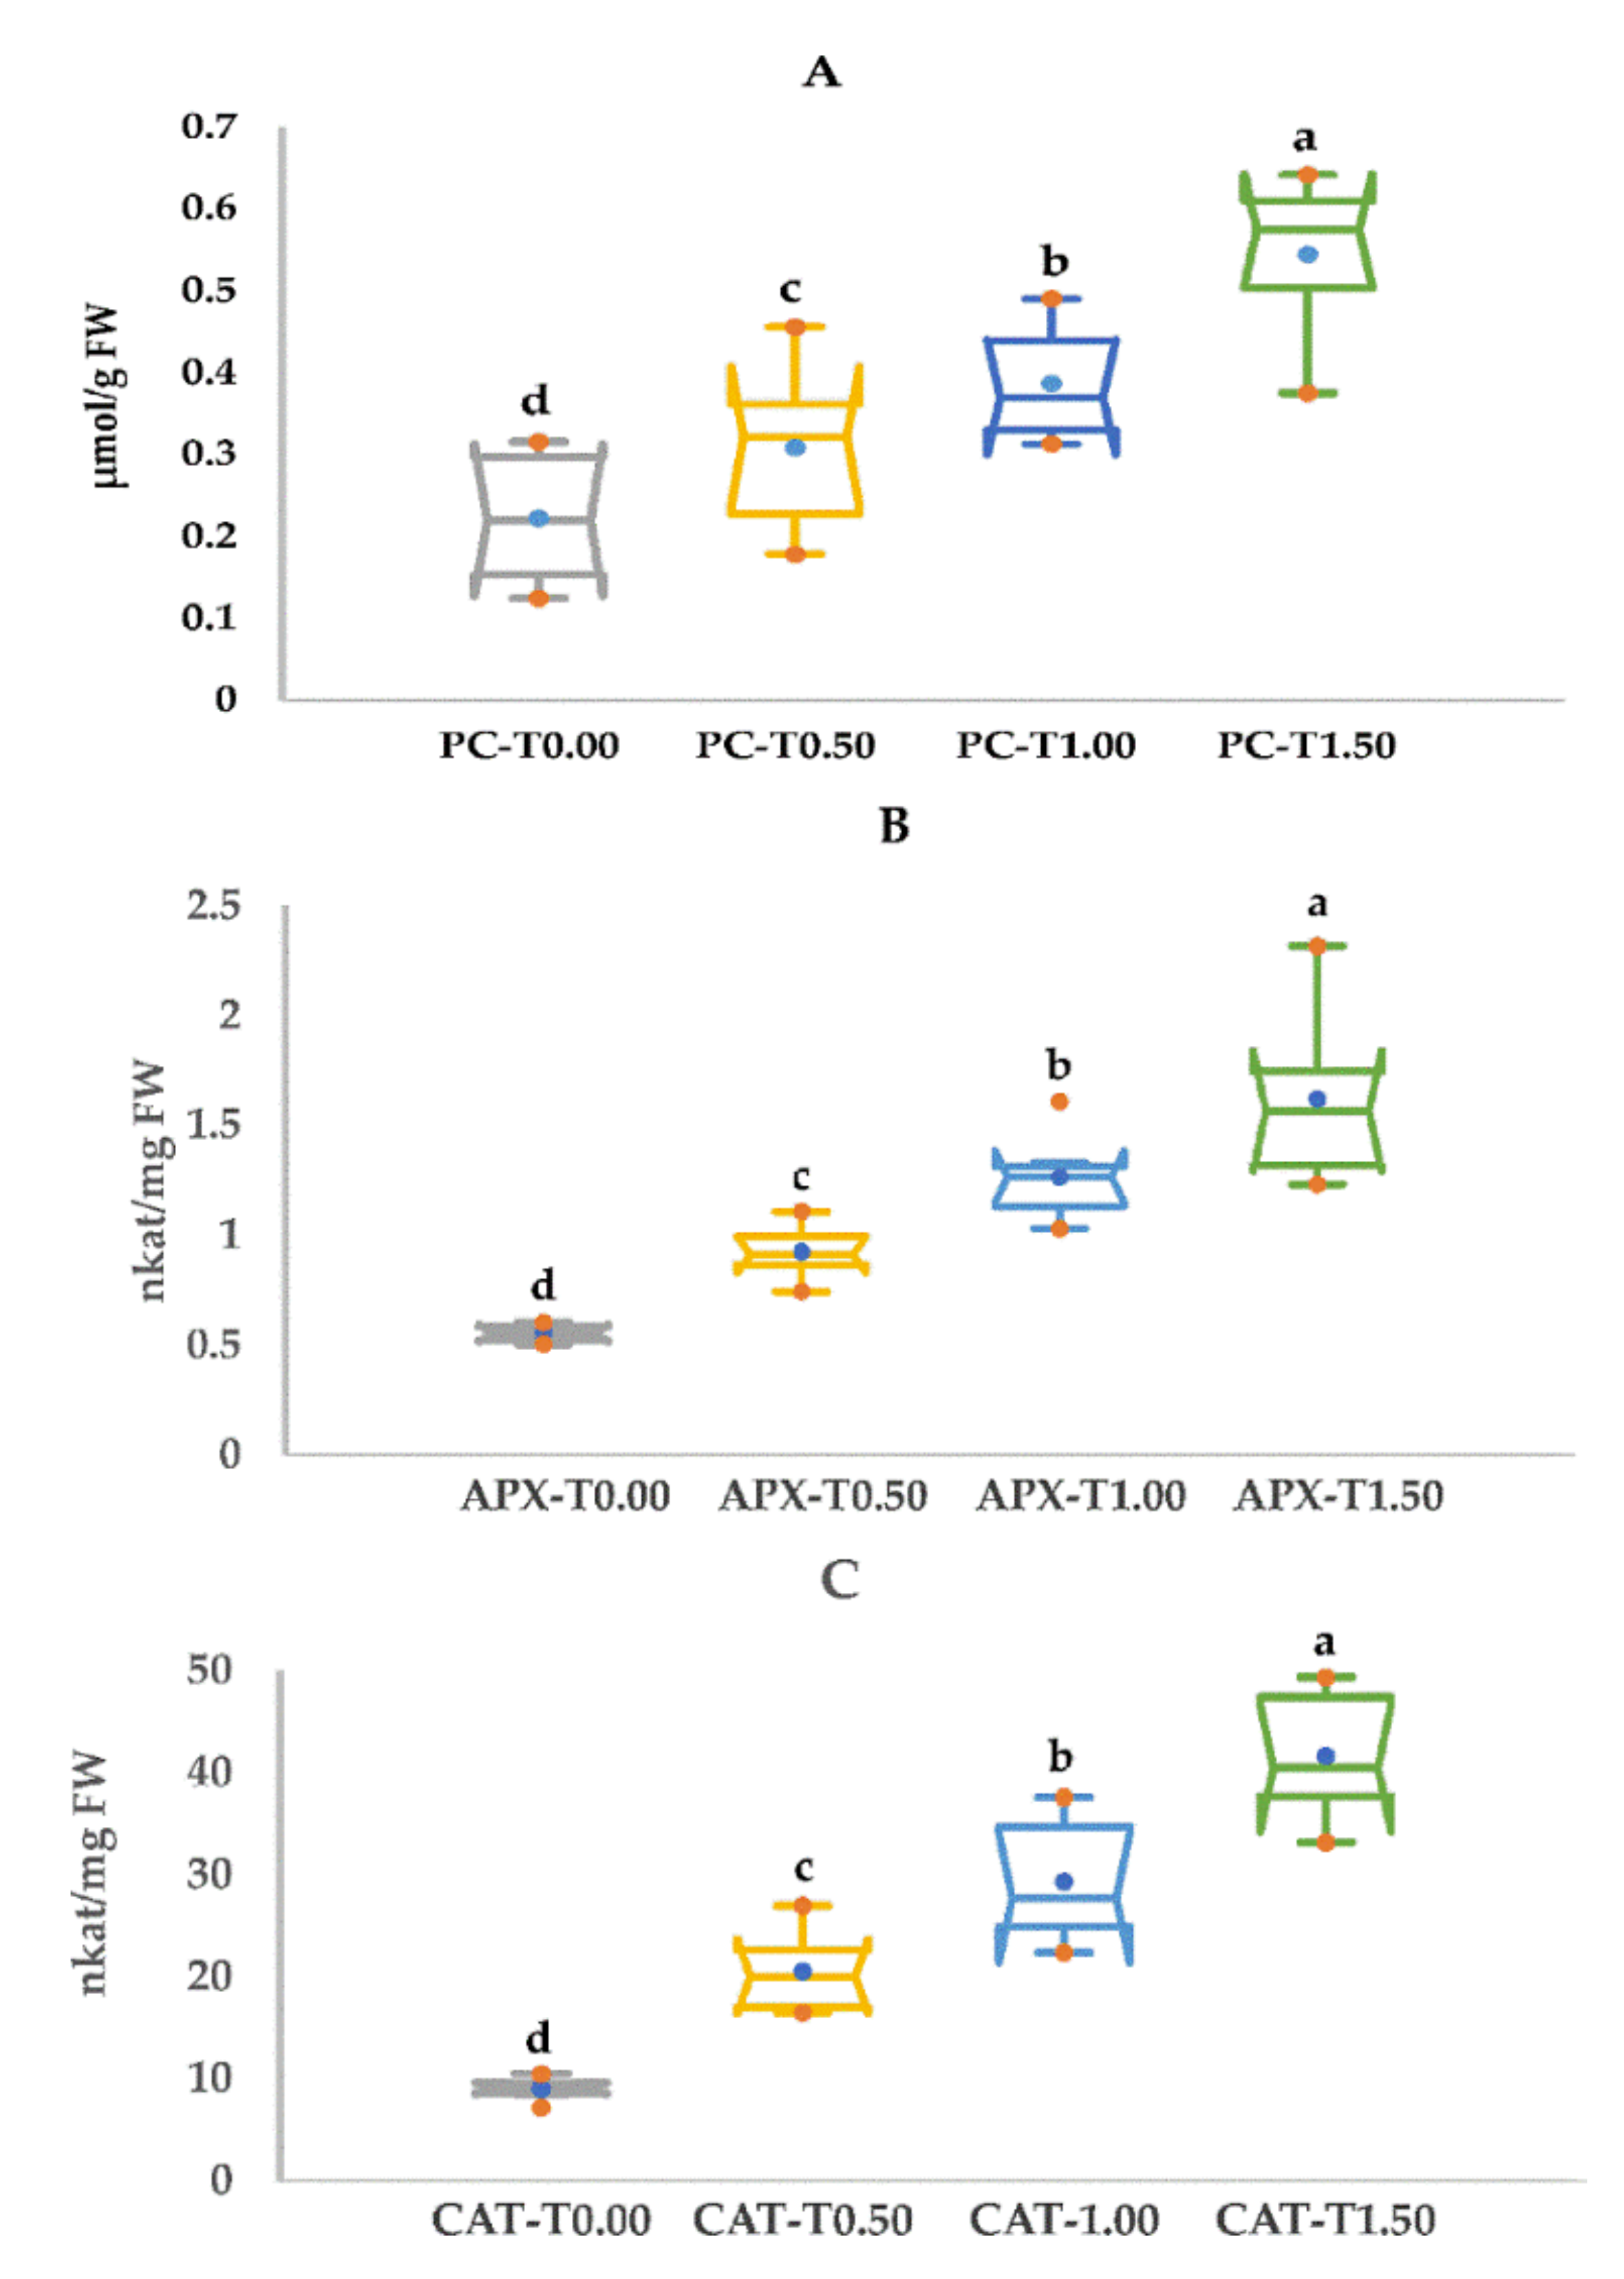
3.3. PEG Stress Tolerance Based on Proline Content and Antioxidant Enzyme Activity

The findings of our analysis revealed that there were major variations between the genotypes under non-stress and stress conditions for the proline content and antioxidant enzyme activities (APX and CAT) (Table 7). Notable differences between these characteristics were established between the four groups (Figure 3) across the six genotypes. Larger distribution ranges were seen in the proline content (PC) under all conditions. The smallest distribution ranges between unstressed and stressed groups were revealed in APX and CAT under the T0.50 condition. Under the optimum condition (T0.00), Gwll Swr, Red Bazyan, and White Bazyan registered the best values in PC (0.31 µmol/g FW), APX (0.81 nkat/mg FW), and CAT (10.49 nkat/mg FW) activities, respectively. At T0.50, the ranges of PC, APX, and CAT were from 0.21 to 0.46 µmol/g FW, 0.75 to 1.11 nkat/mg FW, and 16.55 to 26.98 nkat/mg FW, respectively. Choman had the largest output values of APX and CAT actions under the T1.00 and T1.50 stress treatments and Shawre showed the maximum PC value. For the overall stress conditions, the genotypes’ resistance/susceptibility rating according to the PC, APX, and CAT characteristics was as follows: Choman > Shawre > White Bazyan > Gwll Swr > Red Bazyan > Kalar (Table 8). In addition, the degree of metabolic alterations in response to stress was associated with the reported sensitivity/tolerance phenotype.

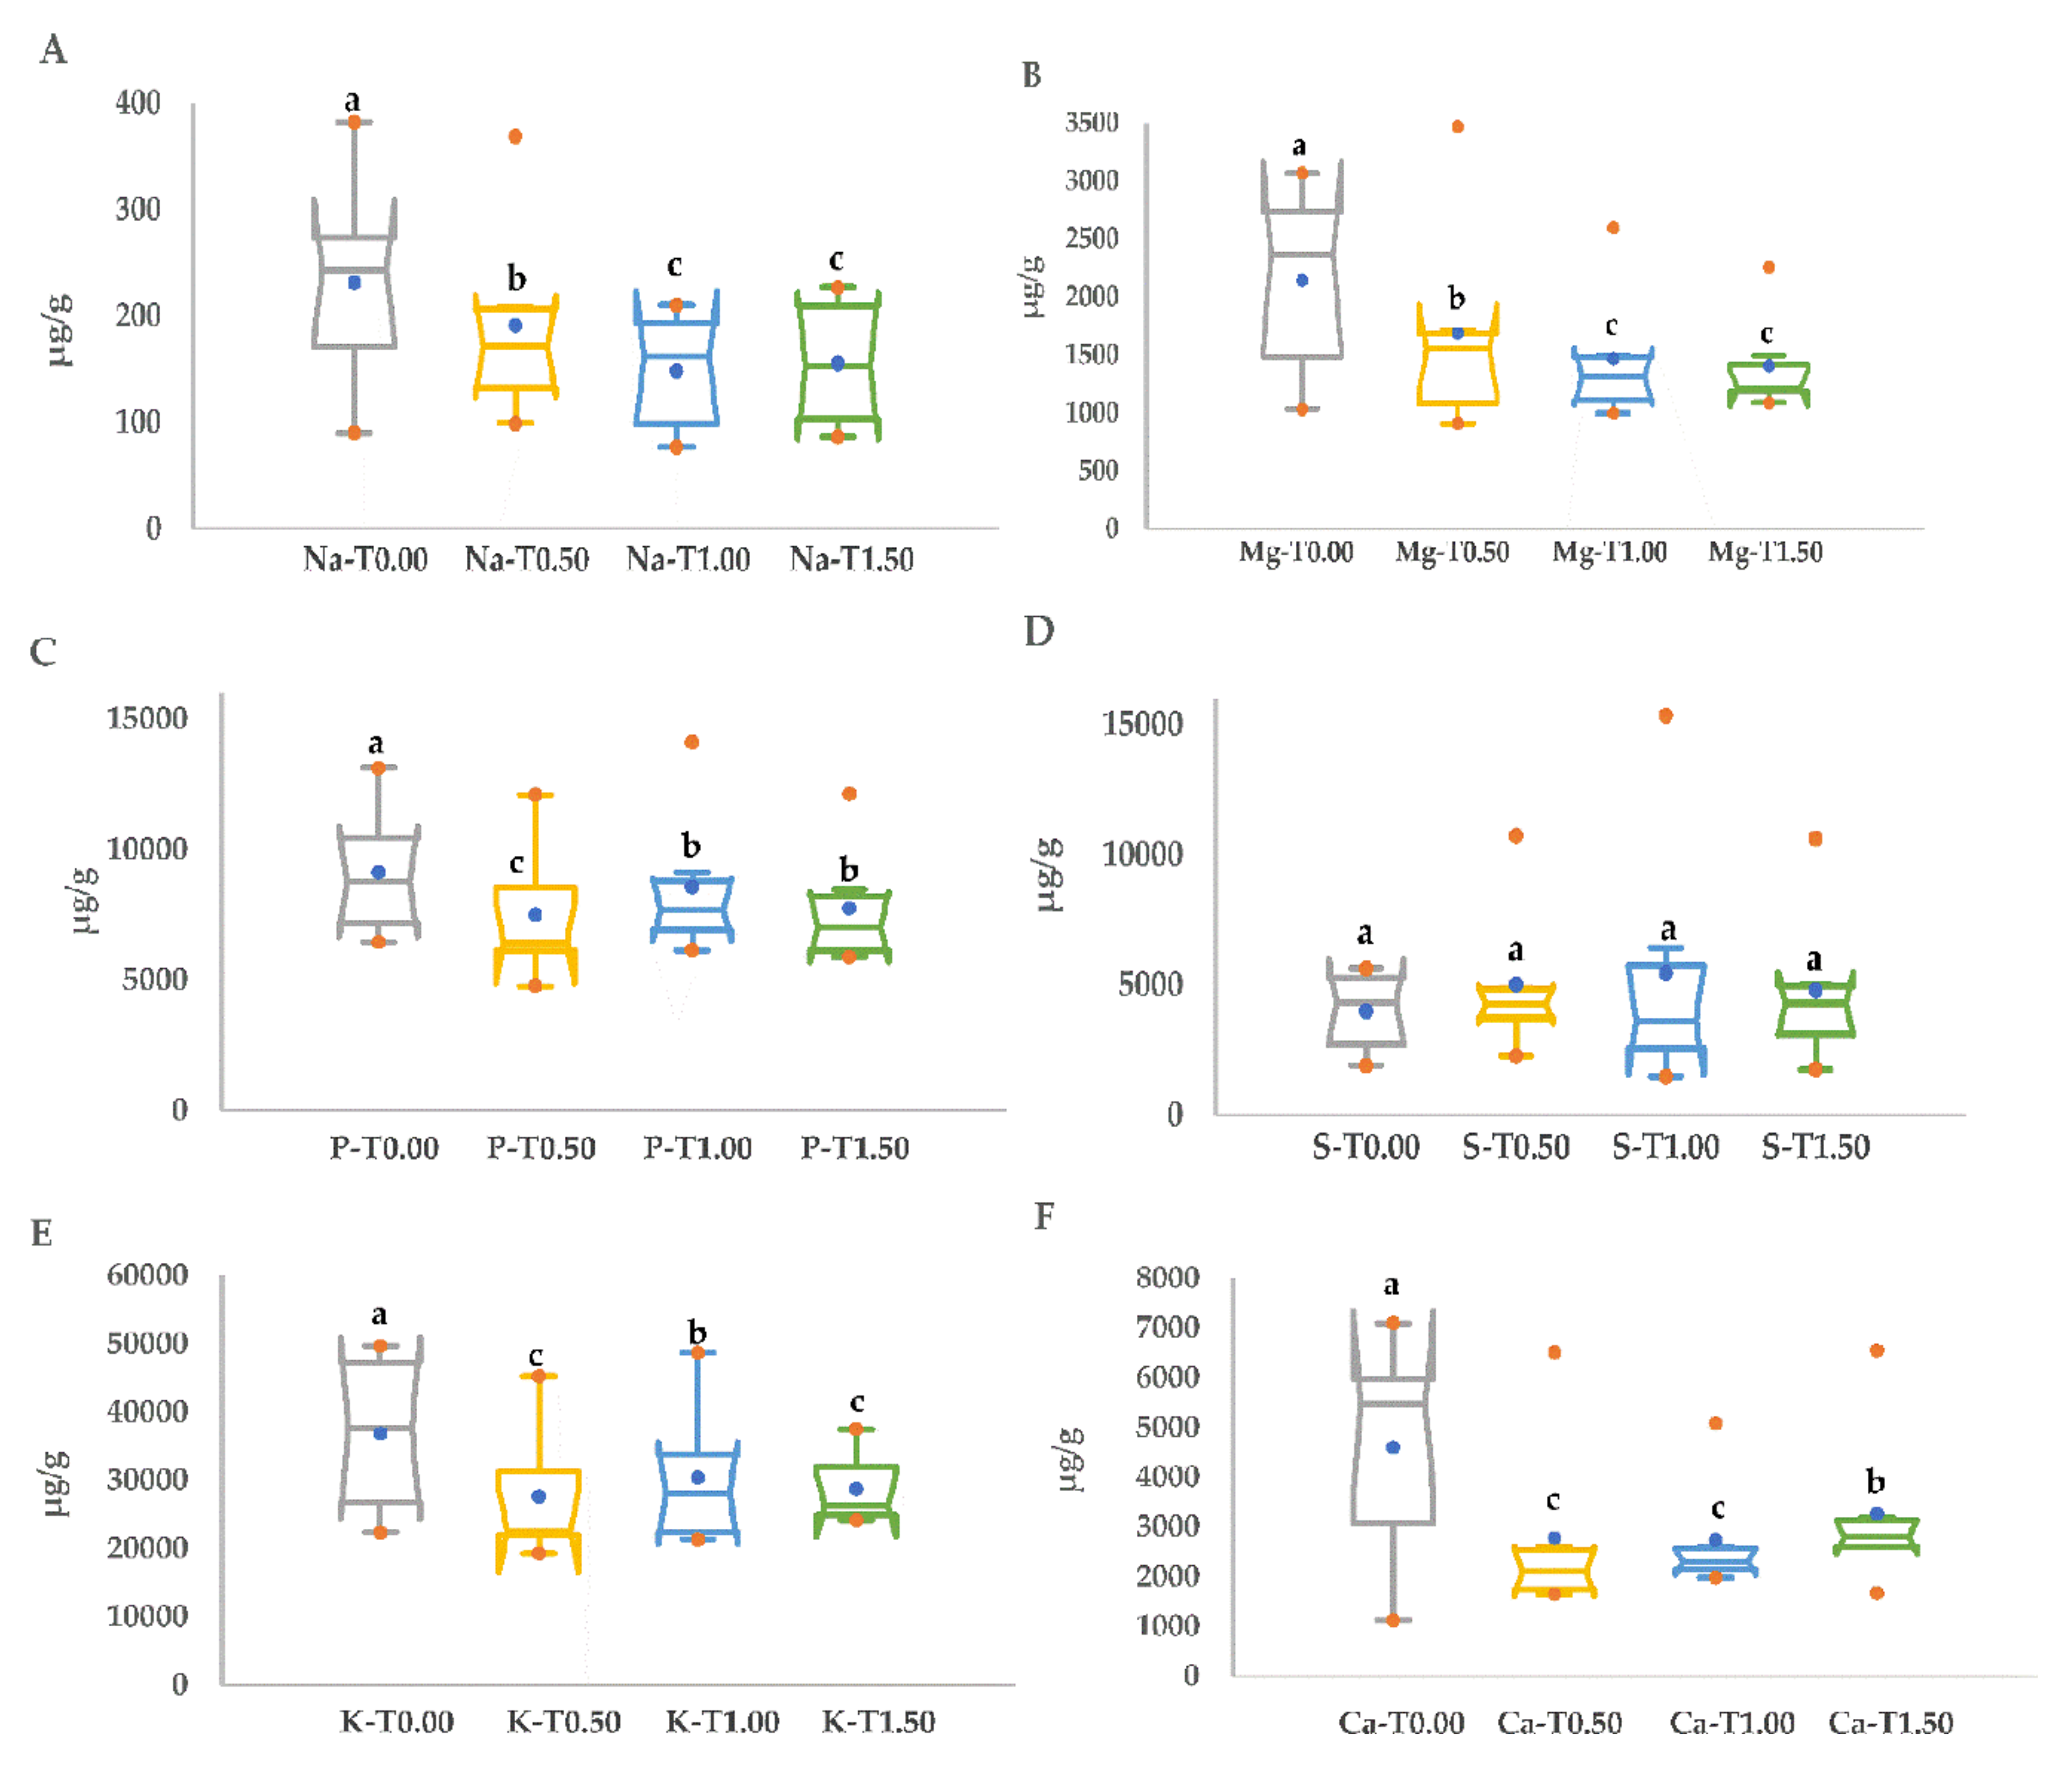
3.4. Inorganic Element Responses under Drought Stress

Figure 4 demonstrates the box charts of the inorganic element parameters and significant dissimilarities between the control group and stress groups (T0.50, T1.0, and T1.50). The Na and Mg contents revealed significant decreases compared to the control treatment and these characteristics progressively diminished from slight stress (T0.50) to high stress (T1.50). Further, no significant variation in the S content was observed between the four groups. The distribution ranges were largest in Na content. Inorganic elements exhibited substantial variations in all rice genotypes under control and stress conditions (Table 9). Under the control condition, the Red Bazyan genotype obtained the greatest amounts of Mg (3066.46 µg/g), P (13125.19 µg/g), S (5473.38 µg/g), and K (49,711.49 µg/g). The largest amount of Na (382.13 µg/g) and Ca (6014.87 µg/g) was documented in Shawre. At low drought stress (T0.50), Red Bazyan expressed the highest Na (368.89 µg/g), Mg (3466.10 µg/g), P (12,101.34 µg/g), K (45,255.60 µg/g), and Ca (6507.31 µg/g). Under moderate stress (T1.00), the maximum quantity of Na (210.28 µg/g), Mg (2596.67 µg/g), P (14,121.74 µg/g), K (48,698.00 µg/g), and Ca (5083.59 µg/g) was recorded in Red Bazyan. At high PEG stress (T1.50), Red Bazyan contained the highest contents of Mg (2256.66 µg/g), P (12,135.20 µg/g), and K (37,482.84 µg/g), while the Shawre genotype had the lowest amount of Na (86.48 µg/g), P (5880.94 µg/g), S (1764.29 µg/g), Mg (1180.56 µg/g), and Ca (1670.19 µg/g).

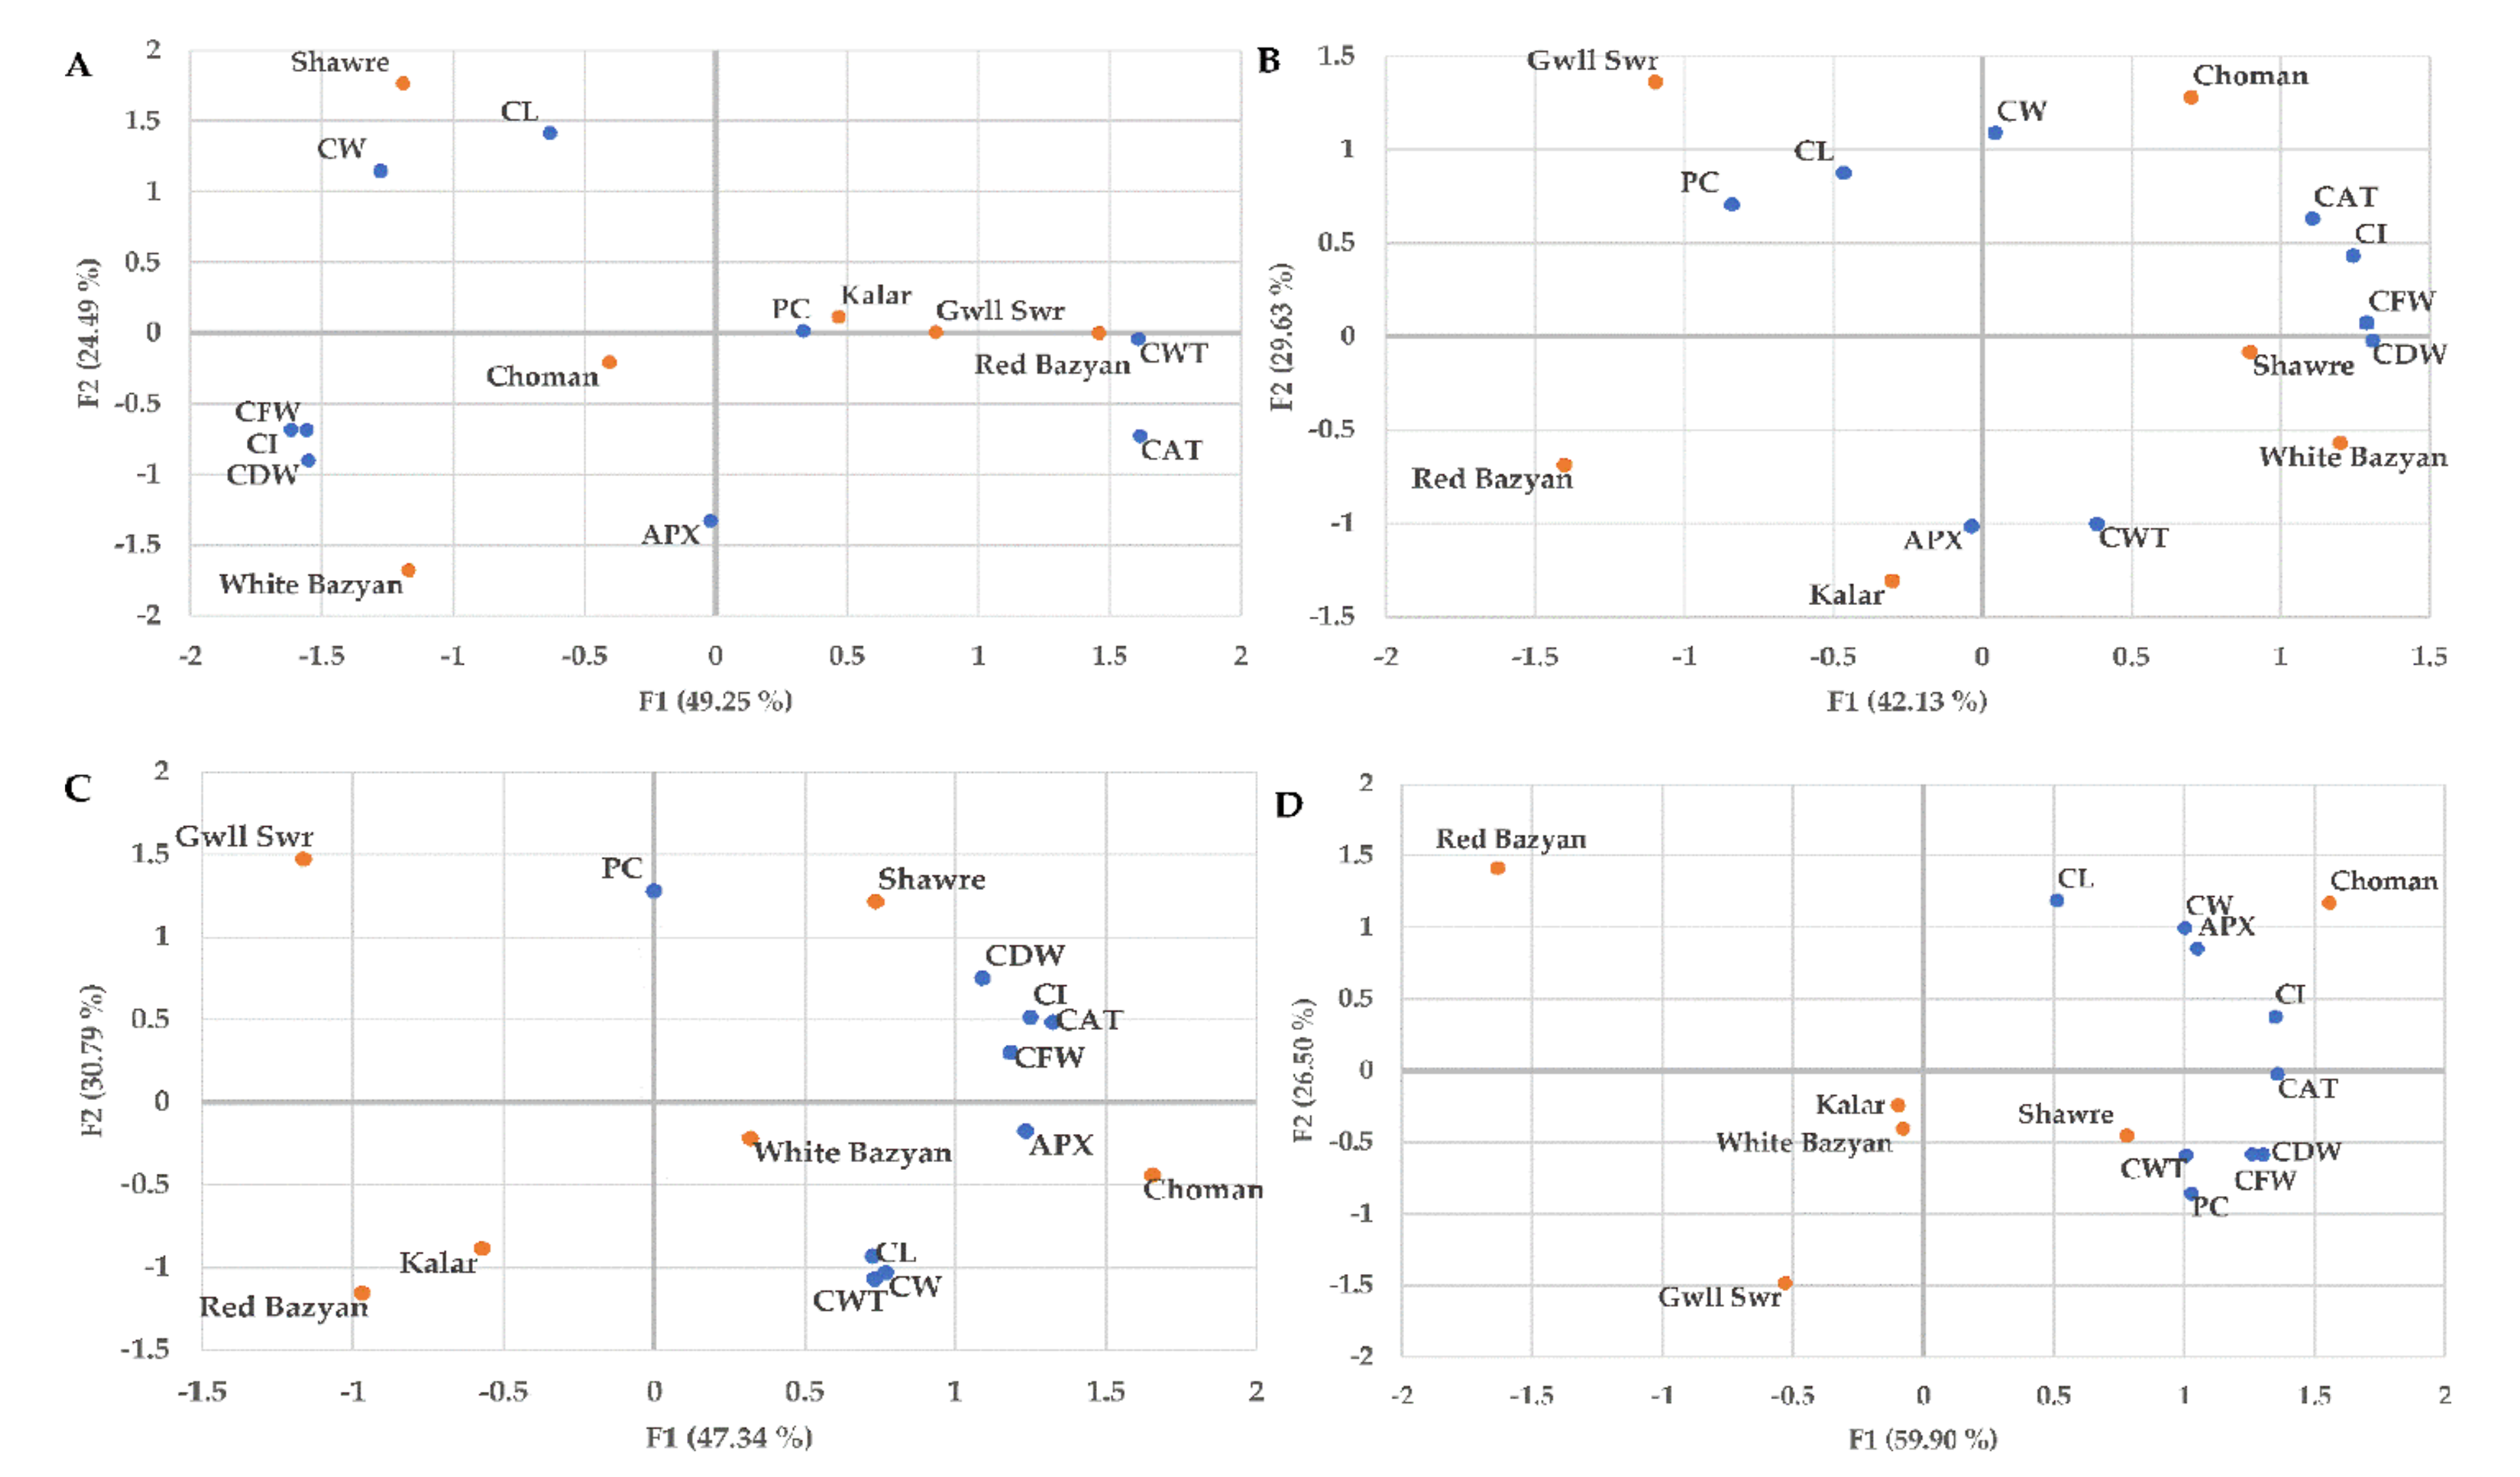
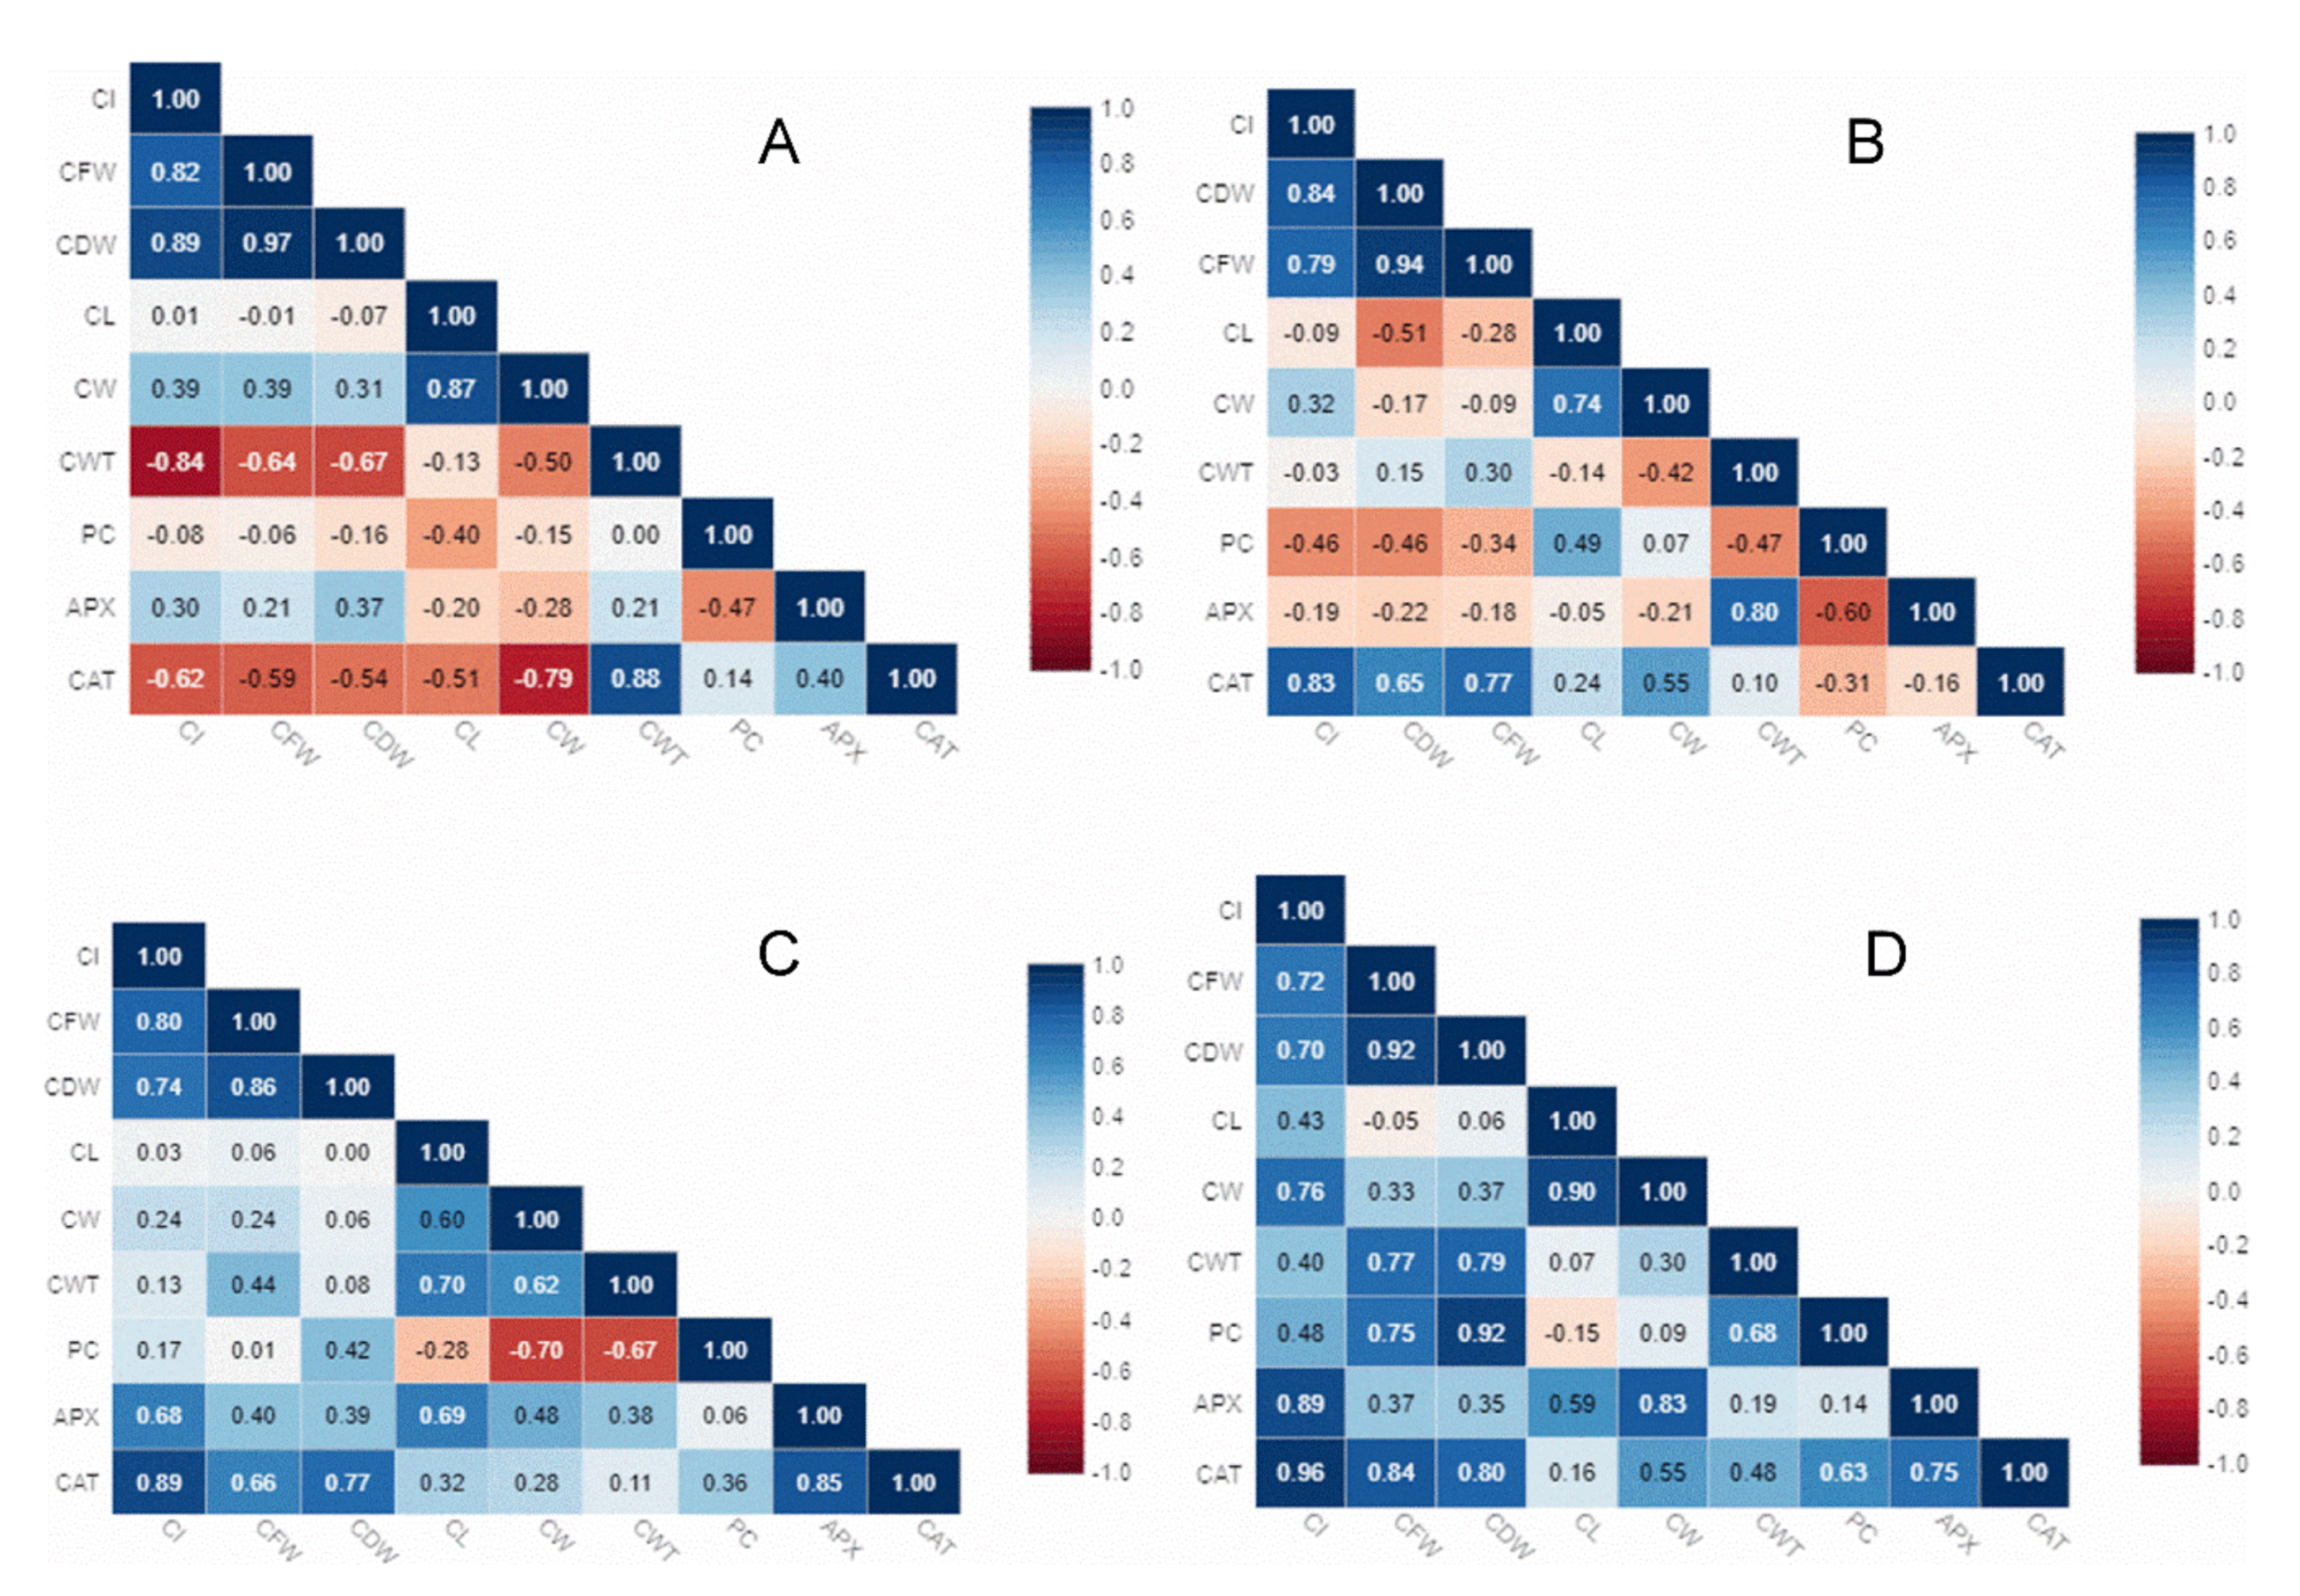
3.5. Relationship Analysis Between Phenotypic and Biochemical Traits under Optimum and Stress Conditions

Different methods were used to classify the genotypes; the most suitable was multivariate analysis. In addition, data mining is a useful method for large dataset collection, discovery, and modelling to identify novel patterns to explain more challenging and decisive results. Multivariate methods of analysis, such as principal component analysis (PCA), have been used for classification. The data obtained from the normal and stress treatments were used to create the PCA plot. In the normal condition, the two components PC1 and PC2 reported 73.75% of the initial variation. The first and second contributions were 49.25 and 24.49%, respectively (Figure 5A). Concerning the distribution of genotypes on the PCA plot, genotypes located far from the center of the plot in the positive patterns of distinct traits showed the best performance, while the genotypes at the center of the plot showed the poor results in the negative orientation of traits. As seen in Figure 5A, the first primary component (PC1) was positively influenced by traits CWT and CAT, while CI, CFW, and CDW were negatively linked to the first component. The second main component (PC2) was negatively associated with the APX trait. As seen in Figure 5B, the first primary component described roughly 42.13% of the variation and was positively influenced by CI, CFW, CDW, and CAT. The second main component clarified 39.63% of the variance and was positively linked with CW and negatively associated with APX and CWT. Under the T1.00 treatment, the two components PC1 and PC2 described 78.13% of the total trait difference (Figure 5C). APX, CAT, CI, CFW, and CDW were correlated positively with the first component. Under the high-stress condition, a total variation of 86.40% was explained by PC1 and PC2. CI, CFW, CDW, CWT, PC, CAT, and APX were associated positively with the primary component (Figure 5D). As shown in Figure 5D, Choman and Shawre correlated positively with the CI, CFW, CDW, CWT, PC, CAT, and APX traits. For determining the significant correlation among different characters, a simple Pearson correlation (r) analysis of nine characteristics under unstressed and stressed conditions was conducted (Figure 6). Under the optimum condition, six significant r values were found between the nine traits. CI displayed a strong significant and positive relationship with CFW (r = 0.82*, p-value = 0.04) and CDW (r = 0.89*, p-value = 0.02), and showed a strong negative association with CWT (r = −0.84*, p-value = 0.04). CFW highly and significantly correlated with CDW (r = 0.97**, p-value = 0.001). Significant and positive r values were found between CL and CW (r = 0.87*, p-value = 0.02), and between CWT and CAT (r = 0.88*, p-value = 0.02). Under T0.50 stress, CFW was highly and significantly correlated with CDW (r = 0.94**, p-value = 0.005). CI correlated positively and significantly with CDW (r = 0.84*, p-value = 0.04) and CAT (r = 0.83*, p-value = 0.04). Further, CAT had strong positive and significant correlations with CI (r = 0.89*, p-value = 0.02) and APX (r = 0.85*, p-value = 0.03). Notably, CFW showed strong positive correlations with CDW (r = 0.86*, p-value = 0.03) under the T1.0 stress condition. In the T1.50 stress treatment, seven positive and significant relationships were registered. The correlation values demonstrated highly positive and significant correlations between CI and CAT (r = 0.96**, p-value = 0.003), between CFW and CDW (r = 0.92**, p-value = 0.001), and between CDW and PC (r = 0.92**, p-value = 0.001). APX indicated a positive and significant correlation with CI (r = 0.89*, p-value = 0.018) and CL (r = 0.83*, p-value = 0.04). These findings show that a positive and significant association between CFW and CDW was observed under stressful and optimized conditions. CI was also positively and significantly associated with CAT in all stressed treatments.

4. Discussion

The morphological and physiological variations between genotypes are relatively unexplored resources that can not only provide crucial data on the capacity and performance of various crops under various climatic conditions but are also an invaluable genetic resource that could be used to improve yields [28]. Awareness of this natural diversity should encourage the use of modern (with desirable traits) genotypes to improve crop yields. The present results showed natural diversity among the analyzed genotypes, indicating differential growth properties in control conditions for the six genotypes.
For genotype screening, an investigation was conducted using 12 SSR markers, of which 11 were polymorphic bands. Similarly, [29] tested 16 rice genotypes with different drought sensitivity with SSR markers and found 60 polymorphic bands. Different rice genotypes of Heilongjiang Province were analyzed by [30] using SSR markers under stress conditions and the authors found, on average, three alleles that are comparable to our results. On the contrary, [18] reported an average of five alleles per locus in rice genotypes from Bangladesh and [31] reported nine alleles per locus in Ecuadorian rice genotypes. This difference was probably due to the genetic makeup, higher number of genotypes, and types of SSR markers analyzed. The mean of the PIC value in this study was higher than the PIC value (0.33) reported by [32] but lower than those reported by [29,31], who observed an average of 0.62. The genetic distance between genotypes used in our study ranged from 0.33 to 0.88, which indicated high genetic divergence among the rice genotypes. Similarly, 314 rice genotypes from northern Laos were analyzed by SSR and a high distance was found [33]. Based on DNA analyses, it was proven that the six genotypes differ genetically each from other, and two SSR markers (RM443 and RM287) can be used for the identification of six rice genotypes due to their high PIC value.
The data of the drought-tolerant response confirmed that there was a significant decrease in CI, CFW, CDW, and CL in all genotypes after PEG treatment; these responses were dose dependent. In stress conditions, a substantial decrease in the CIP, CFW, CDW, and CL parameters was observed in callus obtained from all of the genotypes, while an increase of CWT was displayed. These results followed similar trends to those observed in the callus of rice by [34,35,36]. In terms of results, Choman and Shawre showed similar performances under the non-stressed condition, and grew better than the other genotypes under the stress condition, exhibiting superior tolerance to osmotic stress. On the other hand, Kalar and Gwll Swr appeared to be the most sensitive to PEG stress. Concerning the ranking of genotypes based on phenotypic characterizations, the order of rice genotypes was: PEG resistant > susceptible, Choman > Shawre > White Bazyan > Red Bazyan > Gwll Swr = Kalar. Decreased growth of callus is caused by the negative impacts of PEG on the metabolic function of cells, including enzyme, nucleic acid, and protein synthesis, and the stability of the cell membrane. This negative effect of PEG decreases the rates of plant hormones and turgor pressure, which is considered a critical factor in regulating the growth and enlargement of cells [37,38]. In addition, drought stress induces free radical formation by lipid peroxidation and therefore damages the membrane. The stability of the cell membrane is one of the main parameters for cellular responses under drought conditions and the abiotic stress tolerance factor in plants [39]. In the current research, PC, APX, and CAT activities in rice calli treated with different concentrations of PEG were increased in all genotypes. Choman and Shawre had the greatest amount of APX and CAT activities. These increases minimize the production of free radicals and protect the cell membrane from degradation. In our study, in all analyzed genotypes, a significant increase in proline content was recorded in PEG-treated plants. Shawre had the largest PC amount, whereas the minimum mean values of PC were recorded by Kalar and Gwll Swr. In a comparative study of rice varieties cultivated in hydroponic culture, increased proline accumulation was correlated with a higher degree of tolerance against PEG 6000-induced drought stress [40]. In the correlation analysis, CI was also positively and significantly associated with CAT in all stressed conditions. Based on this finding, CI and CAT were considered to be reliable predictors for the ability of these six local rice genotypes to produce callus in PEG-supplemented medium. White Bazyan and Gwll Swr genotypes reported the maximum increase in Na, Mg, K, and Ca contents, while the largest decreases in Na, K, Ca, Mg, S, and P contents were found in the Choman genotype. As can be seen from the results, PEG-tolerant genotypes (Choman and Shawre) contained a smaller amount of most mineral elements than PEG-sensitive genotypes (Kalar and Gwll Swr), suggesting that biochemical traits (enzymatic and non-enzymatic stress markers) are more important for enhancing tolerance in rice genotypes. Based on the findings of callus growth and biochemical parameters under stress treatments, a notable genotype differentiation based on the tolerance reaction was recognized as follows: Choman > Shawre > White Bazyan > Red Bazyan > Gwll Swr > Kalar. According to this classification, the tolerance response in the Choman genotype is higher than that of the other genotypes, even though Choman showed the highest values of CI, CFW, CL, CW, CWT, APX, and CAT, and modest values of CDW and PC.

5. Conclusions

From the above discussion, it can be concluded that a significant genetic distance among the six rice genotypes for drought tolerance exists. The drought response in Kurdish rice genotypes varied based on the PEG amount. Drought stress had a negative impact on callus growth and morphology. PEG 6000 treatment-induced moisture stress assisted in the screening and identification of drought-tolerant genotypes. Choman showed better performance in terms of CI, CFW, CDW, CL, CW, CWT, and antioxidant enzyme activity, and a moderate level of PC. Based on the reporting of callus growth and biochemical parameters, the ranking was as follows: PEG resistant > susceptible, Choman > Shawre > White Bazyan > Red Bazyan > Gwll Swr > Kalar. In the short term, the use of callus traits is a cost-effective approach to the quick screening of resistant or sensitive rice genotypes. The study also concluded that the correlation between CI and CAT genotypes can be a reliable predictor of drought tolerance in rice genotypes. In the short term, the use of callus characters is useful for rapid screening of resistant or sensitive rice genotypes, and the reliable indicator of drought tolerance is not supported by the experimental work, as there is no evidence of a correlation with the drought tolerance of rice plants. As a future project, Choman and Shawre should be tested in field conditions to find a correlation between the responses of both genotypes under in vitro and field conditions.

Author Contributions

Conceptualization, A.H.A. and L.H.; Formal analysis, N.T., P.T. and D.A.; Funding acquisition, A.H.A. and L.H.; Investigation, D.R., P.K., P.T., T.V., and V.T.; Methodology, D.R., P.K., P.T., T.V. and L.H.; Resources, A.H.A. and L.H.; Validation, D.R., P.K. and T.V.; Visualization, D.R., N.T., V.T., P.K., and L.H.; Writing—original draft, L.H.; Writing—review and editing, L.H. and N.T. All authors have read and agreed to the published version of the manuscript.

Funding

This research was funded by the University of Sulaimani, Iraqi Kurdistan Region, and Mendel University in Brno, Czech Republic.

Acknowledgments

The authors are obliged to Biljana Đorđević & Peter Mendel for technical assistance.

Conflicts of Interest

The authors declare no conflict of interest. The funders had no role in the design of the study; in the collection, analyses, or interpretation of data; in the writing of the manuscript, or in the decision to publish the results.

References

  1. Tripathi, K.K.; Warrier, R.; Govila, O.P.; Ahuja, T. Biology of Rice (Oryza sativa L.); Department of Biotechnology, Government of India and Ministry of Environment & Forests Government of India, India Government: New Delhi, India, 2011. [Google Scholar]
  2. William, B. IRAQ: Rice Production Drops by More Than Half Due to Lack of Irrigation; USDA-FAS, Office of Global Analysis: Washington, DC, USA, 2015; pp. 260–8109. [Google Scholar]
  3. Tahir, N.A. Genetic variability evaluation among Iraqi rice (Oryza sativa L.) varieties using RAPD markers and protein profiling. J. Biol. Sci. 2014, 7, 13–18. [Google Scholar]
  4. Khush, G.S.; Toenniessen, G.H. Rice Biotechnology; CAB International: Wallingford, UK, 1991; p. 320. [Google Scholar]
  5. Fadhil, A.M. Drought mapping using geoinformation technology for some sites in the Iraqi Kurdistan region. Int. J. Digit. Earth 2011, 4, 239–257. [Google Scholar] [CrossRef]
  6. Salehi-Lisar, S.Y.; Bakhshayeshan-Agdam, H. Drought Stress in Plants: Causes, Consequences, and Tolerance. In Drought Stress Tolerance in Plants; Physiology and Biochemistry; Hossain, M.A., Wani, S.H., Bhattacharjee, S., Burritt, D.J., Tran, L.-S.P., Eds.; Springer: Cham, Switzerland, 2016; Volume 1, pp. 1–16. [Google Scholar]
  7. Kumar, S.; Sachdeva, S.; Bhat, K.V.; Vats, S. Plant responses to drought stress: Physiological, biochemical and molecular basis. In Biotic and Abiotic Stress Tolerance in Plants; Springer: Singapore, 2018; pp. 1–2. [Google Scholar]
  8. Kamarudin, Z.S.; Yusop, M.R.; Mohamed, M.T.M.; Ismail, M.R.; Harun, A.R. Growth performance and antioxidant enzyme activities of advanced mutant rice genotypes under drought stress condition. Agronomy 2018, 8, 279. [Google Scholar] [CrossRef] [Green Version]
  9. Ashraf, M.; Foolad, M.R. Roles of glycine betaine and proline in improving plant abiotic stress resistance. Environ. Exp. Bot. 2007, 59, 206–216. [Google Scholar] [CrossRef]
  10. Hasanuzzaman, M.; Nahar, K.; Anee, T.I.; Fujita, M. Glutathione in plants: Biosynthesis and physiological role in environmental stress tolerance. Physiol. Mol. Biol. Plants 2017, 23, 249–268. [Google Scholar] [CrossRef] [PubMed]
  11. Muscolo, A.; Junker, A.; Klukas, C.; Weigelt-Fischer, K.; Riewe, D.; Altmann, T. Phenotypic and metabolic responses to drought and salinity of four contrasting lentil accessions. J. Exp. Bot. 2015, 66, 5467–5480. [Google Scholar] [CrossRef] [Green Version]
  12. Joshi, R.; Shukla, A.; Sairam, R.K. In vitro screening of rice genotypes for drought tolerance using polyethylene glycol. Acta Physiol. Plant 2011, 33, 2209–2217. [Google Scholar] [CrossRef]
  13. Islam, M.M.; Kayesh, E.; Zaman, E.; Urmi, T.A.; Haque, M.M. Evaluation of rice (Oryza sativa L.) genotypes for drought tolerance at germination and early seedling stage. Agriculturists 2018, 16, 44–54. [Google Scholar] [CrossRef] [Green Version]
  14. Bajaj, Y.P.S. Biotechnology in rice improvement. In Biotechnology in Agriculture and Forestry; Springer: Berlin/Heidelberg, Germany, 1991; pp. 3–18. [Google Scholar]
  15. Yaqoob, U.; Jan, B.; Kaul, T.; Nawchoo, I.A. Tissue culture of rice: Problems, progress and prospects. Int. J. Innov. Res. Sci. Eng. Technol. 2016, 3, 581–613. [Google Scholar]
  16. Khan, S.; Javed, M.A.; Jahan, N.; Manan, F.A. A short review on the development of salt tolerant cultivars in rice. Int. J. Med. Sci. Public Health 2016, 5, 201–212. [Google Scholar]
  17. Al-Bahrany, A.M. Callus growth and proline accumulation in response to polyethylene glycol-induced osmotic stress in rice, Oryza sativa L. Pak. J. Biol. Sci. 2002, 5, 1294–1296. [Google Scholar]
  18. Islam, M.R.; Singh, R.K.; Salam, M.A.; Hassan, L.; Gregorio, G.B. Molecular diversity of stress tolerant rice genotypes using SSR markers. SABRAO J. Breed. Genet. 2008, 40, 127–139. [Google Scholar]
  19. Tahir, N.A.; Omer, D.A.; Lateef, D.D.; Ahmad, D.A.; Salih, S.H.; Khal, L.H. Diversity and population structure analysis of faba bean (Vicia faba L.) accessions using SSR markers. J. Agr. Sci. Technol. 2019, 21, 463–474. [Google Scholar]
  20. Youens-Clark, K.; Buckler, E.; Casstevens, T.; Chen, C.; Declerck, G.; Derwent, P.; Dharmawardhana, P.; Jaiswal, P.; Kersey, P.; Karthikeyan, A.S.; et al. Gramene database: Updates and extensions. Nucleic Acids Res. 2010, 39, D1085–D1094. [Google Scholar]
  21. Zahid, M.N.; Hasan, M.; Adil, M.; Hossain, M.M.; Mian, M.A.K. In vitro screening for salt tolerance in aromatic rice genotypes. J. Biosci. Bioeng. 2014, 1, 28–32. [Google Scholar]
  22. Ruzin, S.E. Plant Microtechnique and Microscopy; Oxford University Press: Oxford, UK, 1999; p. 322. [Google Scholar]
  23. Aebi, H. Catalase in vitro. Methods Enzymol. 1984, 105, 121–126. [Google Scholar] [PubMed]
  24. Rao, M.V.; Paliyath, G.; Ormrod, D.P.; Murr, D.P.; Watkins, C.B. Influence of salicylic acid on H2O2 production, oxidative stress, and H2O2-metabolizing enzymes. Salicylic acid-mediated oxidative damage requires H2O2. Plant Physiol. 1997, 115, 137–149. [Google Scholar] [CrossRef] [PubMed] [Green Version]
  25. Carillo, P.; Gibon, Y. Protocol: Extraction and determination of proline; PrometheusWiki: Clayton South, Australia, 2011. [Google Scholar]
  26. Ketata, H.Y.; Yau, S.K.; Nachit, M. Relative consistency performance across environments. In Proceedings of the International Symposium on Physiology and Breeding of Winter Cereals for Stressed Mediterranean Environments, Montpellier, France, 3–6 July 1989; pp. 391–400. [Google Scholar]
  27. Pour-Aboughadareh, A.; Yousefian, M.; Moradkhani, H.; Moghaddam Vahed, M.; Poczai, P.; Siddique, K.H.M. iPASTIC: An online toolkit to estimate plant abiotic stress indices. Appl. Plant Sci. 2019, 7, e11278. [Google Scholar] [CrossRef] [PubMed] [Green Version]
  28. Lawson, T.; Kramer, D.M.; Raines, C.A. Improving yield by exploiting mechanisms underlying natural variation of photosynthesis. Curr. Opin. Biotech. 2012, 23, 215–220. [Google Scholar] [CrossRef]
  29. Donde, R.; Kumar, J.; Gouda, G.; Gupta, M.K.; Mukherjee, M.; Baksh, S.Y.; Mahadan, P.; Sahoo, K.K.; Behera, L.; Dash, S.K. Assessment of genetic diversity of drought tolerant and susceptible rice genotypes using microsatellite markers. Rice Sci. 2019, 26, 239–247. [Google Scholar] [CrossRef]
  30. Li, J.Z.; Chen, Y.H.; Zhang, D.J.; Zhang, G.F.; Lu, B.X. Genetic diversity analysis and DNA fingerprinting of main Japonica rice varieties in Heilongjiang Province. Qual. Assur. Saf. Crops Foods 2019, 11, 23–29. [Google Scholar] [CrossRef]
  31. Perez-Almeida, I.; Celi-Hearn, R.; Sanchez-Mora, F.; Paz-Carrasco, L.; Ramos-Viteri, B. Assessment of molecular diversity of Ecuadorian rice cultivars using simple sequence repeat markers. BioAgro 2019, 31, 3–12. [Google Scholar]
  32. Singh, R.K.; Sharma, R.K.; Singh, A.K.; Singh, V.P.; Dingh, N.K.; Tiwari, S.P.; Mohapatara, T. Suitability of mapped sequence tagged microsatellite markers for establishing distinctness, uniformity and stability in aromatic rice. Euphytica 2004, 135, 135–143. [Google Scholar] [CrossRef]
  33. Muto, C.; Ebana, K.; Kawano, K.; Bounphanousay, V.; Bouphanousay, C.; Kanyavong, K.; Inthapanya, P.; Boualaphanh, C.; Sato, T.; Ishikawa, R.; et al. Genetic variation in rice (Oryza sativa L.) germplasm from northern Laos. Breed. Sci. 2019, 69, 272–278. [Google Scholar] [CrossRef] [PubMed] [Green Version]
  34. Wani, S.H.; Sofi, P.A.; Gosal, S.S.; Singh, N.B. In vitro screening of rice (Oryza sativa L.) callus for drought tolerance. Commun. Biometry Crop Sci. 2010, 5, 108–115. [Google Scholar]
  35. Nahar, S.; Sahoo, L.; Tanti, B. Screening of drought tolerant rice through morpho-physiological and biochemical approaches. Biocatal. Agric. Biotechnol. 2018, 15, 150–159. [Google Scholar] [CrossRef]
  36. Bunnag, S.; Suwanagul, A. Improvement of drought tolerance in Thai rice cultivar RD6 through somaclonal variation. Songklanakarin J. Sci. Technol. 2017, 39, 723–729. [Google Scholar]
  37. Inostroza, L.; Acuña, H.; Tapia, G. Relationships between phenotypic variation in osmotic adjustment, water use efficiency, and drought tolerance of seven cultivars of Lotus corniculatus L. Chik. J. Agr. Res. 2015, 75, 3–12. [Google Scholar] [CrossRef] [Green Version]
  38. Le Gall, H.; Philippe, F.; Domon, J.M.; Gillet, F.; Pelloux, J.; Rayon, C. Cell wall metabolism in response to abiotic stress. Plants 2015, 4, 112–166. [Google Scholar] [CrossRef] [PubMed]
  39. Sharifi, P.; Amirnia, R.; Majidi, E.; Hadi, H.; Roustaii, M.; Nakhoda, B. Relationship between drought stress and some antioxidant enzymes with cell membrane and chlorophyll stability in wheat lines. Afr. J. Microbiol. Res. 2012, 6, 617–623. [Google Scholar]
  40. Swapna, S.; Shylaraj, K.S. Screening for osmotic stress responses in rice varieties under drought condition. Rice Sci. 2017, 24, 253–263. [Google Scholar] [CrossRef]
Figure 1. Box charts of growth characters of the kernel-derived calli from six rice genotypes, revealing the significant divergences between normal and stress conditions. (A). callus induction (CI), (B). callus fresh weight (CFW), (C). callus dry weight (CDW), (D). cell length (CL), (E). cell width (CW), and (F). cell wall thickness (CWT). The numbers given are the average values computed for the six measurements found for control (T0.00), and polyethylene glycol (PEG) concentrations (T0.5, T1.00, and T1.50). Different letters indicate a significant variation between box mean values by Duncan’s multiple-range analysis (p ≤ 0.05). A blue dot in the box represents the mean value. Red dots denote the minimum and maximum values, while extreme values (outliers) are depicted as dots outside the whiskers.
Applsci 10 04471 g001
Figure 2. The effect of osmotic stress induced by different polyethylene glycol (PEG) concentrations on the callus morphology in rice genotypes, including cell length, cell width, and cell wall thickness: (a) Choman at 0.00% PEG, (b) Choman at 1.50% PEG, (c) Gwll Swr at 0.00% PEG, and (d) Gwll Swr at 1.50% PEG.
Applsci 10 04471 g002
Figure 3. Box plots of biochemical traits of the kernel-derived calli from six rice genotypes, showing the significant variations between non-stressed and stressed conditions. (A). proline content (PC), (B). ascorbate peroxidase (APX), and (C). catalase (CAT). The numbers given are the mean values calculated for the six measurements obtained for control (T0.00), and PEG concentrations (T0.5, T1.00, and T1.50). Different letters suggest a significant variation between mean values by Duncan’s multiple-range analysis (p ≤ 0.05). A blue dot in the box represents the mean value. Red dots denote the minimum and maximum values, while extreme values (outliers) are represented as dots outside the whiskers.
Applsci 10 04471 g003
Figure 4. Box charts of inorganic elements of the kernel-derived calli from six rice genotypes, indicating wide differences between control and stress conditions. (A): Na, (B): Mg, (C): P, (D): S, (E): K, and (F): Ca. The numbers given are the mean values determined for the six measurements obtained for control (T0.00), and PEG concentrations (T0.5, T1.00, and T1.50). The different letters indicate a significant variation between the mean values of each trait by Duncan’s multiple-range analysis (p ≤ 0.05). A blue dot in the box represents the mean value. Red dots denote the minimum and maximum values, while extreme values (outliers) are shown as dots outside the whiskers.
Applsci 10 04471 g004
Figure 5. Principal component analysis (PCA) plot showing the distribution and relationship between rice genotypes and studied traits. (A). normal condition, (B). T0.50 stress, (C). T1.00 stress, and (D). T1.50 stress.
Applsci 10 04471 g005
Figure 6. Pearson correlation (r) of nine growth and biochemical characters based on their values in unstressed and stressed conditions. (A). T0.00, (B). T0.50, (C). T1.00, and (D). T1.50.
Applsci 10 04471 g006
Table 1. Name and location of different rice genotypes used in the experiment.
Genotype CodeGenotype NameKurdistan Location
G1ChomanPenjwen
G2Gwll SwrHajiawa
G3KalarKalar
G4Red BazyanBazyan
G5ShawreRaniyah
G6White BazyanBazyan
Table 2. Primer information and diversity parameters of 11 simple sequence repeats (SSRs) markers applied in this study. bp: Base Pair, PIC: Polymorphic Information Content, DI: Diversity Index, and PI: Probabilities of Identity.
SSR MarkerChromosome NumberAmplicon Size (bp)Number of AllelesPICDIPI
RM107931.00140.00–160.003.000.510.570.25
RM163.00140.00–180.004.000.570.610.19
RM2414.00120.00–140.002.000.380.500.38
RM135.00120.00–160.003.000.600.660.16
RM4006.00140.00–160.003.000.540.610.22
RM4187.00140.00–160.002.000.380.500.38
RM4438.00240.00–300.005.000.770.780.04
RM238189.00100.00–140.003.000.520.530.19
RM22810.00180.00–200.004.000.690.720.09
RM28711.0080.00–120.004.000.840.840.02
RM30912.00160.00–180.002.000.380.500.38
Average 3.180.560.620.21
Table 3. Dissimilarity matrix of various rice genotypes using SSR data.
GenotypeChomanGwll SwrKalarRed BazyanShawreWhite Bazyan
Choman0.00
Gwll Swr0.850.00
Kalar0.670.880.00
Red Bazyan0.790.780.770.00
Shawre0.710.630.710.630.00
White Bazyan0.330.850.680.670.780.00
Table 4. Impact of PEG concentrations on the callus growth parameters in rice genotypes. The statistics provided are the mean values measured for the three measures collected over PEG concentrations (0.00% (T0.00), 0.50% (T0.50), 1.00% (T1.00), and 1.50% (T1.50)) for each genotype. CI: Callus Induction, CFW: Callus Fresh Weight, CDW: and Callus Dry Weight. The common letters within a column suggest no major variation between mean values, according to Duncan’s Multiple Range Test (p ≤ 0.05).
CI (%)CFW (g)CDW (g)
GenotypeT0.00T0.50T1.00T1.50T0.00T0.50T1.00T1.50T0.00T0.50T1.00T1.50
Choman86.67 ab86.67 a86.67 a86.67 a1.33 ab1.18 a1.07 a0.89 a0.64 b0.48 ab0.43 b0.38 a
Gwll Swr80.00 bc66.67 b53.33 b53.33 c1.01 c0.80 c0.74 c0.72 c0.46 d0.38 c0.34 c0.32 bc
Kalar73.33 bc53.33 bc60.00 b40.00 d1.19 b1.02 b0.90 b0.80 b0.54 cd0.45 b0.36 c0.34 b
Red Bazyan66.67 c46.67 c53.33 b40.00 d1.00 c0.67 c0.49 d0.40 d0.44 d0.28 d0.21 d0.16 d
Shawre86.67 ab86.67 a86.67 a80.00 ab1.22 b1.06 ab0.99 a0.91 a0.58 bc 0.52 ab0.48 a0.38 a
White Bazyan100.00 a100.00 a86.67 a66.67 bc1.40 a1.15 ab1.02 a0.30 c0.76 a0.54 a0.35 c0.30 c
Table 5. Effect of different concentrations of PEG on the callus morphology and dimension. The numbers given are the mean values calculated for the three measurements obtained for PEG concentrations (0.00% (T0.00), 0.50% (T0.5), 1.00% (T1.00), and 1.50% (T1.50)) for each genotype. CL: Callus Cell Length, CW: Callus Cell Width and CWT: Callus Cell Wall Thickness. The similar letters within a column suggest no significant variation between mean values, according to Duncan test (p ≤ 0.05).
CL (µm)CW (µm)CWT (µm)
GenotypeT0.00T0.50T1.00T1.50T0.00T0.50T1.00T1.50T0.00T0.50T1.00T1.50
Choman38.90 b33.50 a31.07 a29.47 a26.37 b19.77 a14.67 a16.20 a2.00 b2.43 a2.90 a3.33 a
Gwll Swr33.57 c29.77 c17.77 f16.10 f17.83 d17.87 b9.93 b10.13 e1.93 b1.93 c2.53 c3.17 ab
Kalar32.63 c22.03 e23.43 c24.77 b17.83 d10.73 d14.20 a13.03 b1.97 b2.57 a2.83 a3.10 ab
Red Bazyan39.10 b31.20 b25.90 b23.97 c17.87 d17.47 b14.67 a12.17 cd2.37 a2.53 a2.67 bc2.23 d
Shawre47.80 a22.03 e20.53 d19.53 d33.23 a17.17 b14.17 a12.50 c1.67 c2.27 b2.57 c2.23 d
White Bazyan33.17 c25.63 d19.30 e17.80 e20.00 c15.47 c14.33 a11.83 d1.67 c2.57 a2.77 ab3.03 b
Table 6. Rank of rice genotypes by the stress tolerance index (STI) and the average sum of ranks (ASRs) based on callus growth characters under stress conditions. Genotypes with the highest STI and lowest ASR values were considered to be the best genotypes and the best performance of each phenotype was assigned the lowest rank.
Stress LevelIndexChomanGwll SwrKalarRed BazyanShawreWhite Bazyan
T0.50STI1.060.750.540.591.051.08
AR2.183.645.824.733.551.09
Rank246531
T1.00STI1.010.540.490.501.010.92
AR1.454.735.554.642.092.55
Rank156423
T1.50STI1.010.530.610.550.940.74
AR1.185.643.184.362.733.91
Rank163524
OverallSum of Ranks415151478
Overall Rank155423
Table 7. Influence of drought stress on the proline content, ascorbate peroxidase (APX), and catalase (CAT) activities in the callus of six rice genotypes. The results displayed are the average of three replicates. Different letters within a column suggest a significant variation between mean values by Duncan’s multiple-range analysis (p ≤ 0.05).
Proline Content (µmol/g FW)APX (nkat/mg FW)CAT (nkat/mg FW)
GenotypeT0.00T0.50T1.00T1.50T0.00T0.50T1.00T1.50T0.00T0.50T1.00T1.50
Choman0.30 a0.36 b0.40 b0.49 b0.57 b0.86 bc1.61 a2.32 a9.11 b26.98 a37.58 a48.91 a
Gwll Swr0.31 a0.46 a0.49 a0.62 a0.54 b0.75 c1.10 c1.23 d9.66 ab17.55 c25.93 c37.65 c
Kalar0.28 b0.35 b0.33 c0.56 b0.51 b0.93 abc1.03 c1.24 d8.99 b16.55 c22.35 d38.03 c
Red Bazyan0.12 d0.29 c0.34 c0.38 d0.59 a1.11 a1.27 b1.54 c10.49 a16.90 c24.56 cd33.21 d
Shawre0.16 c0.18 d0.45 a0.64 a0.52 b0.90 bc1.33 b1.80 b7.22 c22.63 b36.39 a49.35 a
White Bazyan0.15 c0.21 d0.31 c0.48 c0.61 a1.02 ab1.26 b1.59 c8.54 c22.60 b29.53 b42.96 b
Table 8. Rank of rice genotypes determined by the stress tolerance index (STI) and the average number of ranks (ASRs) dependent on biochemical characteristics under stress conditions. Genotypes with the highest STI and lowest ASR values were considered to be the best genotypes and the lowest rank was given to the best performance of each genotype.
Stress IndexChomanGwll SwrKalarRed BazyanShawreWhite Bazyan
T0.50STI2.942.061.822.141.962.32
AR1.733.825.003.823.732.91
Rank145432
T1.00STI4.133.032.423.073.153.03
AR1.823.645.183.822.823.73
Rank136524
T1.50STI5.414.354.074.124.284.38
AR1.913.824.364.453.183.27
Rank145623
OverallSum of Ranks311161579
Overall Rank146523
Table 9. Accumulation of elements in callus under control and drought stress conditions. The results displayed are an average of six replicates. Dissimilar letters within a column indicate a statistical variation between mean values using Duncan’s multiple-range test (p ≤ 0.05).
Sodium-Na (µg/g)Magnesium-Mg (µg/g)Phosphorus-P (µg/g)
GenotypeT0.00T0.50T1.00T1.50T0.00T0.50T1.00T1.50T0.00T0.50T1.00T1.50
Choman277.18 ab200.36 b197.04 a226.60 a2176.58 ab945.64 c996.51 c1085.92 c9666.19 b6149.89 c6135.53 c6548.81 cd
Gwll Swr89.98 c128.92 b76.83 c88.50 b1032.93 b909.20 c1180.11 bc1207.69 bc6450.28 c4775.06 c6690.95 c6015.10 d
Kalar223.65 bc142.50 c142.01b158.82 ab2793.61 a1493.32 b1492.67 b1492.76 b10,710.00 b9133.18 b9133.02 b8473.59 b
Red Bazyan262.30 ab368.89 a210.28 a147.08 ab3066.46 a3466.10 a2596.67 a2256.66 a13,125.19 a12101.34 a14,121.74 a12,135.20 a
Shawre382.13 a99.03 c83.42 c86.48 b2546.66 a1606.44 b1445.75 b1180.56 bc6960.24 c6106.44 c7774.10 bc5880.94 d
White Bazyan153.07 bc208.59 b181.91 ab226.84 a1245.43 b1712.43 b1084.96 bc1212.17 bc7843.00 c6712.43 bc7606.30 bc7499.05 bc
Sulfur-S (µg/g)Potassium-K (µg/g)Calcium-Ca (µg/g)
GenotypeT0.00T0.50T1.00T1.50T0.00T0.50T1.00T1.50T0.00T0.50T1.00T1.50
Choman5646.40 a4767.39 b2280.43 b4924.31 b47,508.16 a21,935.74 b21,366.27 d24,449.70 b7097.42 a1869.90 c2144.98 b2980.92 b
Gwll Swr3964.31 b10,731.37 a15,361.57 a10,632.72 a22,382.91 b19,319.31 b21,886.44 d26,182.67 ab1127.05 b1648.26 c2161.53 b6551.41 a
Kalar4699.84 ab3773.94 b3773.38 b3670.19 b46,733.60 a34,232.55 ab34,232.13 b33,857.95 ab5034.94 a2595.58 b2595.08 b2612.69 b
Red Bazyan5473.38 a4886.95 b6428.98 b5002.00 b49,711.49 a45,255.60 a48,698.00 a37,482.84 a5902.47 a6507.31 a5083.59 a3185.23 b
Shawre1900.55 c3717.18 b1482.66 b1764.29 b28,554.20 b22,420.70 b32,474.17 bc24,190.05 b6014.87 a1706.08 c2448.78 b1670.19 b
White Bazyan2335.68 c2268.83 b3472.13 b2931.85 b26,115.37 b22,651.95 b23,770.32 cd26,389.31 ab2436.20 b2329.11 b1983.52 b2605.32 b

