Article

Experimental Characterization of Plasmonic Sensors Based on Lab-Built Tapered Plastic Optical Fibers

1
Department of Engineering, University of Campania Luigi Vanvitelli, 81031 Aversa, Italy
2
Department of Physics E. Pancini, University of Naples Federico II, 80126 Naples, Italy
*
Author to whom correspondence should be addressed.
Appl. Sci. 2020, 10(12), 4389; https://doi.org/10.3390/app10124389
Submission received: 3 June 2020 / Revised: 16 June 2020 / Accepted: 21 June 2020 / Published: 26 June 2020
(This article belongs to the Special Issue World of Biosensing)

Abstract

:
In this work, we have compared several configurations of surface plasmon resonance (SPR) sensors based on D-shaped tapered plastic optical fibers (TPOFs). Particularly, the TPOFs used to obtain the SPR sensors are made by a lab-built system based on two motorized linear positioning stages and a heating plate. Preliminarily, a comparative analysis has been carried out between two different configurations, one with and one without a thin buffer layer deposited between the core of TPOFs and the gold film. After this preliminary step, we have used the simpler configuration, obtained without the buffer layer, to realize different SPR D-shaped TPOF sensors. This study could be of interest in SPR D-shaped multimode plastic optical fiber (POF) sensors because, without the tapers, the performances decrease when the POF’s diameter decreases, whereas the performances improve in SPR D-shaped tapered POF sensors, where the diameter decreases in the D-shaped sensing area. The performances of the SPR sensors based on different taper ratios have been analyzed and compared. The SPR-TPOF sensors have been tested using water–glycerin mixtures with refractive indices ranging from 1.332 to 1.381 RIU. According to the theory, the experimental results have demonstrated that, as the taper ratio increases, the sensitivity of the SPR sensor increases as well, while on the contrary the signal-to-noise ratio (SNR) decreases.

1. Introduction

The surface plasmon resonance (SPR) technique has been widely used in the last two decades as the detection principle for several sensors used in the biological and chemical sensing fields [1,2,3,4]. The SPR phenomenon occurs at the interface between a dielectric layer and a thin metal film (usually a gold film), hit by a p-polarized light. The incident light generates electron charge density waves called plasmons. An electromagnetic wave, namely a surface plasmon wave (SPW), propagates at the metal–dielectric interface. When the p-polarized light is incident on this metal-dielectric interface in such a way that the propagation constant (and energy) of the resultant evanescent wave is equal to that of the SPW, strong absorption of light takes place as a result of the transfer of energy, and a dip at a particular wavelength (resonance wavelength) appears in the output signal. The resonance wavelength is highly dependent on changes in the refractive index of the dielectric layer.
In particular, low-cost sensors based on SPR in optical fibers for the implementation of biosensors and chemical sensors constitute a very sensitive method for determining even small refractive index changes at the interface between a metal substrate and a dielectric medium (a receptor layer that interacts with a specific analyte) [5,6,7,8,9,10,11]. In order to improve the performances of these kinds of sensors, different configurations have been recently proposed [12,13,14,15,16].
Particularly, multimode plastic optical fibers (POFs) are suitable for low-cost SPR sensing systems. They are especially advantageous due to their simple setup and for the POFs’ properties, such as excellent flexibility, easy manipulation, great numerical aperture, large diameter, and the ability to withstand smaller bend radii than glass [17]. Furthermore, the appealing properties of POFs that have increased their popularity and competitiveness for telecommunications are exactly those that are important for optical sensors based on glass optical fibers, with the addition of simpler manufacturing and handling procedures. In this context, Cennamo et al. have presented several biochemical applications based on an SPR-POF platform, described in [17], by varying the molecular recognition element (MRE) [18,19,20]. Moreover, several works have been already presented on the theoretical analysis of SPR sensors in tapered optical fibers, such as [21,22,23,24]. In particular, as supposed by the theory, to improve the sensitivity of the SPR-POF sensor in biosensing, tapered plastic optical fiber can be introduced, such as that already tested in nicotine detection by SPR D-shaped tapered POFS (TPOFs) combined with a specific molecularly imprinted polymer (MIP) [21].
In the SPR D-shaped POF sensors, it has been demonstrated that when the diameter of the POF decreases from 1000 to 250 µm, the performances decrease too [25]. In fact, in an SPR D-shaped POF sensor, obtained by a multimode POF with a diameter of 250 µm, the sensitivity is about 550 nm/RIU. Moreover, when a tapered POF is present at the input or output of the SPR sensing area, different filtering of higher-order modes in plastic multimode fibers can be obtained [26]. In particular, the experimental results presented in [26] have shown that the tapered filter positioned after the SPR D-shaped POF area improves the performances in terms of refractive index range and depth of the SPR curve.
Consequently, in SPR D-shaped tapered POF sensors, when the diameter in the D-shaped sensing area changes with the taper ratio and when the shape of the tapered POF, at input/output of the SPR area, changes as well, a specific analysis is required. This work presents a detailed analysis, carried out by specific experiments, of the performances of different SPR sensors realized by D-shaped TPOFs.
Finally, in these kinds of SPR D-shaped POF sensors, the sensitivity is also a function of the D-shaped POF parameters [27].
In order to realize the SPR sensors required for this study, in the first step we obtained TPOFs with different taper ratios, and then we used them to make D-shaped sensing areas by polishing and sputtering processes [17]. In particular, in this paper we first described the designed system used in the laboratory to realize TPOFs with different taper ratios, and then we compared the performances of these SPR sensor configurations in terms of sensitivity and signal-to-noise ratio (SNR), exploiting different water–glycerin solutions in contact with the gold film (solutions with refractive indices ranging from 1.332 to 1.381 RIU).

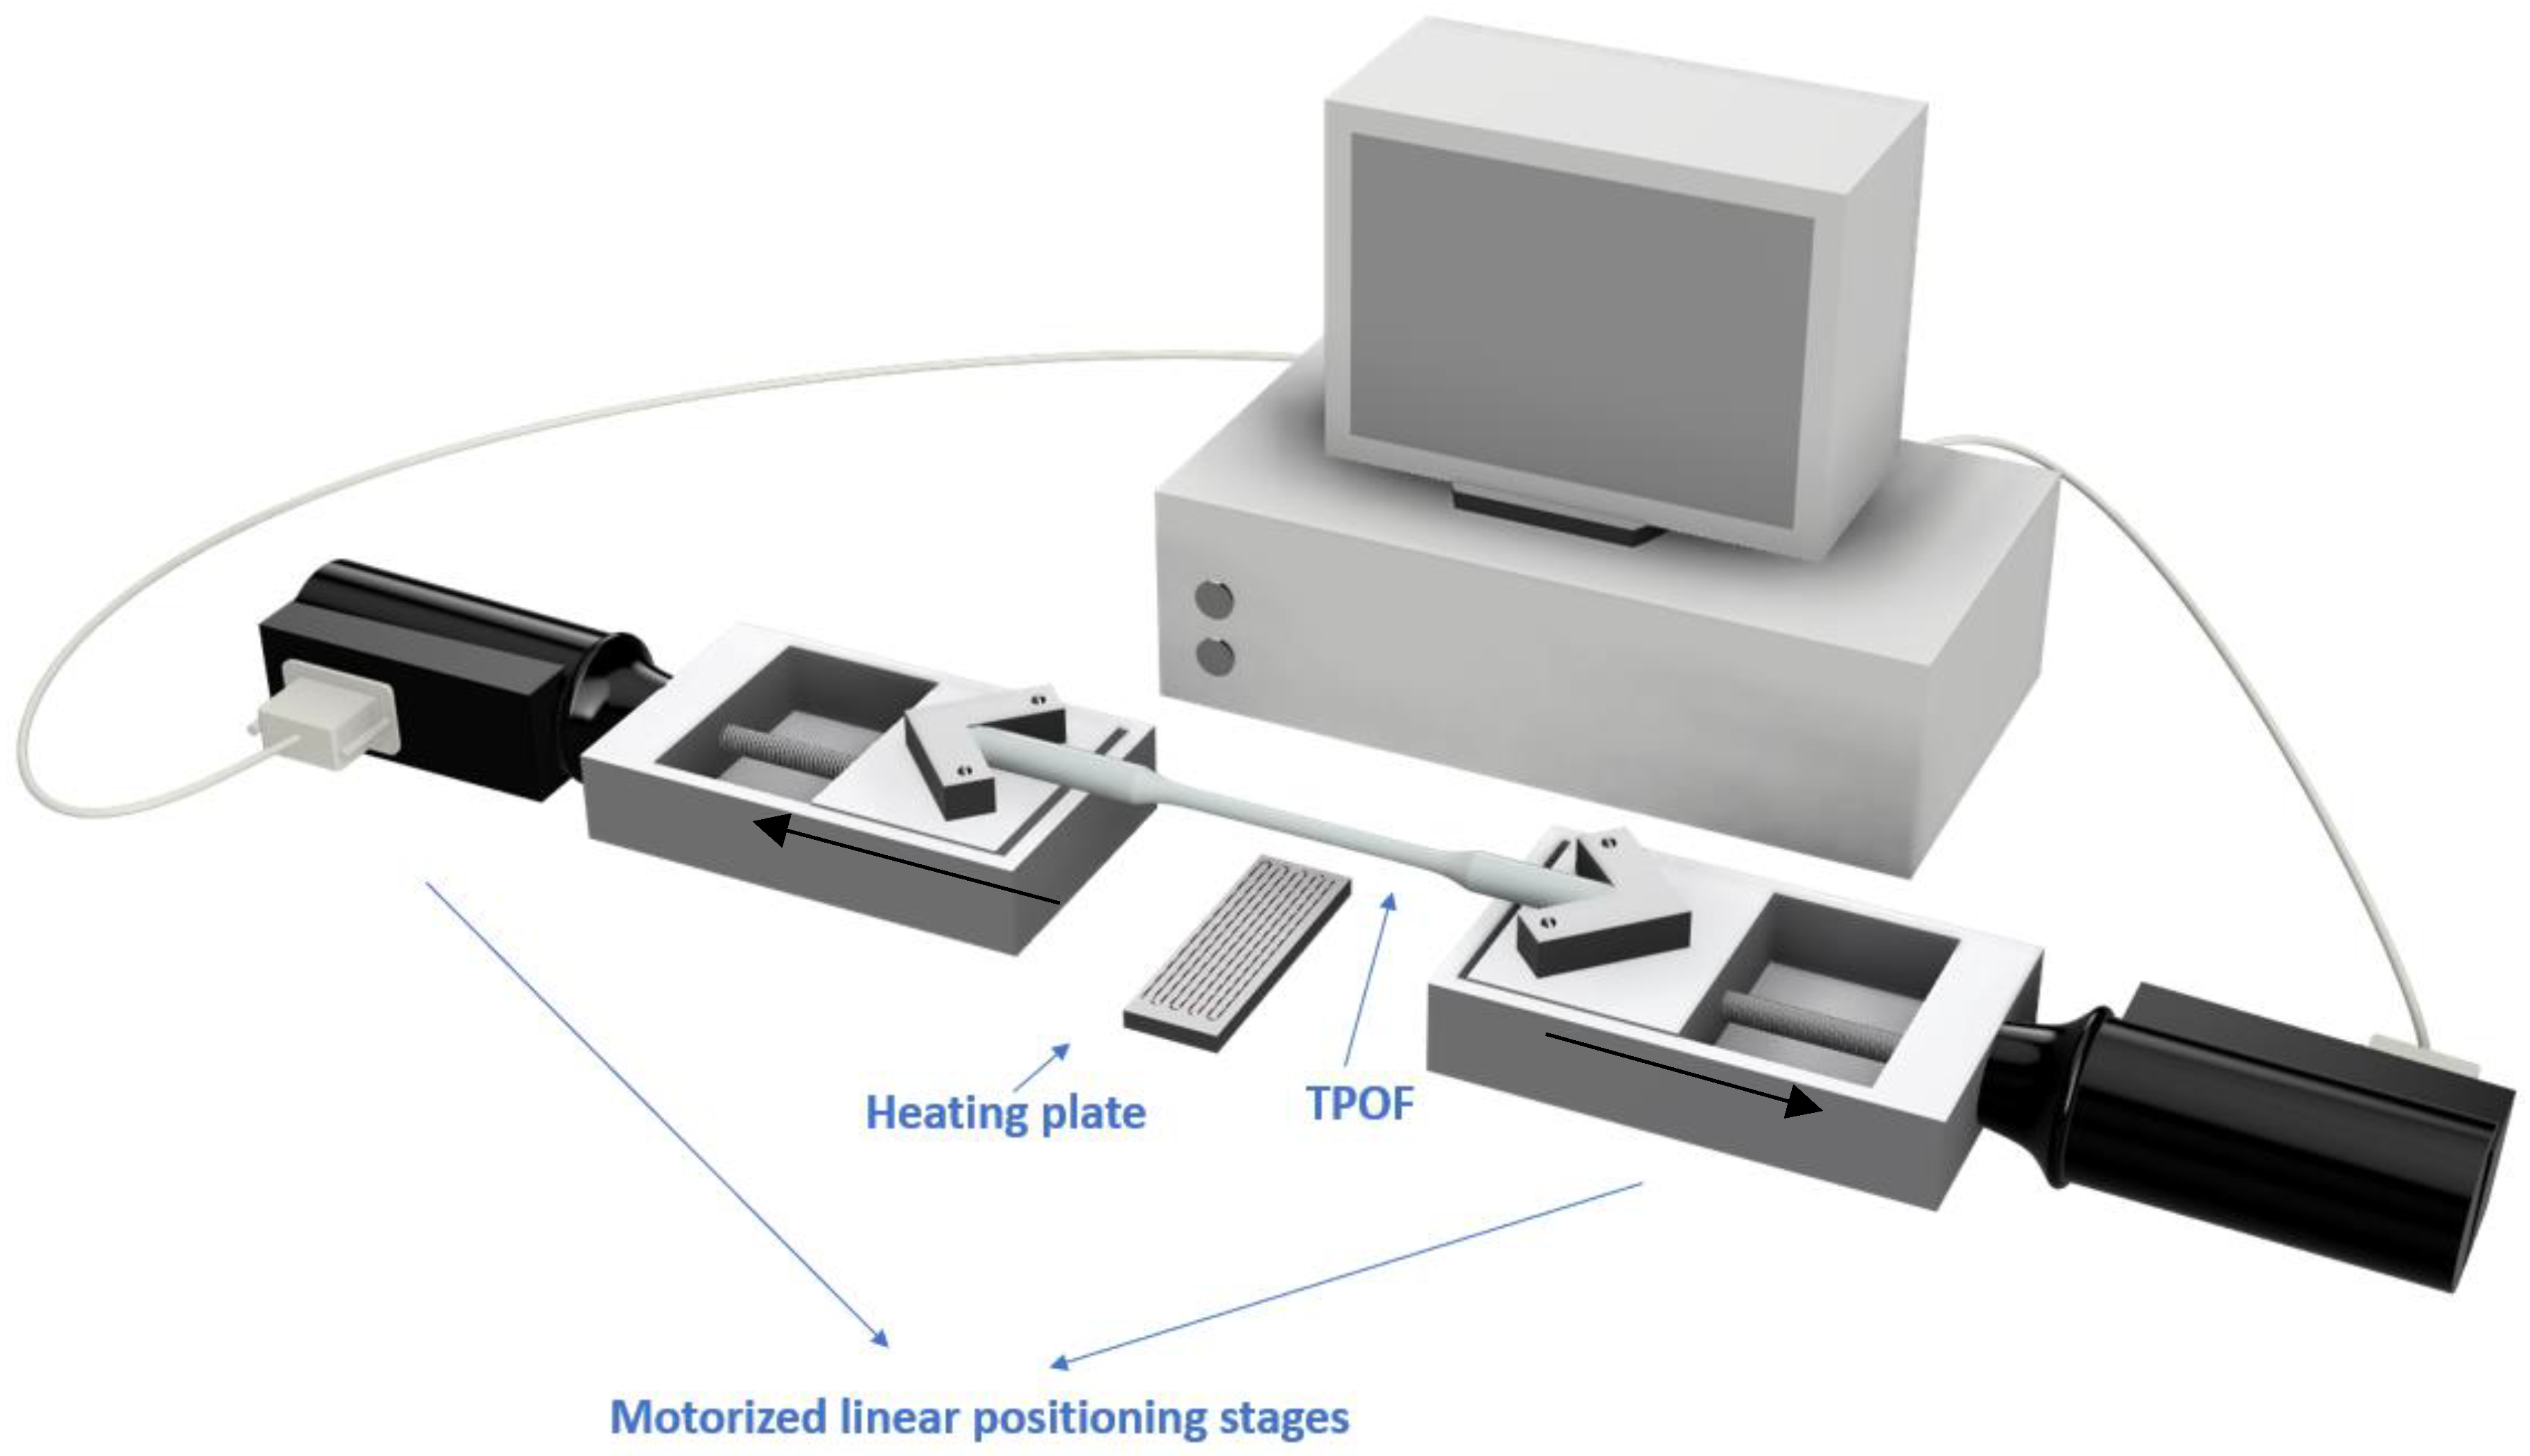
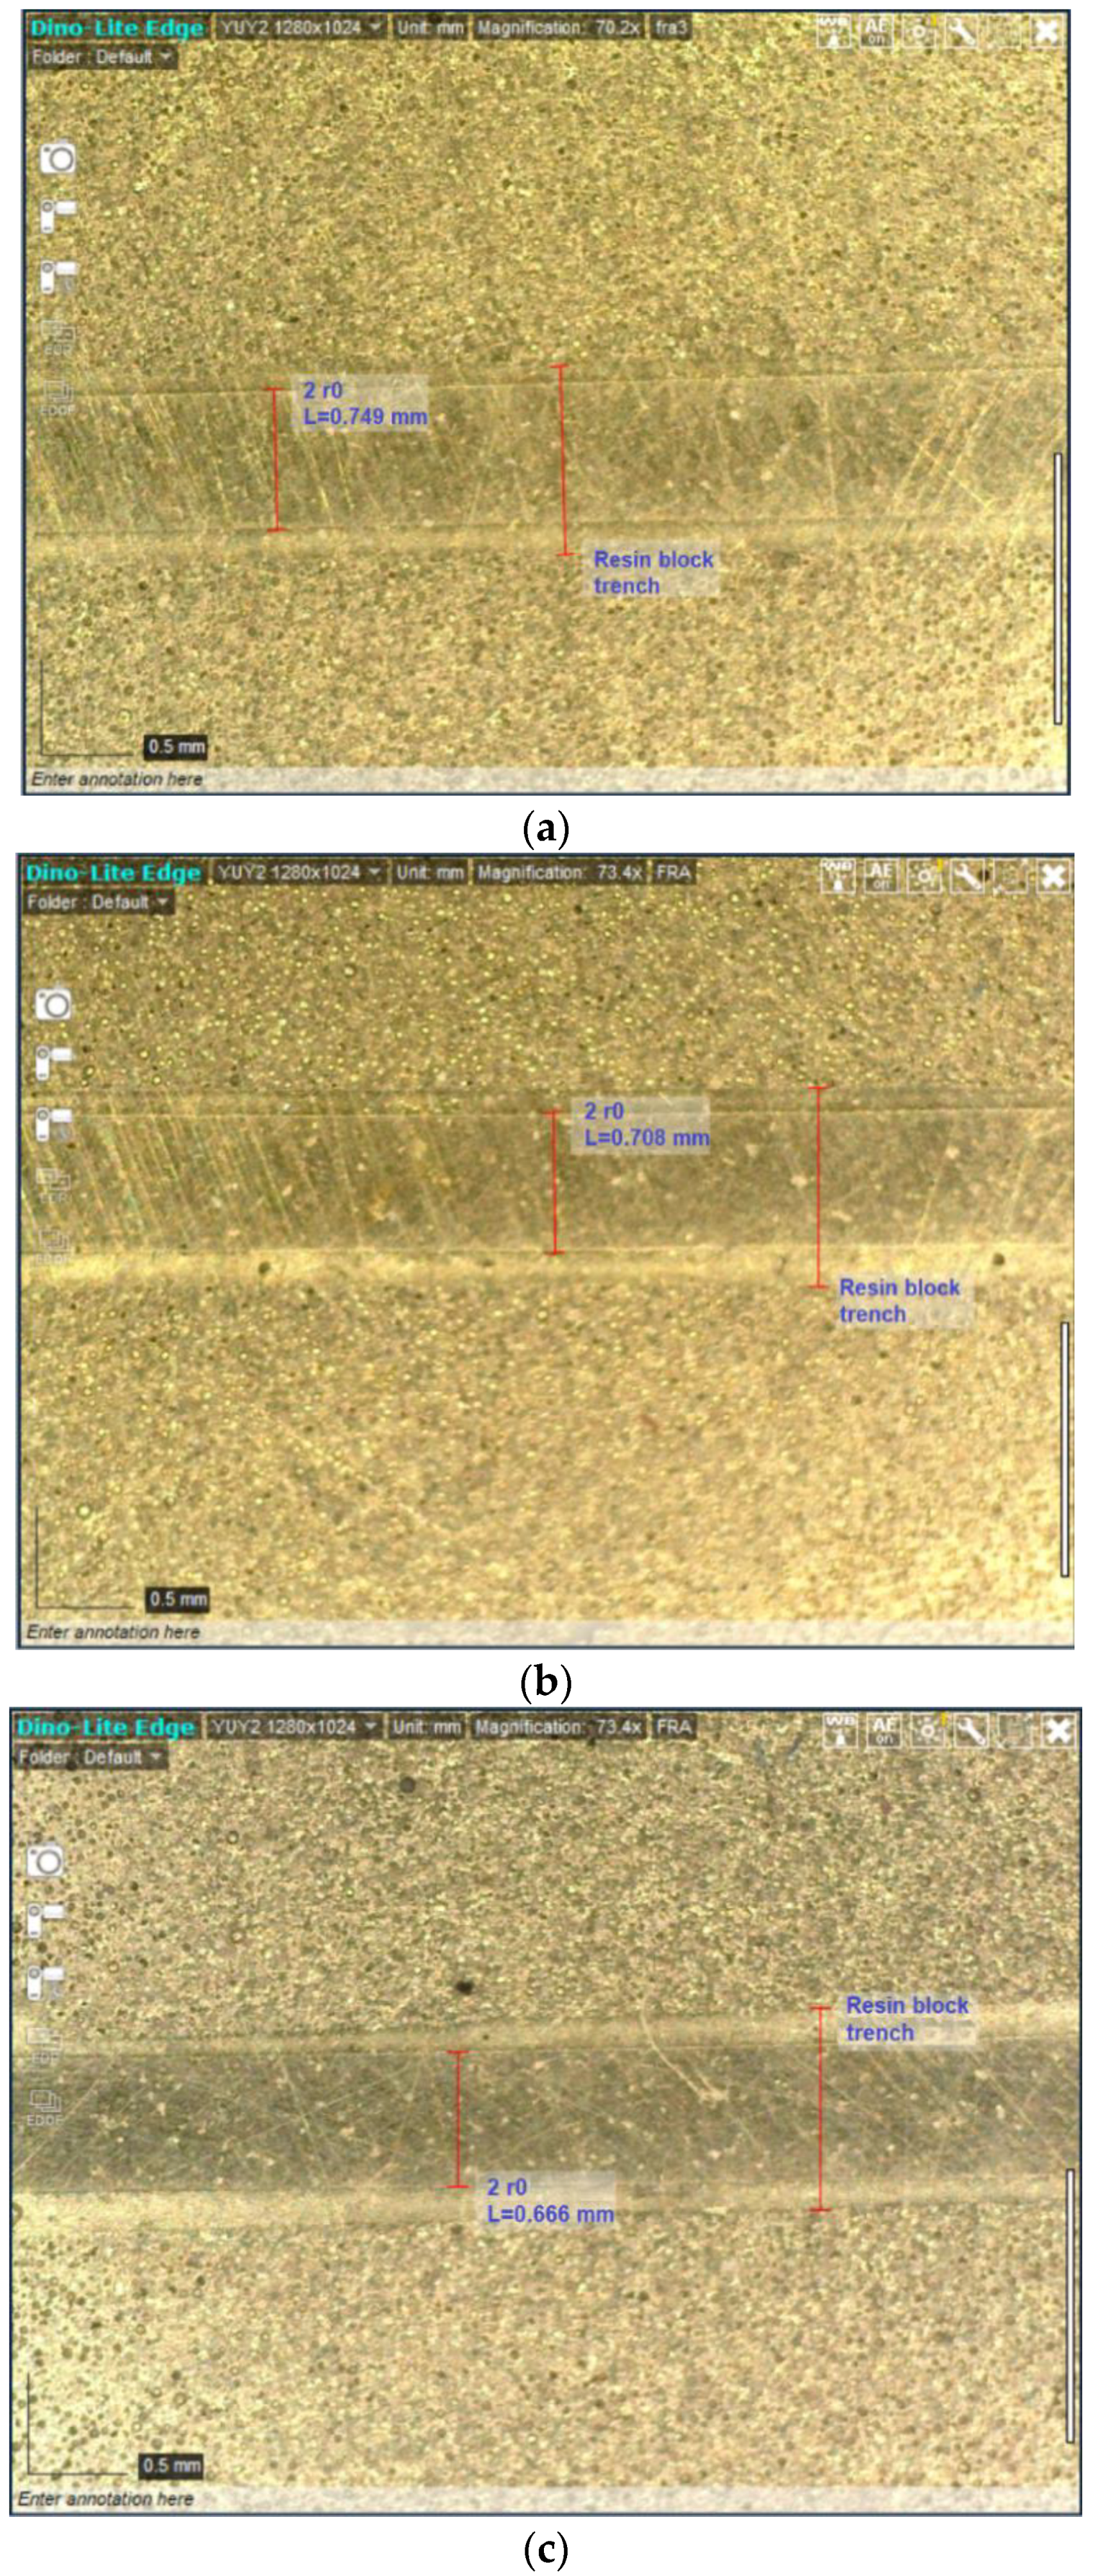
2. Lab-Built System to Make TPOFs
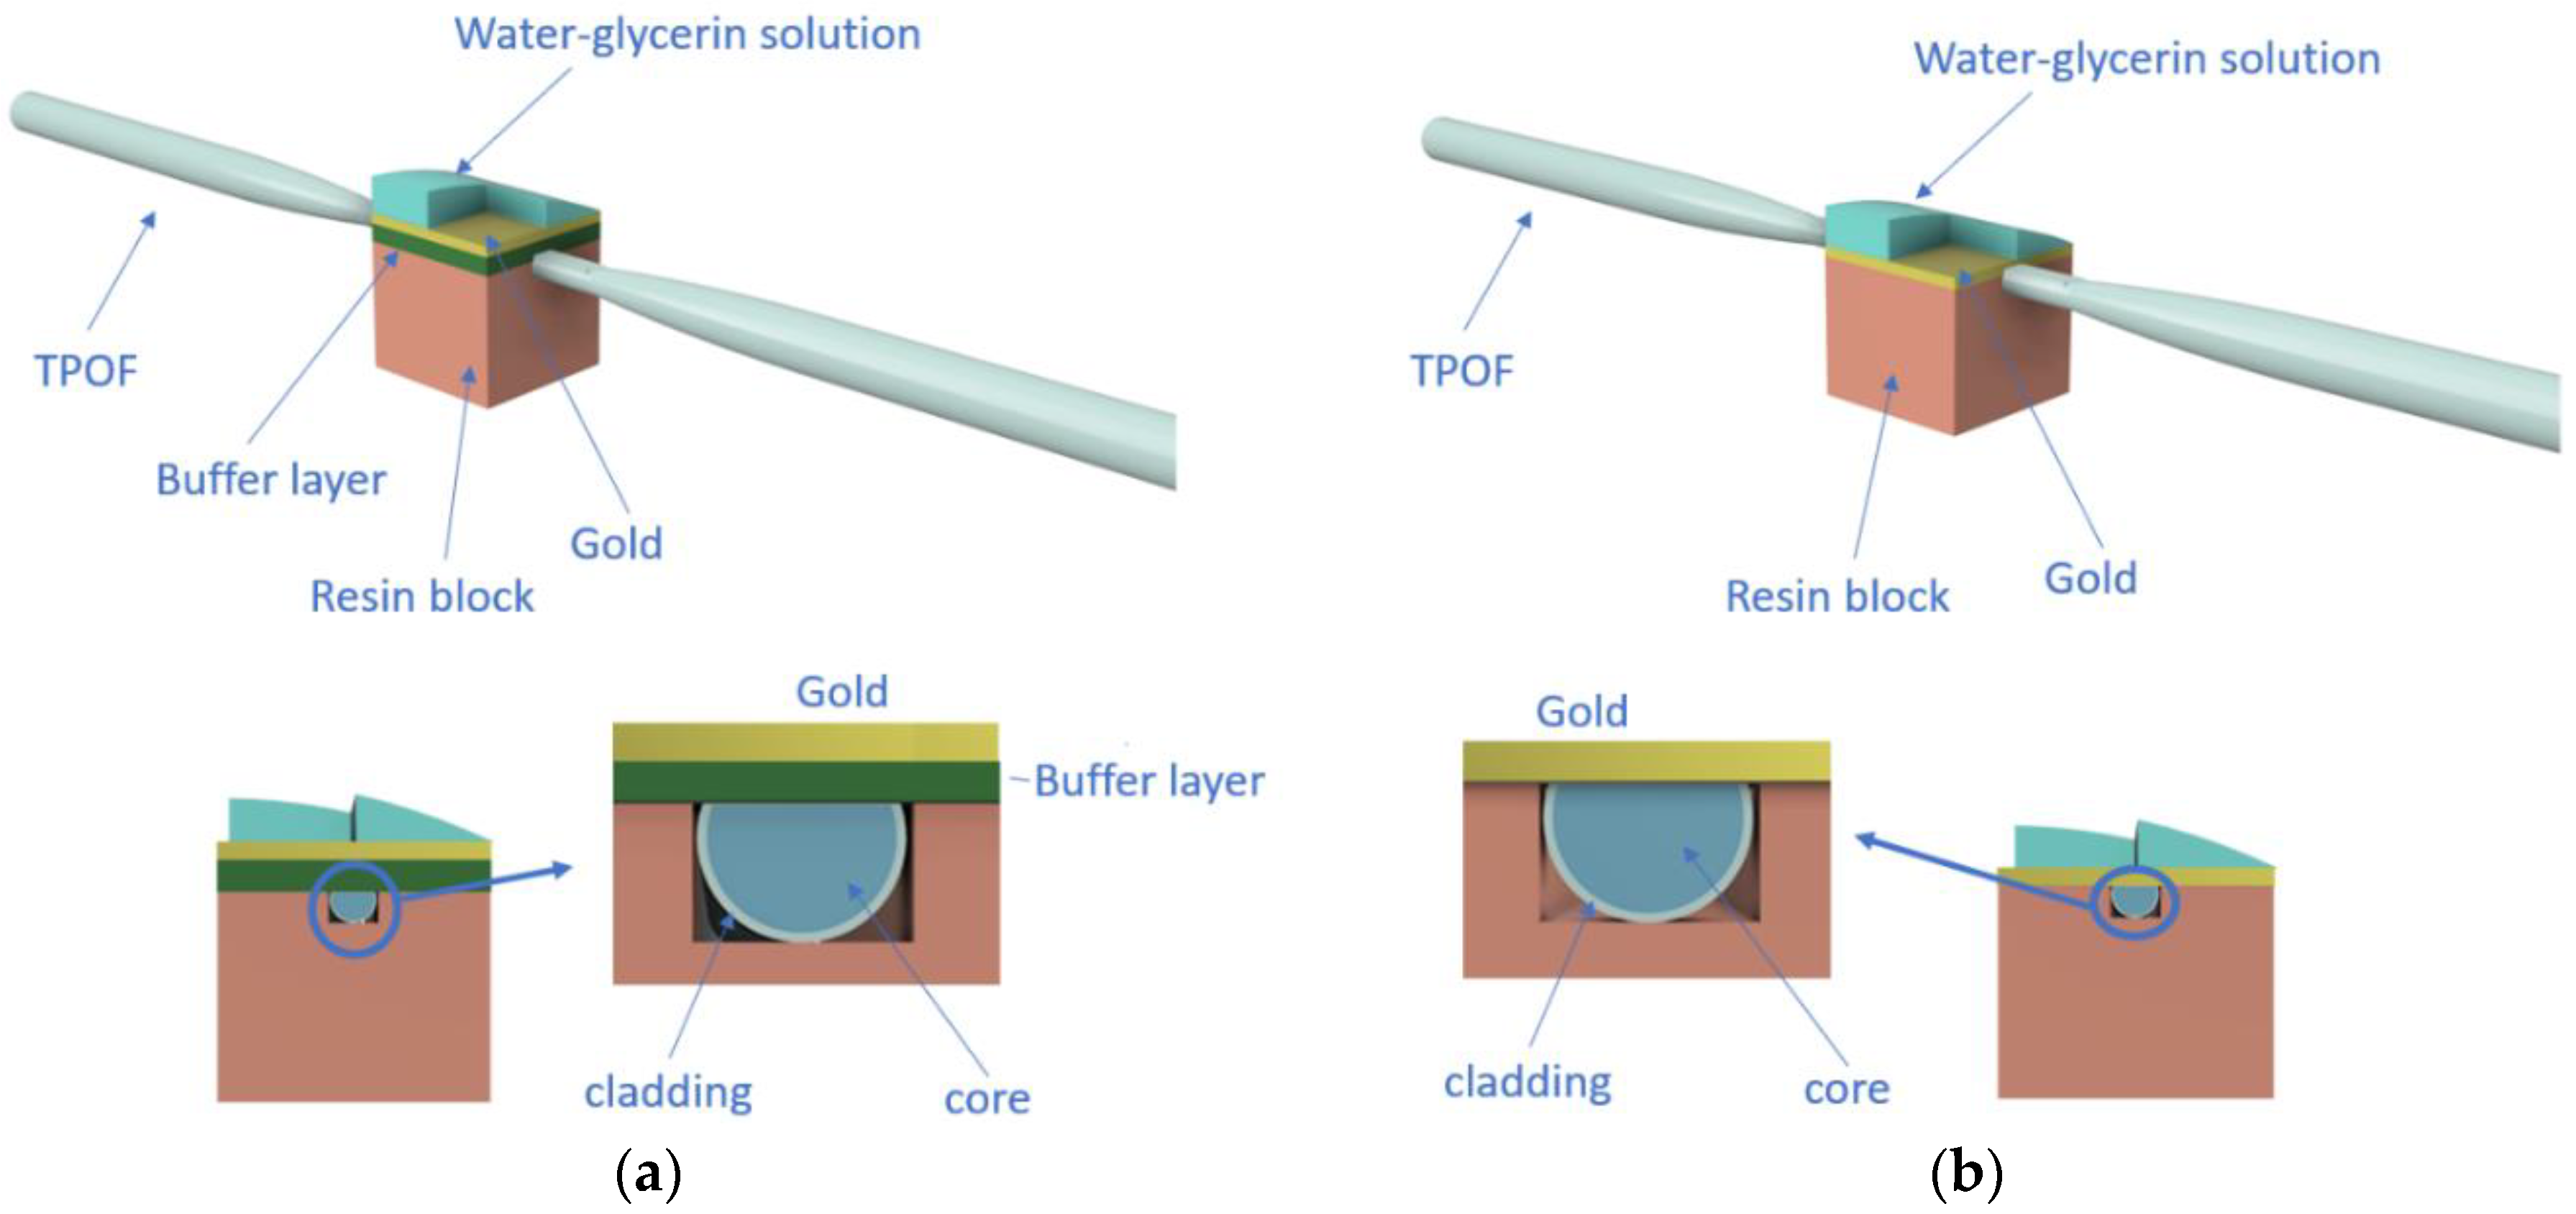
We have developed a novel automatic system to realize TPOFs. Figure 1 shows a schematic view of the realized system. In particular, it includes two motorized linear positioning stages (M150.11, Physik Instrumente (PI), Karlsruhe, Germany) connected to a computer and a heating plate (up to 100 °C). The POF is kept at a fixed height of about 1.5 cm from the heating plate (see Figure 1). The plastic optical fiber used presents a Poly(methyl methacrylate) (PMMA) core of 980 μm and a fluorinated cladding of 10 μm.
First, the fiber was kept steady on both sides upon the stages by special holders; then, the POF was heated at 100 °C along about 2 cm and was stretched by varying the movement of the two micropositioners.
The linear movement of the stages of the two micropositioners was handled by a card produced by Physik Instrumente and installed on the computer. This board is programmable through LabVIEW software (National Instruments, Austin, Texas, USA) by two “sub-virtual instruments” (sub-VIs) made available by Physik Instrumente. Starting from these two sub-VIs, we created a “virtual instrument” (VI) in LabVIEW 5.1, a custom interface where the user can select the stages’ movements in microns from two different panels and, by changing these two parameters, it is possible to obtain different taper ratios. The taper ratio was defined as the ratio between ri and r0, where 2r0 is the diameter of the tapered region and 2ri is the total diameter of the used POF (1 mm). Figure 2 shows the top view of the realized TPOF (with ri and r0).
When the length setting in the micropositioners increases, the taper ratio increases too. In this work, the taper ratio ranges from 1.3 to 1.8, depending on the chosen parameters.

3. SPR-TPOF Sensors

The SPR-TPOF sensors are based on a D-shaped sensing region of about 10 mm in length, as shown in Figure 3.
As the first step to realize these SPR sensors, we fixed the obtained TPOFs in a resin block to remove the TPOFs’ cladding and part of the core using two different polishing papers (5 and 1 μm), giving us the desired D-shaped region in a way similar to [17]. The TPOFs were realized as described in Section 2.
In a first analysis, we compared two SPR-TPOF sensors obtained with and without a buffer layer (Microposit S1813 photoresist layer of about 1.5 microns of thickness) between the core of the POF and the thin gold film in the D-shaped area [17]. To cover the core with the buffer layer (a layer with a refractive index greater than that of core) we used a spin coater [17]. Both configurations are schematically reported in Figure 3.
In all the sensor configurations, the thin gold film was sputtered on the D-shaped region using a sputtering machine (Bal-Tec SCD 500), with the sputtering process repeated three times (current of 60 mA for a time of 35 s) and a deposition step of 20 nm per step [17]. These three steps are necessary to obtain a deposition step with a low temperature.
After the first analysis, we used the configuration of the SPR-TPOF sensor without the buffer layer (Figure 3b) to study how the performances change when the taper ratio changes. In these cases, we sputtered the gold film directly on the core of the D-shaped TPOF area.

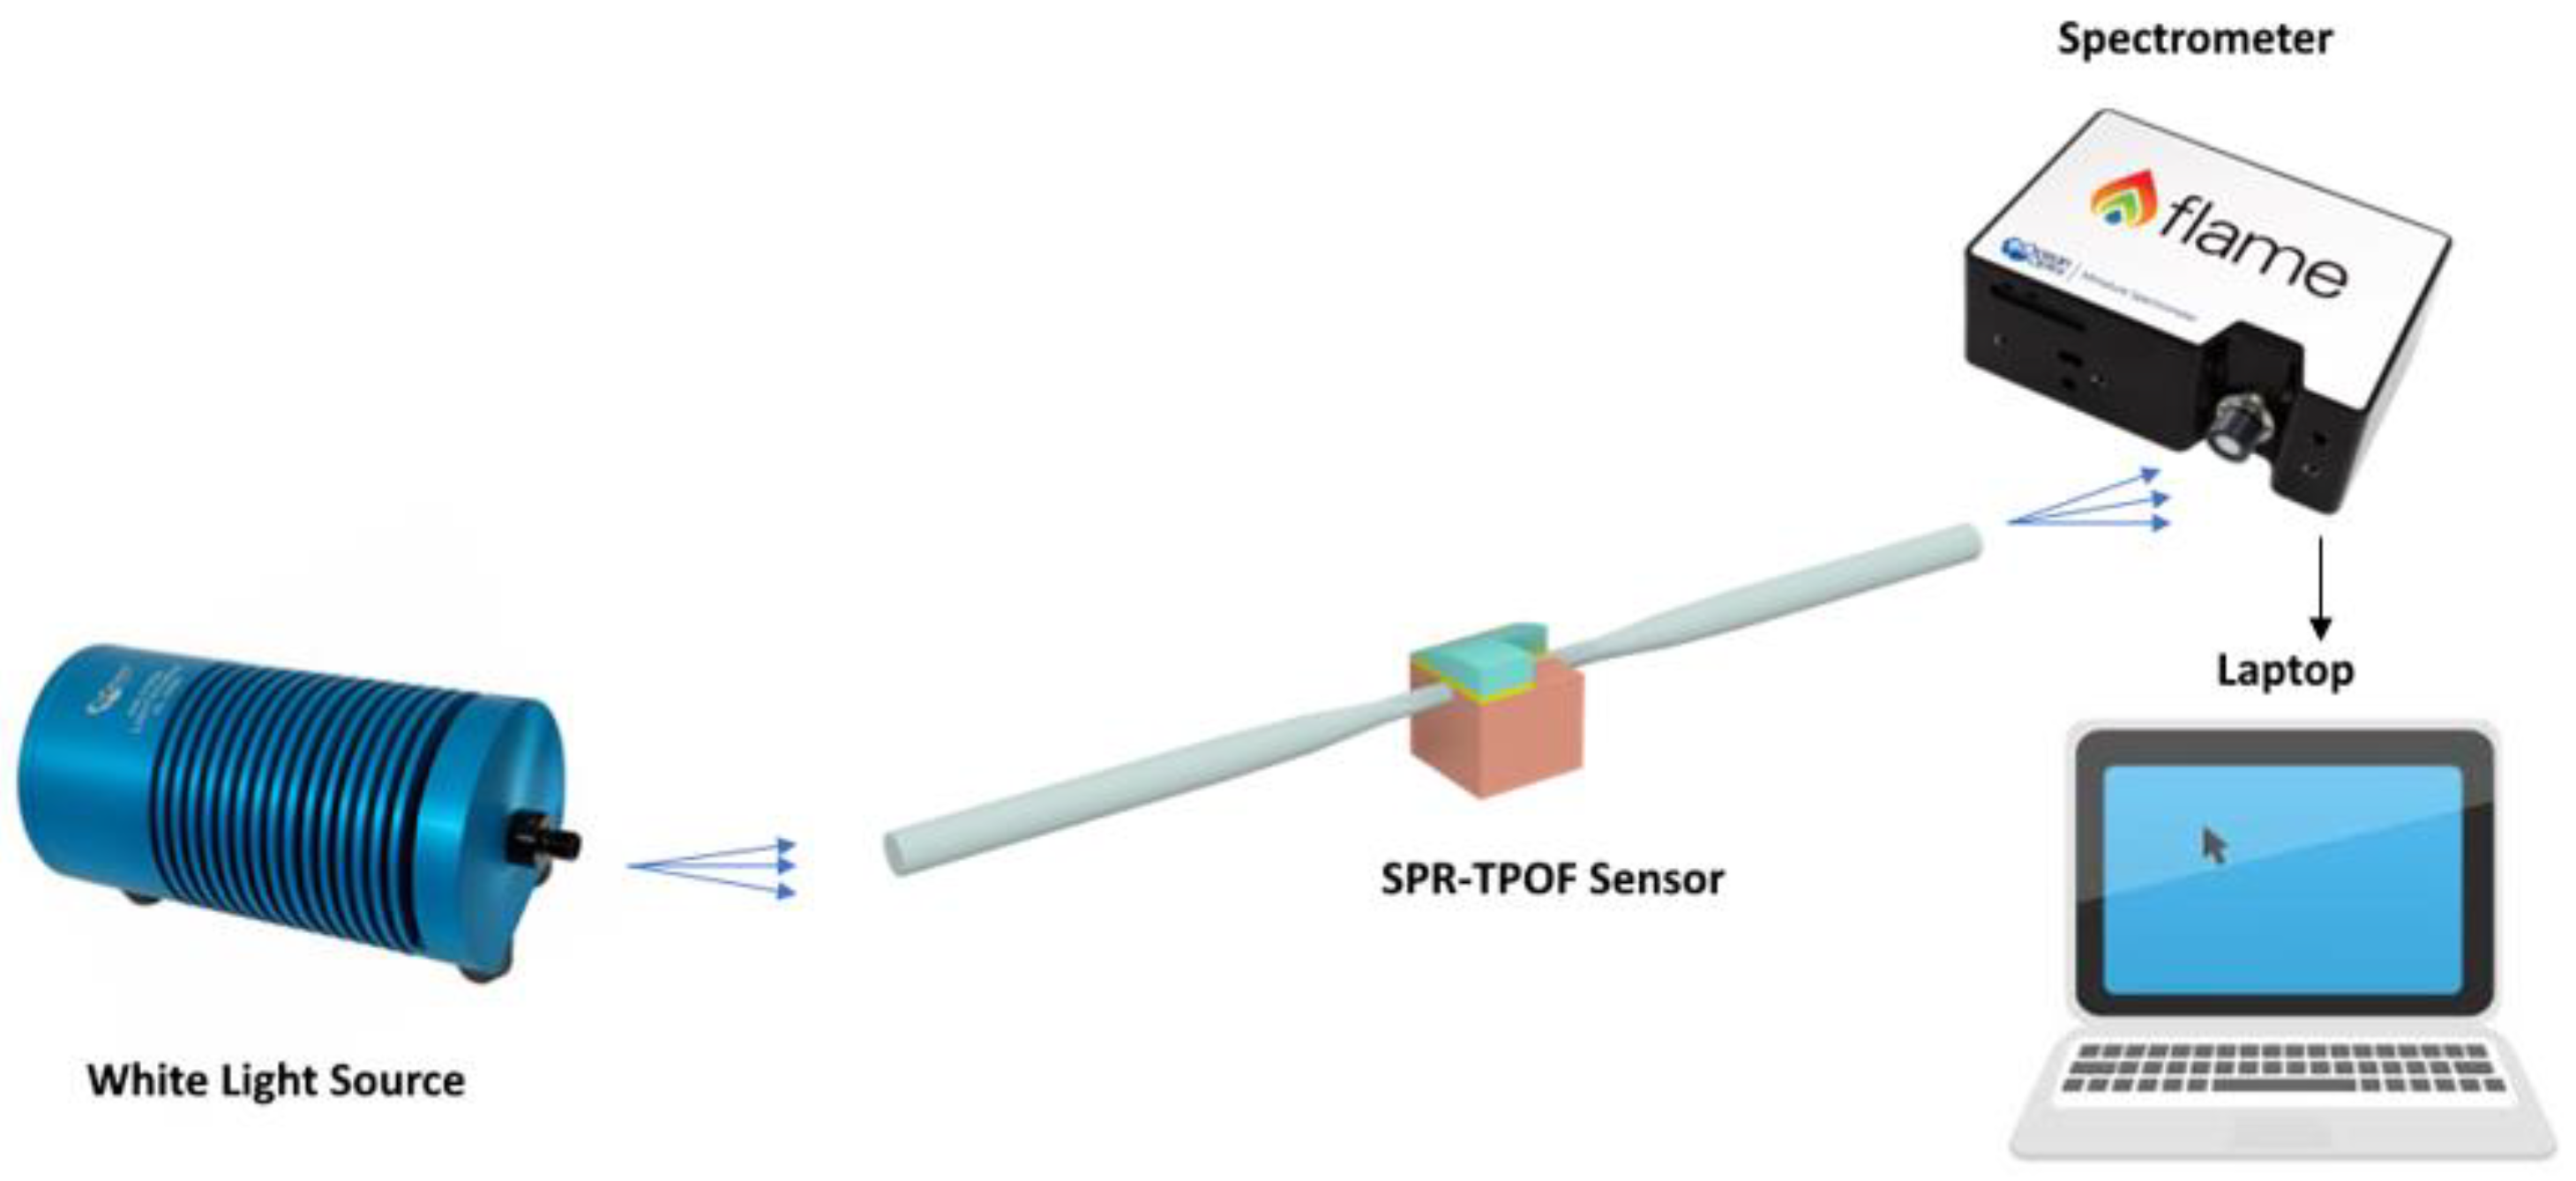
4. Experimental Setup

To test the SPR-TPOF sensors, we used the experimental setup shown in Figure 4. It is composed of a white light source illuminating the SPR-TPOF sensor and a spectrometer connected at the end of the sensor. The halogen lamp (HL-2000-LL, manufactured by Ocean Optics, Dunedin, FL, USA) exhibited a wavelength emission range from 360 to 1700 nm, while the spectrometer (FLAME-S-VIS-NIR-ES, manufactured by Ocean Optics, Dunedin, FL, USA) had a detection range of 350 to 1000 nm.
To test the SPR sensor configurations, we used different water–glycerin solutions. These solutions had been previously characterized by an Abbe refractometer (Model RMI, Exacta + Optech GmbH, Munich, Germany).

5. Experimental Results

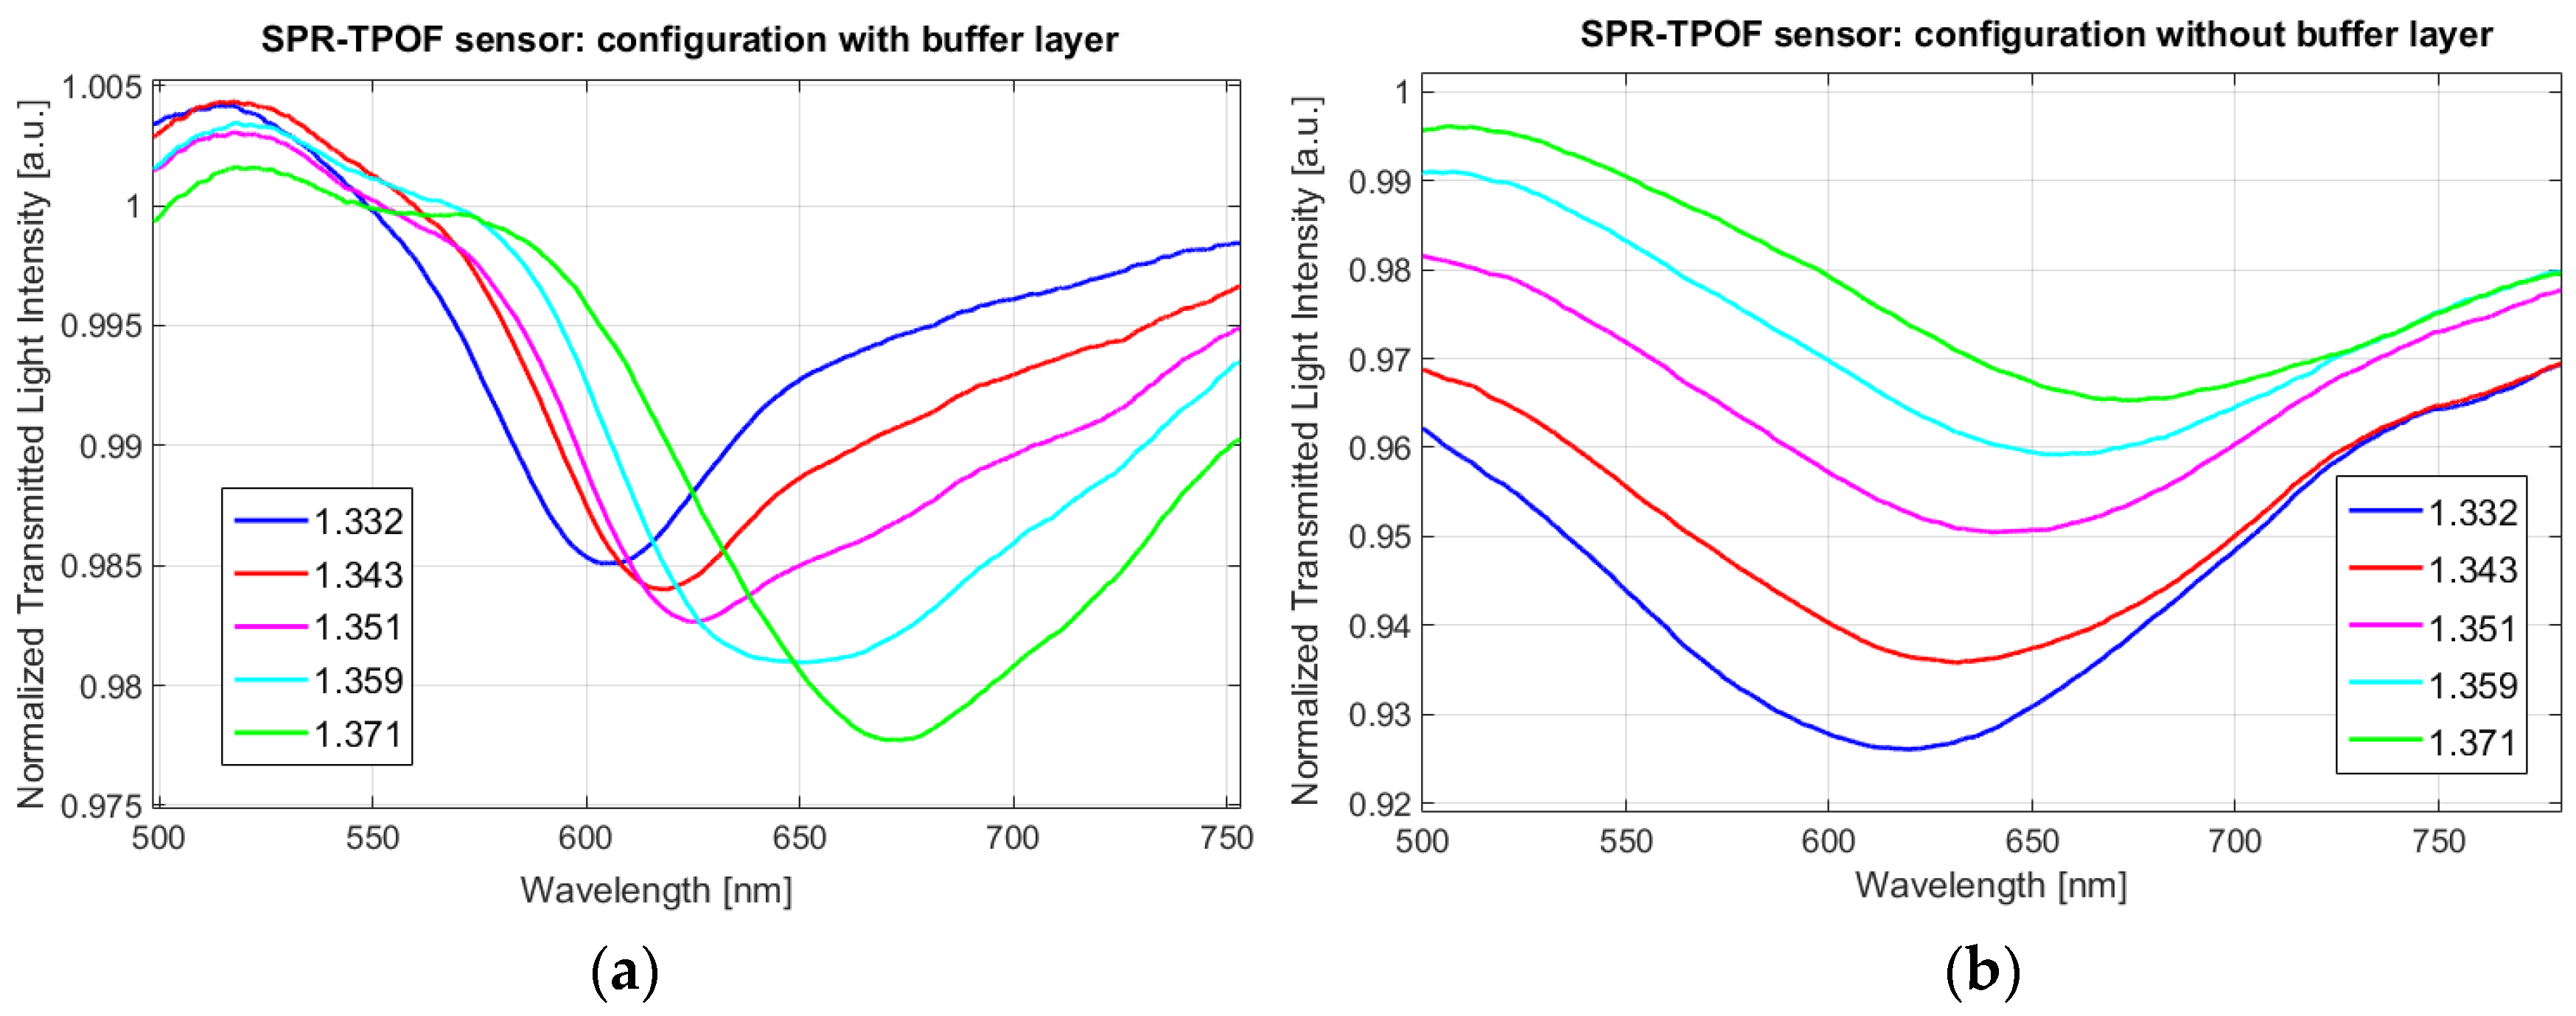
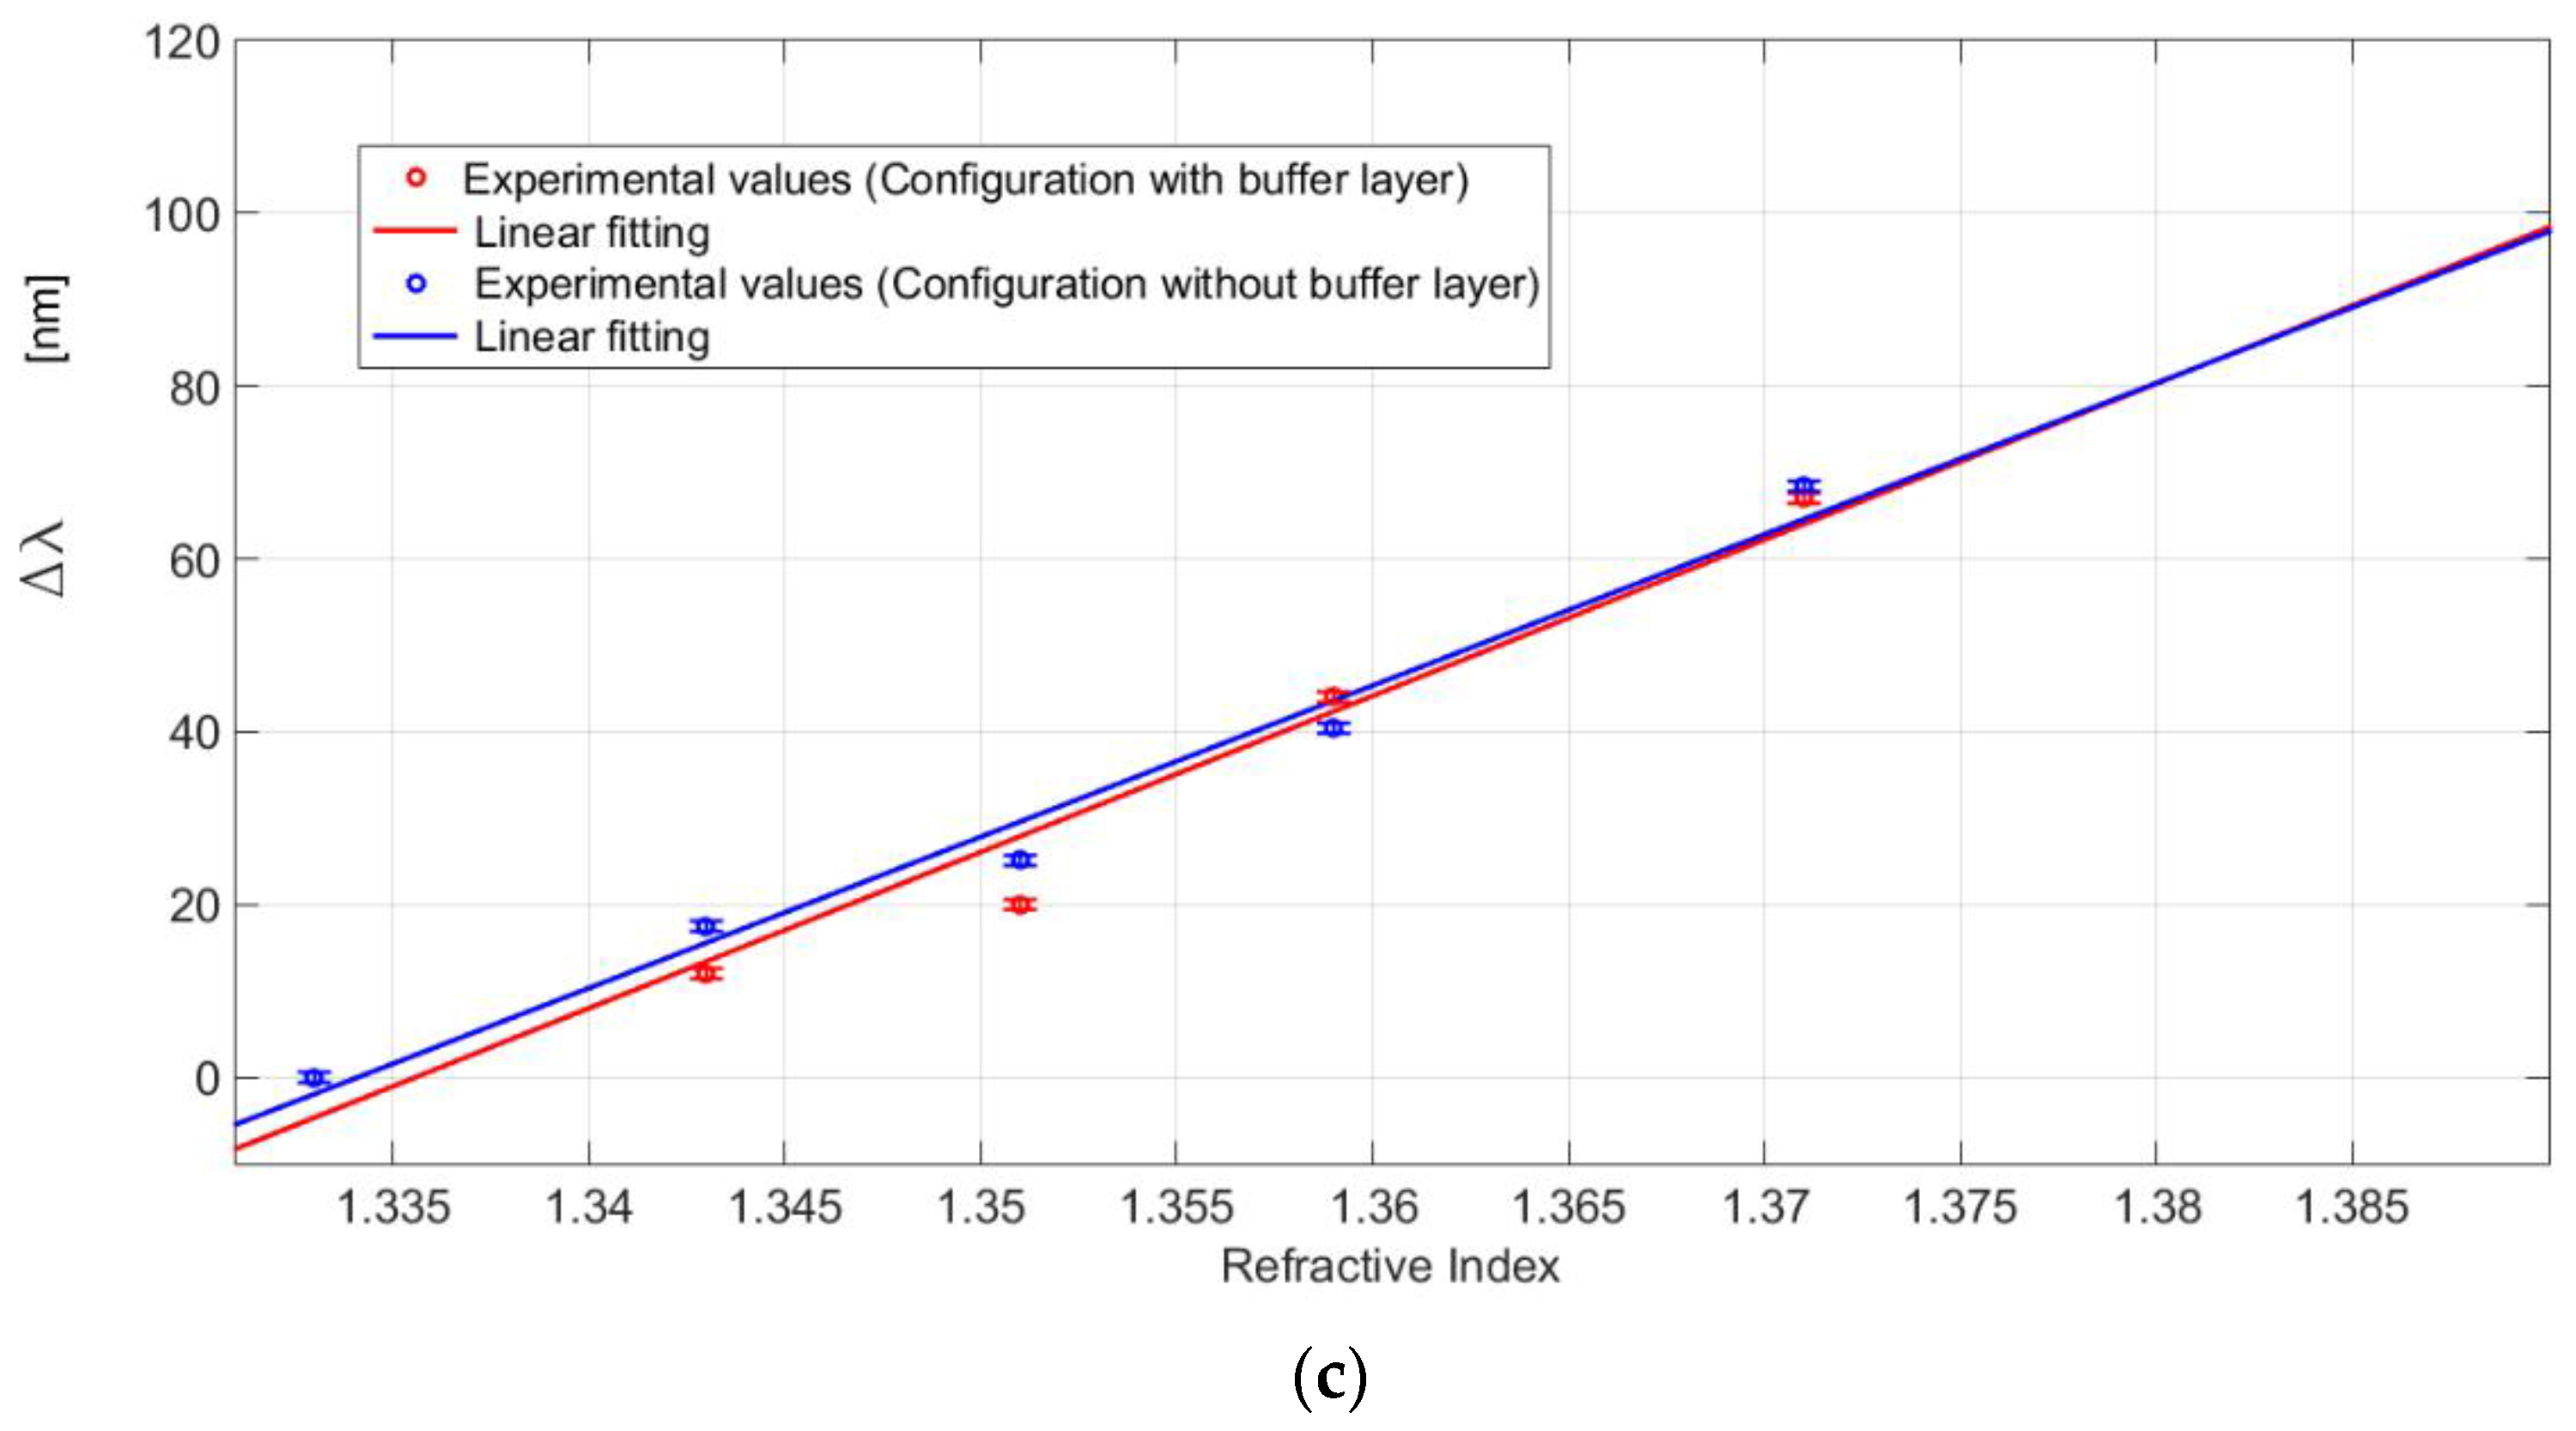
5.1. Preliminary Test Exploiting SPR-TPOFs Sensors with and without a Buffer Layer

At an early stage, we tested two SPR-TPOF sensor configurations, one with and one without the photoresist buffer layer, to determine if the use of this intermediate layer leads to a sensitivity enhancement similar to the SPR platform based on non-tapered POFs [17]. Both SPR-TPOF sensors had the same taper ratio of about 1.8 and had been tested with different water–glycerin mixtures in contact with the gold film (the refractive index ranged from 1.332 to 1.371).
Figure 5a,b shows the SPR spectra, normalized to the reference spectrum (obtained with air as the surrounding medium) [17] at different water–glycerin solutions for the configurations with and without buffer layer. Figure 5c presents the resonance wavelength variations (Δλ), calculated with respect to the water (1.332) as a function of the refractive index (n), along with the linear fitting to the data for both the configurations (with and without buffer layer). The linear fitting of the data can be used to approximate the sensitivity of the sensor. In Figure 5c, each experimental value is the average of five subsequent measurements, and the respective standard deviations (error bars) are shown too.
In fact, if an alteration of the refractive index (δn) produces a variation of the resonance wavelength (δλ), sensitivity at a fixed refractive index (n) can be defined as [28,29]:
S ( n ) = δ λ δ n   [ n m R I U ]
So, from Equation (1) and Figure 5c, the sensitivity can be approximated with the slope of the linear fitting, and it is approximately equal to 1800 nm/RIU for both configurations. Therefore, in terms of sensitivity, these results establish that the buffer layer is not necessary for the SPR-TPOF sensors because it does not improve the performances even if the shape of the resonance gets worse. The shapes of these SPR curves are relative to the high value of the taper ratio (about 1.8). As will be shown in the next section (Section 5.2), the full width at half maximum of the SPR curves increases when the taper ratio increases.
Through these preliminary experimental results, we verified that the simple sensor configuration without the buffer layer can be used to study how several taper ratios produce different performances.

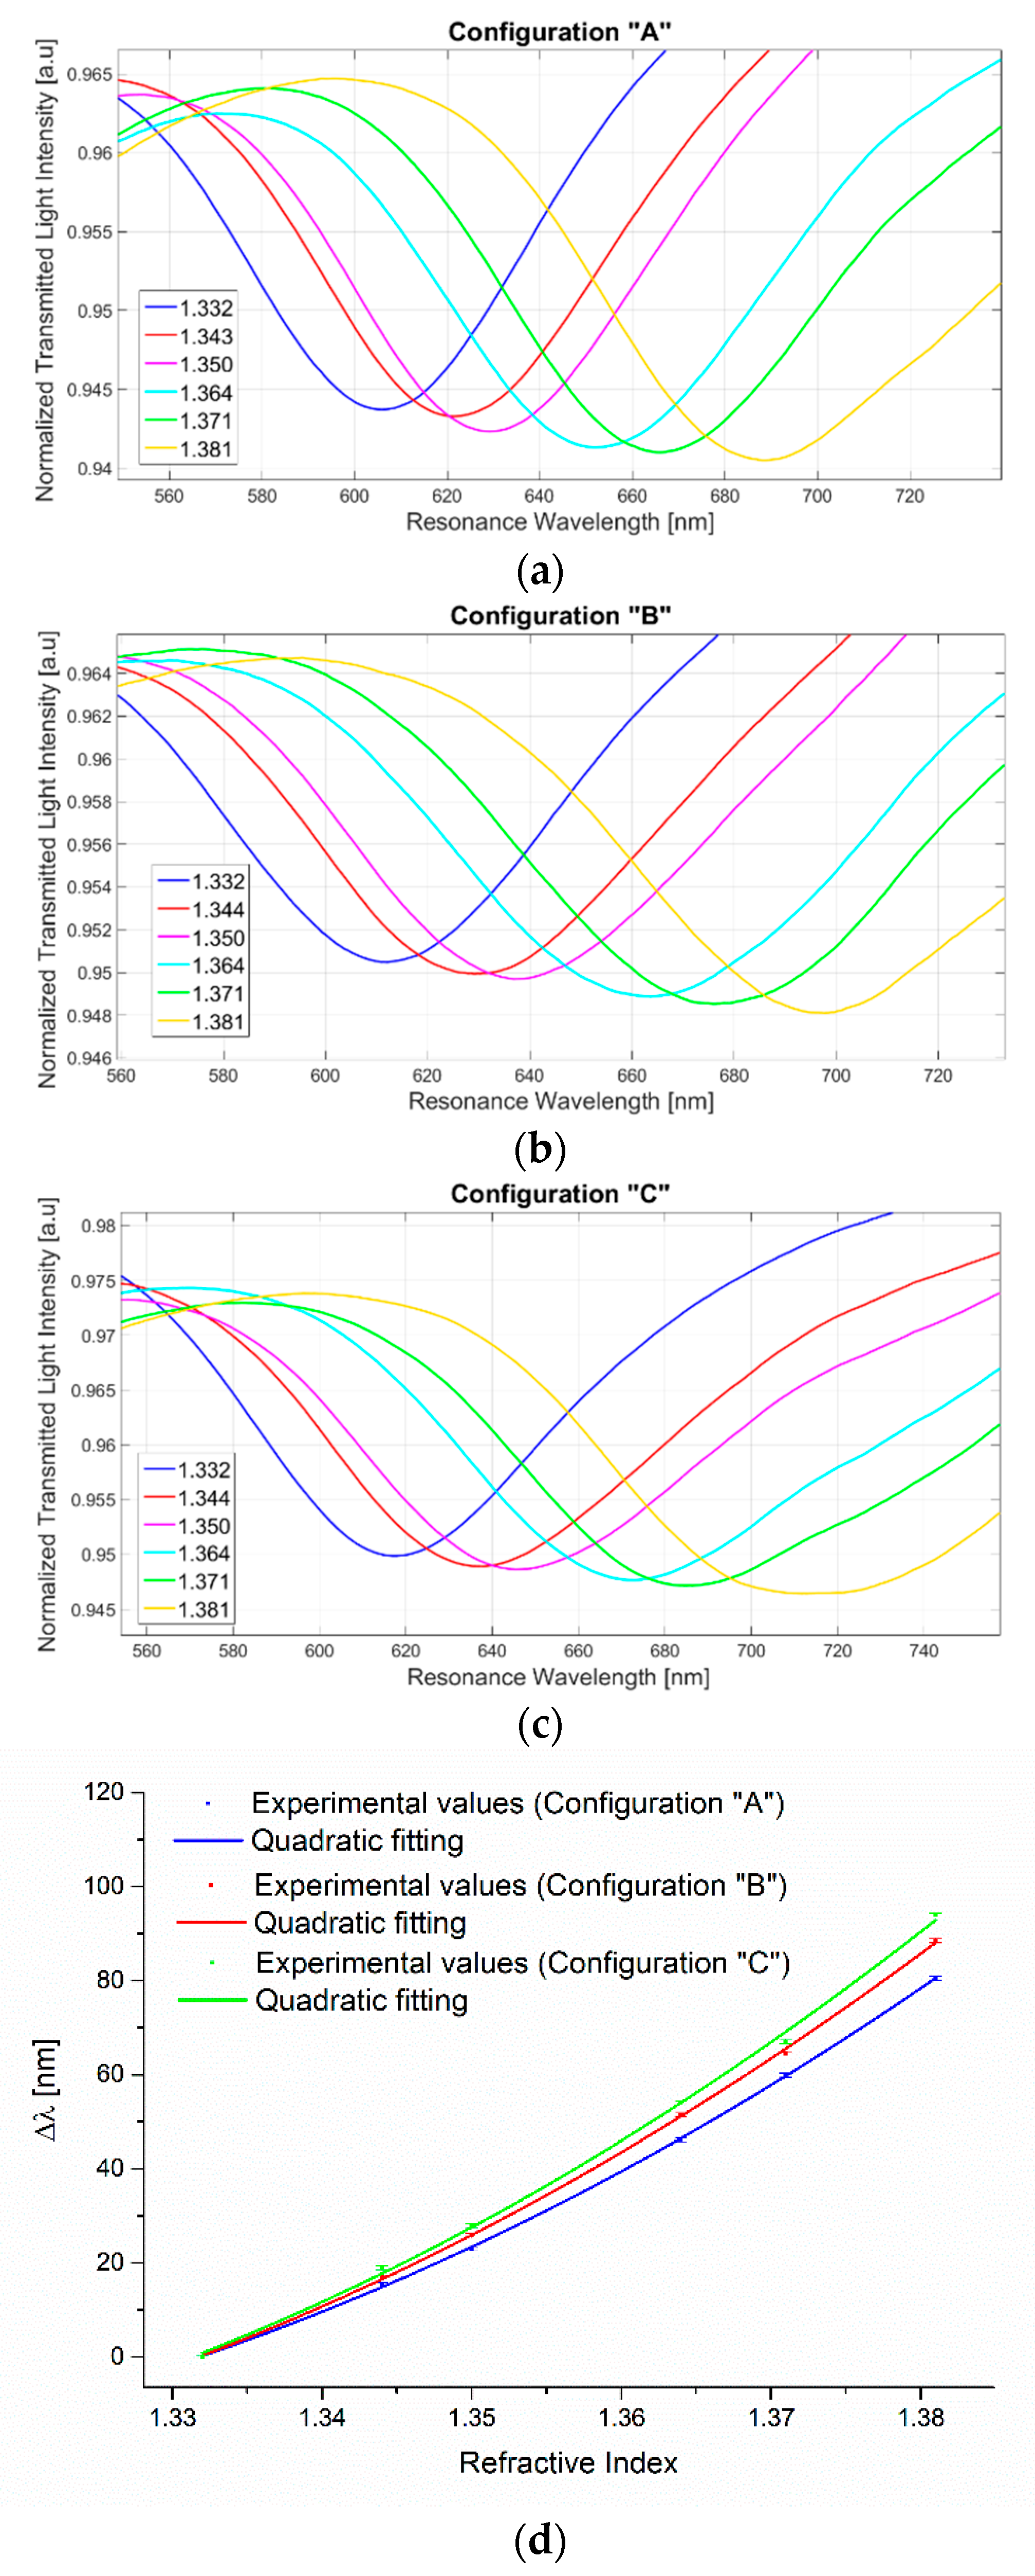
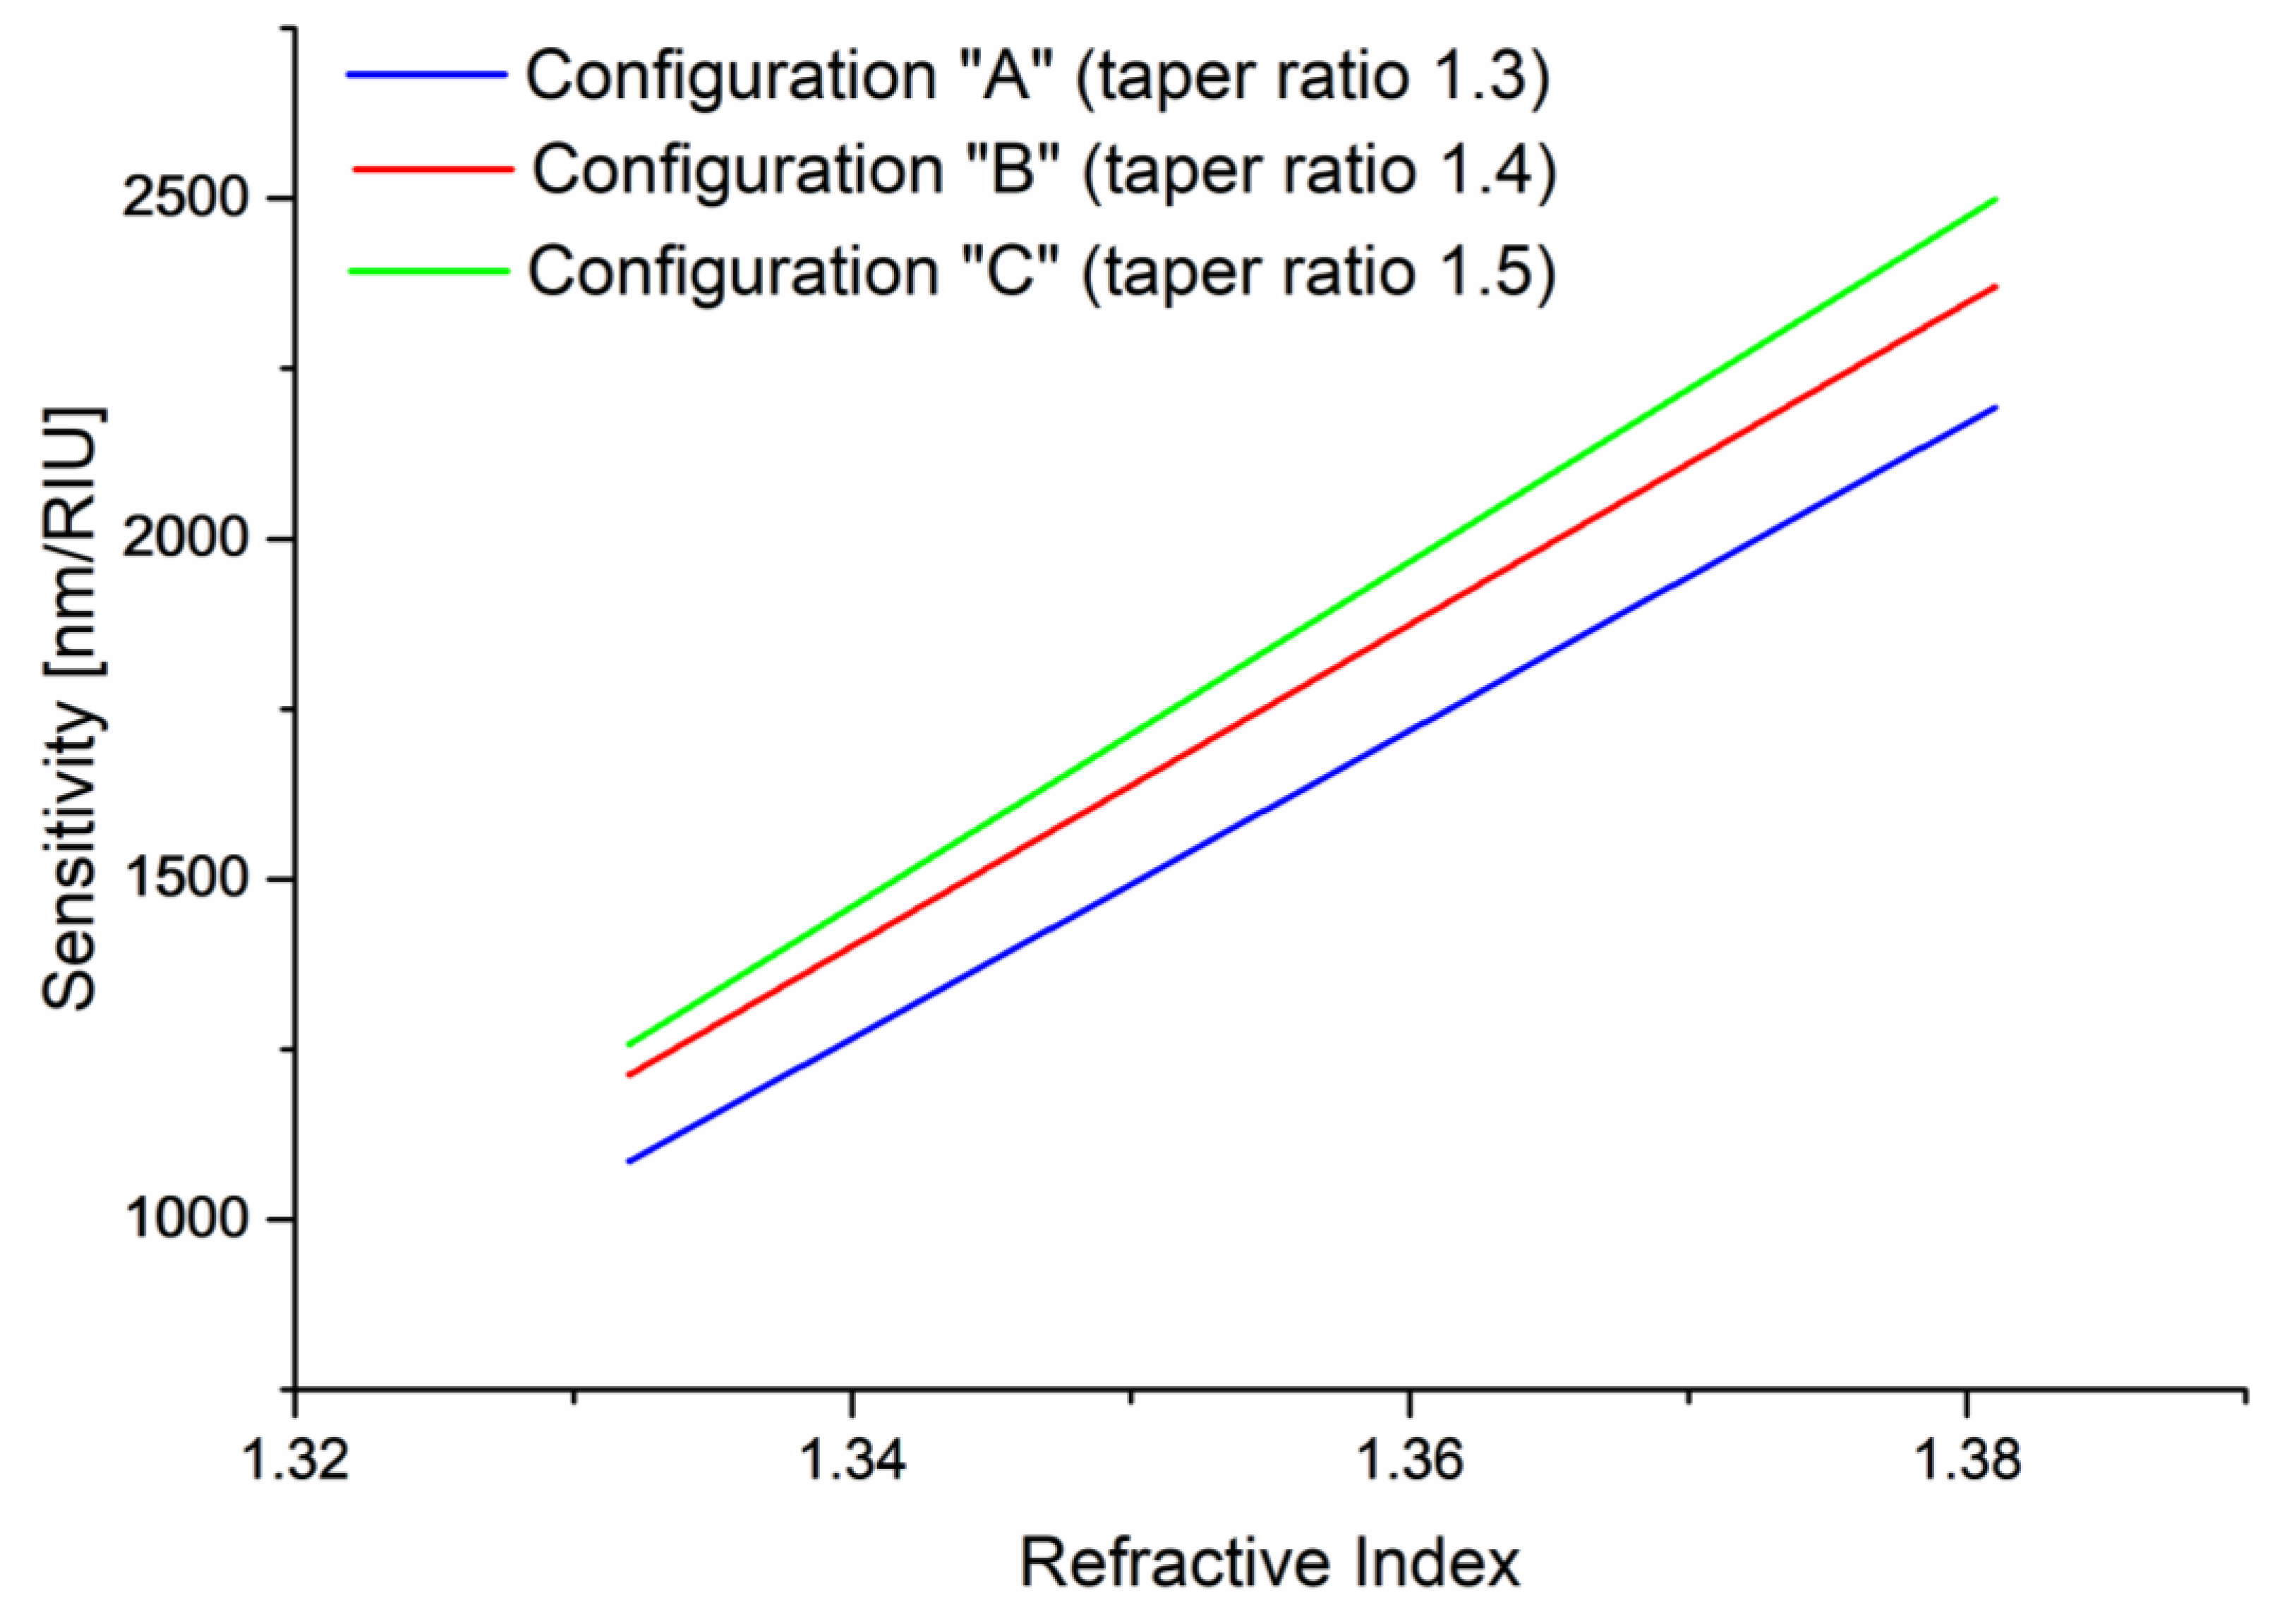
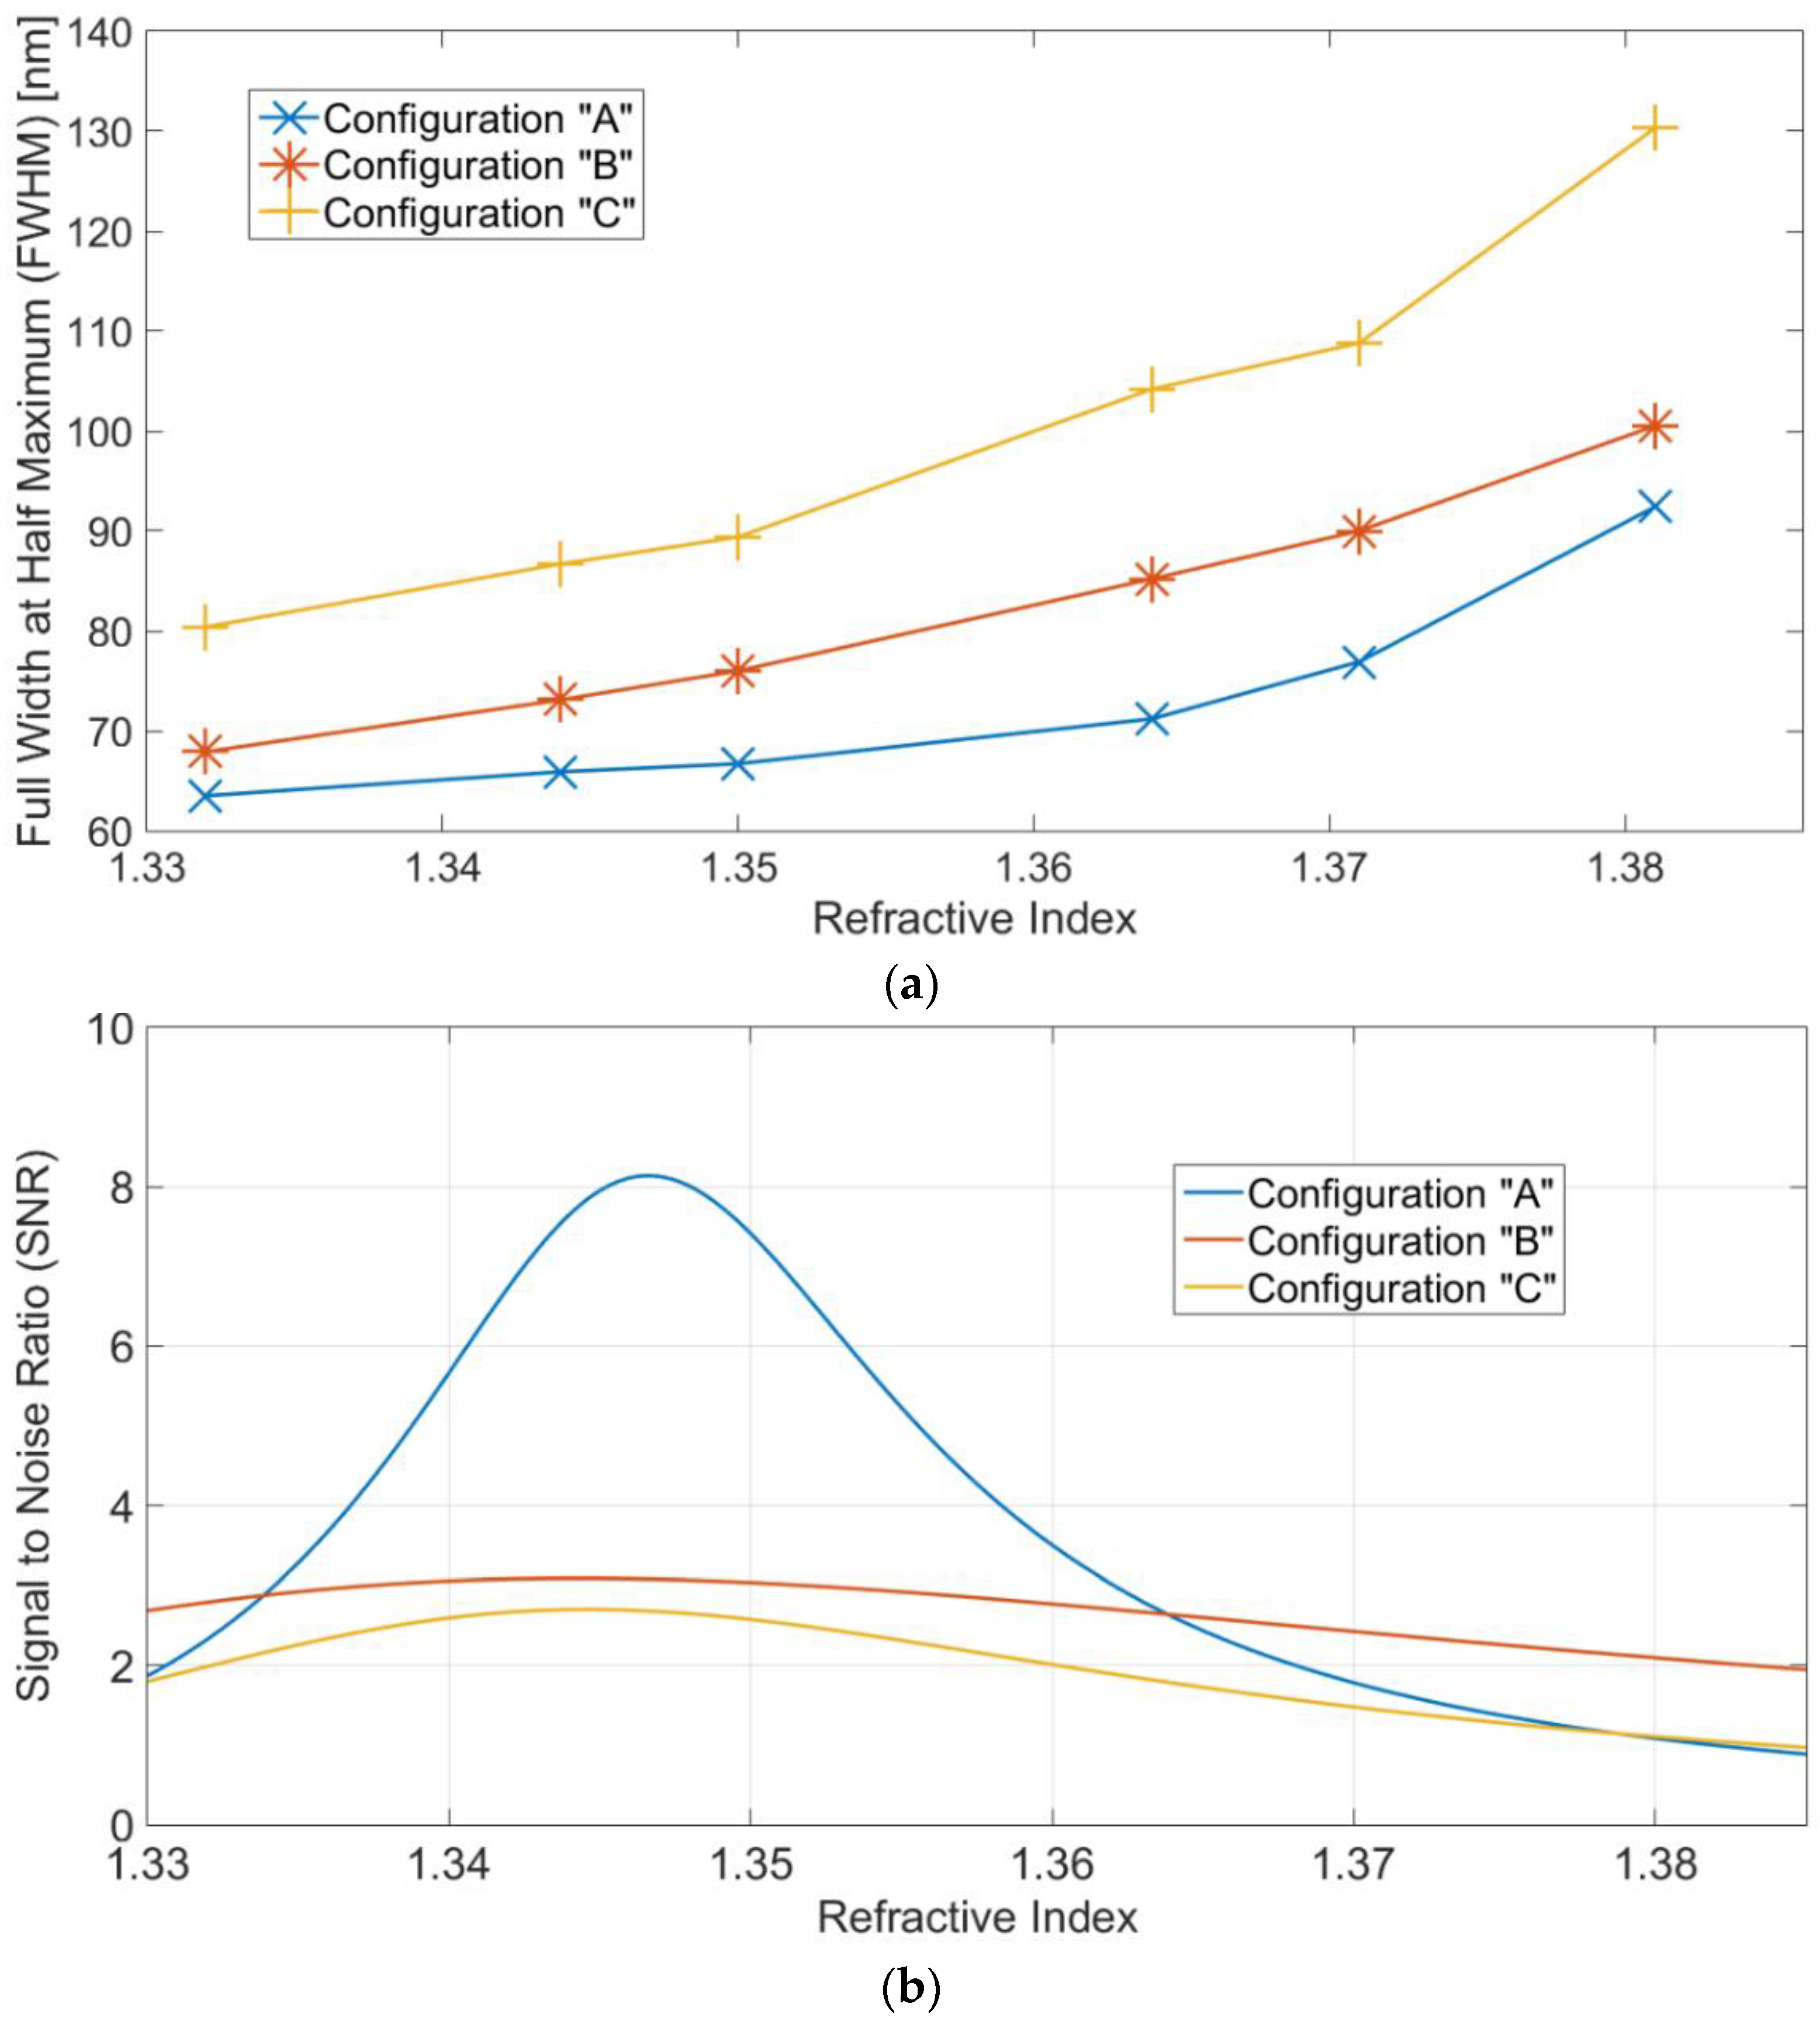
5.2. SPR-TPOF Sensors without Buffer Layer and with Different Taper Ratios

In Figure 6, three pictures of different configurations of SPR-TPOF sensors are presented. After having obtained different TPOFs in terms of taper ratio using the developed system described in Section 2 to make the SPR sensors, we used the same procedure already described in Section 3 (configurations without the buffer layer) to obtain these three SPR-TPOF sensors by fixing different TPOFs in resin blocks, polishing them, and sputtering the same gold film on their D-shaped area (1 cm long). The images in Figure 6 were acquired by Dino-Lite digital microscope (AnMo Electronics Corporation, Taiwan). Configurations “A”, “B”, and “C” present taper ratios of about 1.3, 1.4, and 1.5, respectively.
The performances of this kind of sensor are usually determined by parameters like sensitivity and signal-to-noise ratio (SNR) [17], so different water–glycerin mixtures with refractive indices ranging from 1.332 to 1.381 were used to test the produced SPR-TPOF sensor configurations.
Figure 7 shows the SPR spectra, normalized to the reference spectrum, for (1) configuration “A”, (2) configuration “B”, and (3) configuration “C” when several water–glycerin mixtures are used in contact with the gold film.
In these SPR-TPOF sensor configurations, when the refractive index increases, the resonance wavelength increases as well, and the shape of the SPR curve changes too. However, the shape and the resonance wavelength change in a different way when the taper ratio changes, as shown in Figure 7. In particular, when the taper ratio increases as the refractive index increases, both the resonance variation and the full width at half maximum of the SPR curve increase as well.
The variation in resonance wavelength with respect to the water (1.332) as a function of the refractive index, along with the quadratic fitting to the experimental data, is reported in Figure 7d for all three configurations. In Figure 7d, each experimental value is the average of five subsequent measurements, and the respective standard deviations (error bars) are shown too. In Figure 7d, instead of the linear fitting, the quadratic fitting of data has been shown in order to improve the accuracy. In particular, for the three tested configurations, the fitting curve and the parameters are reported in Equation (2) and in Table 1, respectively.
λ = B 2   n 2 + B 1   n + i n t e r c e p t
So, from Equation (1) and the fitting Equation (2), also reported in Figure 7d, it is possible to calculate the sensitivity for each configuration, as reported in Figure 8. Configuration “C”, which corresponds to the higher taper ratio (about 1.5), presents the higher sensitivity. This result was expected because as the taper ratio increases, the sensitivity increases as well, such as reported in the theoretical approach [22].
Finally, a comparative analysis has been carried out considering the signal-to-noise (SNR) parameter, which can be defined as [28,29]
SNR   ( n )   = [ δ λ δ λ S W ] n
where δ λ S W is the spectral width of the SPR curve corresponding to the same reference level of the transmitted power and can be calculated as the full width at half maximum (FWHM) of the SPR curve.
Figure 9 reports both (1) FWHM and (2) SNR defined in Equation (3) as functions of the refractive index for all three configurations. As can be seen, configuration “C”, which has shown to have the better sensitivity, presents the highest values of FHWM and the worst SNR. This duality between sensitivity and SNR is a well-known result, and it depends on the influence of the higher-order modes over both parameters [28].
To resume discussing the obtained experimental results, Table 2 shows an overview of the calculated performance parameters at a fixed refractive index of 1.35 for all three tested SPR-TPOF sensor configurations. Moreover, in Table 2, we have also reported the parameters obtained by different configurations of SPR D-shaped POF sensors based on non-tapered POFs [17,25]. In this table, the different performances of the configurations based on the same buffer layer deposited on a D-shaped POF when the POF’s diameter is 1000 µm as reported in [17,25] are due to the different depths of the “D” area [27].

6. Conclusions

Several configurations of SPR sensors in TPOFs have been implemented and experimentally tested and compared. First, we compared two configurations (with and without a buffer layer) to determine the influence of this intermediate layer on the sensor’s performances. Once the simpler configuration was chosen, we implemented and tested three different SPR sensors based on different TPOFs, made by a lab-built system, with taper ratios ranging from 1.3 to 1.5.
We determined that with the increase of the taper ratio, the sensitivity increased as well. However, this improvement in sensitivity led to a deterioration in terms of signal-to-noise ratio. In particular, all three SPR-TPOF sensors presented FWHM values very similar to that obtained exploiting a non-tapered, small-diameter POF (250 µm), but with triple the sensitivity [25]. Moreover, all the SPR-TPOF sensors showed better performances (sensitivity and SNR) with respect to the worst case obtained by an SPR-POF sensor with a nonoptimized D-shaped area [25,27]. Consequently, the obtained results demonstrate that this approach can be used for biosensing applications when a bioreceptor or a biomimetic receptor is used on the gold film, as already demonstrated in [17,25].

Author Contributions

Conceptualization, N.C. and A.M.; data curation, N.C., F.A., A.M., D.M., and L.Z.; formal analysis, N.C., F.A., A.M., D.M., and L.Z.; funding acquisition, N.C., A.M., and L.Z.; investigation, N.C., F.A., A.M., and D.M.; methodology, N.C.; supervision, N.C., A.M., and L.Z.; validation, N.C. and L.Z.; writing—original draft, N.C., F.A., A.M., D.M., and L.Z.; writing—review and editing, N.C., A.M., and L.Z. All authors have read and agreed to the published version of the manuscript.

Funding

This research received no external funding.

Acknowledgments

This work was supported by the VALERE program of the University of Campania Luigi Vanvitelli (Italy).

Conflicts of Interest

The authors declare no conflict of interest.

References

  1. Homola, J. Present and future of surface plasmon resonance biosensors. Anal. Bioanal. Chem. 2003, 377, 528–539. [Google Scholar] [CrossRef] [PubMed]
  2. Singh, P. SPR Biosensors: Historical Perspectives and Current Challenges. Sens. Actuators B Chem. 2016, 229, 110–130. [Google Scholar] [CrossRef]
  3. Abbas, A.; Linman, M.J.; Cheng, Q. New trends in instrumental design for surface plasmon resonance-based biosensors. Biosens. Bioelectron. 2011, 26, 1815–1824. [Google Scholar] [CrossRef] [PubMed] [Green Version]
  4. Homola, J.; Yee, S.S.; Gauglitz, G. Surface plasmon resonance sensors: Review. Sens. Actuators B Chem. 1999, 54, 3–15. [Google Scholar] [CrossRef]
  5. Jorgenson, R.C.; Yee, S.S. A fiber-optic chemical sensor based on surface plasmon resonance. Sens. Actuators B Chem. 1993, 12, 213–220. [Google Scholar] [CrossRef]
  6. Caucheteur, C.; Guo, T.; Albert, J. Review of plasmonic fiber optic biochemical sensors: Improving the limit of detection. Anal. Bioanal. Chem. 2015, 407, 3883–3897. [Google Scholar] [CrossRef]
  7. Anuj, K.; Sharma, R.J.; Gupta, B.D. Fiber-optic sensors based on surface Plasmon resonance: A comprehensive review. IEEE Sens. J. 2007, 7, 1118–1129. [Google Scholar]
  8. Allsop, T.; Neal, R. A Review: Evolution and Diversity of Optical Fibre Plasmonic Sensors. Sensors 2019, 19, 4874. [Google Scholar] [CrossRef] [Green Version]
  9. Trouillet, A.; Ronot-Trioli, C.; Veillas, C.; Gagnaire, H. Chemical sensing by surface plasmon resonance in a multimode optical fibre. Pure Appl. Opt. 1996, 5, 227–237. [Google Scholar] [CrossRef]
  10. Zhaoa, Y.; Tongb, R.; Xiab, F.; Peng, Y. Current status of optical fiber biosensor based on surface plasmon resonance. Biosens. Bioelectron. 2019, 142, 111505. [Google Scholar] [CrossRef]
  11. Wang, X.D.; Wolfbeis, O.S. Fiber-Optic Chemical Sensors and Biosensors (2013–2015). Anal. Chem. 2016, 88, 203–227. [Google Scholar] [CrossRef] [PubMed]
  12. Wanga, Q.; Jianga, X.; Niua, L.Y.; Fana, X.-C. Enhanced sensitivity of bimetallic optical fiber SPR sensor based on MoS2 nanosheets. Opt. Laser Eng. 2020, 128, 105997. [Google Scholar] [CrossRef]
  13. Liu, L.; Liu, Z.; Zhang, Y.; Liu, S. V-shaped micro-structure optical fiber surface plasmon resonance sensor for the simultaneous measurement of the refractive index and temperature. Opt. Lett. 2019, 44, 5093–5096. [Google Scholar] [CrossRef] [PubMed]
  14. Li, B.; Cheng, T.; Chen, J.; Yan, X. Graphene-Enhanced Surface Plasmon Resonance Liquid Refractive Index Sensor Based on Photonic Crystal Fiber. Sensors 2019, 19, 3666. [Google Scholar] [CrossRef] [Green Version]
  15. Cennamo, N.; Zeni, L.; Arcadio, F.; Catalano, E.; Minardo, A. A Novel Approach to Realizing Low-Cost Plasmonic Optical Fiber Sensors: Light-Diffusing Fibers Covered by Thin Metal Films. Fibers 2019, 7, 34. [Google Scholar] [CrossRef] [Green Version]
  16. Wei, Y.; Hu, J.; Wu, P.; Su, Y.; Liu, C.; Wang, S.; Nie, X.; Liu, L. Optical Fiber Cladding SPR Sensor Based on Core-Shift Welding Technology. Sensors 2019, 19, 1202. [Google Scholar] [CrossRef] [Green Version]
  17. Cennamo, N.; Massarotti, D.; Conte, L.; Zeni, L. Low Cost Sensors Based on SPR in a Plastic Optical Fiber for Biosensor Implementation. Sensors 2011, 11, 11752–11760. [Google Scholar] [CrossRef]
  18. Cennamo, N.; D’Agostino, G.; Porto, G.; Biasiolo, A.; Perri, C.; Arcadio, F.; Zeni, L. A Molecularly Imprinted Polymer on a Plasmonic Plastic Optical Fiber to Detect Perfluorinated Compounds in Water. Sensors 2018, 18, 1836. [Google Scholar] [CrossRef] [Green Version]
  19. Cennamo, N.; Pasquardini, L.; Arcadio, F.; Vanzetti, L.E.; Bossi, A.M. D-shaped plastic optical fibre aptasensor for fast thrombin detection in nanomolar range. Sci. Rep. 2019, 9, 18740. [Google Scholar] [CrossRef]
  20. Cennamo, N.; Zeni, L.; Ricca, E.; Isticato, R.; Marzullo, V.M.; Capo, A.; Staiano, M.; D’Auria, S.; Varriale, A. Detection of naphthalene in sea-water by a label-free plasmonic optical fiber biosensor. Talanta 2019, 194, 289–297. [Google Scholar] [CrossRef]
  21. Cennamo, N.; D’Agostino, G.; Pesavento, M.; Zeni, L. High selectivity and sensitivity sensor based on MIP and SPR in tapered plastic optical fibers for the detection of L-nicotine. Sens. Actuators B Chem. 2014, 191, 529–536. [Google Scholar] [CrossRef]
  22. Verma, R.K.; Sharma, A.K.; Gupta, B.D. Modeling of Tapered Fiber-Optic Surface Plasmon Resonance Sensor With Enhanced Sensitivity. IEEE Photonic. Technol. Lett. 2007, 19, 1786–1788. [Google Scholar] [CrossRef]
  23. Verma, R.K.; Sharma, A.K.; Gupta, B.D. Surface plasmon resonance based tapered fiber optic sensor with different taper profiles. Opt. Commun. 2008, 281, 1486–1491. [Google Scholar] [CrossRef]
  24. Kumar, S.; Sharma, G.; Singh, V. Sensitivity of tapered optical fiber surface plasmon resonance sensors. Opt. Fiber Technol. 2014, 20, 333–335. [Google Scholar] [CrossRef]
  25. Cennamo, N.; Massarotti, D.; Galatus, R.; Conte, L.; Zeni, L. Performance Comparison of Two Sensors Based on Surface Plasmon Resonance in a Plastic Optical Fiber. Sensors 2013, 13, 721–735. [Google Scholar] [CrossRef]
  26. Cennamo, N.; Coelho, L.; Santos, D.F.; Baptista, J.M.; Guerreiro, A.; Jorge, P.A.S.; Zeni, L. Modal filtering for optimized surface plasmon resonance sensing in multimode plastic optical fibers. IEEE Sens. J. 2015, 15, 6306–6312. [Google Scholar] [CrossRef]
  27. Gasior, K.; Martynkien, T.; Urbanczyk, W. Effect of constructional parameters on the performance of a surface plasmon resonance sensor based on a multimode polymer optical fiber. Appl. Opt. 2014, 53, 8167–8174. [Google Scholar] [CrossRef] [PubMed]
  28. Kanso, M.; Cuenot, S.; Louarn, G. Sensitivity of Optical Fiber Sensor Based on Surface Plasmon Resonance: Modeling and Experiments. Plasmonics 2008, 3, 49–57. [Google Scholar] [CrossRef]
  29. Dwivedi, Y.S.; Sharma, A.K.; Gupta, B.D. Influence of design parameters on the performance of a SPR based fiber optic sensor. Plasmonics 2008, 3, 79–86. [Google Scholar] [CrossRef]
Figure 1. Schematic lab-built system used to realize tapered plastic optical fibers (TPOFs).
Applsci 10 04389 g001
Figure 2. Top view of a TPOF made by lab-built system.
Applsci 10 04389 g002
Figure 3. Surface plasmon resonance (SPR)-TPOF sensors: (a) configuration with buffer layer and (b) configuration without buffer layer.
Applsci 10 04389 g003
Figure 4. Experimental setup used to test SPR-TPOF sensors.
Applsci 10 04389 g004
Figure 5. SPR spectra, normalized to reference spectrum, of (a) SPR-TPOF configuration with buffer layer and (b) without buffer layer. (c) Resonance wavelength variations (Δλ) with respect to the water (1.332) vs. the refractive index for the configurations with and without buffer layer, along with the linear fitting to the data and with the error bars. Linear fitting equation for the configuration with buffer layer: Δλ = 1801.8 n − 2414.5 (R2 = 0.95). Linear fitting equation for the configuration without buffer layer: Δλ = 1774.2 n − 2336.3 (R2 = 0.97).
Applsci 10 04389 g005aApplsci 10 04389 g005b
Figure 6. SPR-TPOF sensor images acquired from a digital microscope. (a) Configuration “A”, taper ratio 1.3; (b) configuration “B”, taper ratio 1.4; (c) configuration “C”, taper ratio 1.5.
Applsci 10 04389 g006
Figure 7. SPR spectra, normalized to reference spectrum, of (a) configuration “A”, (b) configuration “B”, and (c) configuration “C”. (d) Plasmon resonance wavelength variation (Δλ) with respect to water (1.332) as a function of the refractive index, along with quadratic fitting to the data, for each configuration.
Applsci 10 04389 g007
Figure 8. Sensitivity as a function of refractive index for all SPR-TPOF sensor configurations.
Applsci 10 04389 g008
Figure 9. (a) Full width at half maximum (FWHM) and (b) signal-to-noise ratio (SNR) as a function of refractive index for all SPR-TPOF sensor configurations.
Applsci 10 04389 g009
Table 1. Parameters of the quadratic fitting of data, Equation (2), for sensor configurations A, B, and C.
ConfigurationB2B1InterceptAdj. R-Square
A11,301.90−29,023.4018,607.200.9997
B11,819.05−30,274.0019,355.600.9995
C12,665.17−32,483,3120,797.750.9977
Table 2. Performance parameters when the refractive index is 1.35 RIU for SPR sensors in D-shaped POFs exploiting different taper ratios or different configurations.
ConfigurationTaper RatioSensitivity [nm/RIU]FWHM [nm]SNR
“A”1.31450677.4
“B”1.41600763
“C”1.51700902.6
D-shaped POF (250 µm) [25]1 (non-tapered)550~701.75
D-shaped POF (1000 µm) [25]1 (non-tapered)1325~2000.85
D-shaped POF (1000 µm) without buffer layer [17]1 (non-tapered)~2400~1800.98
D-shaped POF (1000 µm) with buffer layer [17]1 (non-tapered)~2500~1502.33

