Abstract
This paper uses a combination of approaches to evaluate the viscoelastic phenomenon in high-molecular-weight polymers (24–28 M Daltons) used for enhanced oil recovery (EOR) applications. Rheological data were cross-analyzed with single- and two-phase polymer flooding experiments in outcrop cores and micromodels, respectively. First, the impact of semi-harsh conditions (salinity, hardness, and temperature) was evaluated. Second, the impact of polymer degradation (sand face flow), focusing on the viscoelastic properties, was investigated. Finally, polymer viscoelastic properties were characterized, proposing a threefold rheological approach of rotational, oscillatory, and elongational behavior. Data from the rheological approaches were cross-analyzed with core flooding experiments and performed at a room temperature of 22 °C and at a higher temperature of 55 °C. The change in polymer viscoelastic properties were analyzed by investigating the effluents from core flooding experiments. Oil recovery experiments in micromodel helped our understanding of whether salinity or hardness has a dominating impact on in situ viscoelastic polymer response. These approaches were used to study the impact of mechanical degradation on polymer viscoelasticity. The brines showed notable loss in polymer viscoelastic properties, specifically with the hard brine and at higher temperature. However, the same polymer solution diluted in deionized water exhibited stronger viscoelastic properties. Multiple flow-behaviors, such as Newtonian, shear thinning, and thickening dominated flow, were confirmed through pressure drop analysis against interstitial velocity as already reported by other peer researchers. Turbulence-dominated excessive pressure drop in porous media was calculated by comparing core flood pressure drop data against pressure data in extensional viscometer–rheometer on a chip (eVROC®). In addition, a significant reduction in elastic-dominated flow was confirmed through the mechanical degradation that happened during core flood experiments, using various approaches. Finally, reservoir harsh conditions (high temperature, hardness, and salinity) resulted in a significant reduction in polymer viscoelastic behavior for all approaches.
1. Introduction
Polymer flooding is a well-established tertiary recovery mechanism and mature enhanced oil recovery (EOR) process. As water flooding has been adopted in most mature fields, adding polymers to the injected water costs less than other chemical EOR methods, which require, for instance, the use of surfactants. Polymer flooding has been the most widely used chemical EOR process since the 1960s [1]. As the mode of action, polymer increases viscosity in the injected aqueous phase, generating higher ultimate recovery due to better sweep efficiency and improved mobility control [2]. Increasing the viscosity of the injected aqueous phase produces a favorable mobility ratio (MR):
where the numerator refers to the polymer as displacing fluid and the denominator represents the oil as displaced phase. In Equation (1), k defines the relative permeability (to oil or polymer) of the porous media, and µ represents the bulk viscosity of the fluid (oil or polymer). Polymer flooding develops a favorable mobility ratio and improves the volumetric sweep efficiency, leading to the elimination of the fingering effects and resulting in late breakthrough.
1.1. Polymer Rheology
The rheological behavior of polymer is a key factor not only for the design of the EOR technique but also for its economics and performance. Polymer injection is often designed based on a target viscosity (e.g., oil viscosity at reservoir conditions) [3,4,5,6], and surface rheology is an excellent tool to predict and support this process. Polymer solutions are non-Newtonian, meaning the viscosity of polymer solutions is shear-rate dependent [7,8,9]. A polymer solution can exhibit two types of viscosity—shear-thinning and shear-thickening viscosity. Shear thinning is observed with a decrease in shear viscosity with an increase in the shear rate, while shear thickening is observed with a proportional increase in shear viscosity with an increase in the shear rate [10,11,12]. Two types of polymers, namely biopolymers and copolymers of acrylamide, are used in the petroleum industry. Biopolymers exhibit only shear-thinning response due to a rod-like molecular structure; however, hydrolyzed polyacrylamide can exhibit both responses depending on the molecular weight and salinity of the brine. Note that the shear-thickening response is commonly associated with viscoelasticity, which describes fluids (e.g., polymer diluted solutions) that exhibit elongational or extensional behavior under flow in porous media [7,13,14]. Most polymers with high molecular weight used for EOR have been reported to have good viscoelastic response, with debatable acceptance [7,13,15,16,17].
Rheological measurements performed in the laboratory (using a rheometer) can predict the shear-thinning response of polymer solutions. However, these measurements cannot completely describe the shear-thickening response. One of the main reasons for this is a lack of representation of the pore structure, mainly the change in flow geometries causing interstitial velocity, which causes shear-thickening behavior. The converging–diverging geometry of porous media produces the contraction and extension of the polymer molecular structure and results in the shear-thickening response. Several authors have reported different ways to define and predict the rheological shear-thickening behavior of polymer used for EOR, using either small-amplitude oscillatory shear (SAOS), first normal stress difference (N1), in situ rheology, or elongational/extensional viscosity [18,19,20,21,22,23].
Elongational or extensional viscosity is often associated with shear-thickening behavior during flow through porous media, hence helping with the further understanding of the flow dynamics of polymer solutions through porous media. These measurements include single-phase polymer flooding through core plugs/sand-packs, extensional measurements (e.g., e-VROC®), and filament stretching devices [10,24,25].
1.2. Recovery Mechanisms of Polymer Flooding
A significant amount of remaining oil saturation is left in the reservoir due to the poor sweep efficiency of brine flooding [26,27,28]. Hence, polymer flooding is performed to recover the unswept and distributed oil saturation remaining. The literature [7,29] has reported many recovery mechanisms of polymer flooding, for instance, viscous fingering reduction [30], relative permeability reduction [31], pull-out in dead-end pores [32], stripping from oil-wet surfaces [33], enhanced flow between heterogeneous layers [26,31], shear thickening [7,11], and elastic turbulence [34]. However, all of the mentioned recovery mechanisms are associated with polymer’s improved mobility ratio and possibly its viscoelastic properties.
1.2.1. Mobility Control
Polymer increases aqueous phase viscosity and hence improves the sweep efficiency of the reservoir [35,36]. The main recovery mechanism of polymer flooding is improved mobility control, as defined in Equation (1), in the porous media, to produce a uniform displacement front and hence improve oil bank recovery. However, mobility control of the polymer solution is challenged by the salinity of formation brine. This limitation is encountered in multiple approaches, as outlined in the following:
- Polymer solutions are prepared in high concentrations, to overcome the effects of formation brine salinity. There is a decrease in polymer in situ viscosity, but high concentrations of polymer solutions can sweep the reservoir to contribute to additional oil recovery. On a commercial scale, high-concentration polymer flooding was performed in the Daqing Field and produced 20% original oil in place (OOIP) [37]. Field tests concluded that high-concentration polymer injection is safe and commercially economical.
- A couple of pilot tests and many laboratory experiments have concluded that low-salinity pre-flush can be performed to decrease the salinity and hardness of formation brine [38,39,40]. Polymer flood after the pre-flush is expected to have suitable in situ polymer viscosity, hence contributing to higher oil recovery.
- Recently, the concept of the hybrid EOR method, using combined low-salinity water flooding with polymer flooding, has also shown promising results for oil recovery [41,42]. Low salinity also decreases the salinity of formation brine in a similar manner as pre-flush and polymer flooding and afterward retains good mobility control.
- Mixing polymer solutions in low-salinity water is also an effective approach to handling harsh conditions for reservoir brine [43,44,45]. This method produces high-viscosity polymer solutions, utilizing the lower concentrations of the polymer product.
The presented information is good evidence of the dependence of polymer mobility control on formation/mixing brine and will thus be advantageous for investigating the role semi-harsh conditions for polymer viscosity in situ response.
1.2.2. Polymer Viscoelasticity
Hydrolyzed polyacrylamides (HPAMs) are seemingly low-cost and commercially available polymers and hence are the most widely used in the oil industry [46]. Some HPAM polymers with high molecular weight may depict viscoelastic properties, depending on interstitial flow conditions [11]. Due to their non-Newtonian nature and viscoelastic behavior, HPAMs may depict a shear-thinning response at low shear rates and shear-thickening response at high shear rates [2,7,47]. Shear-thinning defines a decrease in shear viscosity, with an increase in shear rate and shear-thickening defined as an increase in shear viscosity with an increase in the shear rate, as discussed previously.
The relaxation time of polymer molecules also defines the shear-thickening behavior while flowing through compression–elongation geometry (elongational viscosity) [7]. HPAMs increase displacement efficiency due to their elastic properties [28,48,49]. Thus, recovery efficiency (displacement efficiency ∗ volumetric sweep efficiency) is increased by viscoelastic HPAM polymer flooding.
Viscoelasticity of HPAMs used for EOR is restricted by various factors—as summarized in Table 1—such as the following:

Table 1.
Challenging factors reported in the literature over the last five years, concerning polymer viscoelasticity.
- Mechanical shear and chemical degradation [50,51,52]: Mechanical shear is caused during polymer solution preparation through mixing devices, injection pumps, flow lines, and valves from storage tanks to injection wells. Chemical degradation is caused by a chemical reaction. For example, the polymer may be sensitive to oxygen and thus oxygen scavengers are added to the solution.
- Reservoir temperature [10,53,54]: Polymer solutions are sensitive to temperature. High temperature causes breakdown of the molecular backbone chain structure, which, in turn, decreases polymer viscoelasticity.
- Hardness of the reservoir brine [10,55]: Hardness is the number of cations in the brine. A high number of cations will result in low polymer viscosity. Polymer’s ball-like molecular structure is composed of negative charges, and the repulsive forces of negative charges result in a larger ball-like molecular structure. High concentrations of cations react with the negative charge of polymer, hence decreasing the ball-like molecular size. A reduction in molecular size results in the loss of polymer viscosity and hence reduces viscoelasticity.
These degradation conditions negatively affect polymer performance in porous media and hence place a strain on project economics [56,57].
1.3. Pilot Projects of Polymer Flooding
Polymer flooding has been performed in many pilot projects, as a response to the poor sweep efficiency of water flooding. The application of polymer flooding is expected to result in additional oil recovery due to the higher aqueous viscosity of polymer. However, formation brine salinity is a major challenge for application of the process at a field scale. The higher salinity of formation brine significantly decreases polymer’s in situ viscosity and hence presents economic challenges for such projects [68,69,70]. These economic constraints motivate companies to perform low-salinity pre-flush to optimize the process. Water pre-flush is commonly used to decrease the salinity of the formation brine, which is expected to improve polymer flooding performance [36,39,41].
- A pilot study performed in Marmul Field (Oman) and reported by Koning et al. [39] describes polymer flooding with low salinity as a pre- and post-flush. The salinity of the formation brine was reported as 3 g/L, and low-salinity pre-flush/post-flush with 0.6 g/L NaCl brine was injected. A combination of polymer injection with pre- and post-flush resulted in 59% of stock tank oil initially in place (STOIIP).
- Wang et al. [40] presented pilot test data of the well-known polymer flooding (pilot one (PO) and pilot two (PT)) application in Daqing Field (China). The formation brine salinity was 7 g/L, and a pre-flush of low-salinity brine of 0.8–1.3 g/L was performed before polymer flooding (1000 ppm concentration of polymer). Interestingly, the produced water salinity was reported in concentrations of 2 to 4 g/L. The combined oil recovery from pre-flush and polymer flooding increased by 14% (pilot one) and 11.6% (pilot two) compared to water flooding.
- Al-Qattan et al. [41] presented a single-well chemical tracer test (SWCT) performed in one Wara producer of the Greater Burgan Field (Kuwait). The reported connate water salinity was 160 g/L total dissolved solids (TDS). Low-salinity brine (diluted SWCT chemicals) flooding was performed as SWCT Test #2, and low-salinity polymer injection was performed as SWCT Test #3. The associated reduction of residual oil saturation (Sor) was 7% from low-salinity pre-flush and low-salinity polymer flooding.
- Polymer flooding in the Adorf Field (Germany) was applied after a low-salinity pre-flush [71] with formation brine with an initial salinity of 250 g/L. In this case, polymer flooding did not contribute to the expected additional oil recovery. The main reason for the poor performance was a reaction between the injected low-salinity brine and the rock minerals. This reaction significantly increased the brine hardness, hence limiting the viscosity control and performance of the polymer flooding.
This paper focuses on variables paying particular attention to temperature, salinity, and mechanical shear to influence polymer stability and performance evaluations in porous media. Figure 1 summarizes the objectives for this investigation, focusing on rheological behavior before and after core flooding experiments. In each case, rheological behavior was assessed via elongational viscosity (using a microfluidic device) and rotational rheometry (steady shear viscosity, normal stress differences, and oscillatory). In addition, micromodel flooding experiments were performed to observe the role of polymer solutions on oil recovery when mixed at variated levels of salinity and hardness.
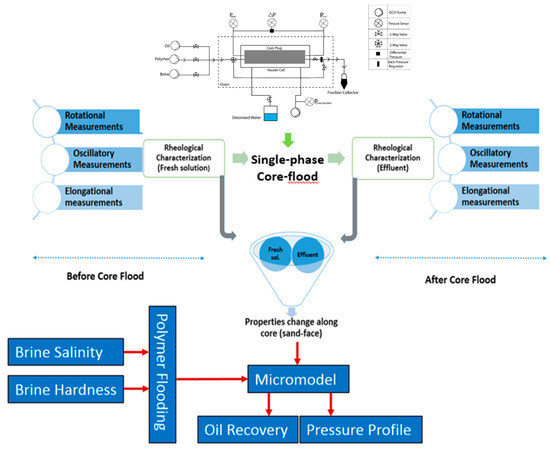
Figure 1.
Workflow adopted in this study, to investigate change in polymer viscoelastic properties through a Bentheimer core plug/micromodel.
1.4. Overall Methodology and Approach
The approach helps to understand the impact of semi-harsh conditions on polymer viscoelasticity while flowing through porous media. The following steps or methodology was adopted to gather the data and draw conclusions upon:
- Brine Preparation and Optimization: Three brines were prepared, focusing on the role of varying total dissolved solids and increasing amount of sulfate in seawater (SW).
- Polymer Diluted Solutions Preparation: Two diluted polymer solutions (2000 and 3000 ppm) were prepared in brines with different TDS and added amounts of sulfates, in order to investigate the impact of salinity and hardness.
- Rheological Measurements: An approach to characterize the polymer viscoelastic properties, focusing on steady shear viscosity, elongational viscosity, small-amplitude oscillatory shear (SAOS), and first normal stress difference (N1) measurements. Rheological measurements of diluted solution before and after core flooding helped to conclude the potential loss in viscoelastic properties around the injection well.
- Single-Phase Core Flooding Experiments: Diluted polymer solution injection was performed over increasing injection rates, to study the in situ flow dynamics of polymer solutions.
- Microfluidics: Polymer flooding (prepared in SW) with varying amounts of sulfates in oil-saturated micromodels helped in our understanding of which one, between salinity and hardness, has a dominating impact on in situ viscoelastic polymer response.
2. Materials and Methods
2.1. Fluids and Chemicals
2.1.1. Brine Composition
Polymer, provided as a powder form, was dissolved in three different brines: (i) typical seawater, here named B1; (ii) one synthetic brine, here named reservoir brine German Brine/B2 (German brine refers to the composition of ~186 g/L from the Bramberge Oilfield, reservoir, in Germany, as reported by Tabary et al. [72]), subsequently named B2, without further meaning, to avoid confusion (defined after References [72,73]); and (iii) seawater with quadruple sulfates (B3).
A detailed summary of the brine compositions is presented in Table 2. The parameter R+1 defines the brine hardness and is calculated by using the weight proportion of divalent cations in each brine, with the following formula (Equation (2)), as explained by Tabary et al. [72] and Tay et al. [73].
Table 2.
Composition of the brines used to dissolve the polymer solutions. Brine composition used as solvent for polymer solutions.
2.1.2. Polymer Solutions
Two synthetic high-molecular-weight viscoelastic polymers, Hengloc 63,026 26MD MW (provided by Beijing Hengju from Beijing, China) and Flopaam 6035 S 24-28MD MW (provided by SNF Floerger from Andrezieux, France), were used to prepare the diluted solutions at concentrations of 3000 ppm (in brine B1 and B2) and 2000 ppm (in brine B1 and B3), using the approach adopted by References [7,15]. Diluted polymer solutions were filtered by using a 5.0 µm membrane filter (MF-Millipore from Sigma Aldrich, Darmstadt, Germany), in order to avoid fish eyes or undissolved matters, as recommended by the API RP 63 standard [74].
2.1.3. Rheological Measurements
Rheological experiments to characterize polymer solutions were performed, using a Kinexus pro+ rheometer by Malvern Instruments Ltd. (Malvern, UK). Two different stainless-steel (316) geometries, double-gap cell and cone–plate, were used. The type of double-gap geometry used was DG24/27 R0427 SS, where the bob outer diameter is 24 mm and cup inner diameter is 27 mm. Steady shear viscosity and small-amplitude oscillatory shear (SAOS) measurements were performed, using the double-gap geometry. The cone and plate geometry used was CP1/60 SR 2756 SS, where the cone angle is 1° over a 60 mm diameter plate. First Normal Stress Difference (N1) was measured by using the cone–plate geometry. Fresh polymer solutions were utilized for each measurement, starting from lower to higher shear rates. Rheometer calibration and inertia error correction were performed prior to each measurement, and viscosity measurements were performed for fresh solutions (at specific temperature), in order to avoid the possible minor changes in polymer molecular structure. For further details on the detailed rheological measurement evaluation, refer to the authors’ previous publications, specifically Reference [15], with further details in References [8,10,12,75].
2.1.4. Dead Oil
A dead crude oil sample (degassed and centrifuged) was used for two phase flooding experiments in micromodel. A 5.0 μm Millipore filter (from Sigma Aldrich, Germany) was used to filter the oil in order to avoid micromodel pore plugging from thick residue and solid particles. The measured crude oil properties at the temperature of 22 °C were viscosity (mPa·s) 23.00, density (g/cm3) 0.88, and 29.42° API gravity.
2.2. Porous Media
2.2.1. Bentheimer Core Plug for Single-Phase Polymer Flood
Core plugs with an average diameter and length of 30 and 60 mm, respectively, were used for single-phase polymer flooding. Porosity was measured by using a helium gas porosity meter (Micromeritics 1340 pycnometer from Micromeritics GmbH Unterschleissheim, Germany), and permeability was measured by using a nitrogen gas permeameter (SYROPERM from GL Test Systems GmbH Heiligenstadt Germany). Brine permeability was measured by injecting synthetic seawater at five different injection rates (0.5. 1.0, 2.0. 5.0, and 10.0 mL/min). Table 3 provides a summary of the used core plugs.
Table 3.
Bentheimer core plug properties.
A schematic representation of the core-flood setup is shown in Figure 2. It consists of a Hassler cell connected to three ISCO pumps (Teledyne ISCO from Lincoln NE, USA) for multi-flow infusion/withdrawal arrangement. The core plug receives confining pressure of 30.0 bar as an overburden pressure, using an ISCO injection pump. A system pressure of 2.0 bar was established, using a backpressure regulator for each experiment. Experimental preparation for single-phase polymer flooding uses the following steps:
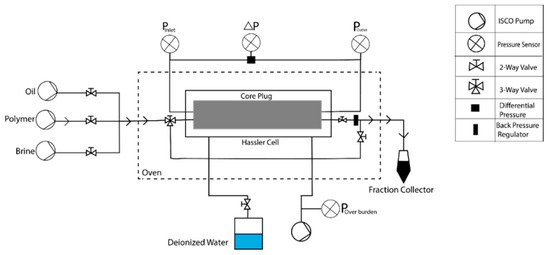
Figure 2.
Sketch of core flood experimental setup [4].
- Perform the oscillatory, steady shear viscosity, and extensional measurements of polymer solutions before core flood (3000 ppm in B1 and B2) at the selected temperatures (22 and 55 °C) for rheological characterization.
- Perform polymer flooding with an increasing range of injection rates (37 to 29 mL/min) through the core at the relevant temperatures (22 and 55 °C), to investigate in situ viscosity.
- Perform the oscillatory, steady shear viscosity and extensional measurements of effluents from core flood at the chosen temperatures (22 and 55 °C), for loss in rheological properties.
2.2.2. Microfluidics
An oil-wet glass–silicon–glass (GSG) micromodel was used for oil recovery experiments as porous media, shown in Figure 3. Regular distribution of circular grains defines the micromodel as being homogeneous and consists of an artificial pore structure. Previously, such homogenous micromodels have been used for several EOR investigations [76,77,78,79]. Figure 3 shows pore-structure images and dimensional measurements of the model, and Table 4 provides porosity and permeability values.
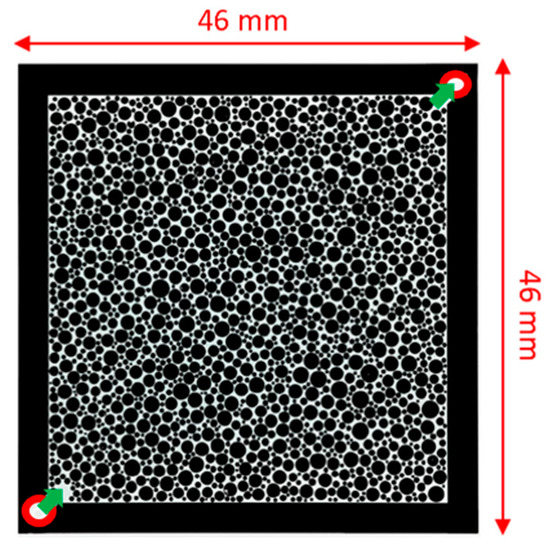
Figure 3.
Micromodels used in this study. Inlet bottom-left and outlet top-right.
Table 4.
Characteristics of micromodel and experiment used in this work [80].
The water-wet micromodel was chemically modified to generate an oil-wet condition. The chemisorption of fluorinated silane was applied on the silicon surfaces and micromodels’ inner glass, to establish the oil-wet condition of the micromodel. Initially, silicon and glass showed a contact angle (to water) below 20°, and hence a water-wet condition. After the chemisorption process, the oil-wet condition was established with the increased contact angle of 112°. Micromodel wettability alteration to oil-wet is almost permanent. Only strong bases or acids can attack and damage the adsorbed silane layer.
A microfluidics-flooding rig from HOT Microfluidics (Goslar, Germany) was used for the flooding experiment. InspIOR is a compact experimental package that includes a micromodel holder, injection pumps, a DSLR camera for imaging, fluid and waste reservoirs, and pressure sensors. An upgraded version of the components and experimental setup, as described by Schumi et al. [79], was used for the flooding experiments. Table 4 describes how the injection rate corresponds to field scale injection flux of 1.0 ft./day for the flooding process. Oil-recovery experiments were performed at a system pressure of 1.0 bar (gas) and at room temperature (i.e., 22 °C), with the following steps:
- Initially, deionized water injection was performed in a clean micromodel, to remove air bubbles pursued until the differential pressure across micromodel reaches the desired value and stabilizes.
- Micromodel permeability was measured with deionized water, and synthetic seawater saturation was established in micromodel afterward.
- Continuous and increasing oil injection rates were performed to establish initial oil saturation, until no further water could be produced and pressure stabilized.
- Polymer flooding (2000 ppm prepared in B1 and B3) was performed to observe the oil recovery and to gather the pressure data.
- Micromodel images were captured during the flooding process, at different time intervals, and an imaging-processing tool developed in MATLAB (2018b) calculated oil recovery at a specific time interval/image.
Polymer flooding was performed in micromodel, with connate water saturation, at room temperature, to investigate the impact of salinity and hardness on polymer in situ viscosity and oil recovery. Polymer solutions prepared in B1 and B3 with 2000 ppm were injected into the micromodel, to observe oil recovery. Note that, the addition of sodium sulfate in SSW increased the total dissolved solids but decreased the hardness, as can be seen R+1 in Table 2. Oil recovery and pressure response from polymer injection will support whether the impact of increasing the TDS or the higher hardness is more significant.
2.3. e-VROC Extensional Viscometer
Extensional viscosity of non-Newtonian fluids was measured by using an e-VROC (extensional viscometer–rheometer on a chip). This device consists of a microfluidic hyperbolic shape of converging–diverging geometry, which simulates the pore and pore-throat configuration in porous media. The pressure response before and after the converging–diverging geometry is measured via microelectrical–mechanical systems (MEMS), which help interpret viscosity changes across pore-throat in porous media. A schematic representation of this hyperbolic converging–diverging geometry can be seen in Figure 4 [9]. Further details on the associated physics and working principle can be found in References [7,9,15].
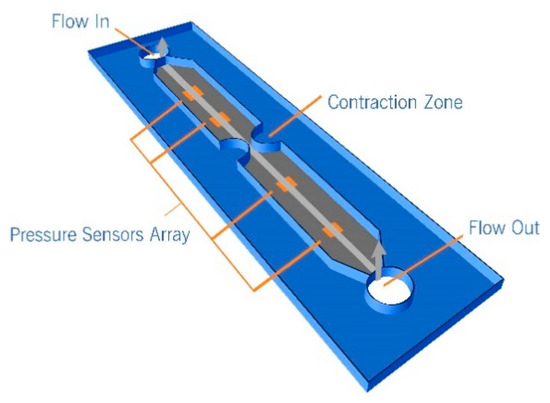
Figure 4.
Microfluidic hyperbolic converging–diverging geometry to simulate pore and pore-throat geometry (reproduced with permission from [9], Copyright Society of Petroleum Engineers (SPE), 2016).
3. Results and Discussion
3.1. Steady Shear Viscosity
Steady shear viscosity response of diluted polymer solutions before core flood at room temperature of 22 °C and at a specific high temperature of 55 °C with different brine compositions can be seen in Figure 5. As expected, a significant loss in polymer viscosity corresponds to brine higher salinity and hardness, as described in Figure 5. At a shear rate of 1 s−1, Flopaam 6035 S depicted three times greater viscosity loss in reservoir brine (B2), as compared to seawater (B1), at 22 °C. However, viscosity loss was five times greater for the same polymer at the high temperature of 55 °C. Comparing Flopaam 6035 S and Hengfloc 63026, prepared in (B2) at 22 and 55 °C, it can be seen from Figure 6 that Hengfloc represents the higher viscosity at the lower temperature, while Flopaam holds the higher viscosity at the elevated temperature. This provides the insight of temperature sensitivity for polymer selection screening criteria at specific temperatures. Furthermore, Figure 5 and Figure 6 show that the presence of an amount of divalent cations (B2) has a significant impact on polymer viscosity at the high temperature.
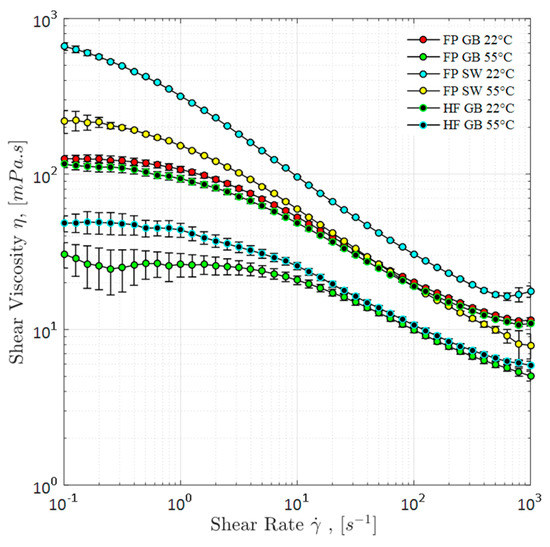
Figure 5.
Steady shear viscosity of polymer solutions at 22 and 55 °C prepared in typical reservoir brine (B2) and synthetic seawater.
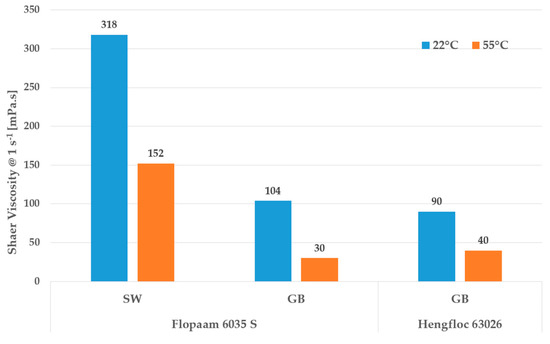
Figure 6.
Comparison of steady shear viscosity for Flopaam 6035 S and Hengfloc 63026, at a shear rate of 1 s−1, measured at 22 and 55 °C.
3.2. Single-Phase Polymer Flooding Results
3.2.1. Measuring Pressure Drop across the Cores
Viscoelastic phenomena of polymer solutions in porous media can be observed via a similar approach to that proposed by Heemskerk et al. [81]. This approach measures the pressure drop during polymer flooding experiments plotted against increasing interstitial velocity. Heemskerk observed the Newtonian response for a slope of precisely 45°. However, shear-thinning behavior for a slope below 45° was observed in his work and a slope greater than 45° for shear-thickening behavior. The obtained results of our work are in exceptionally good agreement with those reported by Heemskerk et al. [81]. The observed behaviors of HPAM polymer solutions at different temperatures prepared in both brines are illustrated in Figure 7, clearly as follows: shear thinning below 45°, shear thickening behavior above 45°, and a characteristic slope for a Newtonian response at 45°. Deionized water (DW) in Figure 7 represents the pressure drop over interstitial velocity for the Newtonian fluid flow behavior used as baseline. From Figure 7, it can be seen that Flopaam 6035 S depicted the higher viscoelastic properties (based on pressure drop, formed angle) compared to the Hengfloc 63026 at specific temperature and same brine. However, it prevails the need to be investigate whether brine salinity (hardness) or reservoir temperature has the dominant influence to counter polymer viscoelastic properties in porous media. As it can be seen from Figure 7, Flopaam 6035 S, prepared in high-salt brine (B2) at 22 °C, depicted a higher pressure drop than that of the same polymer prepared in low-salt brine (B1) at 55 °C. Note that higher-pressure drops at the same flux values represent a strong viscoelastic behavior (base on the formed angle), and this behavior is assumed to be due to the high molecular weight of the polymer and the resistance to flow when flowing in the porous media. Based on these observations, we have then observed that temperature has a stronger impact on decreasing polymer viscoelastic properties in porous media as compared to the brine hardness. As a matter of background, we have plotted two reference points for comparison purposes. The black triangular point in Figure 7 represents a typical interstitial flow velocity of 1 ft./day deep inside the reservoir, whereas the red triangular point represents the flow velocity of 5 ft./day. Figure 7 describes that, far inside the reservoir, is mainly shear-thinning behavior of polymer solutions. However, around the injection and production wells, flux rate is increased to 10–15 ft./day, and the polymer viscoelastic response becomes significant. Sheng [82] reported multiples near-wellbore problems associated to the polymer viscoelasticity, for instance, pumps caveating.
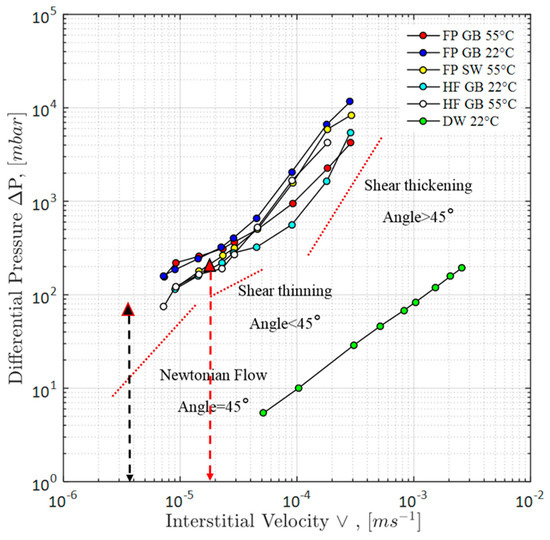
Figure 7.
Core flood measured pressure drop as a function of increasing interstitial velocity for HPAM Flopaam 6035 S/Hengfloc 63026 diluted polymer solutions. The data are plotted at two different temperatures prepared in reservoir brine and synthetic seawater.
3.2.2. Pressure-Drop Differentiation Due to Shear and Elongation
A typical pressure-response plot for single-phase core flood, as a function of increasing injection interstitial velocity for different conditions, is presented in Figure 8. ∆PT in the plot corresponds to the total pressure obtained during core flooding measurement of polymer solution. (∆PS) describes the pressures associated with shear and was determined by using Darcy’s law, using rheometer viscosity data, while ∆PE is pressure drop associated to extensional and was measured by using e-VROC. These pressure-drop results help to determine any additional pressure drop caused by the turbulence of flow streams in porous media. Mingling of flow lines at intermediate-to-high injection rates produces this excessive pressure drop, which resists the laminar flow and causes flow resistance in porous media. Figure 8 describes that the total pressure drop only matched the shear associated pressure drop at low interstitial velocity. The calculation for total pressure drop in core flood is performed with the following equation:
where ∆PT = total pressure drop obtained during polymer flooding in core plug; (∆PS + ∆PE) = pressure drop due to viscoelasticity of polymers (shear + extensional); ∆PS = pressure drop determined by using Darcy’s equation and Carreau–Yasuda flow curve fitted to rheometer data; ∆PE = pressure drop associated to polymer extensional response and measured with e-VROC; and ∆Pt = excessive pressure drop linked to turbulence happening in porous media (∆PT − ∆PE − ∆PS).
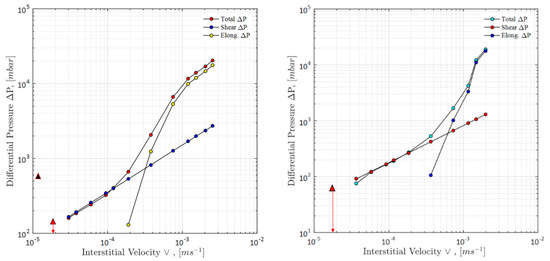
Figure 8.
Core pressure drop versus increasing interstitial velocity for an HPAM solution. (Left) Pressure data plotted are for the Flopaam 6035 S 3000 ppm at 22 °C in synthetic seawater and (right) Hengfloc 63026, 3000 ppm at 55 °C in reservoir brine. Elong. (Elongational viscosity) was measured via e-VROC. Calculated pressures were obtained by using Darcy’s equation and the Carreau–Yasuda flow curve fitted to rheometer data.
By comparing the experimental pressure data with the rheometer data, it can be seen in Figure 8 that shear forces dominate at low interstitial velocities. Furthermore, at low interstitial velocities, the pressure drop associated to elongational response is lower and can be neglected. The viscoelastic nature of the polymer solutions become dominant with an increase in interstitial velocity, and hence resulting in higher total pressure drop deviating from shear associated pressure drop. This viscoelastic behavior causes the increase in total pressure drop to deviate from the rheomter data after a critical interstitial velocity, associated to in situ critical shear rate. An increase in extensional pressure drop at higher interstitial velocities also confirms the viscoelastic response of the polymer. Figure 8 further presents that the extensional pressure drop almost matches the total pressure drop at high injection rates, thus concluding the extensional dominated flow at higher flux values. Crossover of pressure drop lines at medium flux (the triangular area) corresponds to the excessive pressure drop occurring in porous media, which was not measured by using rheometer or e-VROC. Red triangular points in Figure 8 represent the flow velocity of 5 ft./day, which falls within the shear-thinning response of polymer solutions.
When we combine the observations from pressure across the cores (Figure 7) and the differentiation of that pressure by shear and elongation (Figure 8), both figures provide that, deep inside the reservoir, flow dynamics of polymer solutions could be predicted by using the approach here presented (linear viscoelastic part). However, around the injection and production wells, elongational/extensional measurements should be incorporated to completely understand the flow regimes in porous media.
3.3. Core-Flooding Effluent Analysis
3.3.1. Steady Shear Rheology
At low shear rates (Figure 9), the steady shear viscosity evaluations of core flood’s effluent showed significant reductions. Despite the core length (6 cm), a significant loss in shear viscosity at the sand face around the well bore is observed. Viscosity loss due to mechanical degradation can be clearly seen at all shear rates (low to high), as shown in Figure 9.
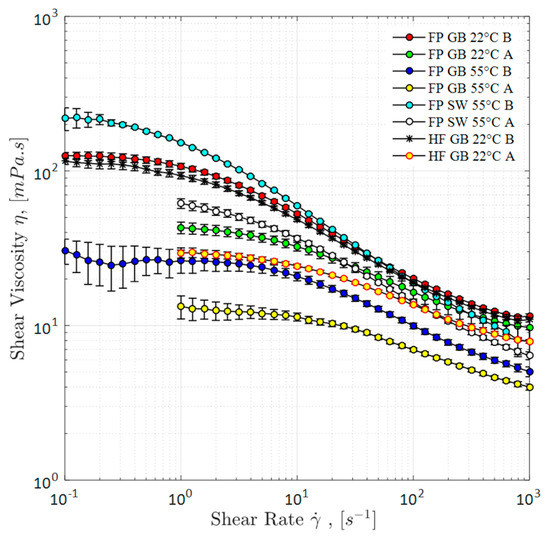
Figure 9.
Steady shear viscosity diluted polymer solutions before core flood (B) and after core flood (A), at 22 and 55 °C, prepared with reservoir brine and synthetic seawater.
Effluents results in Figure 10 help to conclude that Hengfloc 63026 solution depicted higher viscosity degradation compared to Flopaam 6035 S solutions. Moreover, Flopaam 6035 S was resistant to semi-harsh conditions of salinity, thermal as well as high shear rates (around injection and production well scenarios) compared to Hengfloc 63026. Note that percentages of viscosity degradation shown in Figure 10 are calculated based on a comparison of the steady shear viscosity before and after core flooding using Equation (4) [83].
where, = viscosity of the solution before core flood, and = viscosity of the solution after core flood.
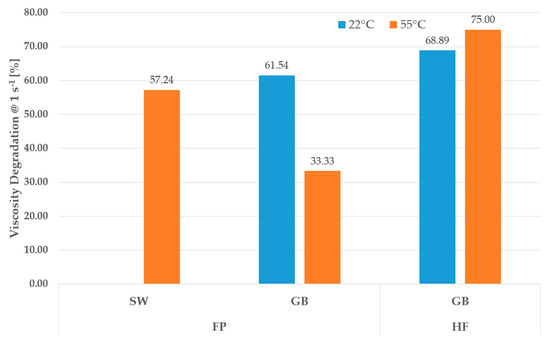
Figure 10.
Viscosity degradation of polymer solutions while flowing through core plugs over wide range in increasing injection rates.
3.3.2. First Normal Stress Differences and Oscillatory Measurement
Viscoelastic behavior of diluted polymer solutions was evaluated by using first normal stress differences (N1) measurements and small-amplitude oscillatory shear (SAOS) response. Force normal to shear flow produces normal stress differences (N1) and measures the elastic behavior of the polymer solutions. Tension in the flow streamlines measures the N1 effects.
Similarly, the viscous and elastic properties of the polymer solutions were characterized through oscillatory measurements. These measurements focused on the viscous modulus (G″) and elastic modulus (G′) measured as the function of angular frequency. The inverse of angular frequency (rad/second) at the crossover point of viscous and elastic moduli (G′ = G″) defines the relaxation time. High relaxation time of a material depicts dominant viscoelastic properties; however, viscous materials have less or no relaxation time property. Further details on experimental evaluation procedures can be found in Hincapie et al. [15] and Hincapie [7].
The results of linear viscoelastic effects of solutions, crossover point angular frequency (right), and first normal stress difference (left) are presented in Figure 11. As expected, the solution with deionized water exhibited strong elastic behavior based on first normal stress differences, while other diluted solutions prepared in both brines, at 22 and 55 °C, showed no elastic response. Only at higher shear rates, the Flopaam 6035 S polymer solution prepared in synthetic seawater at 22 °C displayed an elastic response. Figure 11 (right) summarizes the non-elastic responses based on relaxation time measurements for the solutions prepared in both brines, at 22 and 55 °C. This non-elastic response from oscillatory measurements was confirmed due to semi-hard conditions (divalent cations and temperature).
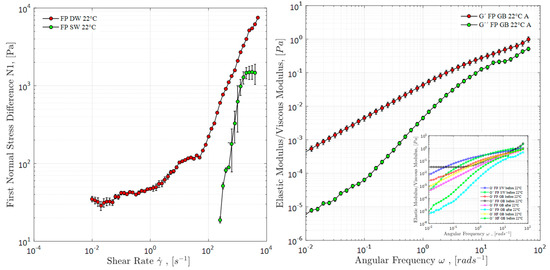
Figure 11.
(Right) Oscillatory measurements as a function of angular frequency and (left) first normal stress differences as a function of shear rate for polymer solutions before core flood (B) and after core flood (A), at 22 and 55 °C, prepared with reservoir brine and synthetic seawater.
By comparing data presented in Figure 11 (left and right), we concluded that both measurements of viscoelastic behavior (first normal stress differences and oscillatory measurements) could not completely predict the fluid viscoelastic response in porous media. The results are in line with the investigation of Azad et al. [84,85]. The results from Azad and Trivedi [84] highlight the advantages of extensional rheology over oscillatory rheology. Furthermore, the authors also claim the validation of the capillary theory, using a modified capillary number.
As reported by Hincapie [7,11], SAOS (small-amplitude oscillatory shear) can only provide an insight on whether a polymer might depict viscoelastic properties, but it fails to fully predict the behavior under flow. Similarly, Azad et al. [85] suggested that the Deborah number and shear rheology cannot predict the porous media flow. Therefore, extensional measurements using a capillary breakup extensional rheometer help us to understand flow behavior in porous media.
3.3.3. Extensional Measurements
The results of the e-VROC measurements are described in Figure 12. The highest (and apparently linear) extensional viscosity can be clearly seen for Flopaam 6035 S with deionized water. The presence of a higher amount of divalent cations (reservoir brine) exhibited the negative impact to lower the polymer extensional viscosity, as compared to solutions prepared with a lower amount of divalent cations (synthetic seawater). Minimum extensional viscosity can be seen for the core flood effluent with (reservoir brine) at 55 °C, which also confirms a significant reduction in extensional properties around the well bore within a radius of a few inches. As previously mentioned, in the results of SAOS measurements (presented in Figure 11, on the right), solutions did not depict any viscoelastic behavior, but elongational measurements showed otherwise.
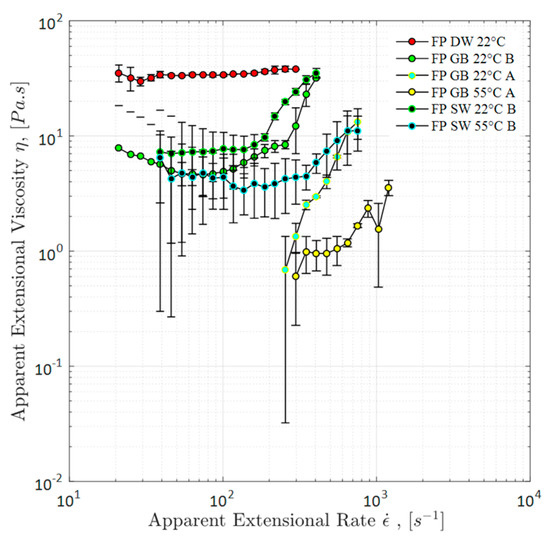
Figure 12.
Apparent extensional (elongational) viscosity as a function of apparent extensional rate for polymer solutions before core flood (B) and after core flood (A), at 22 and 55 °C, prepared with reservoir brine and synthetic seawater.
We have observed from Figure 7 and Figure 8 (coupling core flood data and elongational, e-VROC®/core-flood) that solutions depicted a viscoelastic response. These observations support the hypothesis that oscillatory measurements fail to predict the solutions’ behavior in porous media, which is in agreement with data reported by Azad et al. [84,85].
3.4. Polymer Flooding in Oil-Saturated Micromodel
Polymer solutions (prepared in SW) with varying amounts of sulfates were flooded in oil-saturated micromodels. The approach helped understanding which factor between salinity and hardness has a dominating impact on in situ polymer shear viscosity. Polymer flooding in oil-saturated micromodel is perform at a seemly reservoir (field scale) injection flux of 1 ft./day. As previously shown, Figure 7 and Figure 8 depicted 1 ft./day fall within the range of shear-thinning behavior of polymer solutions. Therefore, flooding experiments in micromodels were used to evaluate polymer shear analysis in porous media and to investigate the impact of salinity and hardness.
Under the assumption (previously demonstrated), that viscoelasticity mainly dominates at higher flux values around injection and production wells, experiments performed in micromodels were analyzed by using the shear viscosity approach part (low flux). In situ shear rate (apparent shear rate) was calculated by using two approaches at the flux rate of 1 ft./day, presented in Table 5. Determining a maximum and minimum shear rate range helped in defining the diagonal areal variation of the flooding path between injection and production points (or inlet bottom-left and outlet top-right), as shown in Figure 3 The lower in situ shear rate value is in line with the low flux values of Figure 7; hence, it demonstrated the prevalence of the shear flow of polymer solutions in porous media.
Table 5.
Shear rate in micromodel at flux rate of 1 ft./day.
Polymer flooding (2000 ppm prepared in B1 and B3) was performed in oil-saturated micromodels with initial water saturation. Table 6 summarizes the initial oil and water saturations before brine/polymer flooding. Almost the same values of initial saturation were achieved and can be seen in Table 6. Oil recovery factor and pressure profiles obtained for SW flooding (used as a benchmark) and both polymer solutions can be seen in Figure 13.
Table 6.
Summary of micromodels initialization and oil recovery factors at 22 °C.
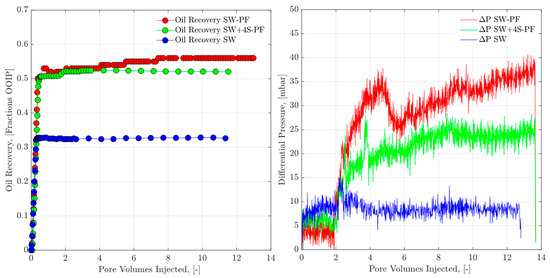
Figure 13.
Oil recovery factor/pressure drop as a function of pore volume (PV) injected in micromodel at 22 °C. Synthetic seawater and diluted polymer solutions injection is performed as the secondary mode.
Seawater (SW), B1, produced the minimum oil recovered of 33% with lowest and stable pressure response. However, as expected, higher recoveries from both polymer solutions can be clearly seen in Figure 13. Moreover, polymer prepared in SW produced 4% additional oil recovery as compared to the polymer prepared in SW+4S (B3). Oil recovery experiments are in line with results obtained in in a previous study [4,6]. Increasing the amount of sodium sulfate in brine increases the polymer sensitivity to mechanical degradation. Even though SW has higher hardness (R+1 = 0.13) as compared to SW+4S (R+1 = 0.09), an increased amount of TDS depicted a stronger impact compared to hardness. The reason behind this is the excessive amount of sodium ions in SW+4S. Positive sodium ions reacted with the negative ionic charge on polymer molecules, which in turn reduced the polymer molecular structure. This opposite ions’ reaction resulted in the lower shear viscosity in porous media and hence produced the lower oil recovery. Lower oil recovery from SW+4S concludes that brine salinity significantly decreases in situ shear viscosity compared to hardness of the brine.
Furthermore, pressure profiles of Figure 13 support the results of oil recovery factors. Added amount of sodium sulfate increased the polymer sensitivity to mechanical degradation in the flow lines, which resulted in a significant decrease of polymer shear viscosity entering into the micromodel. Increased degradation values and decreased polymer shear viscosity resulted in the lower pressure responses in the micromodel for SW+4S-PF. This lower pressure response directly influenced the oil mobilization and resulted in lower oil recovery for the SW+4S-PF.
Figure 14 represents the initial fluid saturations (upper image) and final fluids saturations (lower image) in micromodel for both polymer floods. From the right bottom corners of both images in Figure 14, the main difference in oil recovery can be visually observed. These observations and the overall data previously presented let us assume that salinity has stronger impact compared to hardness (shown by many authors), keeping polymer mechanical degradation in focus, which in-turn is related to lower the shear viscosity, hence sweep efficiency.
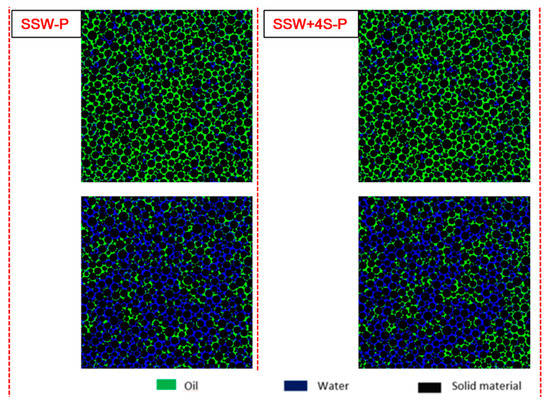
Figure 14.
Image processing of oil recovery with oil initialization and after 10 PV injection, for both polymer solutions, at 22 °C.
Synthetic seawater, B1, injection was performed as the base case, and to observe the reproducibility of the oil recovery data, synthetic seawater flooding was repeated in the cleaned model. The main flooding was a straight flow path between the production and injection points, shown in Figure 15, with almost the same oil recovery factors. Oil recovery and pressure data for synthetic seawater flooding is presented in Figure 16. Similar values are observed for both experiments looking at the pressure response and final RFs. Hence, micromodel reproducibility is confirmed within 2% of marginal error. Additional data and procedures can be seen on a previous study presented by the authors [3].
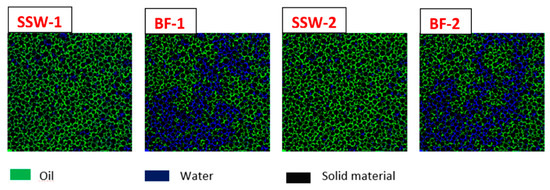
Figure 15.
Oil recovery of seawater injection reproducibility at 22 °C. SSW-1/SSW-2 represents the oil initialization, while BF-1/BF-2 represents after 5 PV injected brine [3].
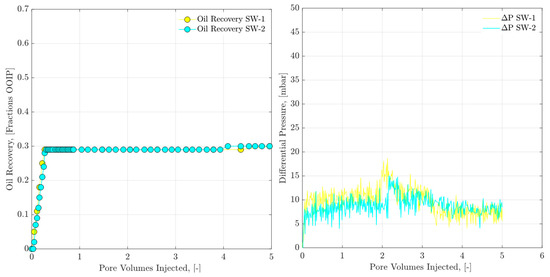
Figure 16.
Oil recovery and pressure drop versus pore volume (PV) injected for micromodel at 22 °C. Synthetic seawater (SW) injection is performed as the secondary mode for both flooding experiments.
4. Conclusions
The following main conclusions can be drawn based on the experimental analysis and evaluation of the results:
- Comparison of core flood pressure-drop data with rheometer and e-VROC® pressure data has provided insightful information about turbulence-dominated excessive pressure drop occurring inside porous media. The existence of this excessive pressure drop in porous media will help to understand pore-scale mechanisms in reservoirs.
- Deep inside the reservoir, flow dynamics of polymer solutions could be predicted by using the approach here presented (linear viscoelastic part). However, around the injection and production wells, elongational/extensional measurements should be incorporated to completely understand the flow regimes in porous media.
- Reservoir semi-harsh conditions, at a high temperature and with an increased amount of divalent cations, significantly counter the designed viscoelastic properties of polymers. Extensional, steady shear viscosity and oscillatory measurement were used to investigate the impact of semi-harsh conditions on polymer elastic properties. The activity of divalent ions at high temperatures makes it a worse condition for polymers to hold good viscoelastic properties. However, low salinity pre-flush as a water-softening technique before polymer flood can help to mitigate this issue.
- Comparison of rheological characterization before core flood and effluent showed that the primary loss of viscoelastic properties occurs at the sand face of injection, well within a radius of a few inches.
- Results of oil recovery factor conclude that brine salinity is a more sensitive parameter, as compared to brine hardness, in focus of shear flow. Higher salinity and lower hardness can challenge the polymer target shear viscosity and influence the sweep efficiency in porous media.
Author Contributions
M.T. performed experiments and defined methodology; R.E.H. worked on conceptualization and results validation; and L.G. reviewed and performed editing. All authors have read and agreed to the published version of the manuscript.
Funding
This research received no external funding.
Acknowledgments
We acknowledge support given by the Open Access Publishing Fund of Clausthal University of Technology.
Conflicts of Interest
The authors declare no conflict of interest.
Abbreviations
| FP | Flopaam 6035 S |
| HF | Hengfloc 63026 |
| A | After core flood (effluent) |
| B | Before core flood (fresh solution) |
| SW | Seawater |
| eVROC | Extensional viscometer–rheometer on a chip |
| DW | De-ionized water |
| N1 | First normal stress differences |
References
- Pope, G.A. Recent Developments and Remaining Challenges of Enhanced Oil Recovery. J. Pet. Technol. 2011, 63, 65–68. [Google Scholar] [CrossRef]
- Hincapie, R.; Alvarez, C.E.; Vargas, A.J. Technical Feasibility of Polymer Injection in Heavy Oil Reservoir BAINF60 and BAMED78: Intercampo Norte—Through Predictive Models. In Proceedings of the SPE Heavy Oil Conference and Exhibition, Kuwait City, Kuwait, 12–14 December 2011. [Google Scholar] [CrossRef]
- Tahir, M.; Hincapie, R.E.; Gaol, C.L.; Säfken, S.; Ganzer, L. Flow Dynamics of Sulfate-Modified Water/Polymer Flooding in Micromodels with Modified Wettability. Appl. Sci. 2020, 10, 3239. [Google Scholar] [CrossRef]
- Tahir, M.; Hincapie, R.E.; Ganzer, L. Influence of Sulfate Ions on the Combined Application of Modified Water and Polymer Flooding—Rheology and Oil Recovery. Energies 2020, 13, 2356. [Google Scholar] [CrossRef]
- Tahir, M.; Hincapie, R.E.; Foedisch, H.; Abdullah, H.; Ganzer, L. Impact of Sulphates Presence During Application of Smart Water Flooding Combined with Polymer Flooding. In Proceedings of the SPE Europec Featured at 80th EAGE Conference and Exhibition, Copenhagen, Denmark, 11–14 June 2018. [Google Scholar] [CrossRef]
- Tahir, M.; Hincapie, R.E.; Foedisch, H.; Strobel, G.-J.; Ganzer, L. Potential Benefits of Fluid Optimization for Combined Smart-Water and Polymer Flooding: Impact on Remaining Oil Saturation. In Proceedings of the SPE Russian Petroleum Technology Conference, Moscow, Russia, 22–24 October 2019. [Google Scholar] [CrossRef]
- Hincapie, R.E. Pore-Scale Investigation of the Viscoelastic Phenomenon during Enhanced Oil Recovery (EOR) Polymer Flooding through Porous Media; Papierflieger: Clausthal-Zellerfeld, Germany, 2016. [Google Scholar]
- Be, M.; Hincapie, R.E.; Rock, A.; Gaol, C.L.; Tahir, M.; Ganzer, L. Comprehensive Evaluation of the EOR Polymer Viscoelastic Phenomenon at Low Reynolds Number. In Proceedings of the SPE Europec Featured at 79th EAGE Conference and Exhibition, Paris, France, 12–15 June 2017. [Google Scholar] [CrossRef]
- Elhajjaji, R.R.; Hincapie, R.E.; Tahir, M.; Rock, A.; Wegner, J.; Ganzer, L. Systematic Study of Viscoelastic Properties during Polymer-Surfactant Flooding in Porous Media. In Proceedings of the SPE Russian Petroleum Technology Conference and Exhibition, Moscow, Russia, 24–26 October 2016. (In Russian). [Google Scholar] [CrossRef]
- Tahir, M.; Hincapie, R.E.; Be, M.; Ganzer, L. Experimental Evaluation of Polymer Viscoelasticity During Flow in Porous Media: Elongational and Shear Analysis. In Proceedings of the SPE Europec Featured at 79th EAGE Conference and Exhibition, Paris, France, 12–15 June 2017. [Google Scholar] [CrossRef]
- Tahir, M.; Hincapie, R.E.; Be, M.; Ganzer, L. A Comprehensive Combination of Apparent and Shear Viscoelastic Data during Polymer Flooding for EOR Evaluations. World J. Eng. Technol. 2017, 5, 585–600. [Google Scholar] [CrossRef]
- Tahir, M.; Hincapie, R.E. Coexistence of Shear and Elongational Components of Flow Paths through Porous Media during Polymer-Flooding Applications. In Proceedings of the 77th EAGE Conference and Exhibition 2015, Madrid, Spain, 1–4 June 2015; pp. 1–3. [Google Scholar]
- Hincapie, R.E.; Ganzer, L. Assessment of Polymer Injectivity with Regards to Viscoelasticity: Lab Evaluations towards Better Field Operations. In Proceedings of the 77th EAGE Conference and Exhibition 2015, Madrid, Spain, 1–4 June 2015. [Google Scholar] [CrossRef]
- Huang, B.; Hu, X.; Fu, C.; Cheng, H.; Wang, X.; Wang, L. Molecular Morphology and Viscoelasticity of ASP Solution under the Action of a Different Medium Injection Tool. Polymers 2019, 11, 1299. [Google Scholar] [CrossRef] [PubMed]
- Hincapie, R.E.; Duffy, J.; O’Grady, C.; Ganzer, L. An Approach to Determine Polymer Viscoelasticity under Flow Through Porous Media by Combining Complementary Rheological Techniques. In Proceedings of the SPE Asia Pacific Enhanced Oil Recovery Conference, Kuala Lumpur, Malaysia, 11–13 August 2015. [Google Scholar] [CrossRef]
- Li, J.; Niu, L.; Wu, W.; Sun, M. The Reservoir Adaptability and Oil Displacement Mechanism of Polymer Microspheres. Polymers 2020, 12, 885. [Google Scholar] [CrossRef]
- Huang, B.; Li, X.; Fu, C.; Wang, Y.; Cheng, H. Study Rheological Behavior of Polymer Solution in Different-Medium-Injection-Tools. Polymers 2019, 11, 319. [Google Scholar] [CrossRef]
- Al-Shakry, B.; Skauge, T.; Shiran, B.S.; Skauge, A. Polymer Injectivity: Investigation of Mechanical Degradation of Enhanced Oil Recovery Polymers Using In-Situ Rheology. Energies 2019, 12, 49. [Google Scholar] [CrossRef]
- Al-Shakry, B.; Skauge, T.; Shiran, B.S.; Skauge, A. Impact of Mechanical Degradation on Polymer Injectivity in Porous Media. Polymers 2018, 10, 742. [Google Scholar] [CrossRef]
- Agi, A.; Junin, R.; Gbonhinbor, J.; Onyekonwu, M. Natural polymer flow behaviour in porous media for enhanced oil recovery applications: A review. J. Petrol. Explor. Prod. Technol. 2018, 8, 1349–1362. [Google Scholar] [CrossRef]
- Jones, D.M.; Walters, K. The behaviour of polymer solutions in extension-dominated flows, with applications to Enhanced Oil Recovery. Rheol. Acta 1989, 28, 482–498. [Google Scholar] [CrossRef]
- Nilsson, M.A.; Kulkarni, R.; Gerberich, L.; Hammond, R.; Singh, R.; Baumhoff, E.; Rothstein, J.P. Effect of fluid rheology on enhanced oil recovery in a microfluidic sandstone device. J. Non-Newton. Fluid Mech. 2013, 202, 112–119. [Google Scholar] [CrossRef]
- Van Santvoort, J.; Golombok, M. Sweep enhancers for oil recovery. J. Petrol. Explor. Prod. Technol. 2016, 6, 473–480. [Google Scholar] [CrossRef]
- Jacobsen, J.G.; Shiran, B.S.; Skauge, T.; Sorbie, K.S.; Skauge, A. Qualification of New Methods for Measuring In Situ Rheology of Non-Newtonian Fluids in Porous Media. Polymers 2020, 12, 452. [Google Scholar] [CrossRef] [PubMed]
- Azad, M.S.; Trivedi, J.J. Quantification of the Viscoelastic Effects During Polymer Flooding: A Critical Review. SPE J. 2019. [Google Scholar] [CrossRef]
- Sorbie, K.S. Polymer-Improved Oil Recovery; Springer Science and Business Media LLC: Dordrecht, The Netherlands, 1991; ISBN 978-94-011-3044-8. [Google Scholar]
- Skauge, T.; Djurhuus, K.; Reichenbach-Klinke, R. Visualization of Heavy Oil Mobilization by Associative Polymer. In Proceedings of the SPE Europec Featured at 80th EAGE Conference and Exhibition, Copenhagen, Denmark, 11–14 June 2018. [Google Scholar] [CrossRef]
- Huh, C.; Pope, G.A. Residual Oil Saturation from Polymer Floods: Laboratory Measurements and Theoretical Interpretation. In Proceedings of the SPE Symposium on Improved Oil Recovery, Tulsa, OK, USA, 20–23 April 2008. [Google Scholar] [CrossRef]
- Rock, A.; Hincapie, R.E.; Hoffmann, E.; Ganzer, L. Tertiary Low Salinity Waterflooding LSWF in Sandstone Reservoirs: Mechanisms, Synergies and Potentials in EOR Applications. In Proceedings of the SPE Europec Featured at 80th EAGE Conference and Exhibition, Copenhagen, Denmark, 11–14 June 2018. [Google Scholar] [CrossRef]
- Clarke, A.; Howe, A.M.; Mitchell, J.; Staniland, J.; Hawkes, L.; Leeper, K. Mechanism of anomalously increased oil displacement with aqueous viscoelastic polymer solutions. Soft Matter 2015, 11, 3536–3541. [Google Scholar] [CrossRef] [PubMed]
- Sheng, J.J.; Leonhardt, B.; Azri, N. Status of Polymer-Flooding Technology. J. Can. Pet. Technol. 2015, 54, 116–126. [Google Scholar] [CrossRef]
- Yin, H.; Wang, D.; Zhong, H. Study on Flow Behavoirs of Viscoelastic Polymer Solution in Micropore With Dead End. In Proceedings of the SPE Annual Technical Conference and Exhibition, San Antonia, TX, USA, 24–27 September 2006. [Google Scholar] [CrossRef]
- Demin, W.; Cheng, J.; Xia, H.; Li, Q.; Shi, J. Viscous-Elastic Fluids Can Mobilize Oil Remaining after Water-Flood by Force Parallel to the Oil-Water Interface. In Proceedings of the SPE Asia Pacific Improved Oil Recovery Conference, Kuala Lumpur, Malaysia, 6–9 October 2001. [Google Scholar]
- Hincapie, R.E.; Rock, A.; Wegner, J.; Ganzer, L. Oil Mobilization by Viscoelastic Flow Instabilities Effects during Polymer EOR: A Pore-Scale Visualization Approach. In Proceedings of the SPE Latin America and Caribbean Petroleum Engineering Conference, Buenos Aires, Argentina, 17–19 May 2017. [Google Scholar] [CrossRef]
- Qi, P.; Ehrenfried, D.H.; Koh, H.; Balhoff, M.T. Reduction of Residual Oil Saturation in Sandstone Cores Using Viscoelastic Polymers. In Proceedings of the SPE Improved Oil Recovery Conference, Tulsa, OK, USA, 11–13 April 2016. [Google Scholar] [CrossRef]
- Wang, J.; Dong, M. Optimum effective viscosity of polymer solution for improving heavy oil recovery. J. Pet. Sci. Eng. 2009, 67, 155–158. [Google Scholar] [CrossRef]
- Yang, F.; Wang, D.; Wang, G.; Sui, X.; Liu, W.; Kan, C. Study on High-Concentration Polymer Flooding To Further Enhance Oil Recovery. In Proceedings of the SPE Annual Technical Conference and Exhibition, San Antonio, TX, USA, 24–27 September 2006. [Google Scholar] [CrossRef]
- Algharaib, M.; Alajmi, A.; Gharbi, R. Improving polymer flood performance in high salinity reservoirs. J. Pet. Sci. Eng. 2014, 115, 17–23. [Google Scholar] [CrossRef]
- Koning, E.J.L.; Mentzer, E.; Heemskerk, J. Evaluation of a Pilot Polymer Flood in the Marmul Field, Oman. In Proceedings of the SPE Annual Technical Conference and Exhibition, Houston, TX, USA, 2–5 October 1988. [Google Scholar] [CrossRef]
- Wang, D.; Hao, Y.; Delamaide, E.; Ye, Z.; Ha, S.; Jiang, X. Results of Two Polymer Flooding Pilots in the Central Area of Daqing Oil Field. In Proceedings of the SPE Annual Technical Conference and Exhibition, Houston, TX, USA, 3–6 October 1993. [Google Scholar] [CrossRef]
- Al-Qattan, A.; Sanaseeri, A.; Al-Saleh, Z.; Singh, B.B.; Al-Kaaoud, H.; Delshad, M.; Hernandez, R.; Winoto, W.; Badham, S.; Bouma, C.; et al. Low Salinity Waterflood and Low Salinity Polymer Injection in the Wara Reservoir of the Greater Burgan Field. In Proceedings of the SPE EOR Conference at Oil and Gas West Asia, Muscat, Oman, 26–28 March 2018. [Google Scholar] [CrossRef]
- Shiran, B.S.; Skauge, A. Enhanced Oil Recovery (EOR) by Combined Low Salinity Water/Polymer Flooding. Energy Fuels 2013, 27, 1223–1235. [Google Scholar] [CrossRef]
- Skauge, A.; Shiran, B.S. Low Salinity Polymer Flooding. In Proceedings of the Saint Petersburg Russia—From Fundamental Science to Deployment: 17th European Symposium on Improved Oil Recovery(IOR), St Petersburg, Russia, 16–18 April 2013. [Google Scholar] [CrossRef]
- Ayirala, S.C.; Uehara-Nagamine, E.; Matzakos, A.N.; Chin, R.W.; Doe, P.H.; van den Hoek, P.J. A Designer Water Process for Offshore Low Salinity and Polymer Flooding Applications. In Proceedings of the SPE Improved Oil Recovery Symposium, Tulsa, OK, USA, 24–28 April 2010. [Google Scholar] [CrossRef]
- Khorsandi, S.; Qiao, C.; Johns, R.T. Displacement Efficiency for Low Salinity Polymer Flooding Including Wettability Alteration. In Proceedings of the SPE Improved Oil Recovery Conference, Tulsa, OK, USA, 11–13 April 2016. [Google Scholar] [CrossRef]
- Kim, D.H.; Lee, S.; Ahn, C.H.; Huh, C.; Pope, G.A. Development of a Viscoelastic Property Database for EOR Polymers. In Proceedings of the SPE Improved Oil Recovery Symposium, Tulsa, OK, USA, 24–28 April 2010. [Google Scholar] [CrossRef]
- Sochi, T. Non-Newtonian flow in porous media. Polymer 2010, 51, 5007–5023. [Google Scholar] [CrossRef]
- Clarke, A.; Howe, A.M.; Mitchell, J.; Staniland, J.; Hawkes, L.A. How Viscoelastic-Polymer Flooding Enhances Displacement Efficiency. SPE J. 2016, 21, 675–687. [Google Scholar] [CrossRef]
- Wang, D.; Wang, G.; Xia, H. Large Scale High Visco-Elastic Fluid Flooding in the Field Achieves High Recoveries. In Proceedings of the SPE Enhanced Oil Recovery Conference, Kuala Lumpur, Malaysia, 19–21 July 2011. [Google Scholar] [CrossRef]
- Muller, A.J.; Patruyo, L.G.; Montano, W.; Roversi-M, D.; Moreno, R.; Rami´rez, N.E.; Sa´ez, A.E. Mechanical Degradation of Polymers in Flows Through Porous Media: Effect of Flow Path Length and Particle Size. Appl. Mech. Rev. 1997, 50. [Google Scholar] [CrossRef]
- Chemical Degradation—An Overview|ScienceDirect Topics. Available online: https://www.sciencedirect.com/topics/materials-science/chemical-degradation (accessed on 3 April 2020).
- Mechanical Degradation—An Overview|ScienceDirect Topics. Available online: https://www.sciencedirect.com/topics/engineering/mechanical-degradation (accessed on 3 April 2020).
- Thermal Degradation of Polymer—An Overview|ScienceDirect Topics. Available online: https://www.sciencedirect.com/topics/engineering/thermal-degradation-of-polymer (accessed on 3 April 2020).
- Ray, S.; Cooney, R. Thermal Degradation of Polymer and Polymer Composites. In Handbook of Environmental Degradation of Materials, 2nd ed.; Elsevier BV: Amsterdam, The Netherlands, 2012; pp. 213–242. [Google Scholar] [CrossRef]
- Divers, T.; Gaillard, N.; Bataille, S.; Thomas, A.; Favéro, C. Successful Polymer Selection for CEOR: Brine Hardness and Mechanical Degradation Considerations. In Proceedings of the SPE Oil and Gas India Conference and Exhibition, Mumbai, India, 4–6 April 2017. [Google Scholar] [CrossRef]
- Moradi-Araghi, A.; Doe, P.H. Hydrolysis and Precipitation of Polyacrylamides in Hard Brines at Elevated Temperatures. SPE Reserv. Eng. 1987, 2, 189–198. [Google Scholar] [CrossRef]
- Seright, R.S. The Effects of Mechanical Degradation and Viscoelastic Behavior on Injectivity of Polyacrylamide Solutions. Soc. Pet. Eng. J. 1983, 23, 475–485. [Google Scholar] [CrossRef]
- Xiong, B.; Purswani, P.; Pawlik, T.; Samineni, L.; Karpyn, Z.T.; Zydney, A.L.; Kuma, M. Mechanical degradation of polyacrylamide at ultra high deformation rates during hydraulic fracturing. Environ. Sci. Water Res. Technol. 2020, 6, 166–172. [Google Scholar] [CrossRef]
- Puls, C.; Clemens, T.; Sledz, C.; Kadnar, R.; Gumpenberger, T. Mechanical Degradation of Polymers During Injection, Reservoir Propagation and Production—Field Test Results 8 TH Reservoir, Austria. In Proceedings of the SPE Europec Featured at 78th EAGE Conference and Exhibition, Vienna, Austria, 30 May–2 June 2016. [Google Scholar] [CrossRef]
- Swiecinski, F.; Reed, P.; Andrews, W. The Thermal Stability of Polyacrylamides in EOR Applications. In Proceedings of the SPE Improved Oil Recovery Conference, Tulsa, OK, USA, 11–13 April 2016. [Google Scholar] [CrossRef]
- Rodriguez, L.; Mejia, A.; Reynaud, S.; Lespes, G.; Favero, C.; Antignard, S.; Giovannetti, B.; Gaillard, N.; Dupuis, G.; Loriau, M.; et al. Monitoring Thermal and Mechanical Stability of Enhanced Oil Recovery (EOR) Acrylamide Based Polymers (PAM) Through Intrinsic Viscosity (IV) Determination Using a New Capillary Rheology Technique. In Proceedings of the SPE EOR Conference at Oil and Gas West Asia, Muscat, Oman, 21–23 March 2016. [Google Scholar] [CrossRef]
- Zhang, X.; Han, M.; Fuseni, A.; AlSofi, A.M. A New Facile Approach to Estimate EOR Polymers Thermal Stability at Harsh Reservoir Conditions. In Proceedings of the Abu Dhabi International Petroleum Exhibition & Conference, Abu Dhabi, UAE, 13–16 November 2017. [Google Scholar] [CrossRef]
- Jouenne, S.; Chakibi, H.; Levitt, D. Polymer Stability After Successive Mechanical-Degradation Events. SPE J. 2018, 23, 18–33. [Google Scholar] [CrossRef]
- Åsen, S.M.; Stavland, A.; Strand, D.; Hiorth, A. An Experimental Investigation of Polymer Mechanical Degradation at cm and m Scale. In Proceedings of the SPE Improved Oil Recovery Conference, Tulsa, OK, USA, 14–18 April 2018. [Google Scholar] [CrossRef]
- Khamis, M.A.; Omer, O.A.; Kinawy, M.M. Predicting the Optimum Concentration of Partially Hydrolyzed Polyacrylamide Polymer in Brine Solutions for Better Oil Recovery, Experimental Study. In Proceedings of the SPE Kingdom of Saudi Arabia Annual Technical Symposium and Exhibition, Dammam, Saudi Arabia, 23–26 April 2018. [Google Scholar] [CrossRef]
- Diab, W.N.; Al-Shalabi, E.W. Recent Developments in Polymer Flooding for Carbonate Reservoirs under Harsh Conditions. In Proceedings of the Offshore Technology Conference, Rio de Janeiro, Brazil, 29–31 October 2019. [Google Scholar] [CrossRef]
- Rodriguez, L.; Antignard, S.; Giovannetti, B.; Dupuis, G.; Gaillard, N.; Jouenne, S.; Bourdarot, G.; Morel, D.; Zaitoun, A.; Grassl, B. A New Thermally Stable Synthetic Polymer for Harsh Conditions of Middle East Reservoirs. In Proceedings of the SEG/AAPG/EAGE/SPE Research and Development Petroleum Conference and Exhibition, Abu Dhabi, UAE, 9–10 May 2018. [Google Scholar]
- Alfazazi, U.; AlAmeri, W.; Hashmet, M.R. Experimental investigation of polymer flooding with low-salinity preconditioning of high temperature–high-salinity carbonate reservoir. J. Petrol. Explor. Prod. Technol. 2019, 9, 1517–1530. [Google Scholar] [CrossRef]
- Leveratto, M.A.; Lauri, J.; Sanz, C.; Sigal, J.; Ali, S.M.F. EOR Polymer Screening For An Oil Field With High Salinity Brines. SPE Adv. Technol. Ser. 1996, 4, 73–81. [Google Scholar] [CrossRef]
- Unsal, E.; Berge, A.B.G.M.T.; Wever, D.A.Z. Low salinity polymer flooding: Lower polymer retention and improved injectivity. J. Pet. Sci. Eng. 2018, 163, 671–682. [Google Scholar] [CrossRef]
- Kleinitz, W.; Littmann, W. Polymer Flooding: Appraisal of Four Different Field Projects in Germany. In Proceedings of the IOR 1995 8th European Symposium on Improved Oil Recovery, Vienna, Austria, 15–17 May 1995. [Google Scholar] [CrossRef]
- Tabary, R.; Douarche, F.; Bazin, B.; Lemouzy, P.M.; Moreau, P.; Morvan, M. Design of a Surfactant/Polymer Process in a Hard Brine Context: A Case Study Applied to Bramberge Reservoir. In Proceedings of the SPE EOR Conference at Oil and Gas West Asia, Muscat, Oman, 16–18 April 2012. [Google Scholar] [CrossRef]
- Tay, A.; Oukhemanou, F.; Wartenberg, N.; Moreau, P.; Guillon, V.; Delbos, A.; Tabary, R. Adsorption Inhibitors: A New Route to Mitigate Adsorption in Chemical Enhanced Oil Recovery. In Proceedings of the SPE Asia Pacific Enhanced Oil Recovery Conference, Kuala Lumpur, Malaysia, 11–13 August 2015. [Google Scholar] [CrossRef]
- API RP 63—Recommended Practices for Evaluation of Polymers Used in Enhanced Oil Recovery Operations|Engineering360. Available online: https://standards.globalspec.com/std/183645/API%20RP%2063 (accessed on 18 May 2020).
- Vermolen, E.C.M.; van Haasterecht, M.J.T.; Masalmeh, S.K.; Faber, M.J.; Boersma, D.M.; Gruenenfelder, M.A. Pushing the envelope for polymer flooding towards high-temperature and high-salinity reservoirs with polyacrylamide based ter-polymers. In Proceedings of the SPE Middle East Oil and Gas Show and Conference, Manama, Bahrain, 25–28 September 2011. [Google Scholar] [CrossRef]
- Födisch, H.; Wegner, J.; Hincapie, R.; Ganzer, L. Impact of Connate Water Replacement on Chemical EOR Processes. In Proceedings of the SPE Latin American and Caribbean Petroleum Engineering Conference, Quito, Ecuador, 18–20 November 2015. [Google Scholar] [CrossRef]
- Gaol, C.; Wegner, J.; Ganzer, L.; Dopffel, N.; Koegler, F.; Borovina, A.; Alkan, H. Investigation of Pore-Scale Mechanisms of Microbial Enhanced Oil Recovery MEOR Using Microfluidics Application. In Proceedings of the SPE Europec Featured at 81st EAGE Conference and Exhibition, London, UK, 3–6 June 2019. [Google Scholar] [CrossRef]
- Hauhs, F.; Födisch, H.; Hincapie, R.E.; Ganzer, L. Novel Evaluation of Foam and Immiscible Gas Flooding in Glass-Silicon-Glass Micromodels. In Proceedings of the SPE Europec Featured at 80th EAGE Conference and Exhibition, Copenhagen, Denmark, 11–14 June 2018. [Google Scholar] [CrossRef]
- Schumi, B.; Clemens, T.; Wegner, J.; Ganzer, L.; Kaiser, A.; Hincapie, R.E.; Leitenmüller, V. Alkali/Cosolvent/Polymer Flooding of High-TAN Oil: Using Phase Experiments, Micromodels, and Corefloods for Injection-Agent Selection. SPE Reserv. Eval. Eng. 2019. [Google Scholar] [CrossRef]
- Tahir, M.; Hincapie, R.E.; Langanke, N.; Ganzer, L.; Jaeger, P. Coupling Microfluidics Data with Core Flooding Experiments to Understand Sulfonated/Polymer Water Injection. Polymers 2020, 12, 1227. [Google Scholar] [CrossRef] [PubMed]
- Heemskerk, J.; Rosmalen, R.; Janssen-van, R.; Holtslag, R.J.; Teeuw, D. Quantification of Viscoelastic Effects of Polyacrylamide Solutions. In Proceedings of the SPE Enhanced Oil Recovery Symposium, Tulsa, OK, USA, 15–18 April 1984. [Google Scholar] [CrossRef]
- Sheng, J. Modern Chemical Enhanced Oil Recovery: Theory and Practice; Gulf Professional Publishing: Houston, TX, USA, 2011; ISBN 978-1-85617-745-0. [Google Scholar] [CrossRef]
- Tahir, M.; Hincapie, R.E.; Ganzer, L. Unlocking the Effects of Fluid Optimization on Remaining Oil Saturation for the Combined Sulfate-Modified Water and Polymer Flooding. Energies 2020, 13, 3049. [Google Scholar] [CrossRef]
- Azad, M.S.; Trivedi, J.J. Extensional Effects during Viscoelastic Polymer Flooding: Understanding Unresolved Challenges. SPE J. 2020. [Google Scholar] [CrossRef]
- Azad, M.S.; Dalsania, Y.; Trivedi, J.J. Understanding the flow behaviour of copolymer and associative polymers in porous media using extensional viscosity characterization: Effect of hydrophobic association. Can. J. Chem. Eng. 2018, 96, 2498–2508. [Google Scholar] [CrossRef]
- Gogarty, W.B. Mobility Control With Polymer Solutions. Soc. Pet. Eng. J. 1967, 7, 161–173. [Google Scholar] [CrossRef]
- Littmann, W. Polymer Flooding. Developments in Petroleum Science, 24th ed.; Elsevier: Amsterdam, The Netherlands, 1988; Volume 24. [Google Scholar]
© 2020 by the authors. Licensee MDPI, Basel, Switzerland. This article is an open access article distributed under the terms and conditions of the Creative Commons Attribution (CC BY) license (http://creativecommons.org/licenses/by/4.0/).