Article

Influence of Tunnel Boring Machine (TBM) Advance on Adjacent Tunnel during Ultra-Rapid Underground Pass (URUP) Tunneling: A Case Study and Numerical Investigation

1
School of Civil Engineering, Guangzhou University, Guangzhou 510006, China
2
Guangdong Engineering Research Centre for Underground Infrastructural Protection in Coastal Clay Area, Guangzhou University, Guangzhou 510006, China
3
Department of Civil Engineering, College of Water Conservancy and Civil Engineering, South China Agricultural University, Guangzhou 510642, China
4
Institute of Geotechnical Engineering, Nanjing Tech University, Nanjing 210009, China
5
Department of Civil Engineering, Shanghai University, Shanghai 200444, China
*
Authors to whom correspondence should be addressed.
Appl. Sci. 2020, 10(11), 3746; https://doi.org/10.3390/app10113746
Submission received: 27 April 2020 / Revised: 17 May 2020 / Accepted: 25 May 2020 / Published: 28 May 2020
(This article belongs to the Special Issue Advances in Geotechnical Engineering)

Abstract

:
This study investigates the influence of subsequent tunnel boring machine (TBM)-driven processes on the responses of the first tunnel in twin-tunnel construction using the ultra-rapid underground pass (URUP) method. A comprehensive finite element analysis (FEA) is performed to simulate the URUP TBM tunneling, considering the non-uniform convergence caused by the TBM geometry, the tunnel face supporting pressure, and the tail-grouting pressure. The FEA model is validated by the monitoring results of the bending element of the first tunnel lining. The FEA results reveal that the grouting pressure of the second tunnel has significant influence on lining deformation of the first tunnel, while the face supporting pressure shows little effect. The relationship between the grouting pressure and the maximum bending moment of adjacent first tunnel can be fitted by linear function. A grouting pressure equals to the lateral earth pressure is able the reduce the variation of the bending element of the first tunnel during the TBM-driven process of the second tunnel. The bending element of the first tunnel shows a typical lognormal relationship with the face supporting pressure during the TBM advance of the second tunnel. A critical cover-to-depth ratio, under which the horizontal and vertical soil arching effect vanishes, can be deduced to be within the range of 0.55–0.60.

1. Introduction

Mechanized tunneling method has been widely employed in tunnel construction in recent decades. The tunnel boring machine, a.k.a. TBM, is a predominant choice in this tunneling method. The influence of traditional tunneling processes on surrounding environment, e.g., adjacent structures and stratum, cannot be neglected in the construction of underground infrastructure in congested urban areas [1]. TBM-driven processes and excavation of working shafts are two sources of the environment impact in tunnel construction. For TBM-driven-induced influence on adjacent environment, various research has been carried out using experiments [2,3,4,5], numerical simulation [6,7,8,9,10,11,12,13,14,15], analytical study [16,17,18,19,20,21,22,23], and field observation [24,25,26,27,28,29,30,31,32]. The existing research reveals that the tunneling-induced influence is significantly related to particular tunneling variables, such as tunnel heading pressure and tail-grouting pressure [33,34], especially for twin-tunneling activities in which the excavation of the second tunnel imposes remarkable effect on adjacent first tunnel [15,25]. In addition, spacing between the twin tunnels notably affects both the soil movements and lining internal forces. Previous studies [10,35] prove that the second tunnel construction reduces the bending moment of the first tunnel lining, while the first tunnel induces slight changes in the bending moment of the second tunnel lining. According to Gan, et al. [36], excavation of the first tunnel usually results in greater surface settlement than that of the second tunnel, and tunnel uplift can be minimized by optimizing the tail-grouting variables.
In order to avoid influence of shaft excavation during traditional tunneling, the ultra -rapid under pass (URUP) TBM tunneling method was proposed initially for underground infrastructure in Japan [37,38,39]. The TBM is launched and received at the ground surface in the URUP tunneling process. Previous research has been carried out to analyze the ground responses during negative-overburden and shallow-overburden tunneling phases [33,34] of the first demonstration work in China. The field monitoring and nonlinear finite element analyses (FEA) on this URUP demonstration work revealed that [33,34]: (1) the grouting pressure should be considered as a non-uniform distribution during negative- and shallow-overburden tunneling phases; (2) a cover–diameter ratio of 0.55 can be considered as a critical magnitude under which the tunnel face cannot maintain stability; and (3) the Gaussian curve can be employed for the settlement prediction at the ground surface during shallow URUP tunneling under a C/D < 0.55 (C/D is cover-to-diameter ratio).
Existing studies have been focused on the ground responses without detailed investigation on segment internal forces during URUP tunneling, especially for TBM launching of the second tunnel which is adjacent to the first URUP tunnel. The paper presents a comprehensive FEA investigation of the TBM-driven influence on adjacent first tunnel during twin-tunneling using the URUP method. The URUP demonstration work of Nanjing Metro [33] was selected as the tunnel prototype of the FEA. The paper is organized as follows. First, the URUP tunnel of Nanjing Metro is reviewed, and the field monitoring program on segment internal forces is introduced. Second, the FEA model for the URUP tunnel is validated for analyzing the segment internal forces (i.e., the bending moment) by comparing the numerical results with the monitoring data. Finally, the influence of TBM launching on the segment internal forces of adjacent first tunnel is explored by FEA parametric study.

2. Revisit the URUP Demonstration Project at Nanjing

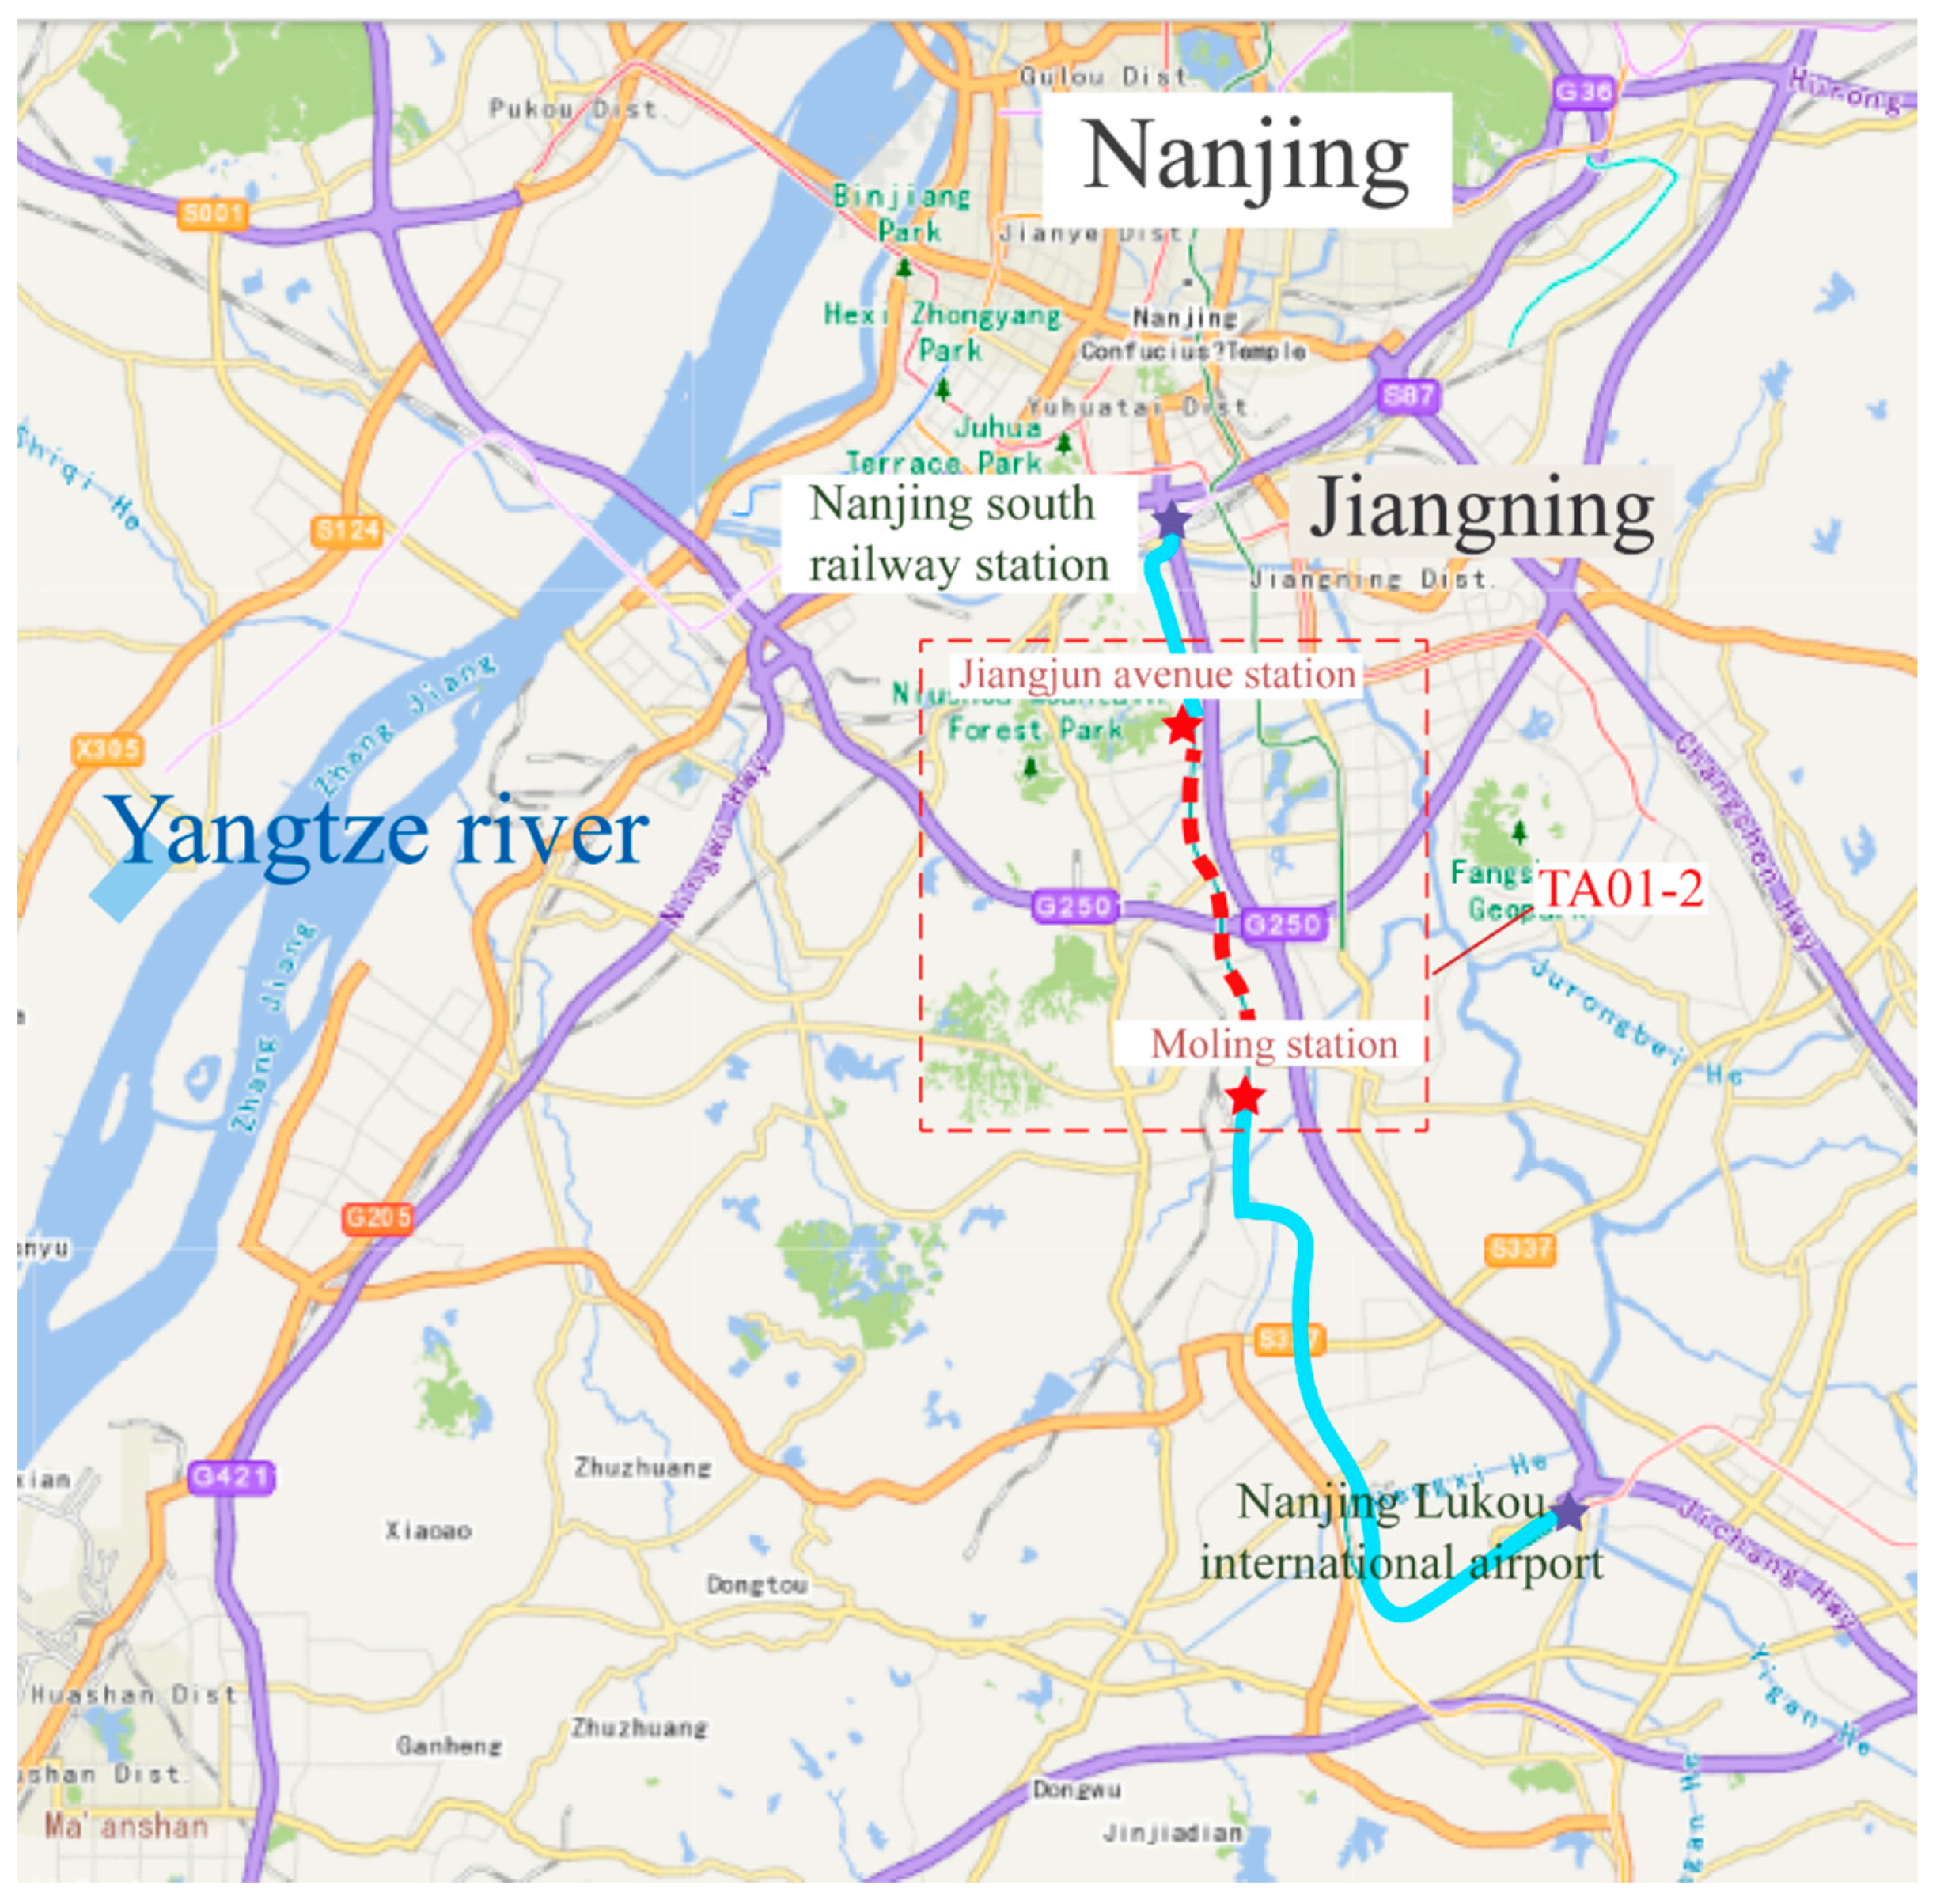
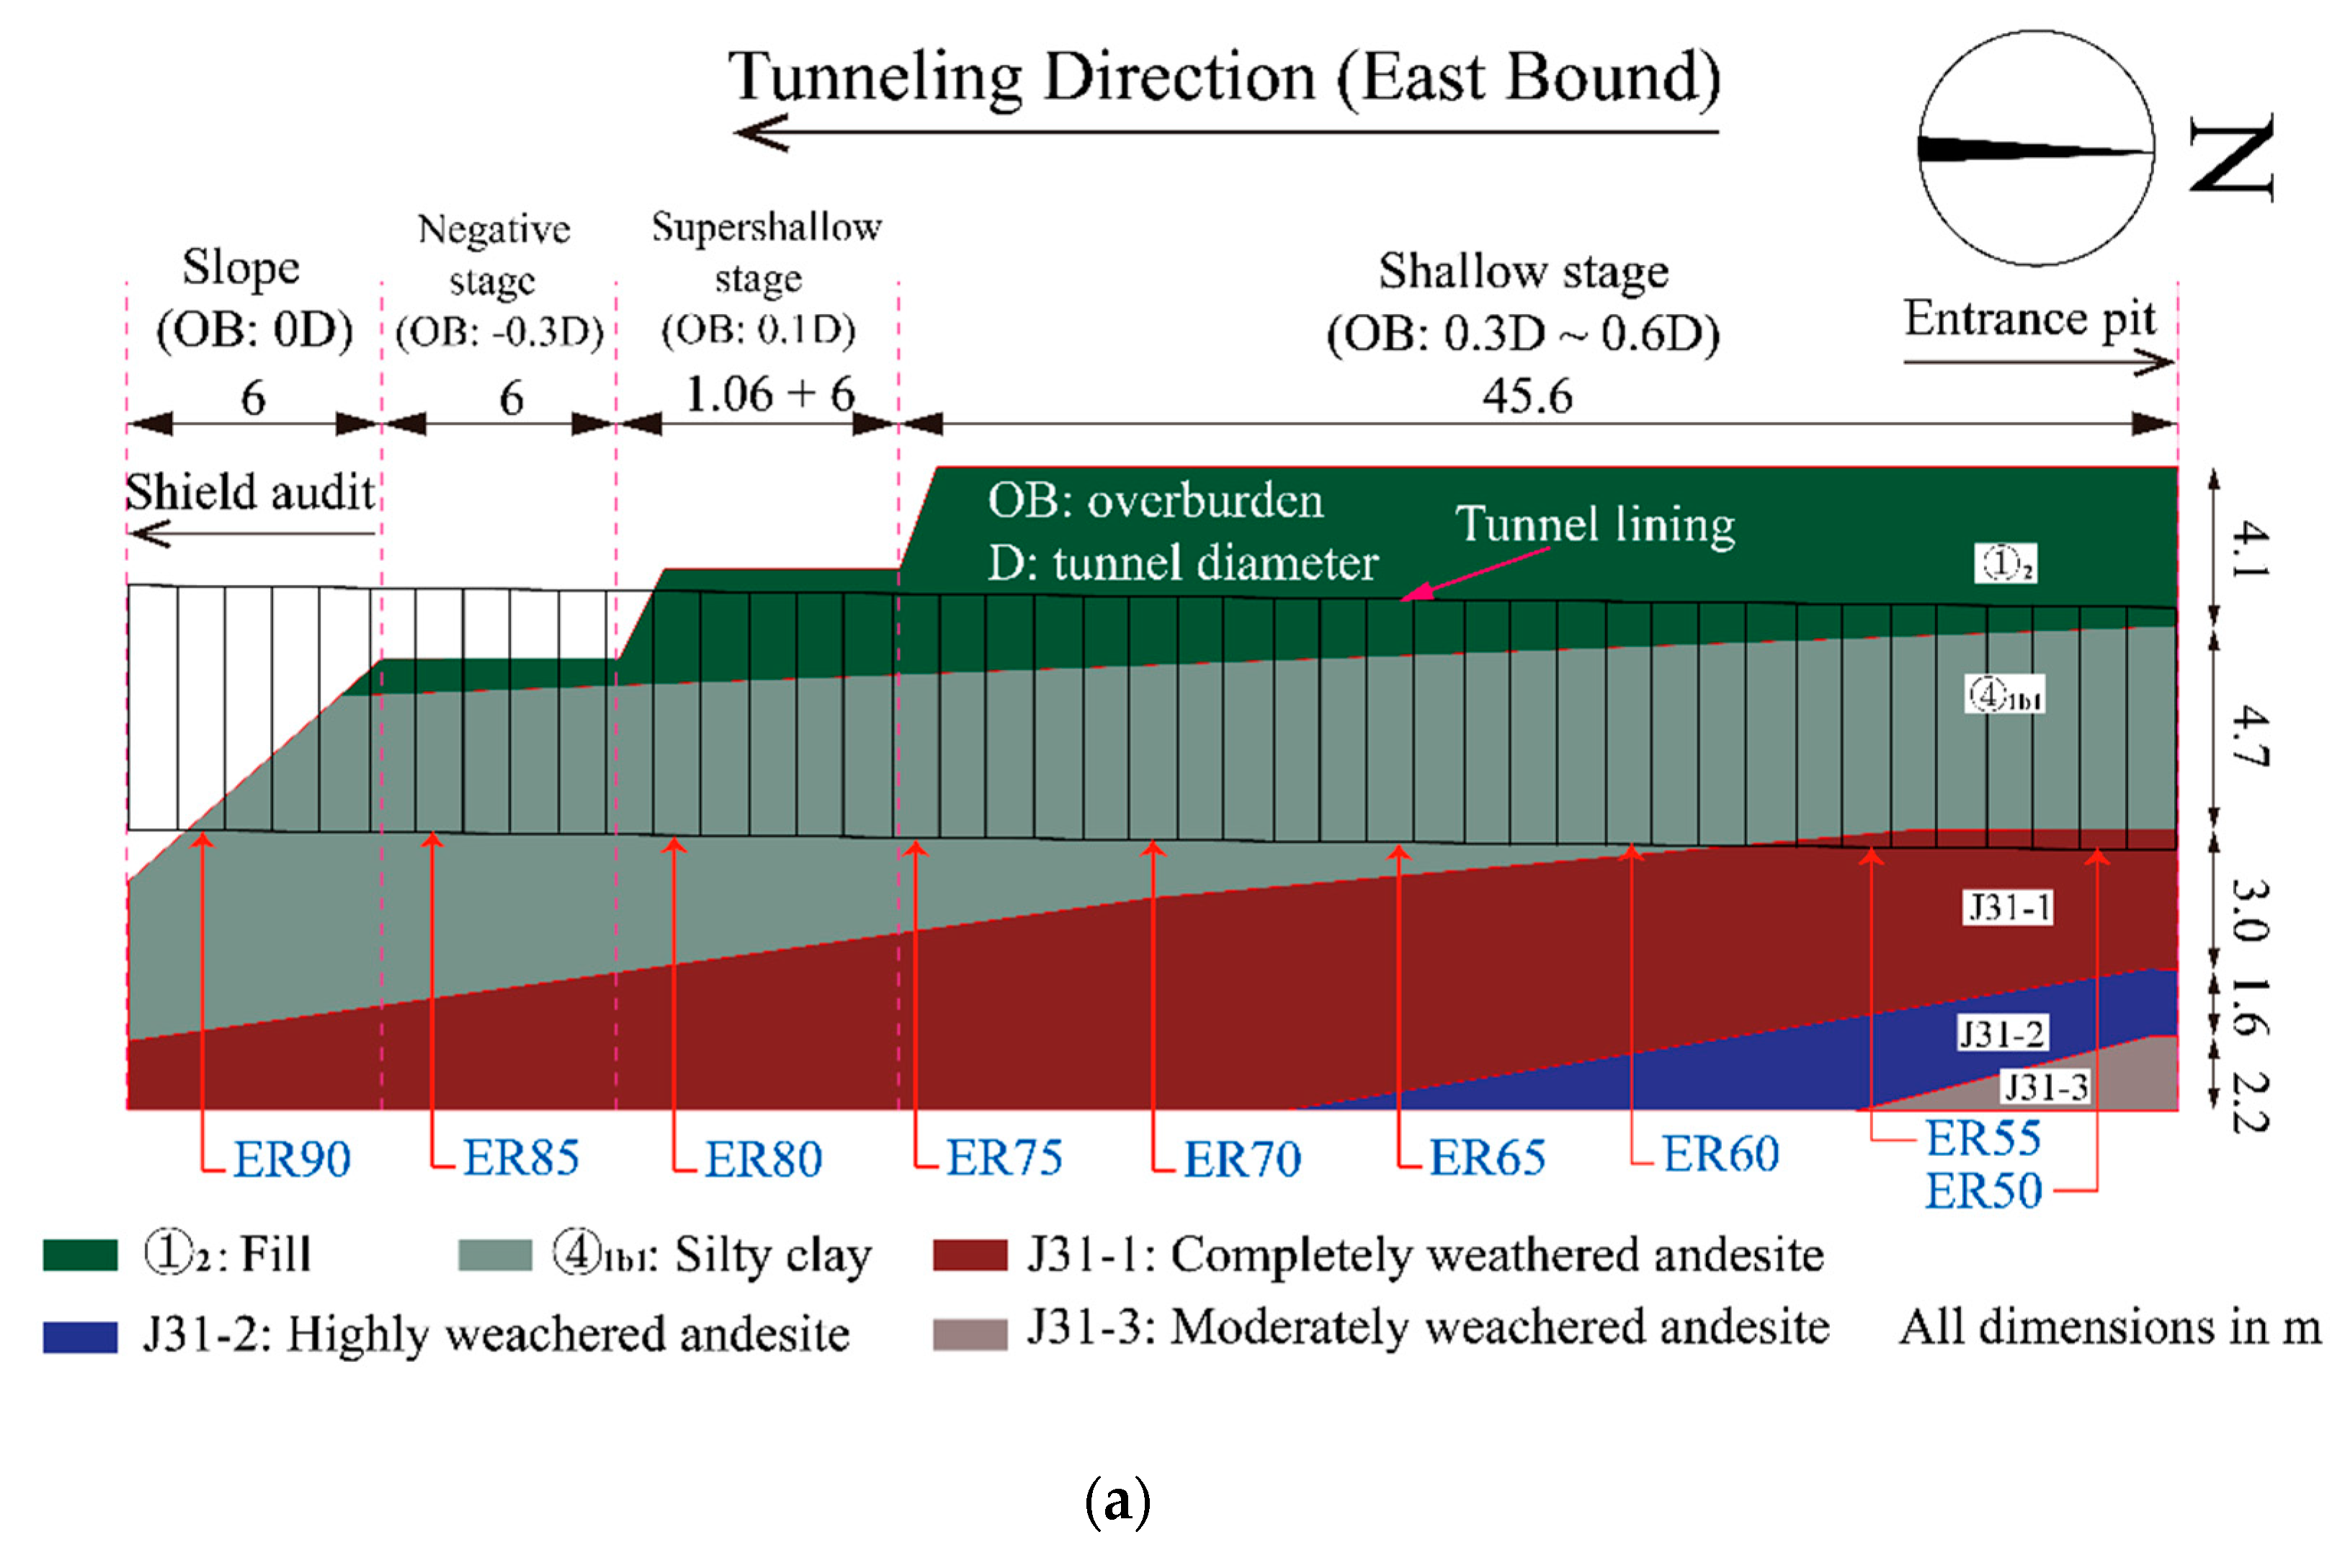
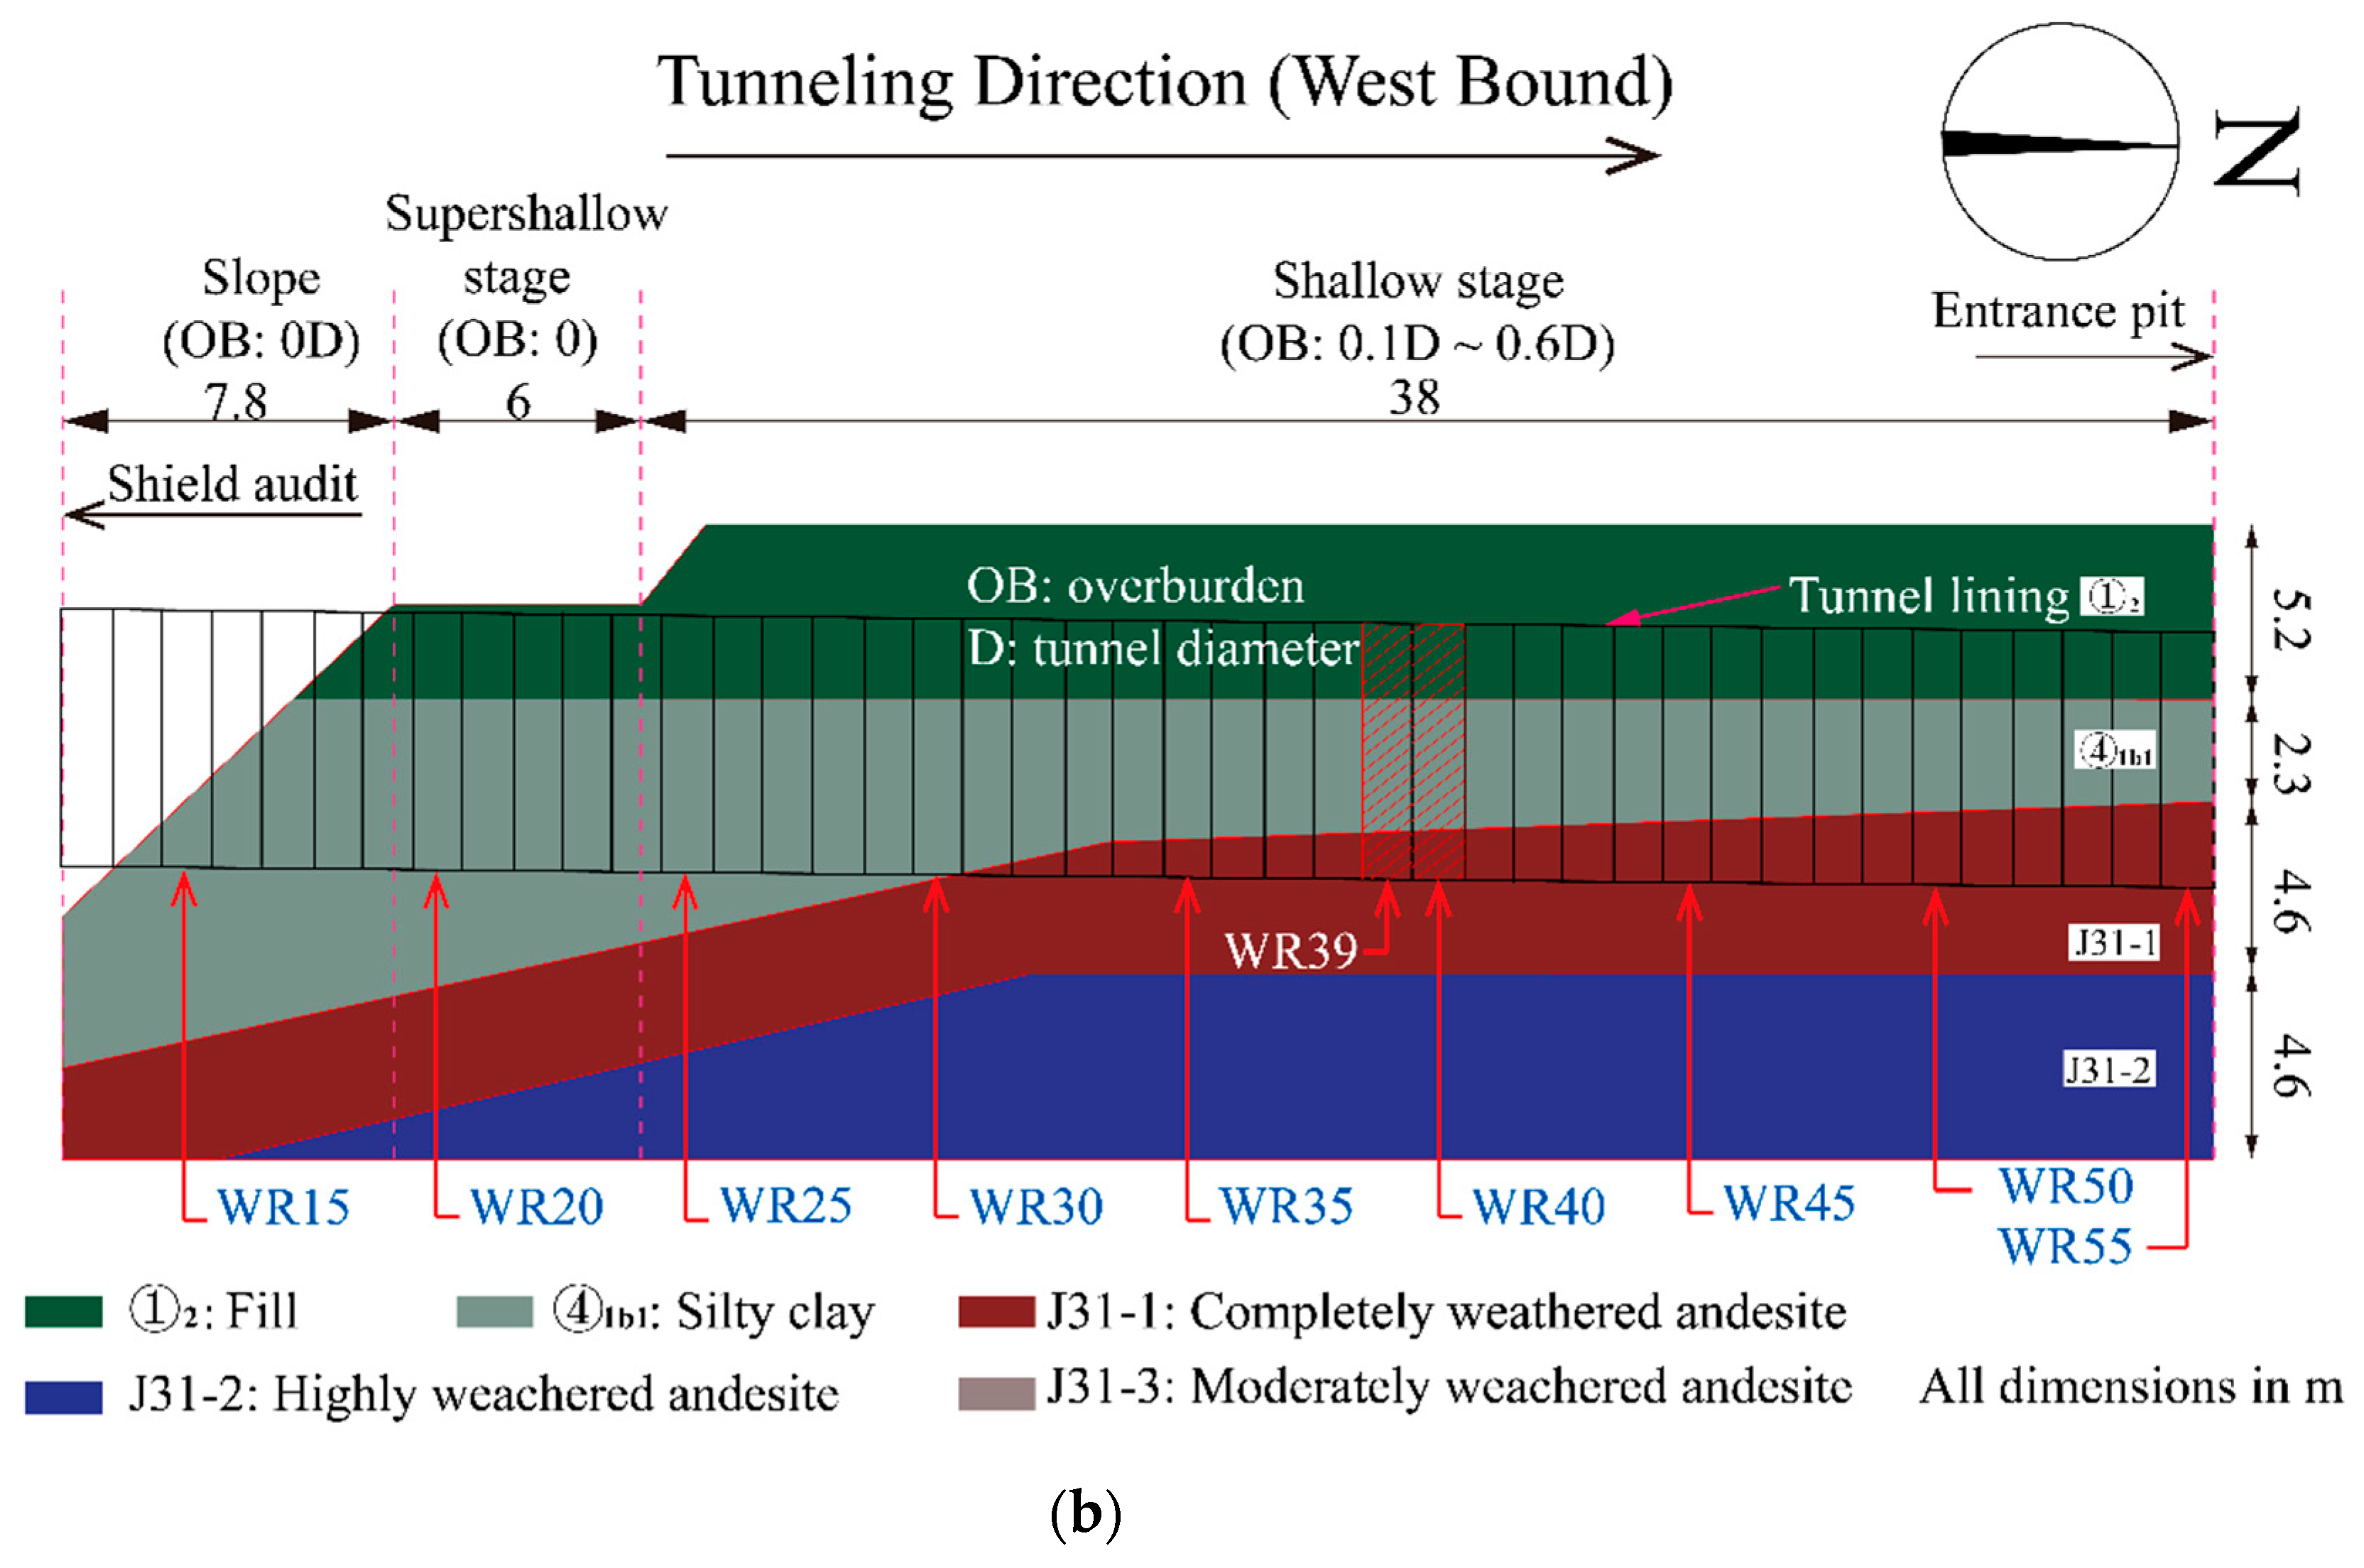
2.1. Project Overview

As a part of Line S1 of Nanjing Metro, the URUP demonstration twin tunnels are located between Jiangjun Avenue Station and Moling Station (as sketched in Figure 1), consisting of two parallel TBM tunnels with the lengths of 124.6 and 123.7 m, respectively. The spacing between the twin tunnels was 1.62 m. An earth pressure balanced boring (EPB) machine with a length of 7.4 m was employed in the project. The diameters of the cutter head and the shield were 6.38 and 6.34 m, respectively. Four grout openings were installed at the TBM tail with an interval of 90°. Single-layer lining was adopted, with the outer and inner diameters of 6.2 and 5.5 m, respectively.
According to geological exploration, the bedrock and groundwater were 20–40 and 2.0–3.6 m underneath the ground surface, respectively. The soil profile is illustrated in Figure 2. Details of the URUP demonstration work can be found in previous research [33,34].

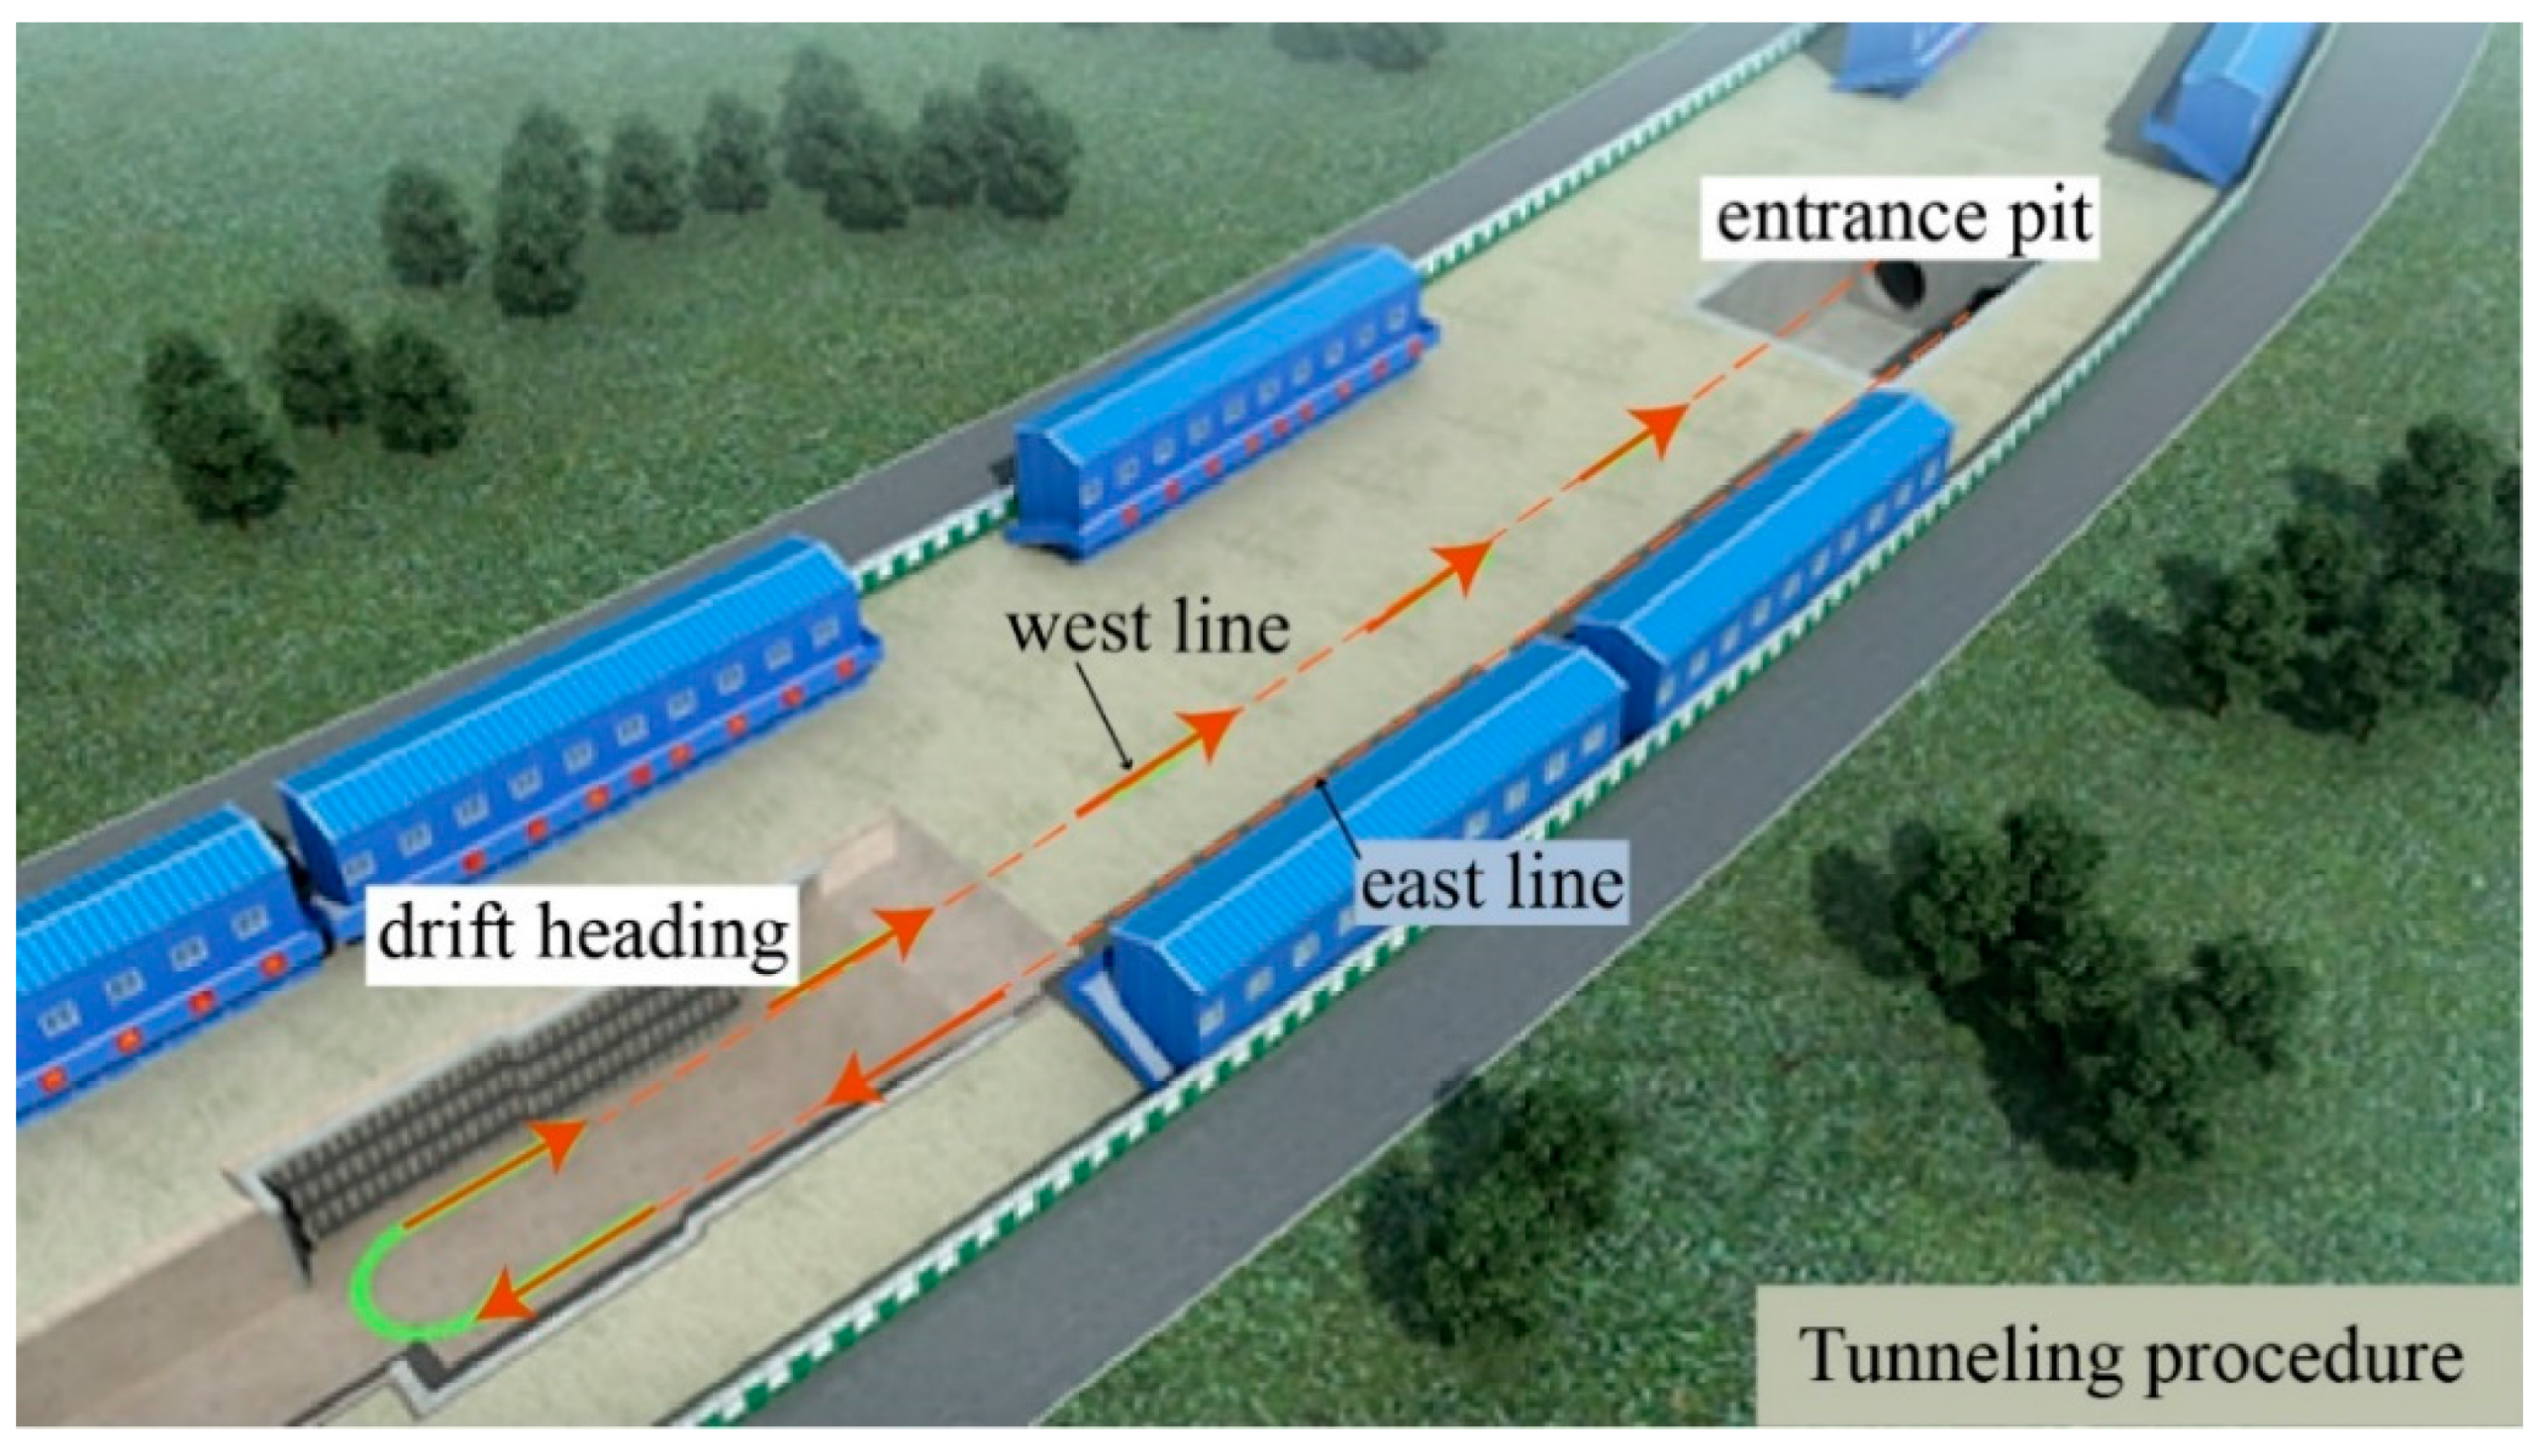
2.2. Tunneling Procedure

The TBM was launched from the entrance pit at the east bound (EB) and driven with an up-gradient of 2.8%. Thereafter, the TBM was received and re-launched at the ground surface and driven along the west bound (WB) with a down-gradient of −2.8% (as depicted in Figure 3). As illustrated in Figure 2 and Figure 3, different overburdens were encountered during the URUP tunneling process, i.e., a shallow stage with an overburden of 0.3–0.6D (D denotes the TBM diameter), a super-shallow stage with an overburden of 0–0.1D, and a negative stage with an overburden less than 0. The super-shallow and negative overburden tunneling required precise tunneling-variable control, including the heading pressure and tail-grouting pressure [34].

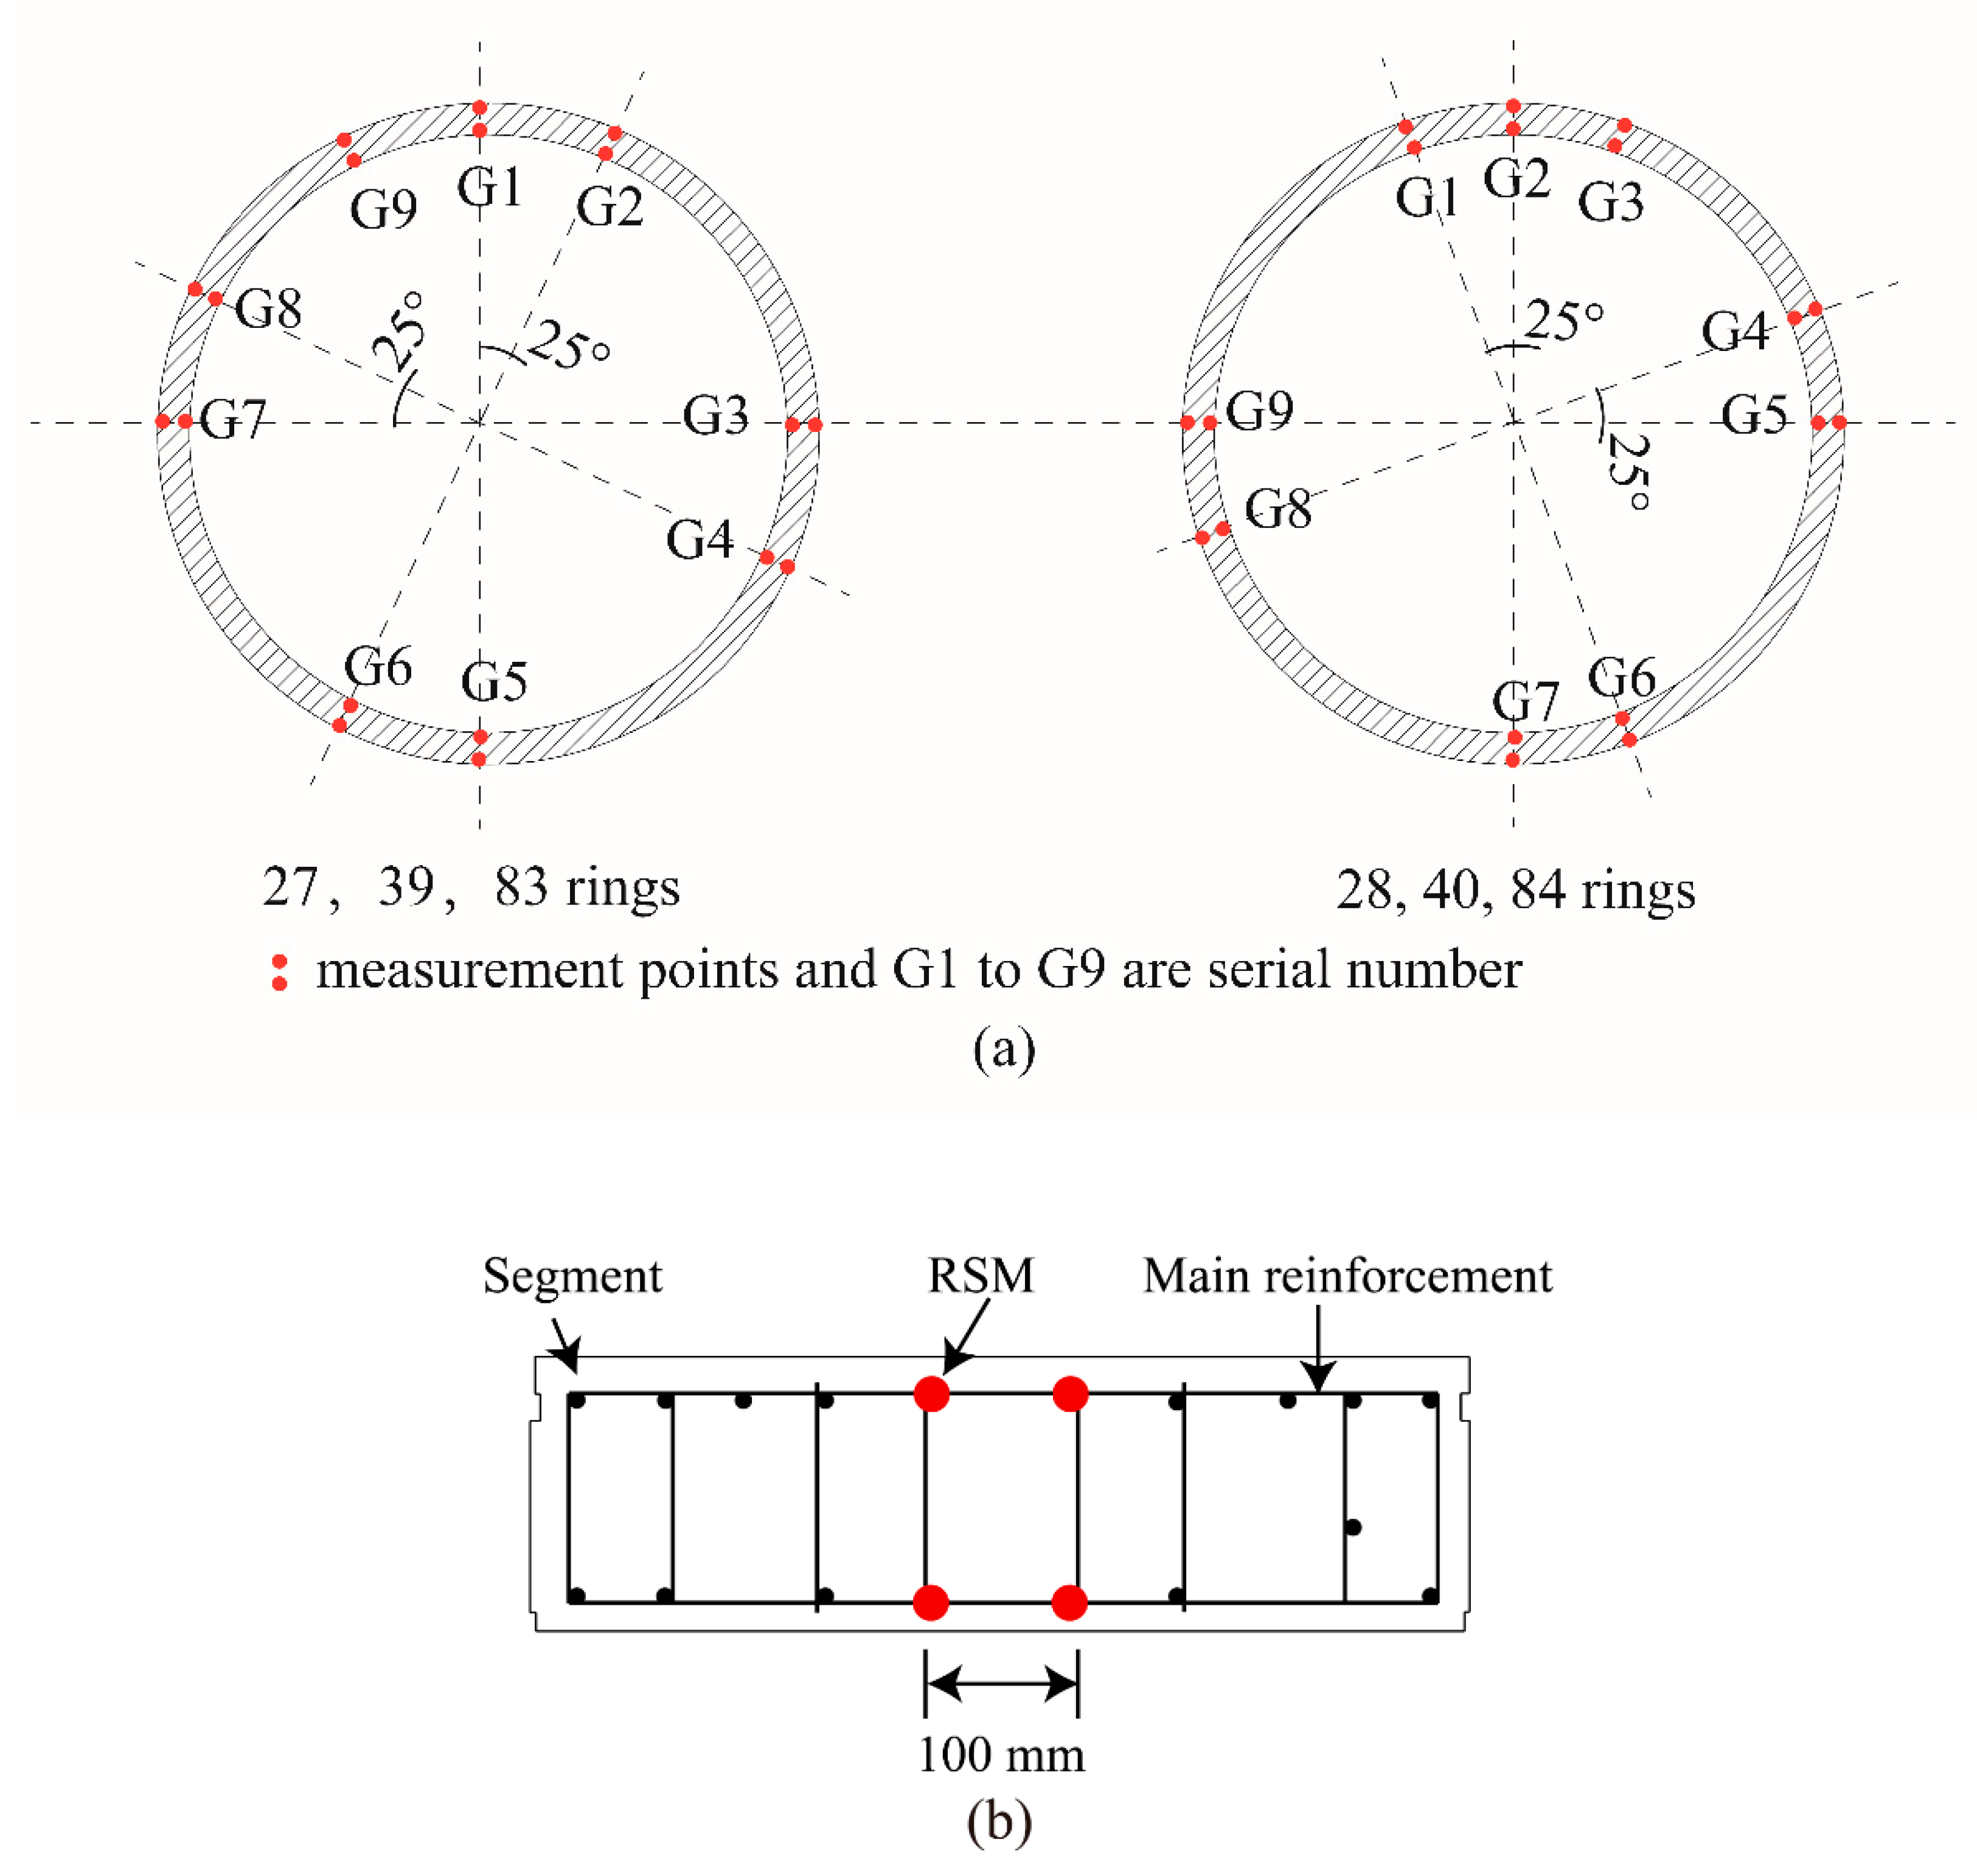
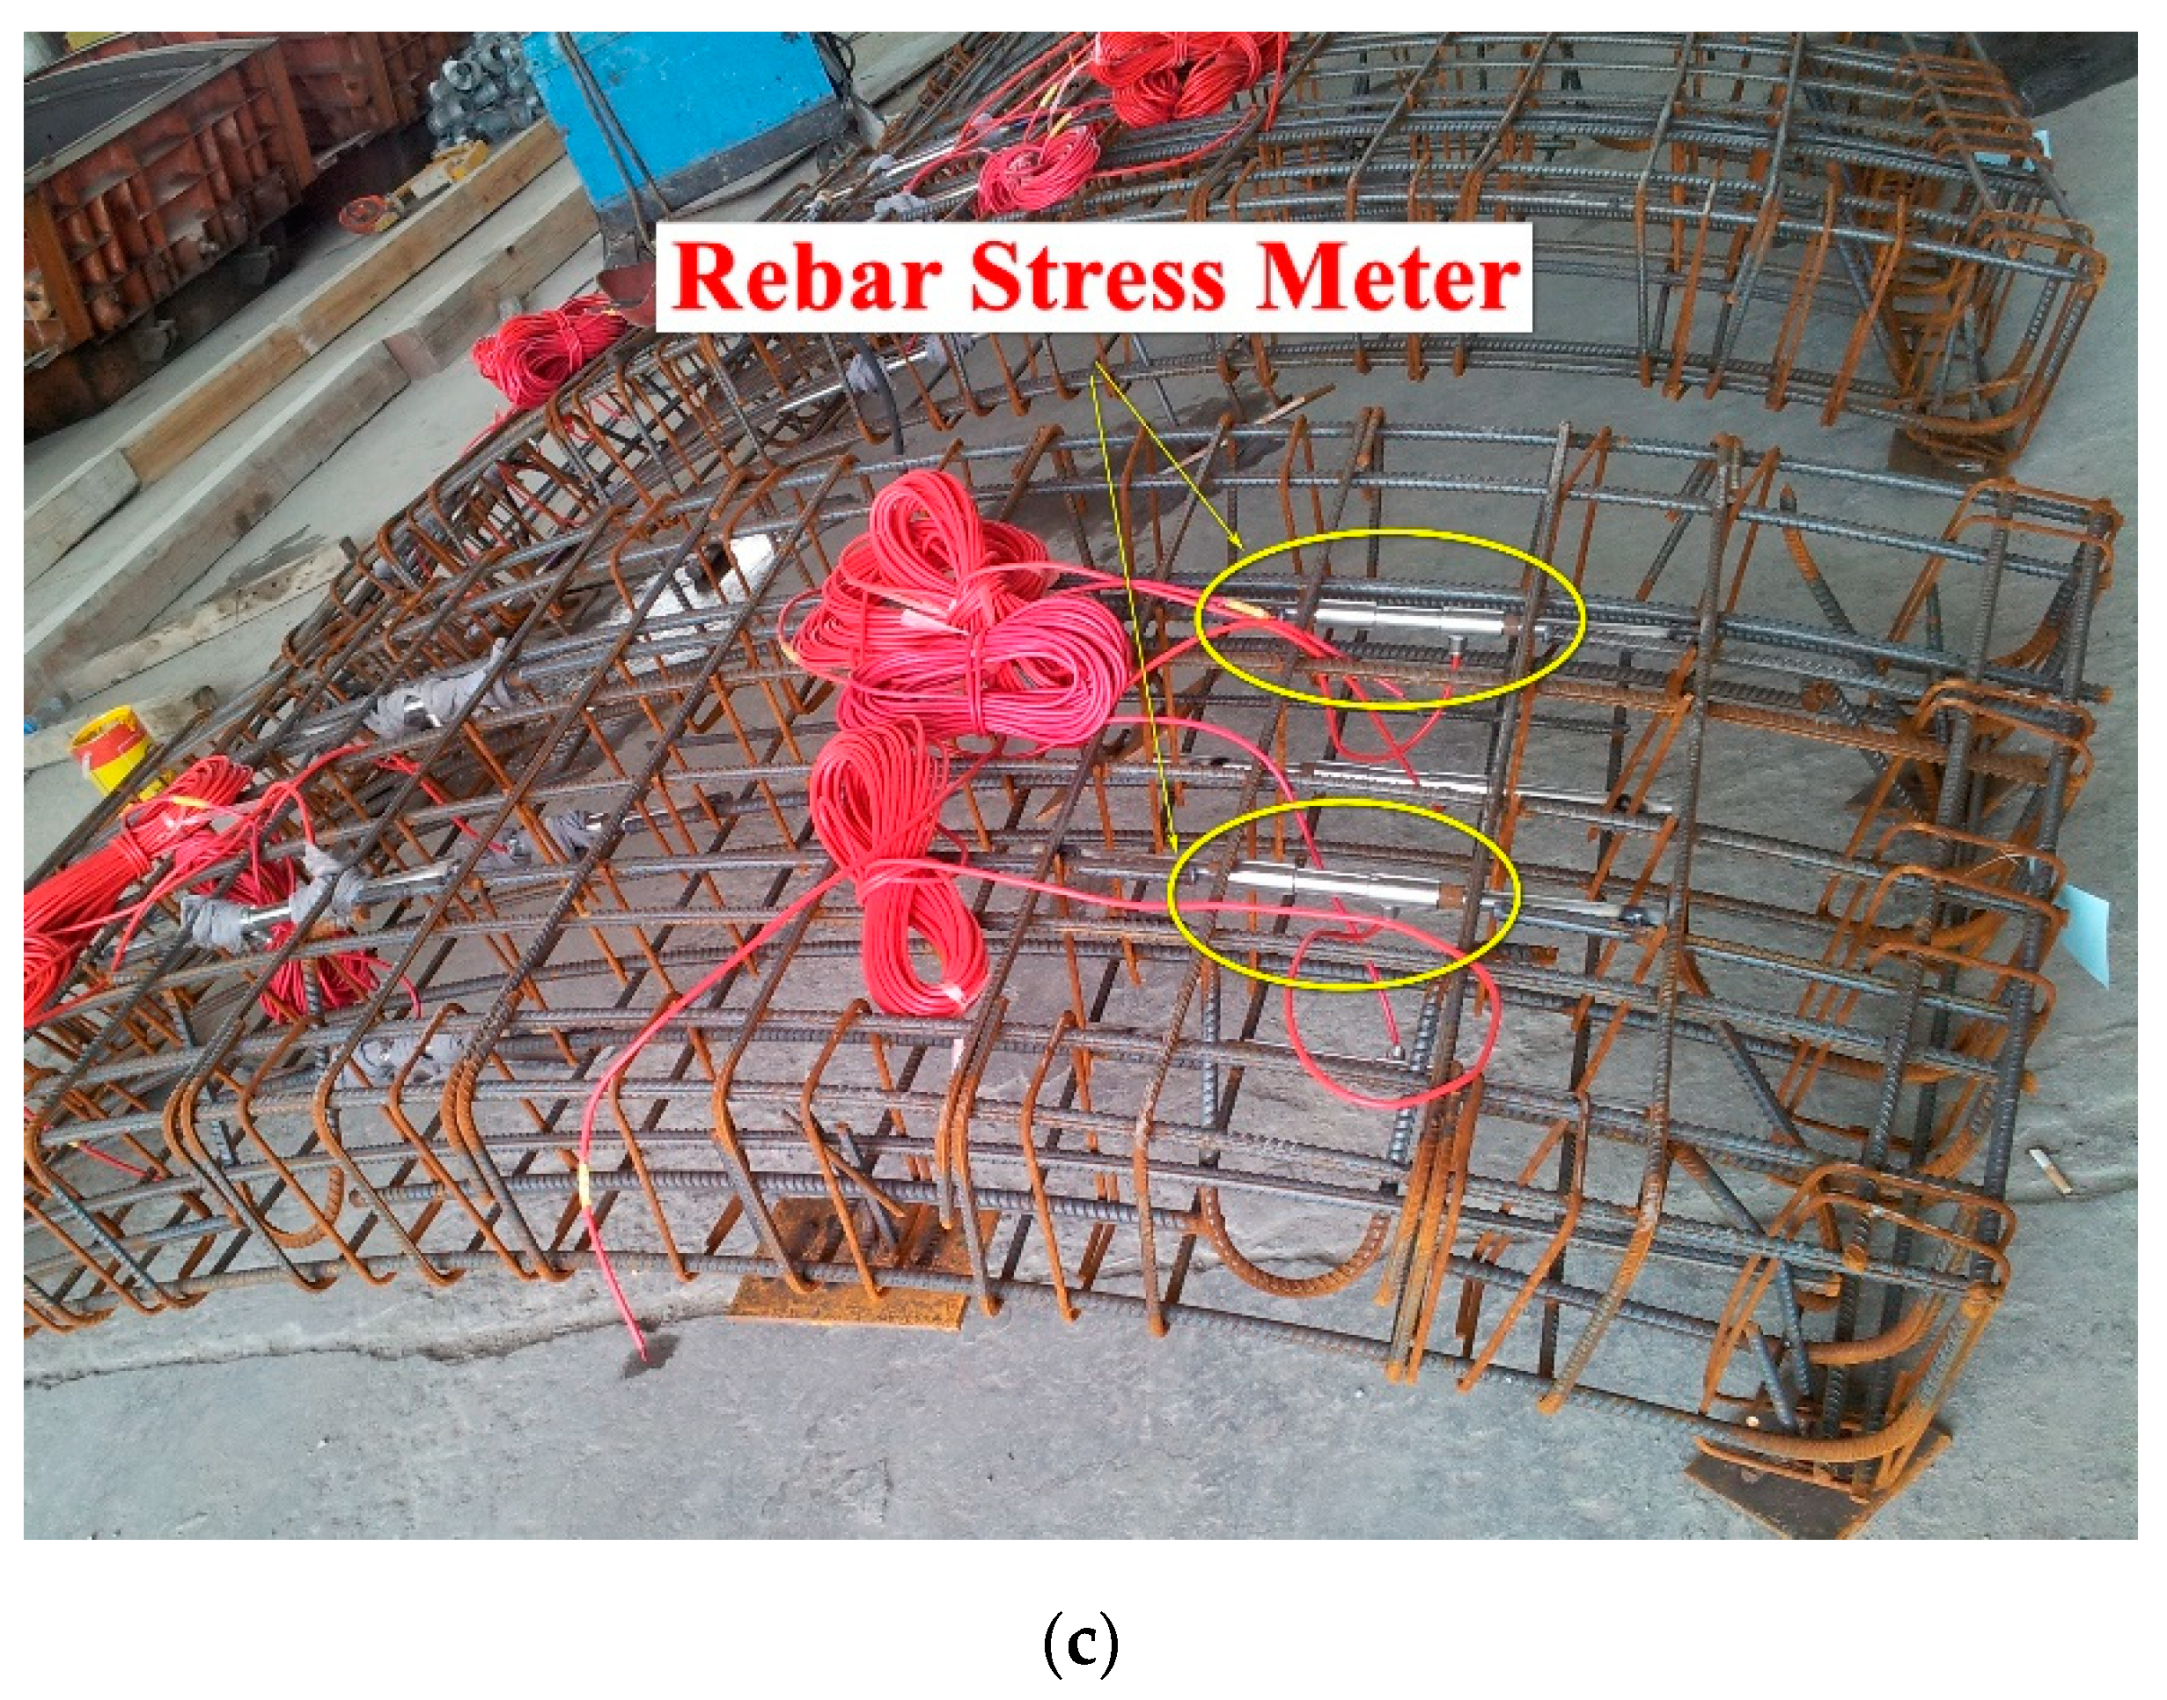
2.3. On-Site Monitoring of Segment Internal Force

In tunneling practice, grouting pressure, as well as soil surcharge, has significant influence on segment stability [40,41]. During the URUP tunneling process in negative and shallow overburden, the internal force of the lining segment is non-uniformly distributed and subjected to load variation. Therefore, a comprehensive field monitoring program was performed on the segments to record the in-situ internal force of the URUP tunnel lining.
Multiple rebar stress meters (RSMs) are used for measuring the stress variation of segment reinforcing bars, as sketched in Figure 4. For each measuring section, nine measuring points are employed (G1–G9) with each point consisting of four pre-welded RSMs on the rebars (as shown in Figure 4c). The positions of G1–G9 at the 27th, 39th, 83th rings, 28th, 40th rings, and 84th ring (west line) are shown in Figure 4.
The rebar stress in the segment can be expressed in Equation (1).
σ s = σ f σ 0
where σ 0 is the initial stress, σ f is the monitored stress, σ s is the rebar stress of the segment after being assembled.

3. FEA Model and Validation

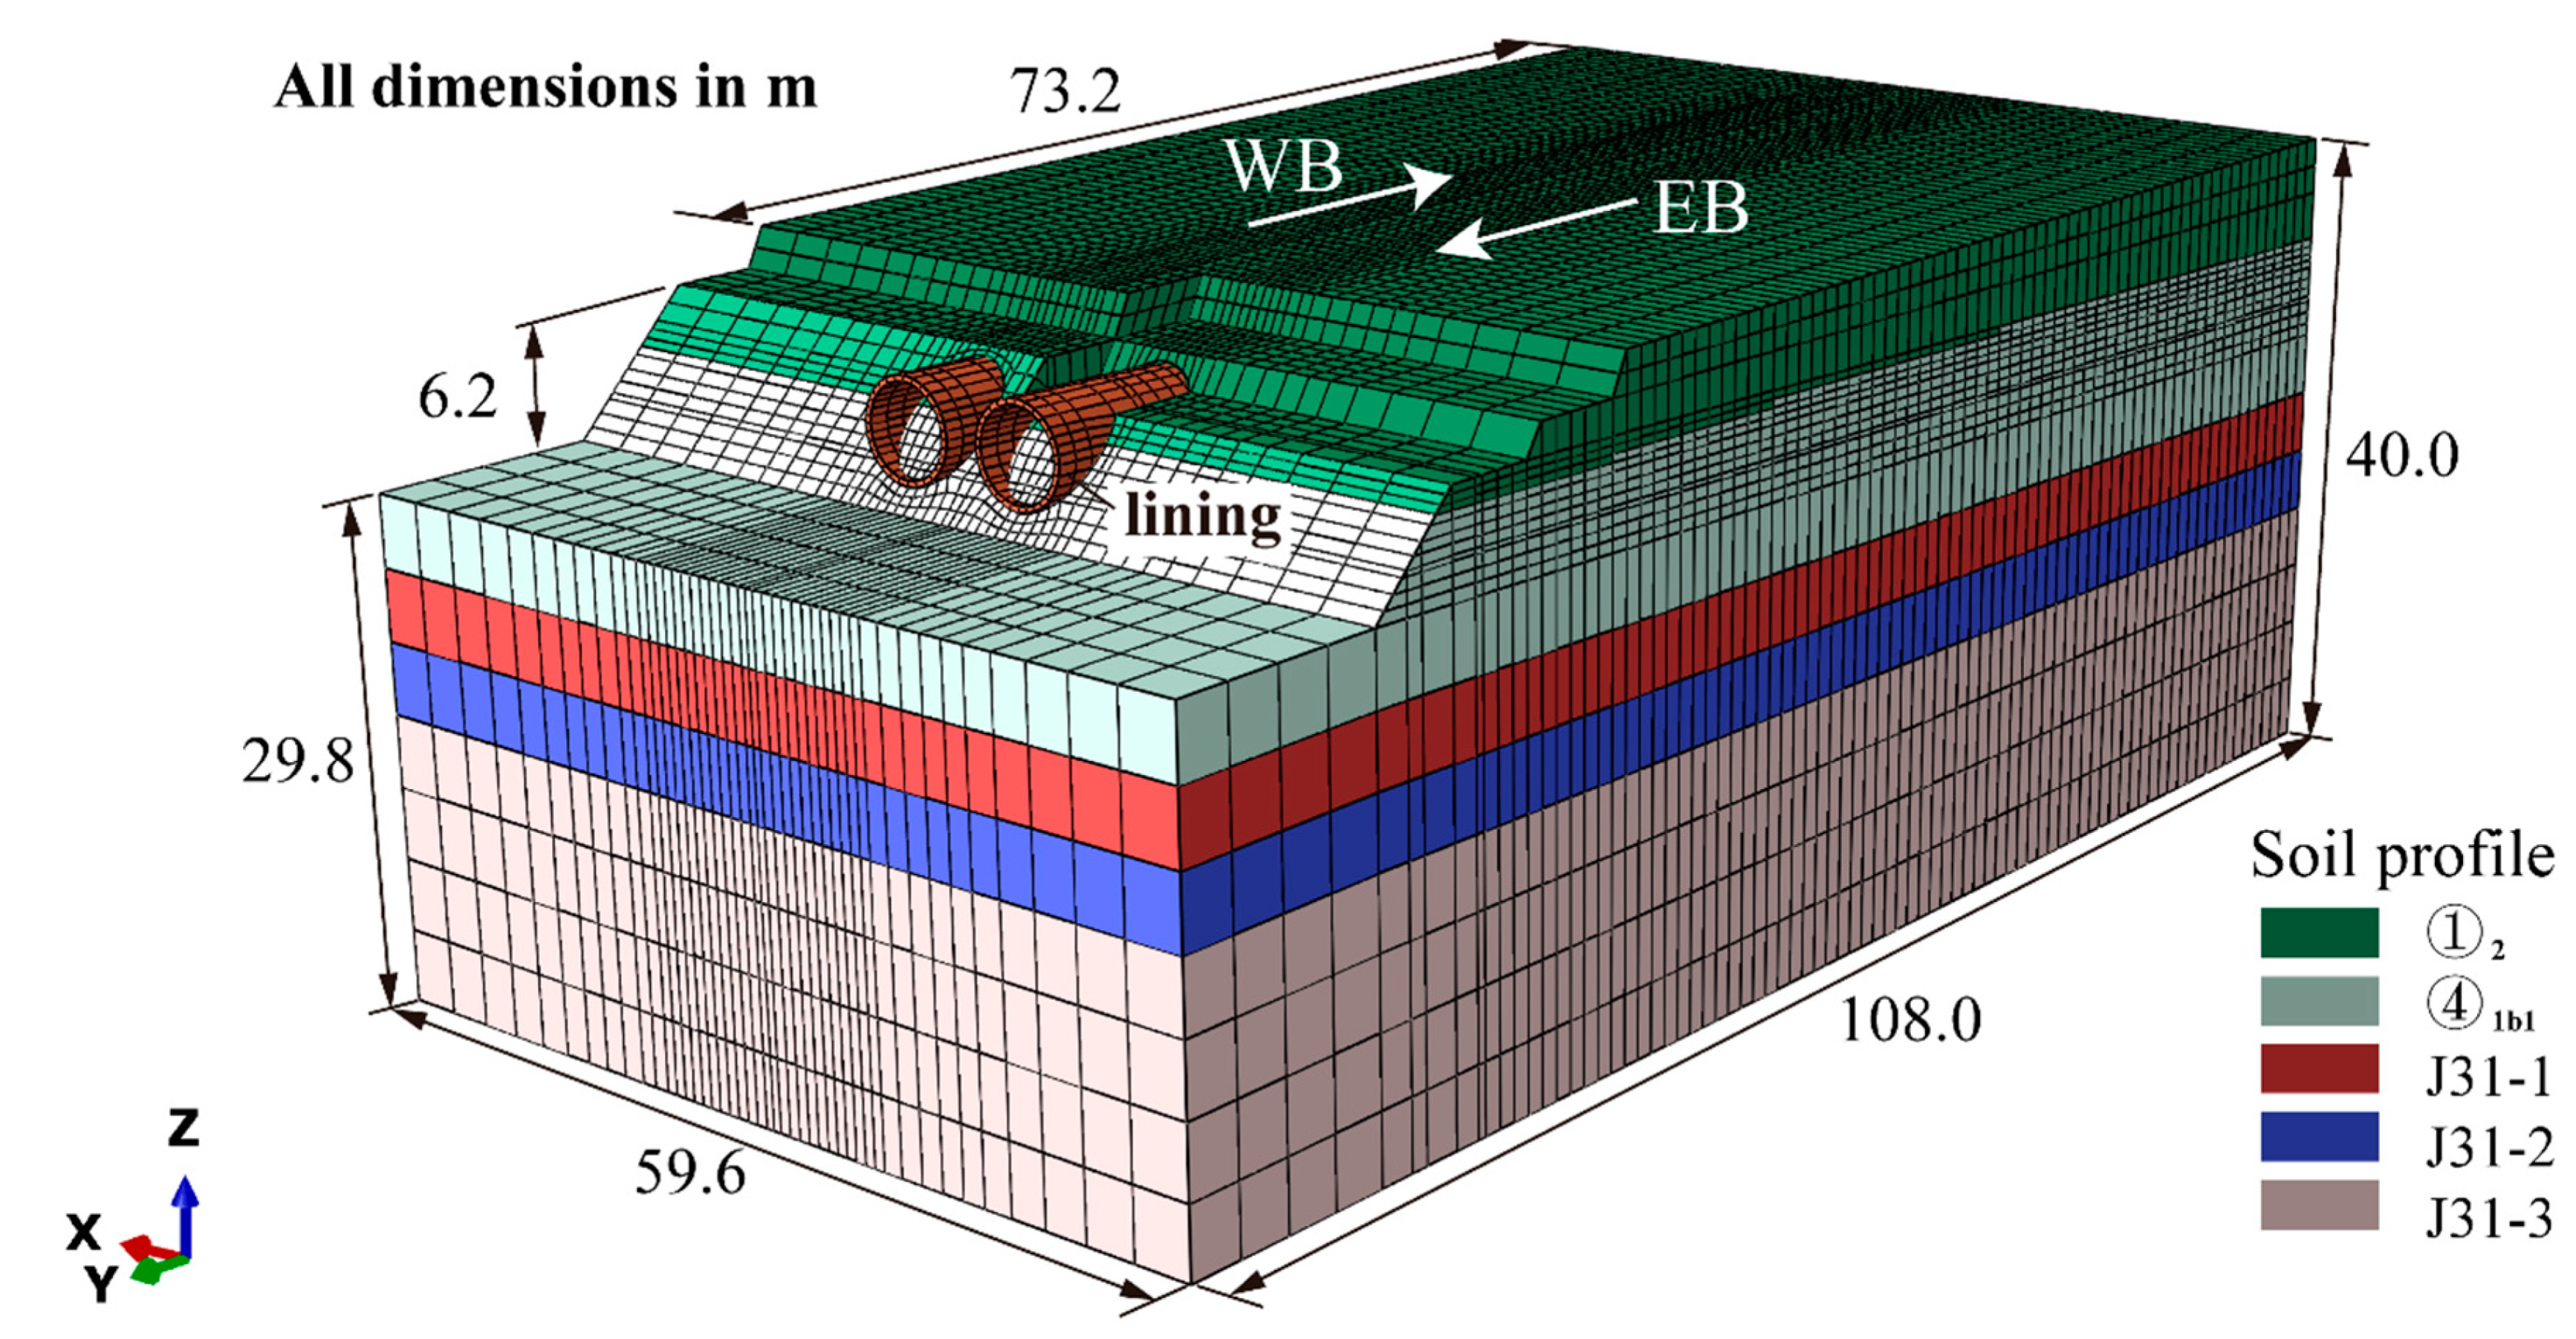
3.1. Overview of Finite Element Model

The same FEA model is adopted in this paper as in a previous review [34]. The FEA model is generated to explore the variation of soil responses and lining internal forces during the twin-tunneling process using the URUP method. The commercial nonlinear FEA code ABAQUS is employed in the numerical simulation. The dimension of the FEA model (see Figure 5) is 108.0 (length) × 59.6 (width) × 40.0 m (depth). A total number of 100,680 nodes and 84,869 elements are employed in the FEA. The solid element type of C3D8P (8-node trilinear displacement and pore pressure) and C3D6P (6-node linear displacement and pore pressure) are employed for modeling the soils, considering pore-water-pressure variation, which is an essential factor influencing the soil consolidation process [42]. For grout layer and tunnel lining, a total number of 4864 and 4593 C3D8I (8-node linear brick, incompatible modes) elements are adopted in the FEA, respectively. Displacement boundaries are configured with the model fixed vertically at the bottom and horizontally at the four vertical boundaries. The soil, grout, and lining are tied together during the FEA. The “element death” technique is employed to simulate the excavation process.

3.2. Material Properties and Modelling Procedure

The Mohr–Coulomb model is widely used in numerical studies as a relatively simple constitutive model, the same applies when the internal friction angle (φ) is less than 22°, but relatively speaking the DP model converges better [43]. In order to reduce the difficulty of computation convergence for soils with the internal friction angle φ   <   22 ° , Drucker–Prager (D–P) criterion can be used for modeling the plasticity behavior instead of the Mohr–Coulomb assumption. Herein, the D–P criterion together with the linear elasticity assumption is employed for the soils in the FEA model. The D–P criterion is summarized as follows.
The yield surface of D–P model can be expressed as Equations (2)–(4):
p = 1 3 σ : I
q = 3 2 S : S
r 3 = 9 2 S : S : S
where p is the average principal stress, q is equivalent shear stress, r is the third stress tensor invariant, and S is the deviator stress tensor as:
S = σ + p I
The linear D–P criterion can be expressed as Equations (6) and (7).
F = t ptan β d = 0
t = 1 2 q [ 1 + 1 K ( 1 1 K ) ( r q ) 3 ]
where β is the inclination of the yield surface in the p t stress space, d is the intercept of the t axis and the yield surface in the p t stress space. β and k can be converted and calculated according to Equations (8) and (9).
tan β = 6 sin φ 3 sin φ
d = 2 c cos φ 1 sin φ
K = 3 sin φ 3 + sin φ
Considering isotropic elastic damage, isotropic tensile, and compressive plasticity theory, the concrete damage plasticity (CDP) model is a continuous, plastic-based concrete constitutive model, which can describe the non-linear damage behavior of concrete [44]. The CDP model assumes that, when the concrete under tension or compression, the strain contains isotropic elastic damage ( ε t e l , ε c e l ) and plastic damage ( ε ˜ t p l , ε ˜ c p l ). Comparing with elastic materials, strain can also be regarded as the elastic strain ( ε 0 t e l , ε 0 c e l ) with the same E 0 plus inelastic strain ( ε ˜ t c k , ε ˜ c i n ), where d t and d c are both damage factors.
The concrete strain in tension can be obtained as:
σ t = ( 1 d t ) E 0 ( ε t ε ˜ t p l )
σ t = E 0 ( ε t ε ˜ t c k )
Thereafter, the damage factor d t can be expressed as:
d t = 1 σ t E 0 1 σ t E 0 1 + ε ˜ t c k ( 1 1 b t )
Similarly, the expression of the damage factor d c can be obtained by Equation (13).
d c = 1 σ c E 0 1 σ c E 0 1 + ε ˜ c i n ( 1 1 b c )
According to previous research [45], the recommended values of b t and b c are 0.1 and 0.7, respectively. The CDP parameters of C55 (i.e., 55 MPa cube strength) concrete is employed in this model. Parameters of each component of this model are shown in Table 1.

3.3. Modelling Procedure

The TBM excavation process is mimicked by the “element death” technique [46] with the detailed procedure as follows:
(1).
Firstly, the initial geostatic stress of the soil was generated with the initial displacement of ground less than 10−6 m.
(2).
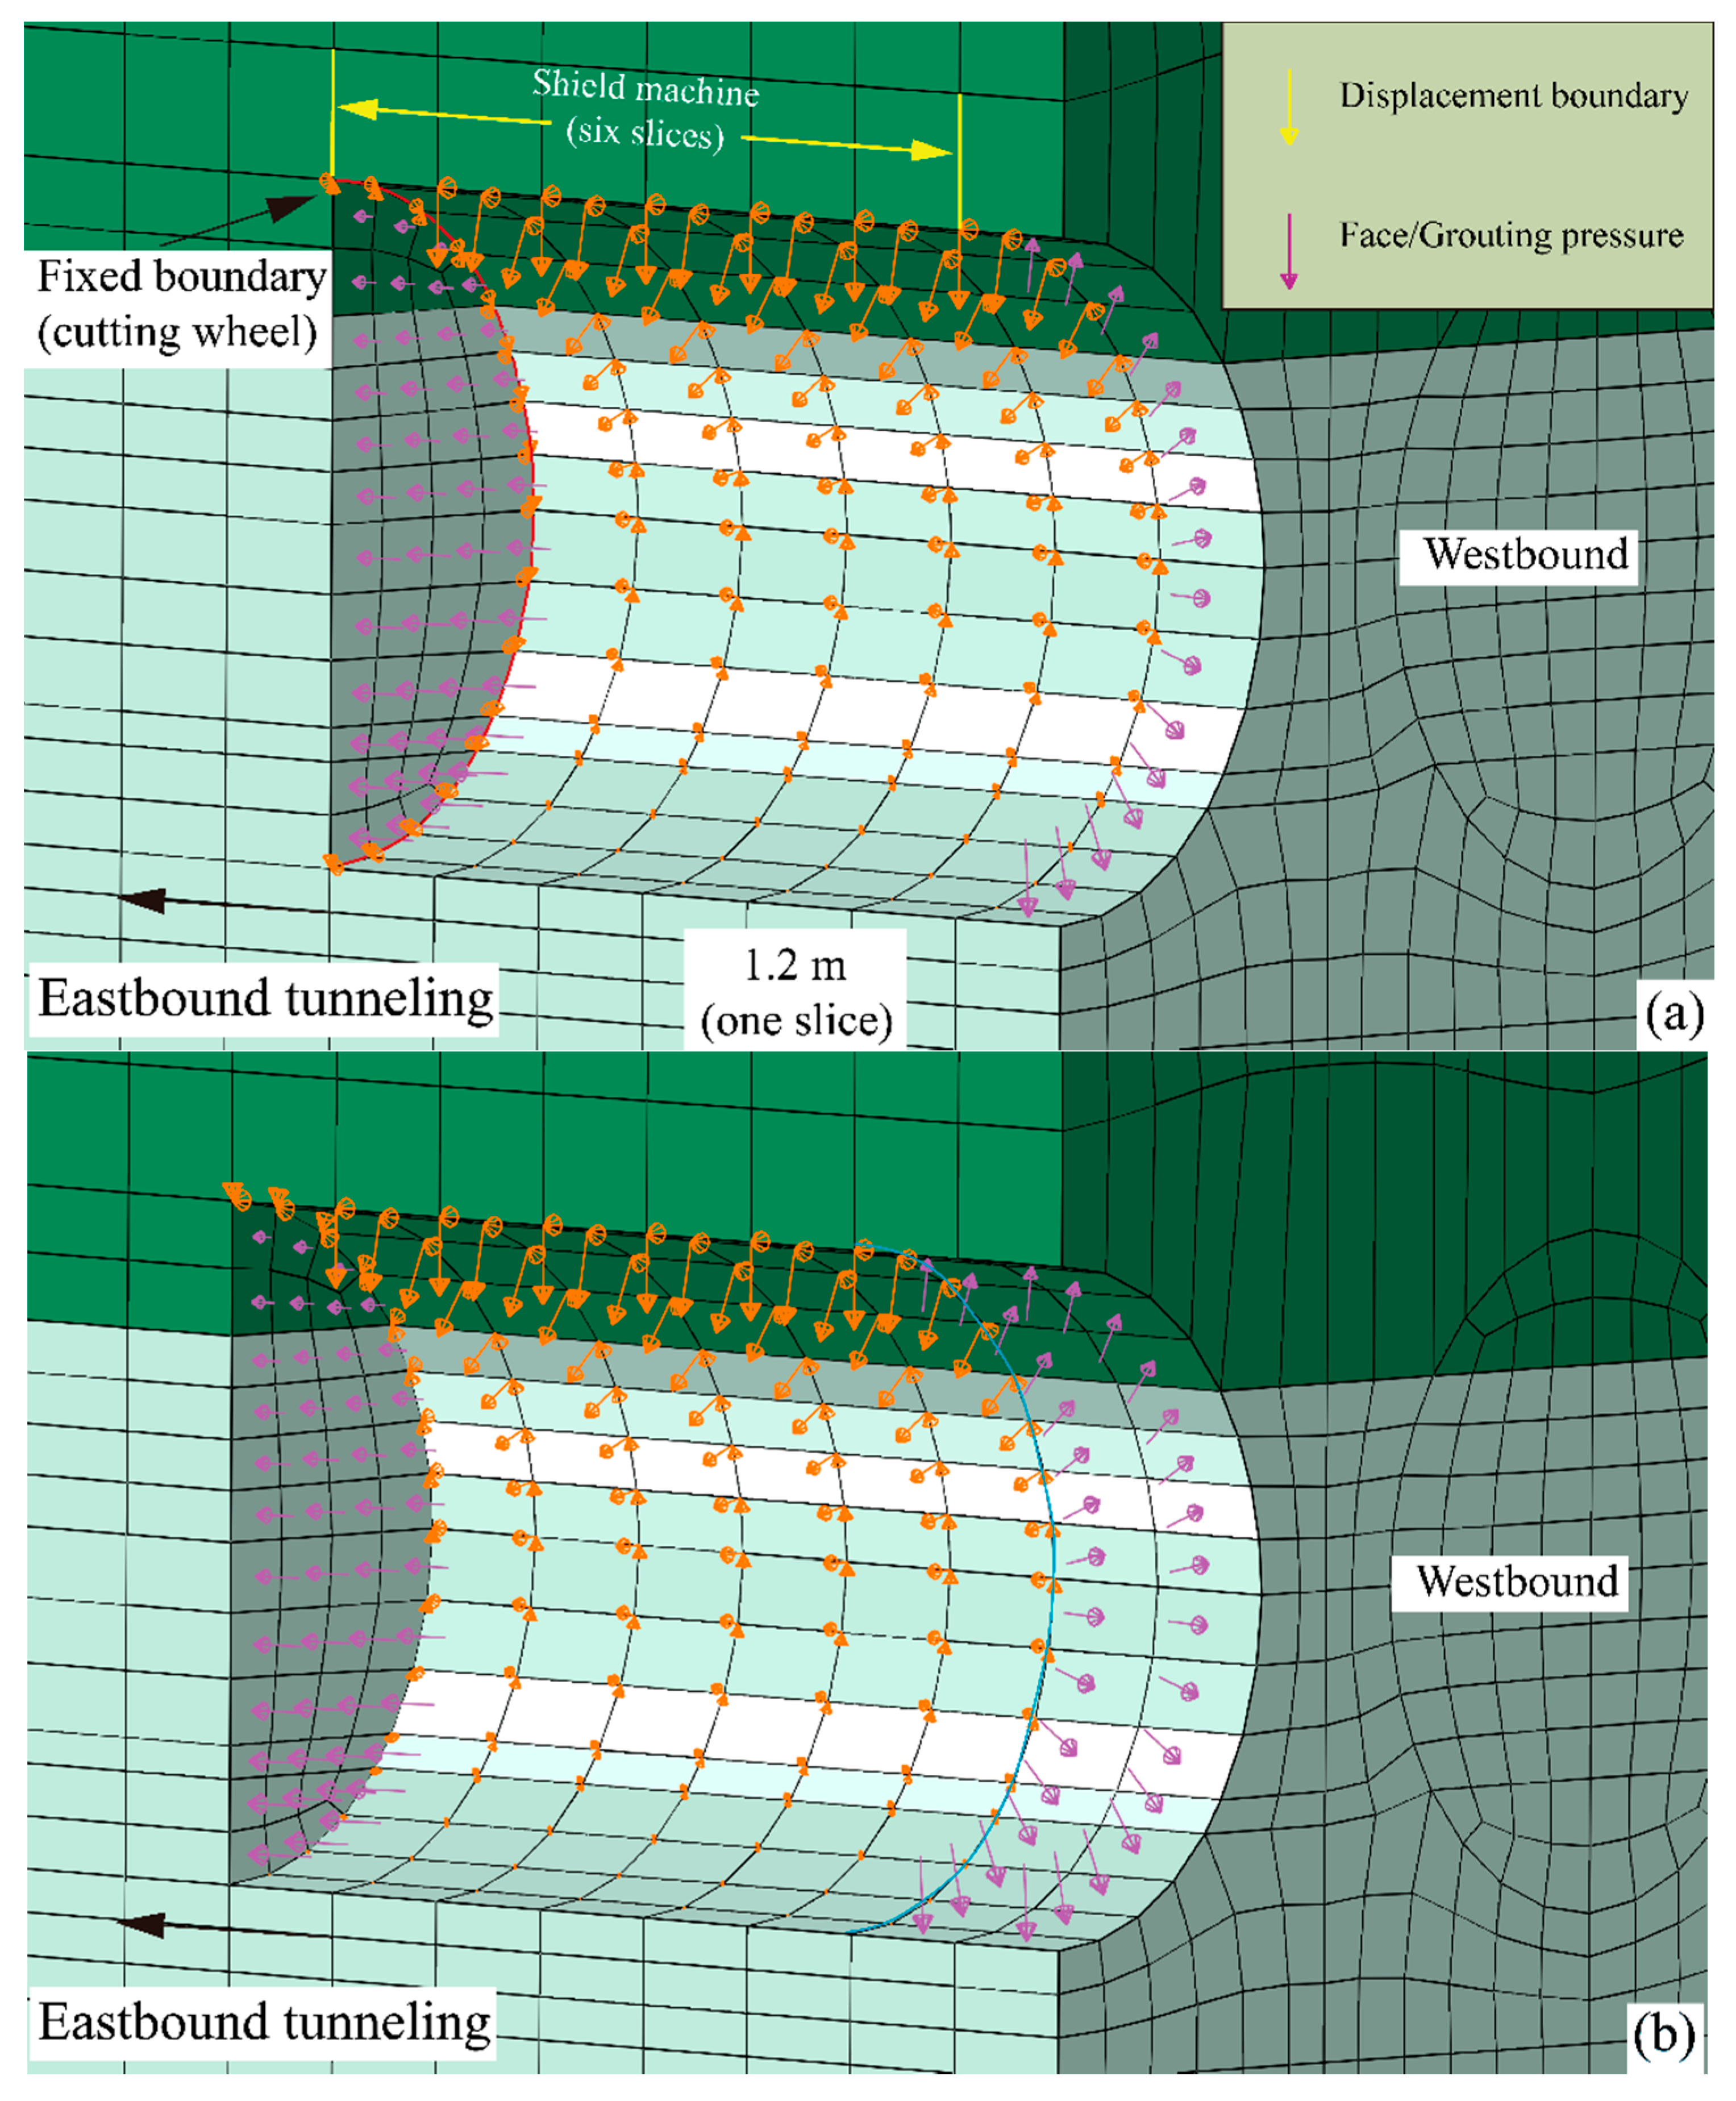
Secondly, the soil elements of the first seven slices (the width of each slice was 1.2 m) at EB were removed to simulate the space occupied by the TBM after it was launched. The non-uniformly distributed displacement boundary (as demonstrated by the yellow arrows in Figure 6a) was applied at the soil nodes around the excavated soils to simulated the volume loss caused by the TBM. This assumed tunnel convergence is characterized by a parameter δ , which is the tunnel contraction around the excavation region. For detailed description of this non-uniformly distributed displacement boundary, please refer to the previous research of the URUP project [34]. The contraction parameter δ can be expressed as:
δ = δ m a x 2 ( R R 0 ) [ R 2 2 R ( R R 0 ) c o s ( θ + π / 2 ) + ( R R 0 ) 2 R 0 ]    
where δ m a x is the contraction at the tunnel crown. R and R 0 are the radius of the cutter head and shield body, respectively. θ is the angle of the polar coordinate system with the origin located at the central of the excavation region.
At the same time, the supporting pressure at the tunnel face and the grouting pressure at the TBM tail (as shown in purple arrows in Figure 6c) were activated.
(3).
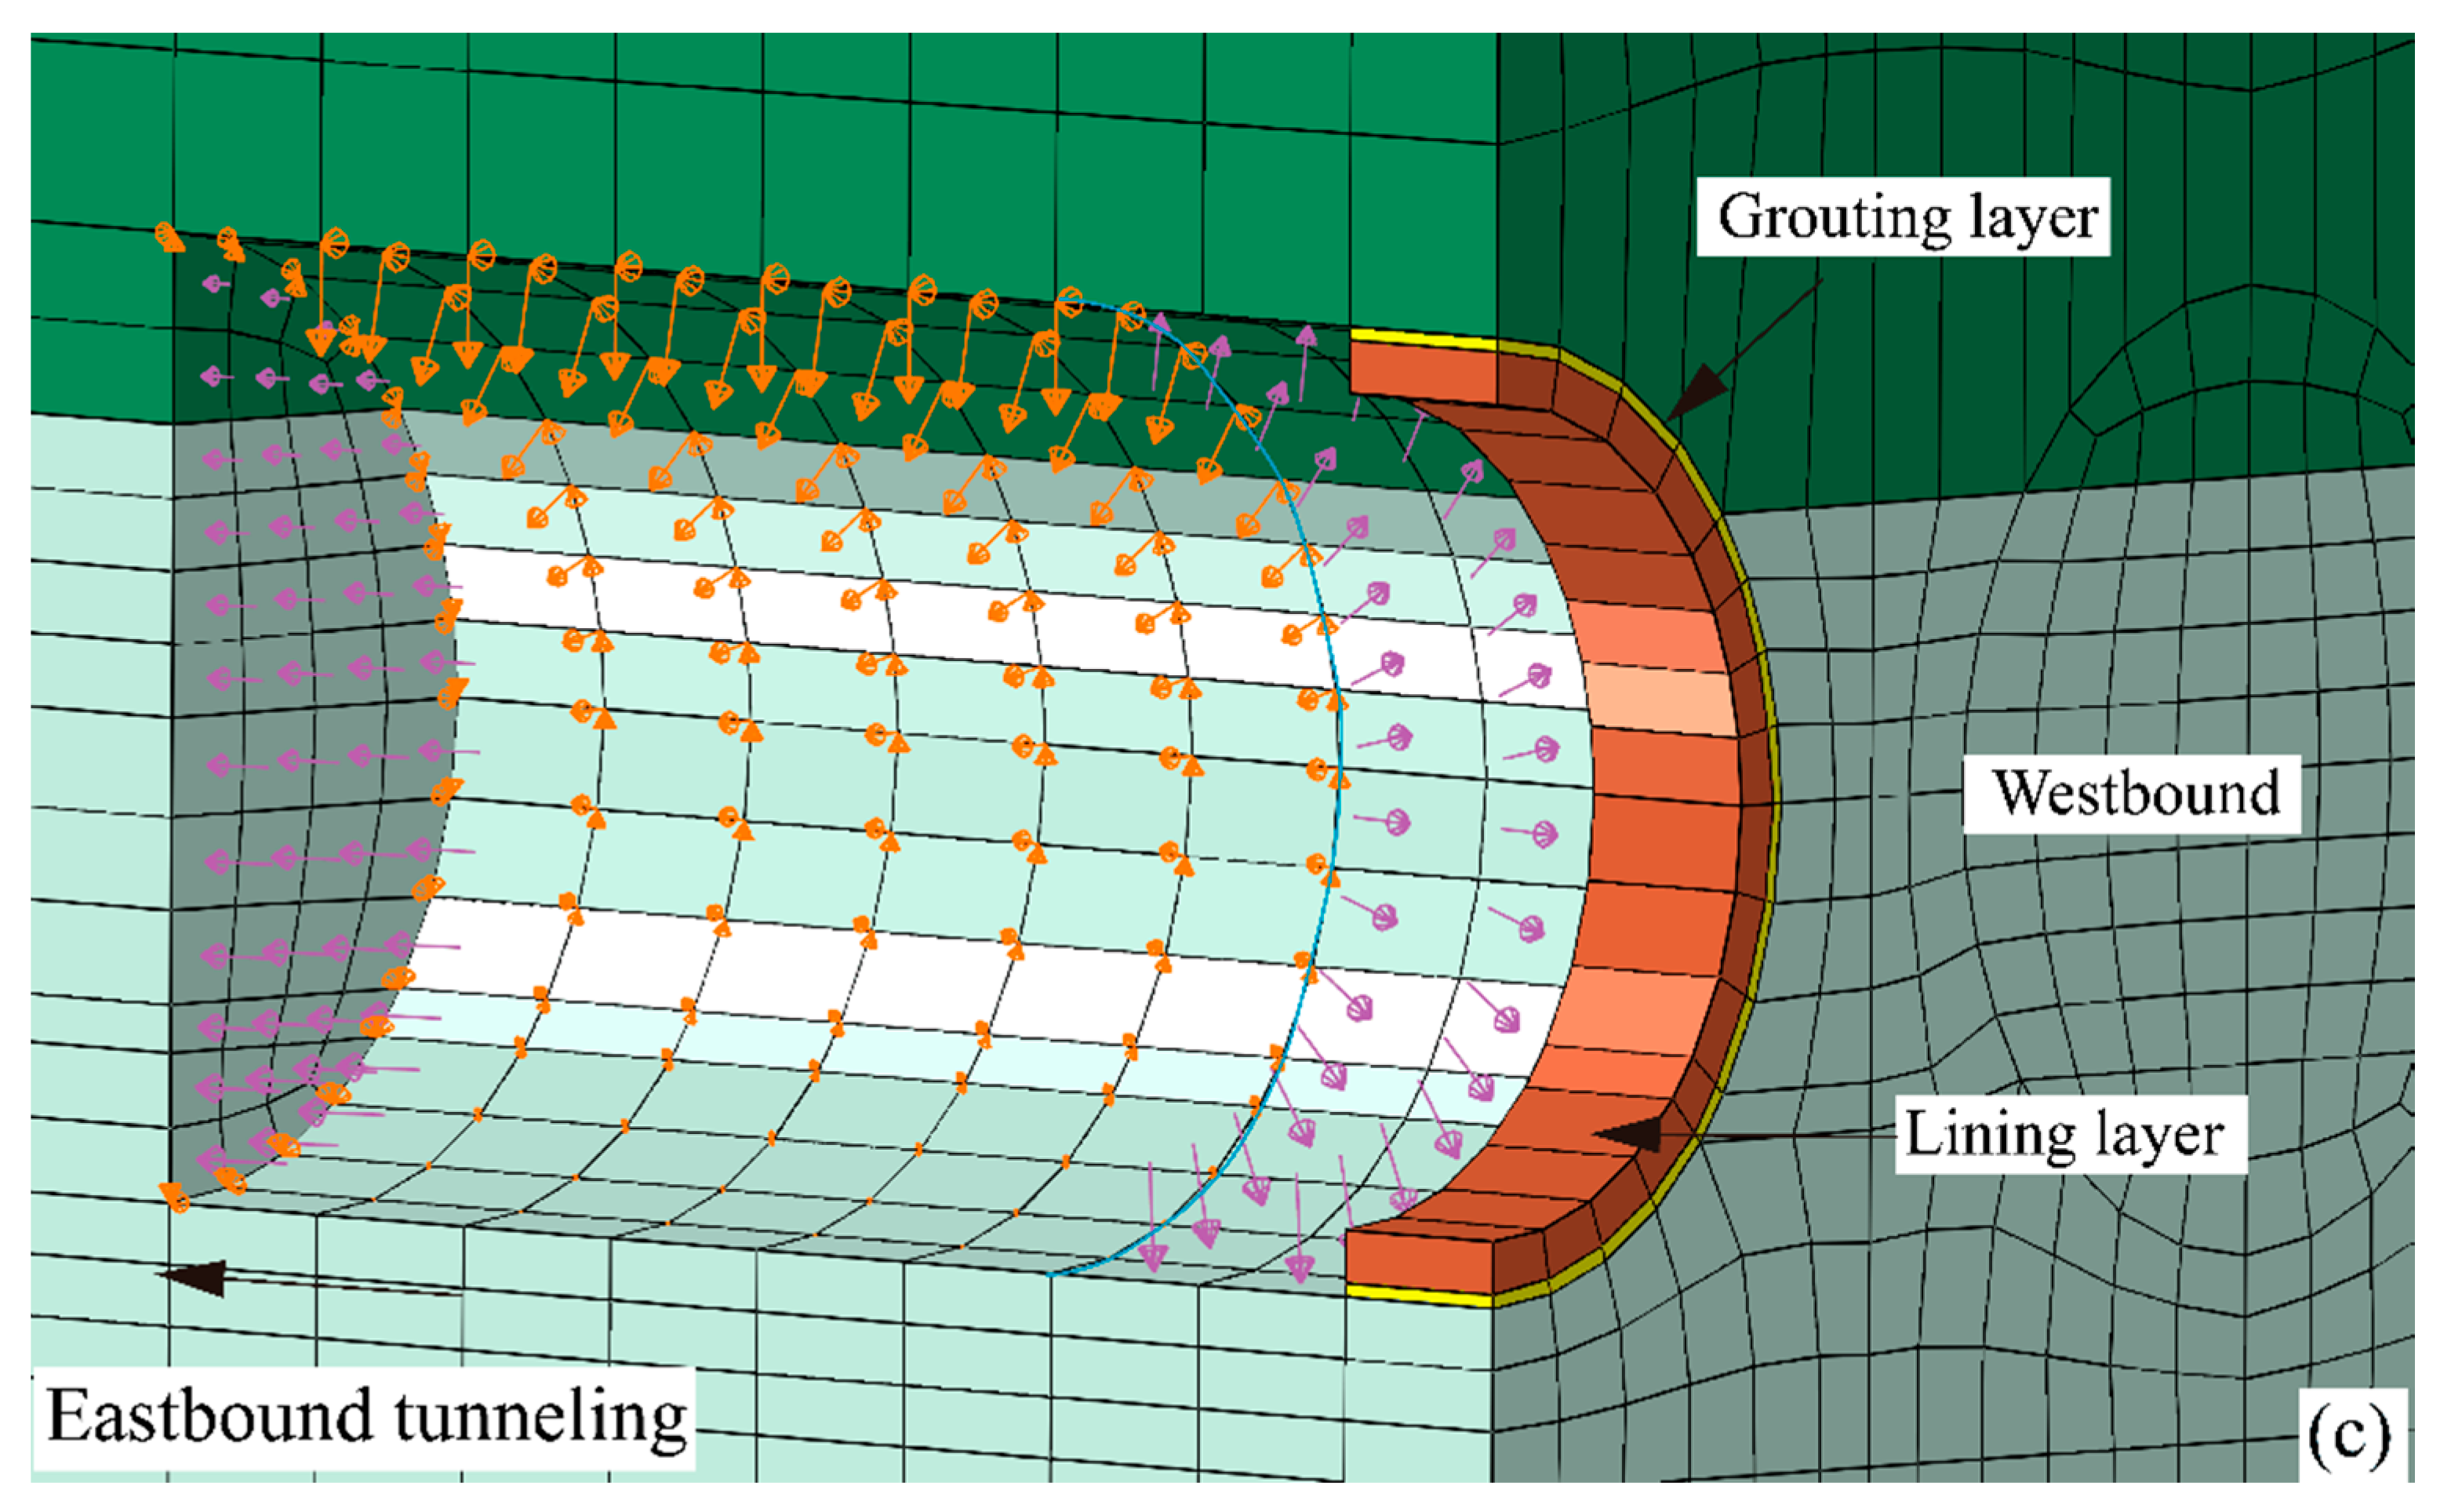
Thereafter, one slice soil element in the model was deactivated with the corresponding displacement boundary activated and deactivated, as illustrated in Figure 6b; the grouting pressure was applied at adjacent soils with two rings behind the TBM tail, and corresponding lining and grout layer were activated simultaneously (as illustrated in Figure 6c).

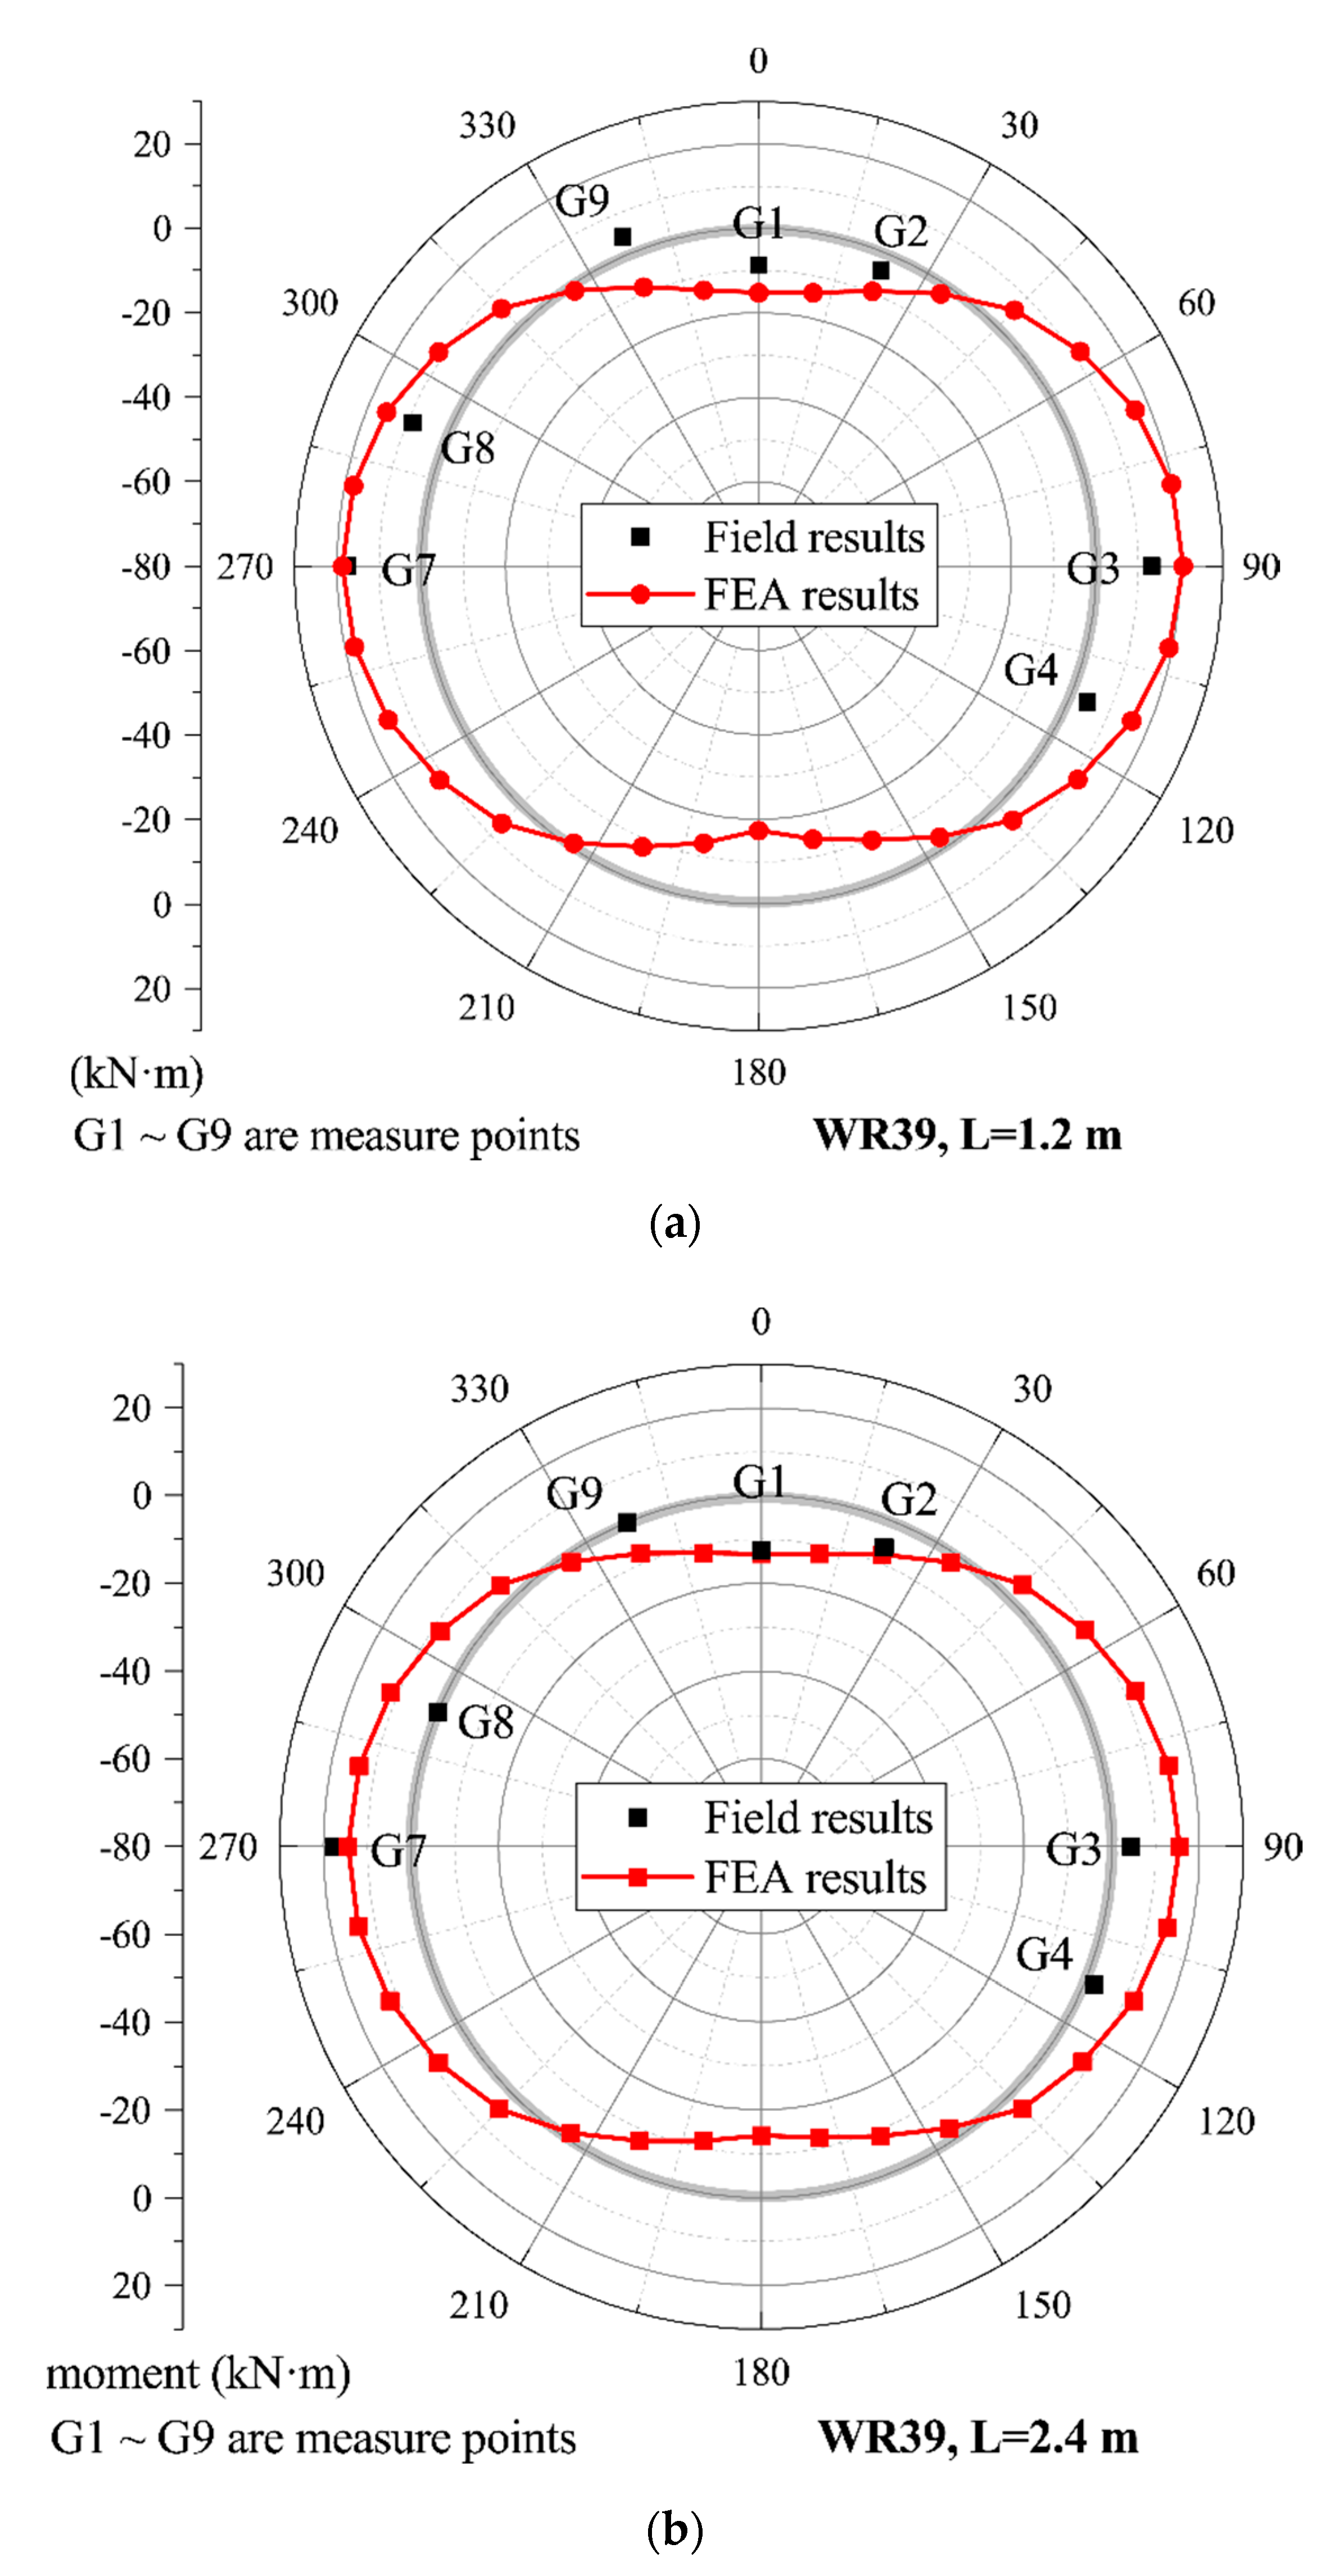
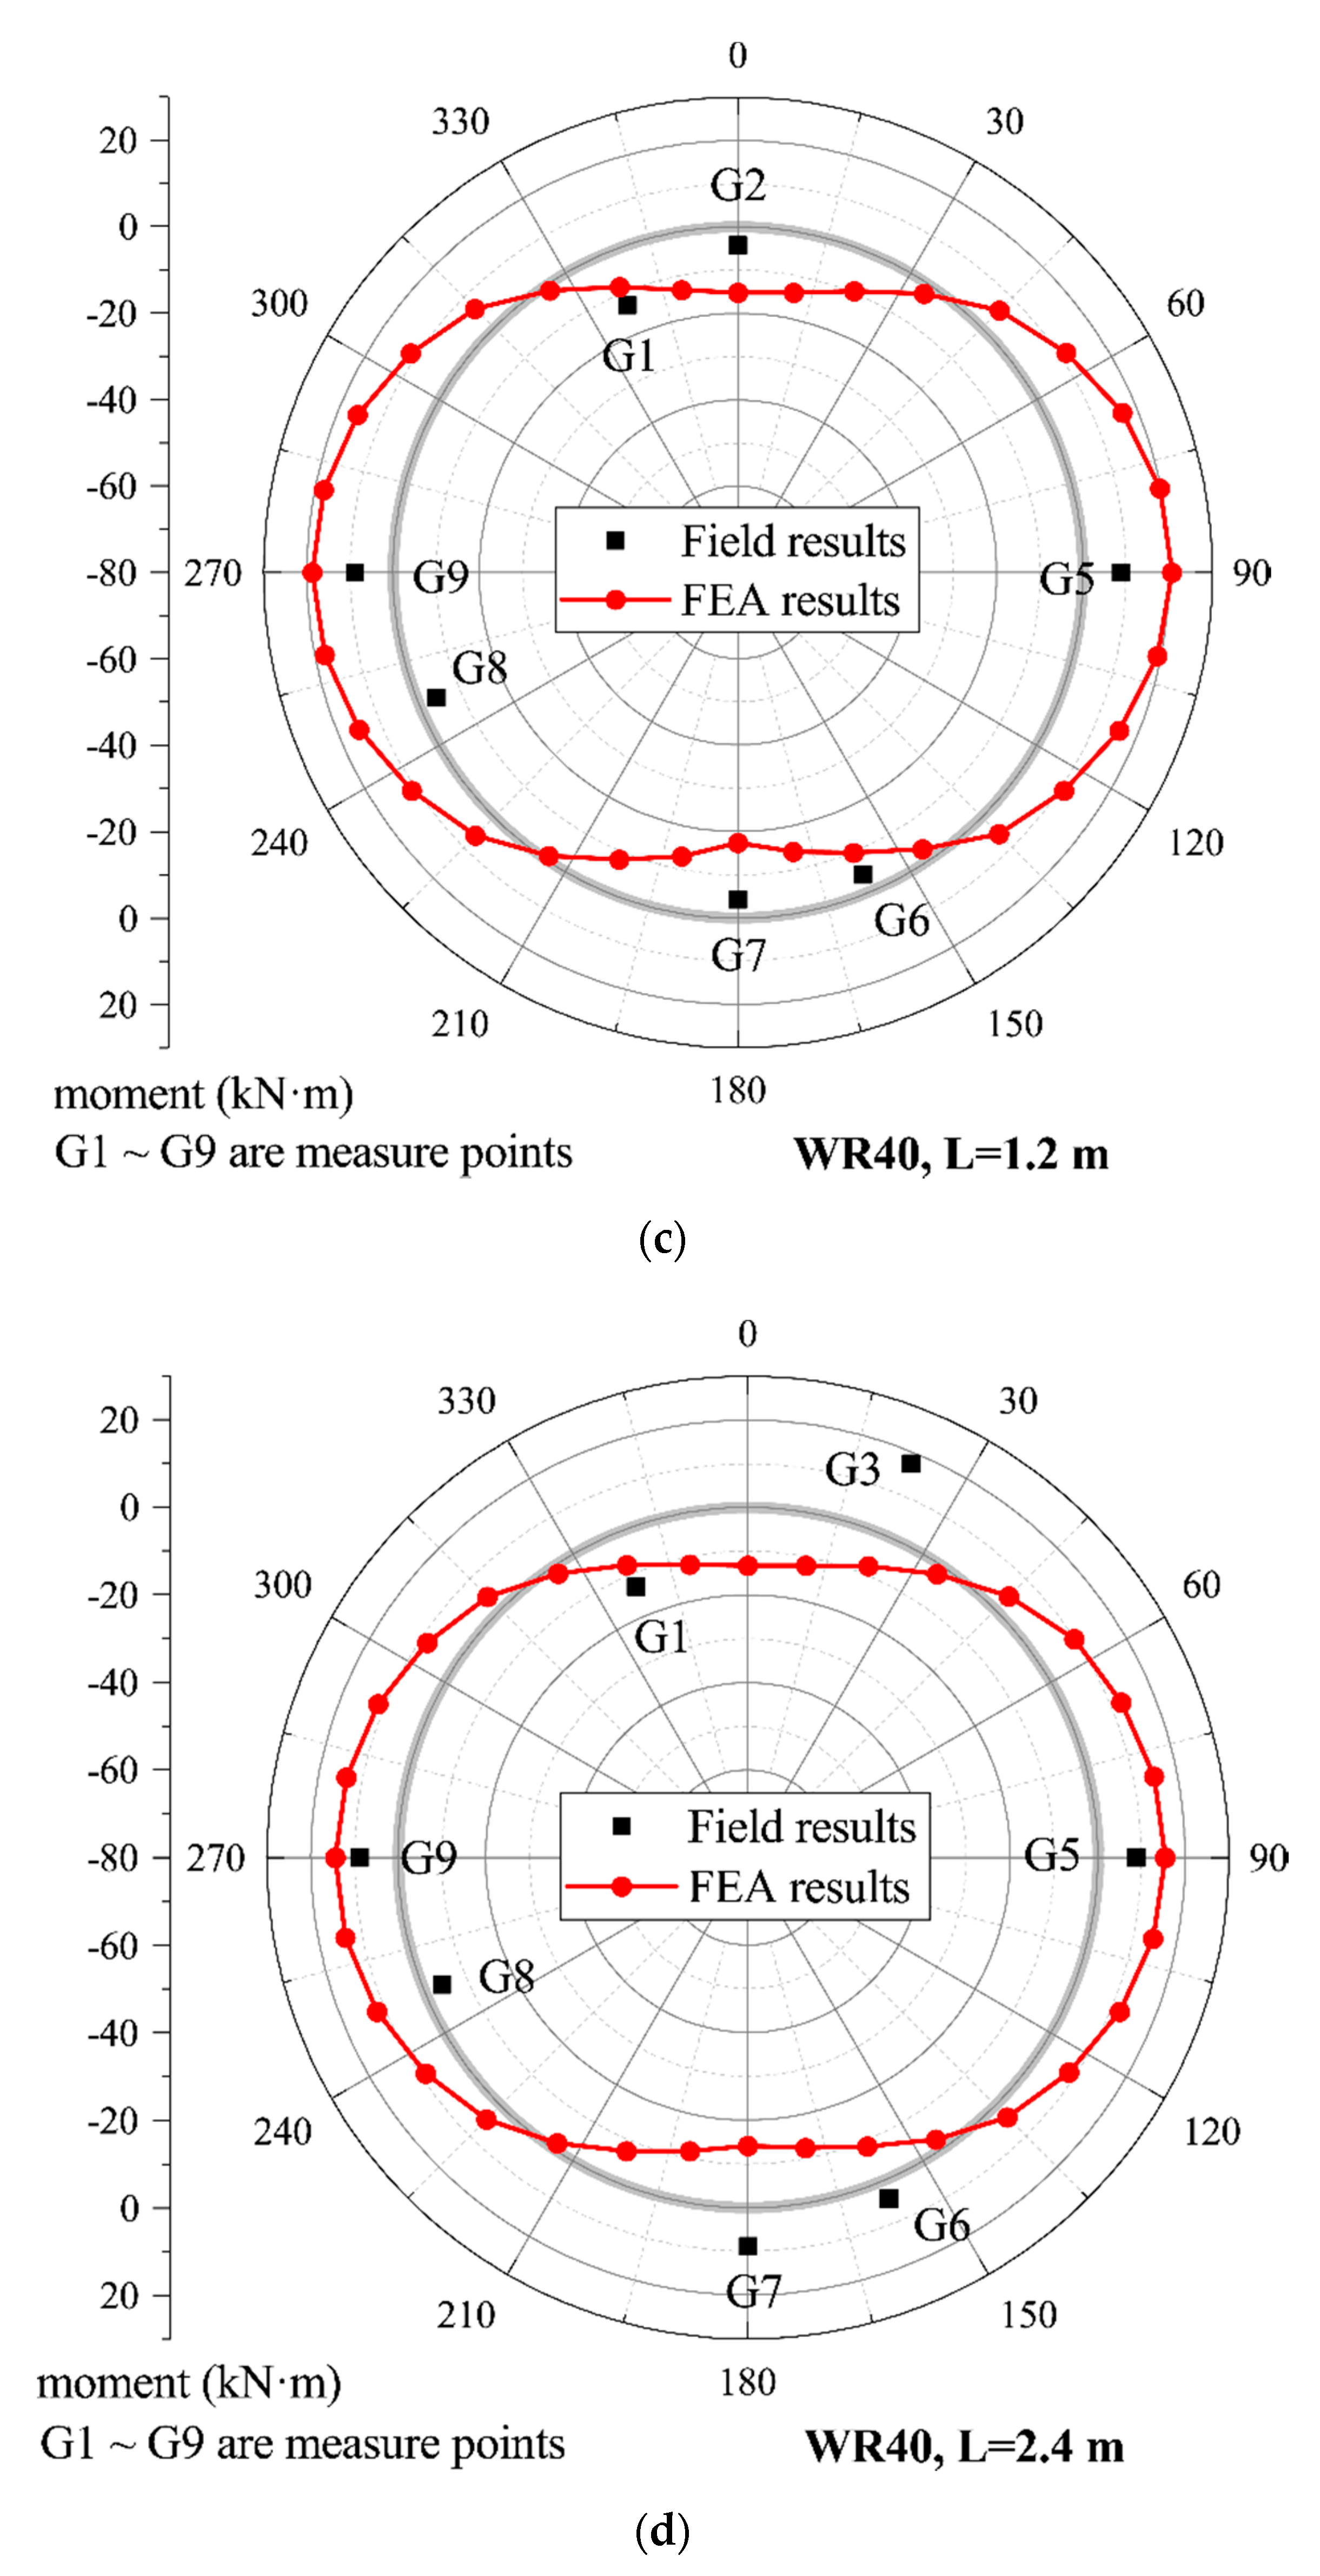
3.4. Model Validation

The lining stress could be affected significantly by adjacent TBM-driven processes. In order to verify the FEA model in which the lining stress variation is a major concern, the computational results are compared with the field monitoring data. The on-site bending moment can be calculated by rebar stress which has been recorded by the field monitoring program in this study.
The stress variation of rebar has been expressed by Equation (1), and the rebar elastic modulus is 2 × 10⁵ MPa. Thus, rebar strain ε s can be obtained via Equation (14):
ε s = σ s E s
The concrete stress can be expressed as:
σ c = E c E s × σ s
Assuming that each lining can be regarded as a pure bending beam and the concrete strain is consistent with that of rebar, the bending moment of each lining can be obtained as follows.
M = E c · σ s · I z E s · y
σ c = M · y I z
I z = b · h 3 12
where M , y , I z . are the section bending moment, maximum distance from lining edge to neutral axis, and the moment of inertia, respectively.
The FEA model parameters are shown in Table 2 [34].
Available monitoring results and FEA modelling results of WR39 and WR40 (see Figure 2) are shown in Figure 7 in which L denotes the distance between the TBM tail and studied lining.
Figure 7 shows the comparison of the bending moment between the field monitoring and the FEA results. In Figure 7, positive and negative values indicate tension and compression stress state at the lining external surface, respectively. As shown in Figure 7a,b, the field measurement and FEA results show acceptable agreement with each other at WR39. As illustrated in Figure 7, negative and positive bending moment can be observed, respectively, at the tunnel crown/bottom and sidewall, indicating a “horizontal oval” deformation pattern of the lining during the WB tunneling process. However, for the bending moment at WR40 after 2.4 m of the tail passing-by (Figure 7d), the monitoring data at G3, G7, and G6 show a difference with the corresponding FEA results. This is probably caused by insufficient grouting pressure which might result in excessive outward displacement of segment. However, this study focuses on the ideal situation under which the tail-void is completely filled with grout. Therefore, the FEA model proposed could be employed to provide reliable prediction for the variation of the tunnel bending moment during the TBM-driven process in this study.

4. Influence of TBM-Driven Process on Adjacent URUP Tunnel

The main factors affecting the adjacent tunnel lining are tunnel heading pressure and tail-grouting pressure. This section investigates the influence of different grouting pressure and supporting pressure on the adjacent EB tunnel lining during WB TBM-driven process (see Figure 8). Grouting pressure and supporting pressure are controlled by the coefficients K g and K s . Table 3 shows the values of grouting pressure G and supporting pressure S in different working conditions, where G = K g × G 0 , S = K s × S 0 ( G 0 and S 0 are the values of Case 0).

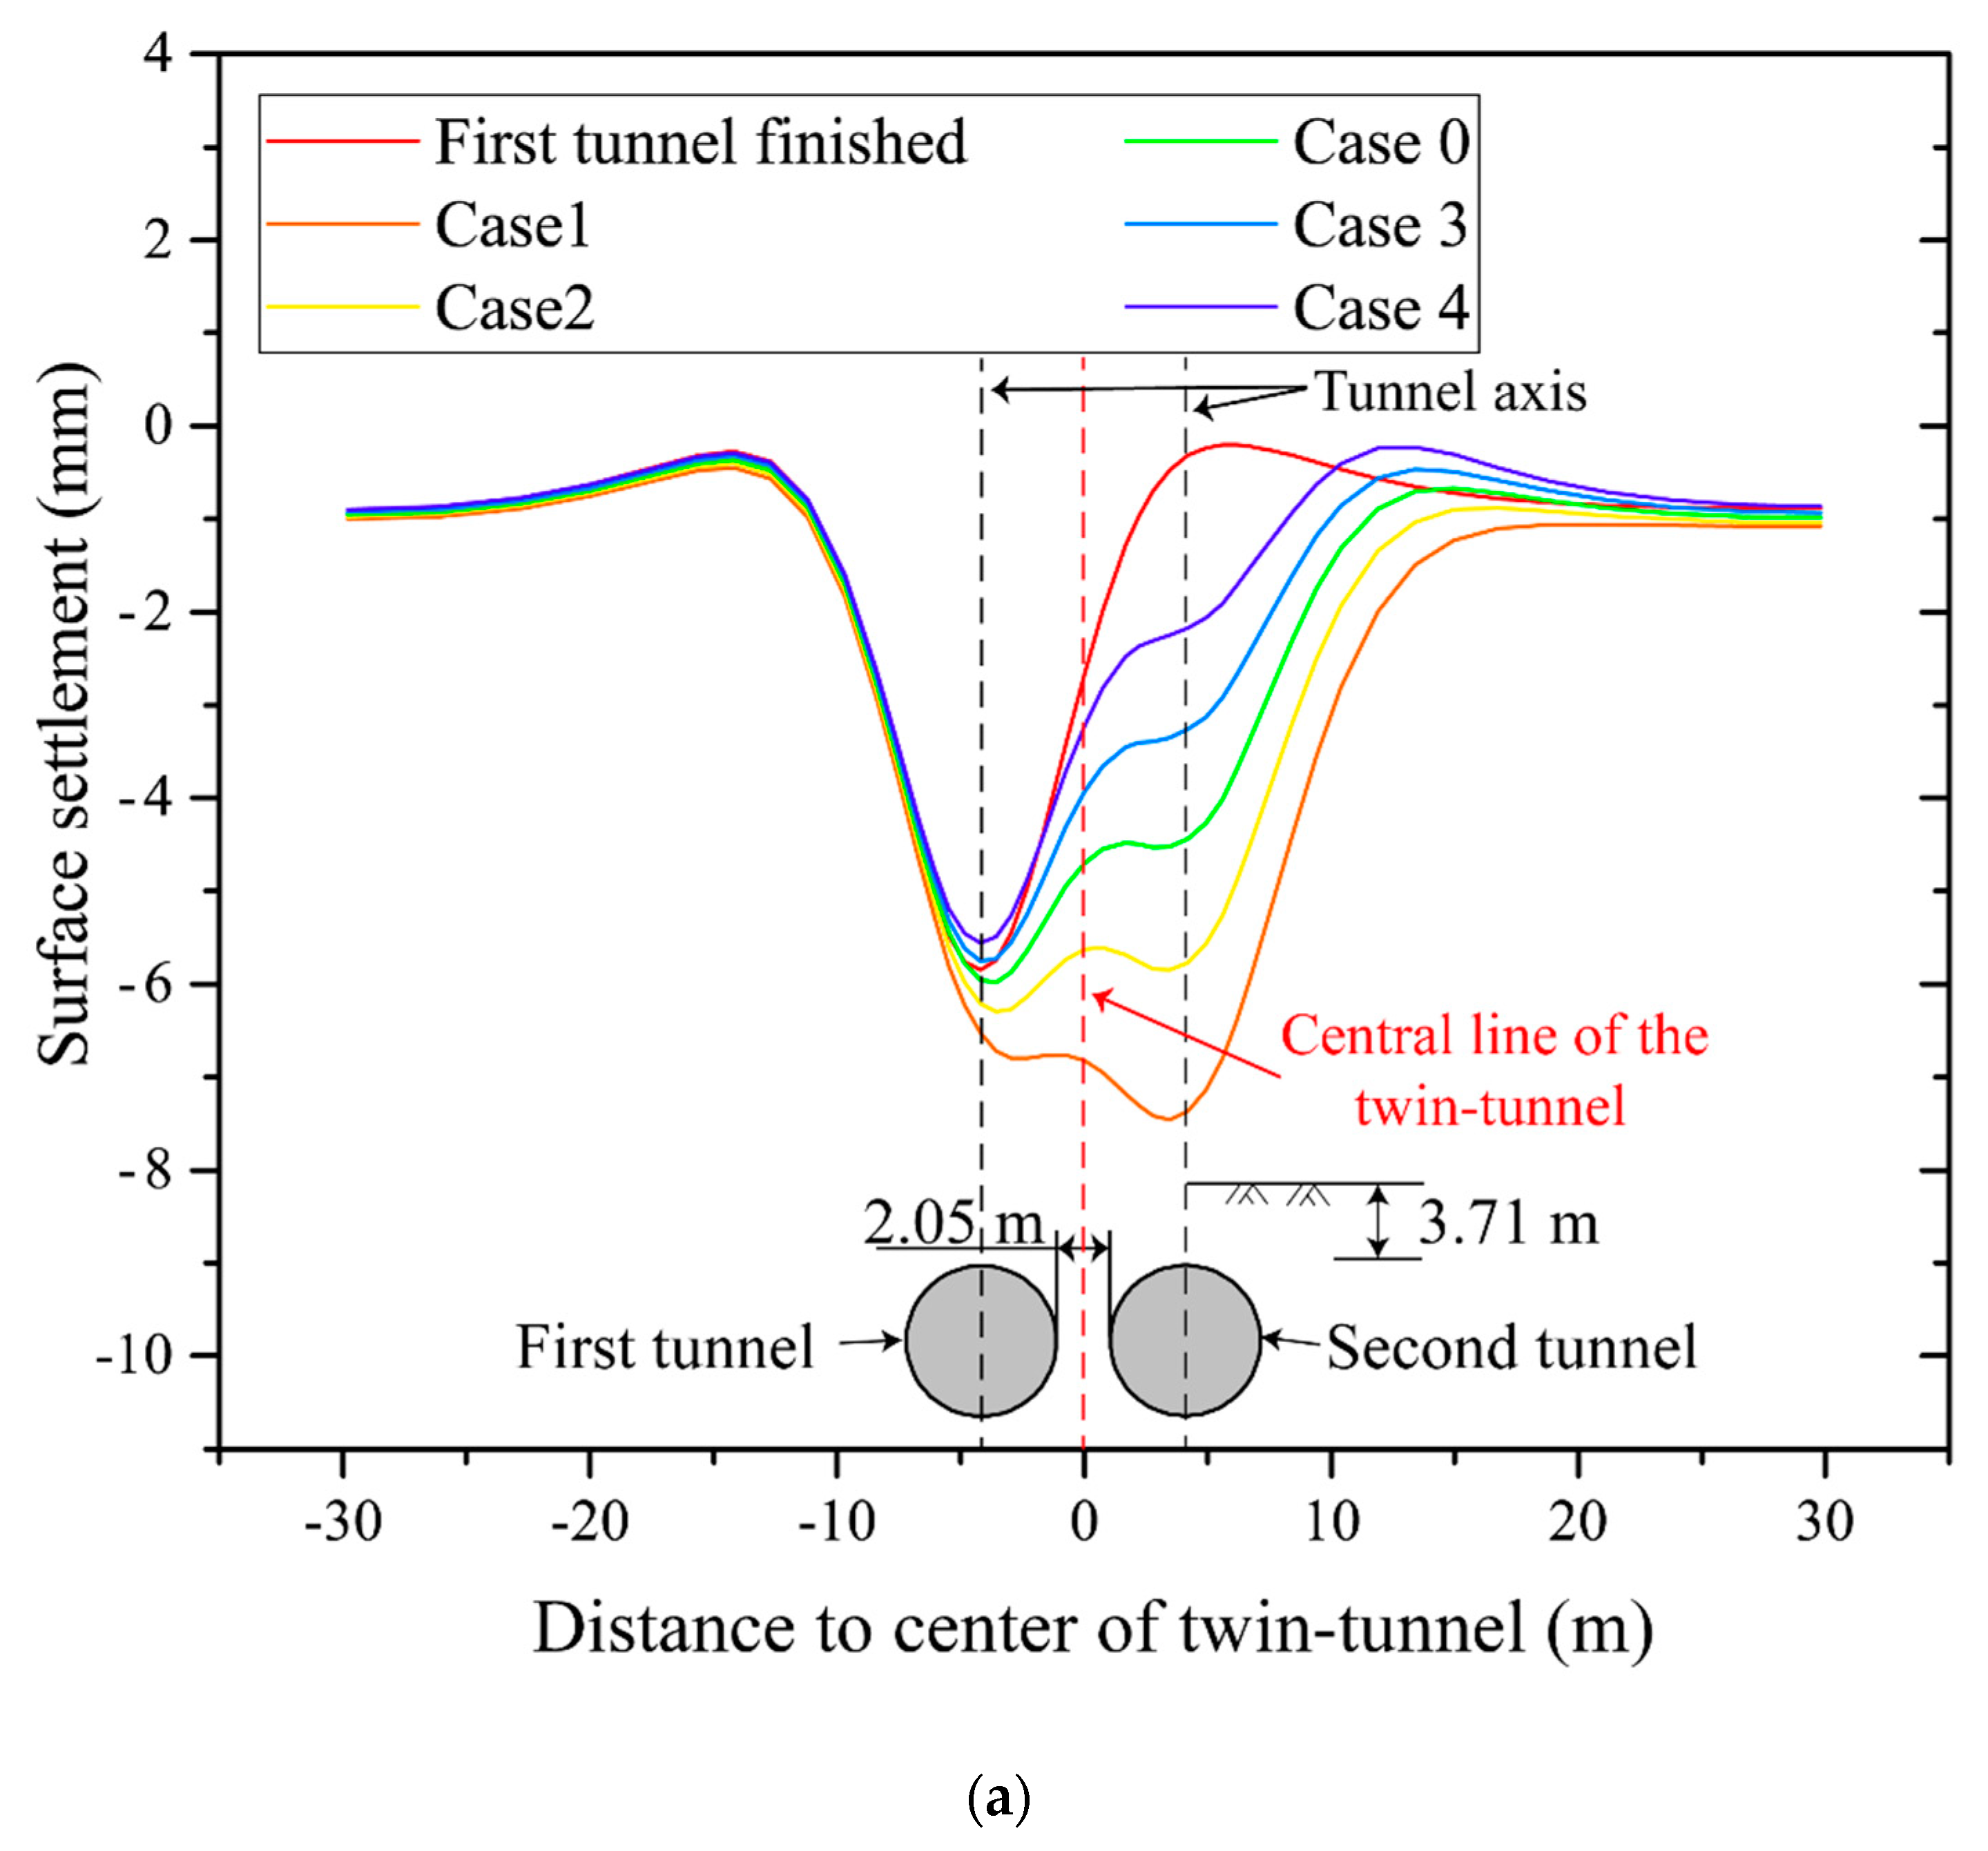
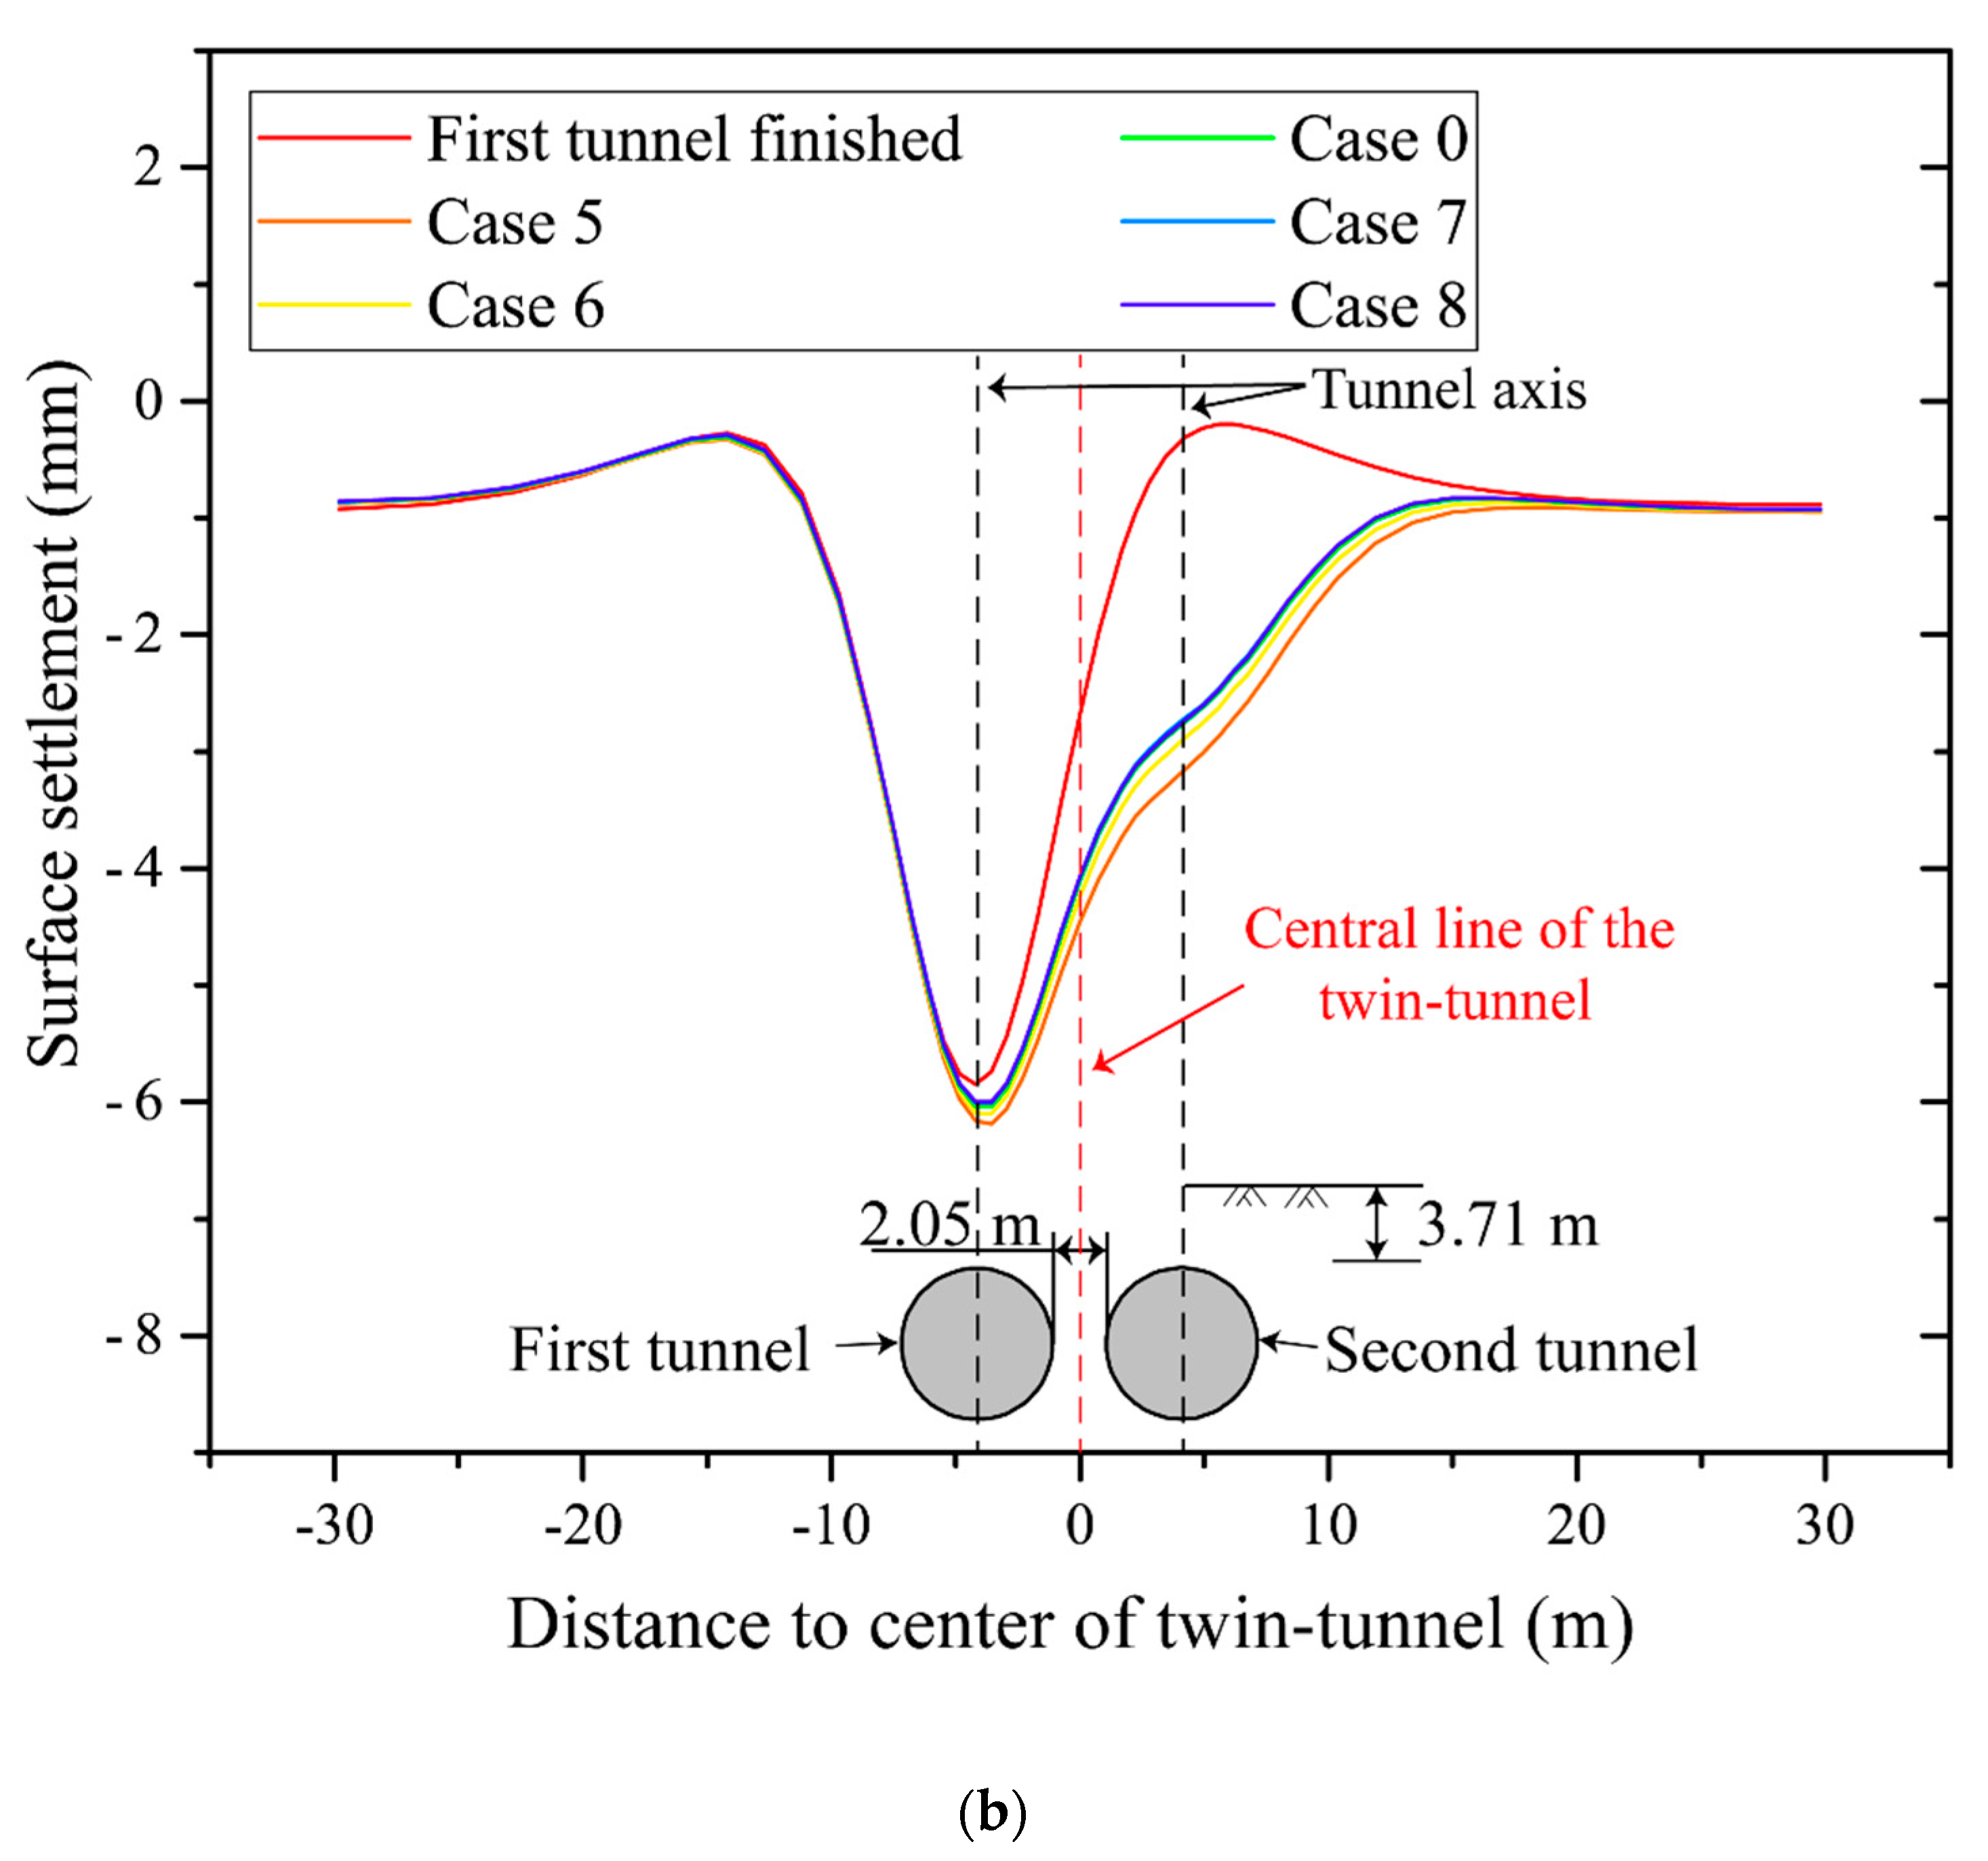
4.1. Ground Surface Settlement

Figure 9 shows the influence of the coefficients K g and K s on ground surface settlement. As shown in Figure 9a, the TBM tail of the second tunnel was parallel to ER60 of the first tunnel in a different case, the grouting pressure range from 0.6 to 1.4 G 0 with an increment of 0.2 G 0 . The first tunnel construction results in a typical settlement trough which is consistent with the Gaussian distribution assumption [32]. Lower grouting pressures result in larger surface settlement above the second tunnel. Double-bottom settlement type can be observed during the tunneling process of the second tunnel. While the grouting pressure is 0.6 G 0 (Case 1), the maximum settlement of 7.5 mm occurs above the center line of the second tunnel. Figure 9b shows the settlement curves under different face supporting pressure when the second tunnel face arrived at ER 60. The heading pressures of different cases range from 0.6 to 1.4 S 0 with the gradient of 0.2 S 0 . Comparing Figure 9b with Figure 9a, we can observe that the surface settlement of the first tunnel induced by the second tunnel advance is more sensitive to the grouting pressure than face supporting pressure.

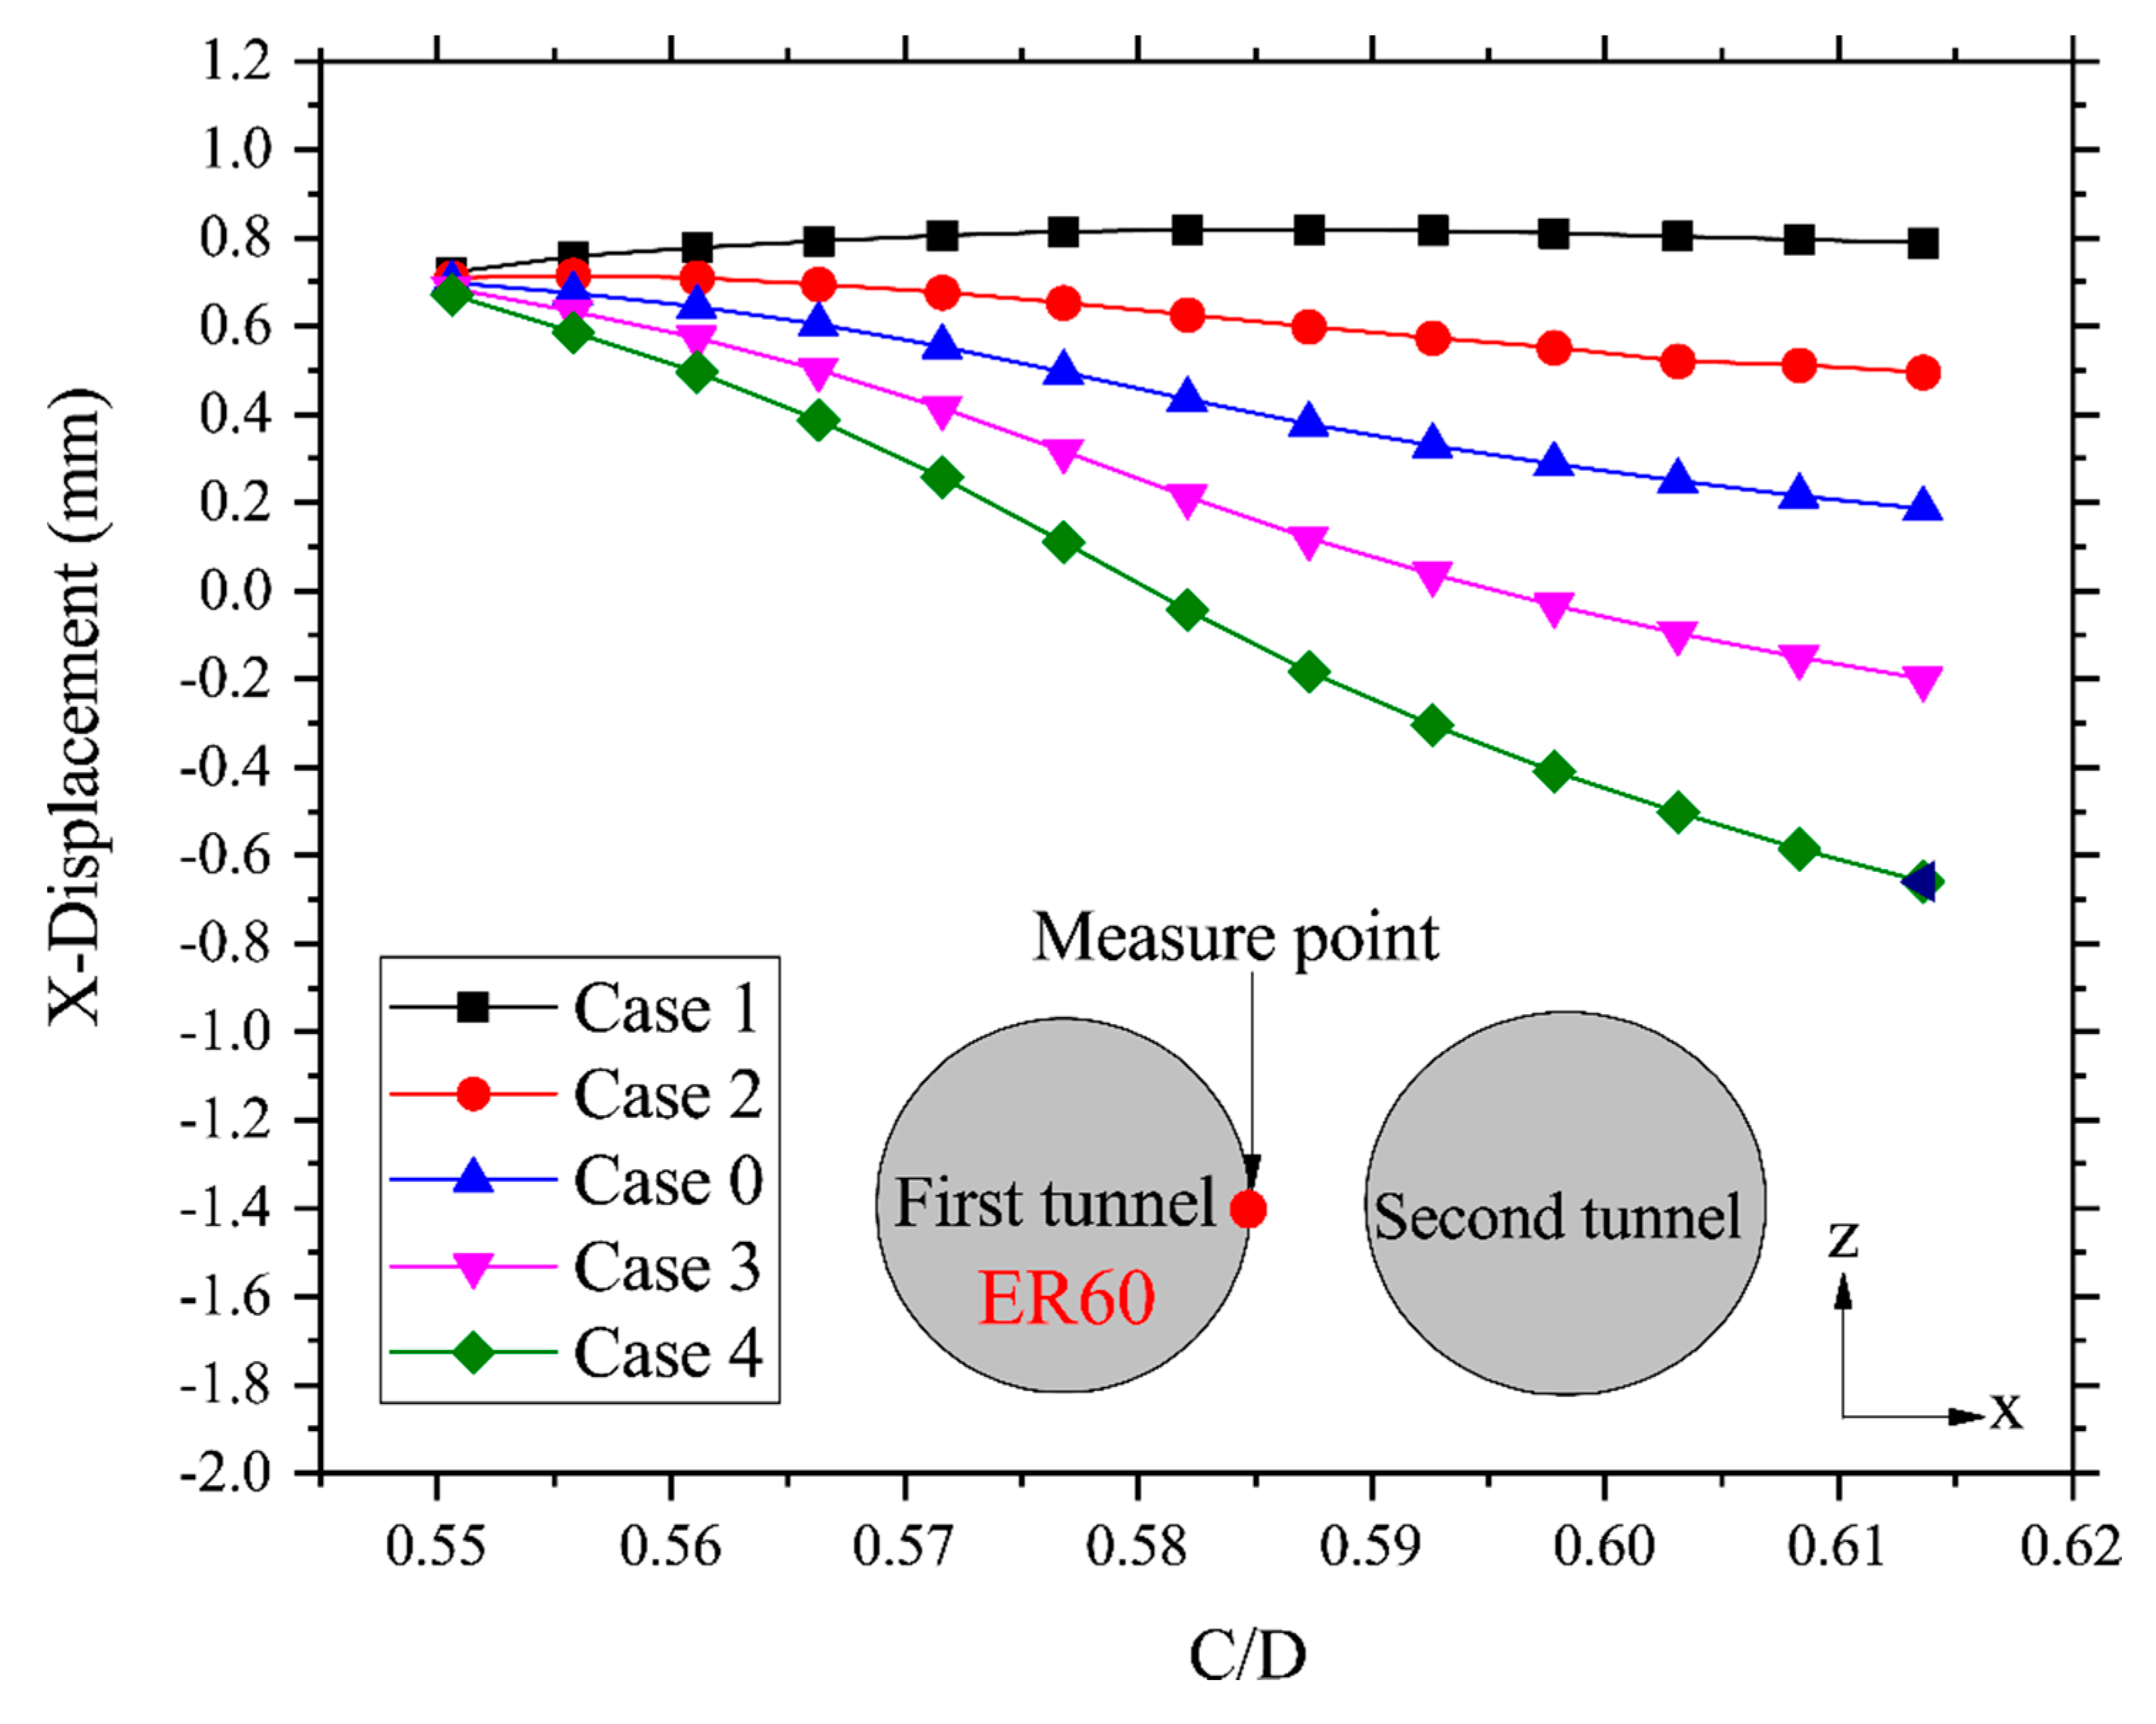
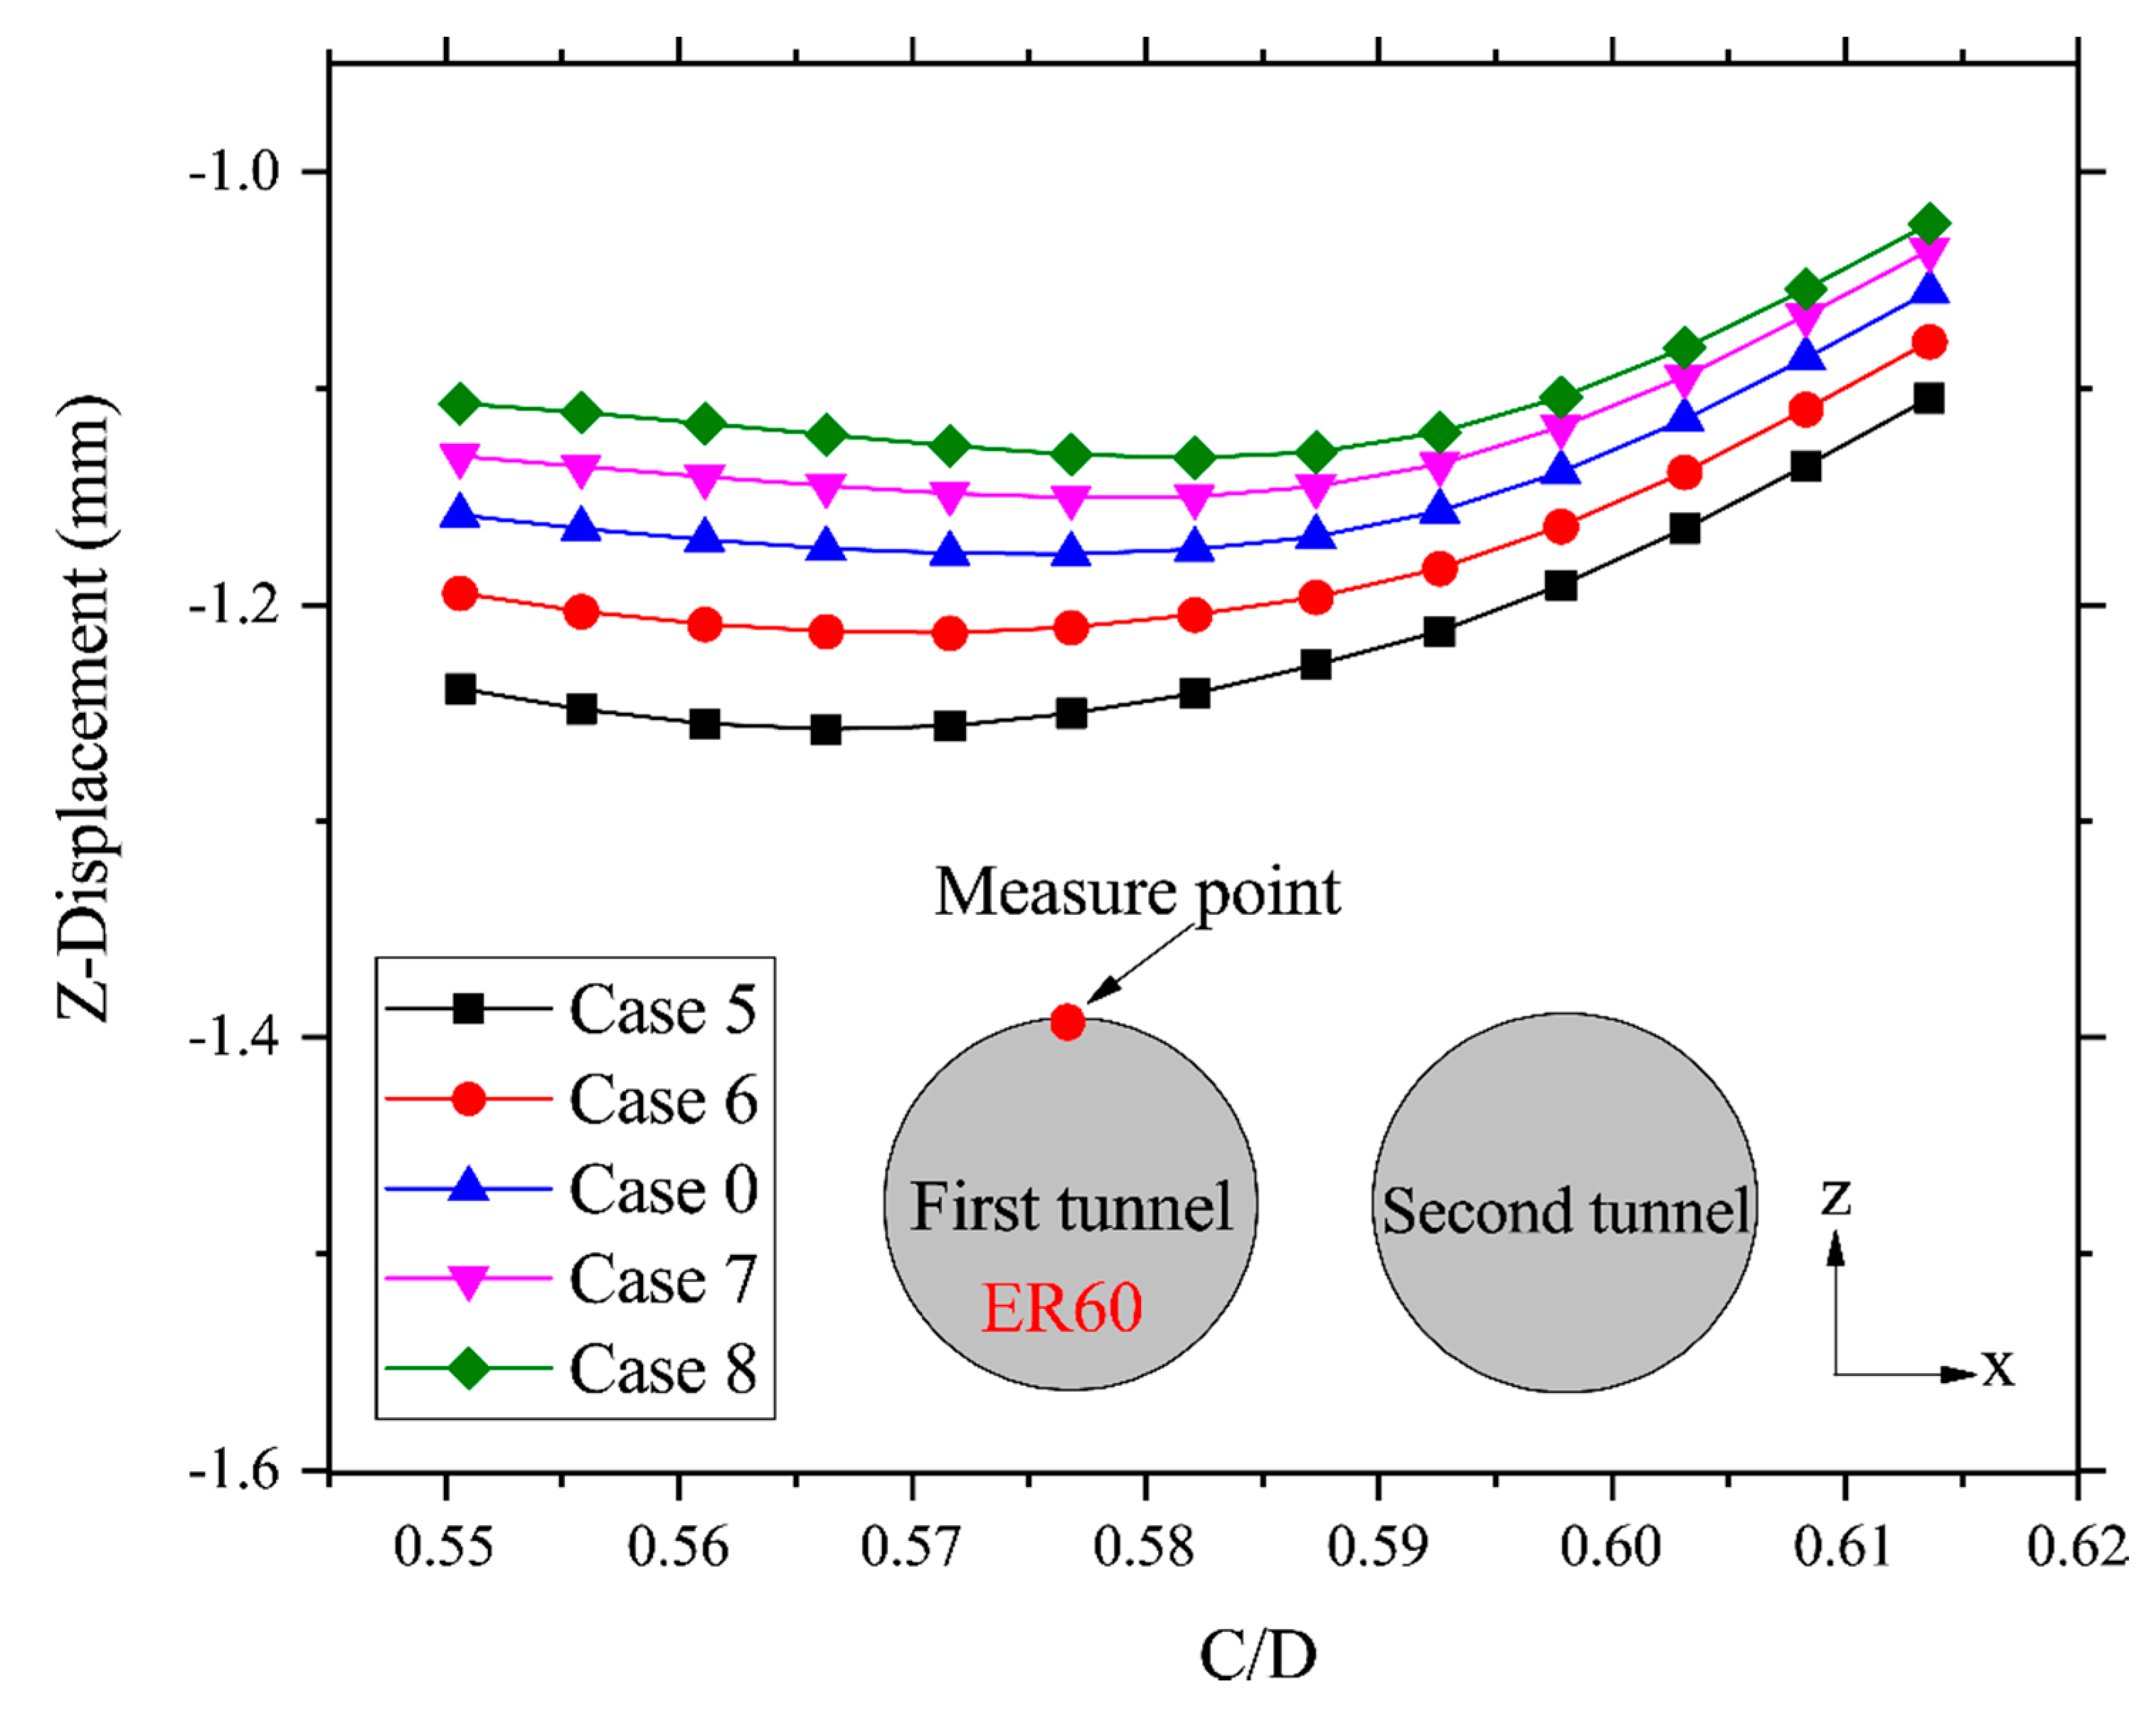
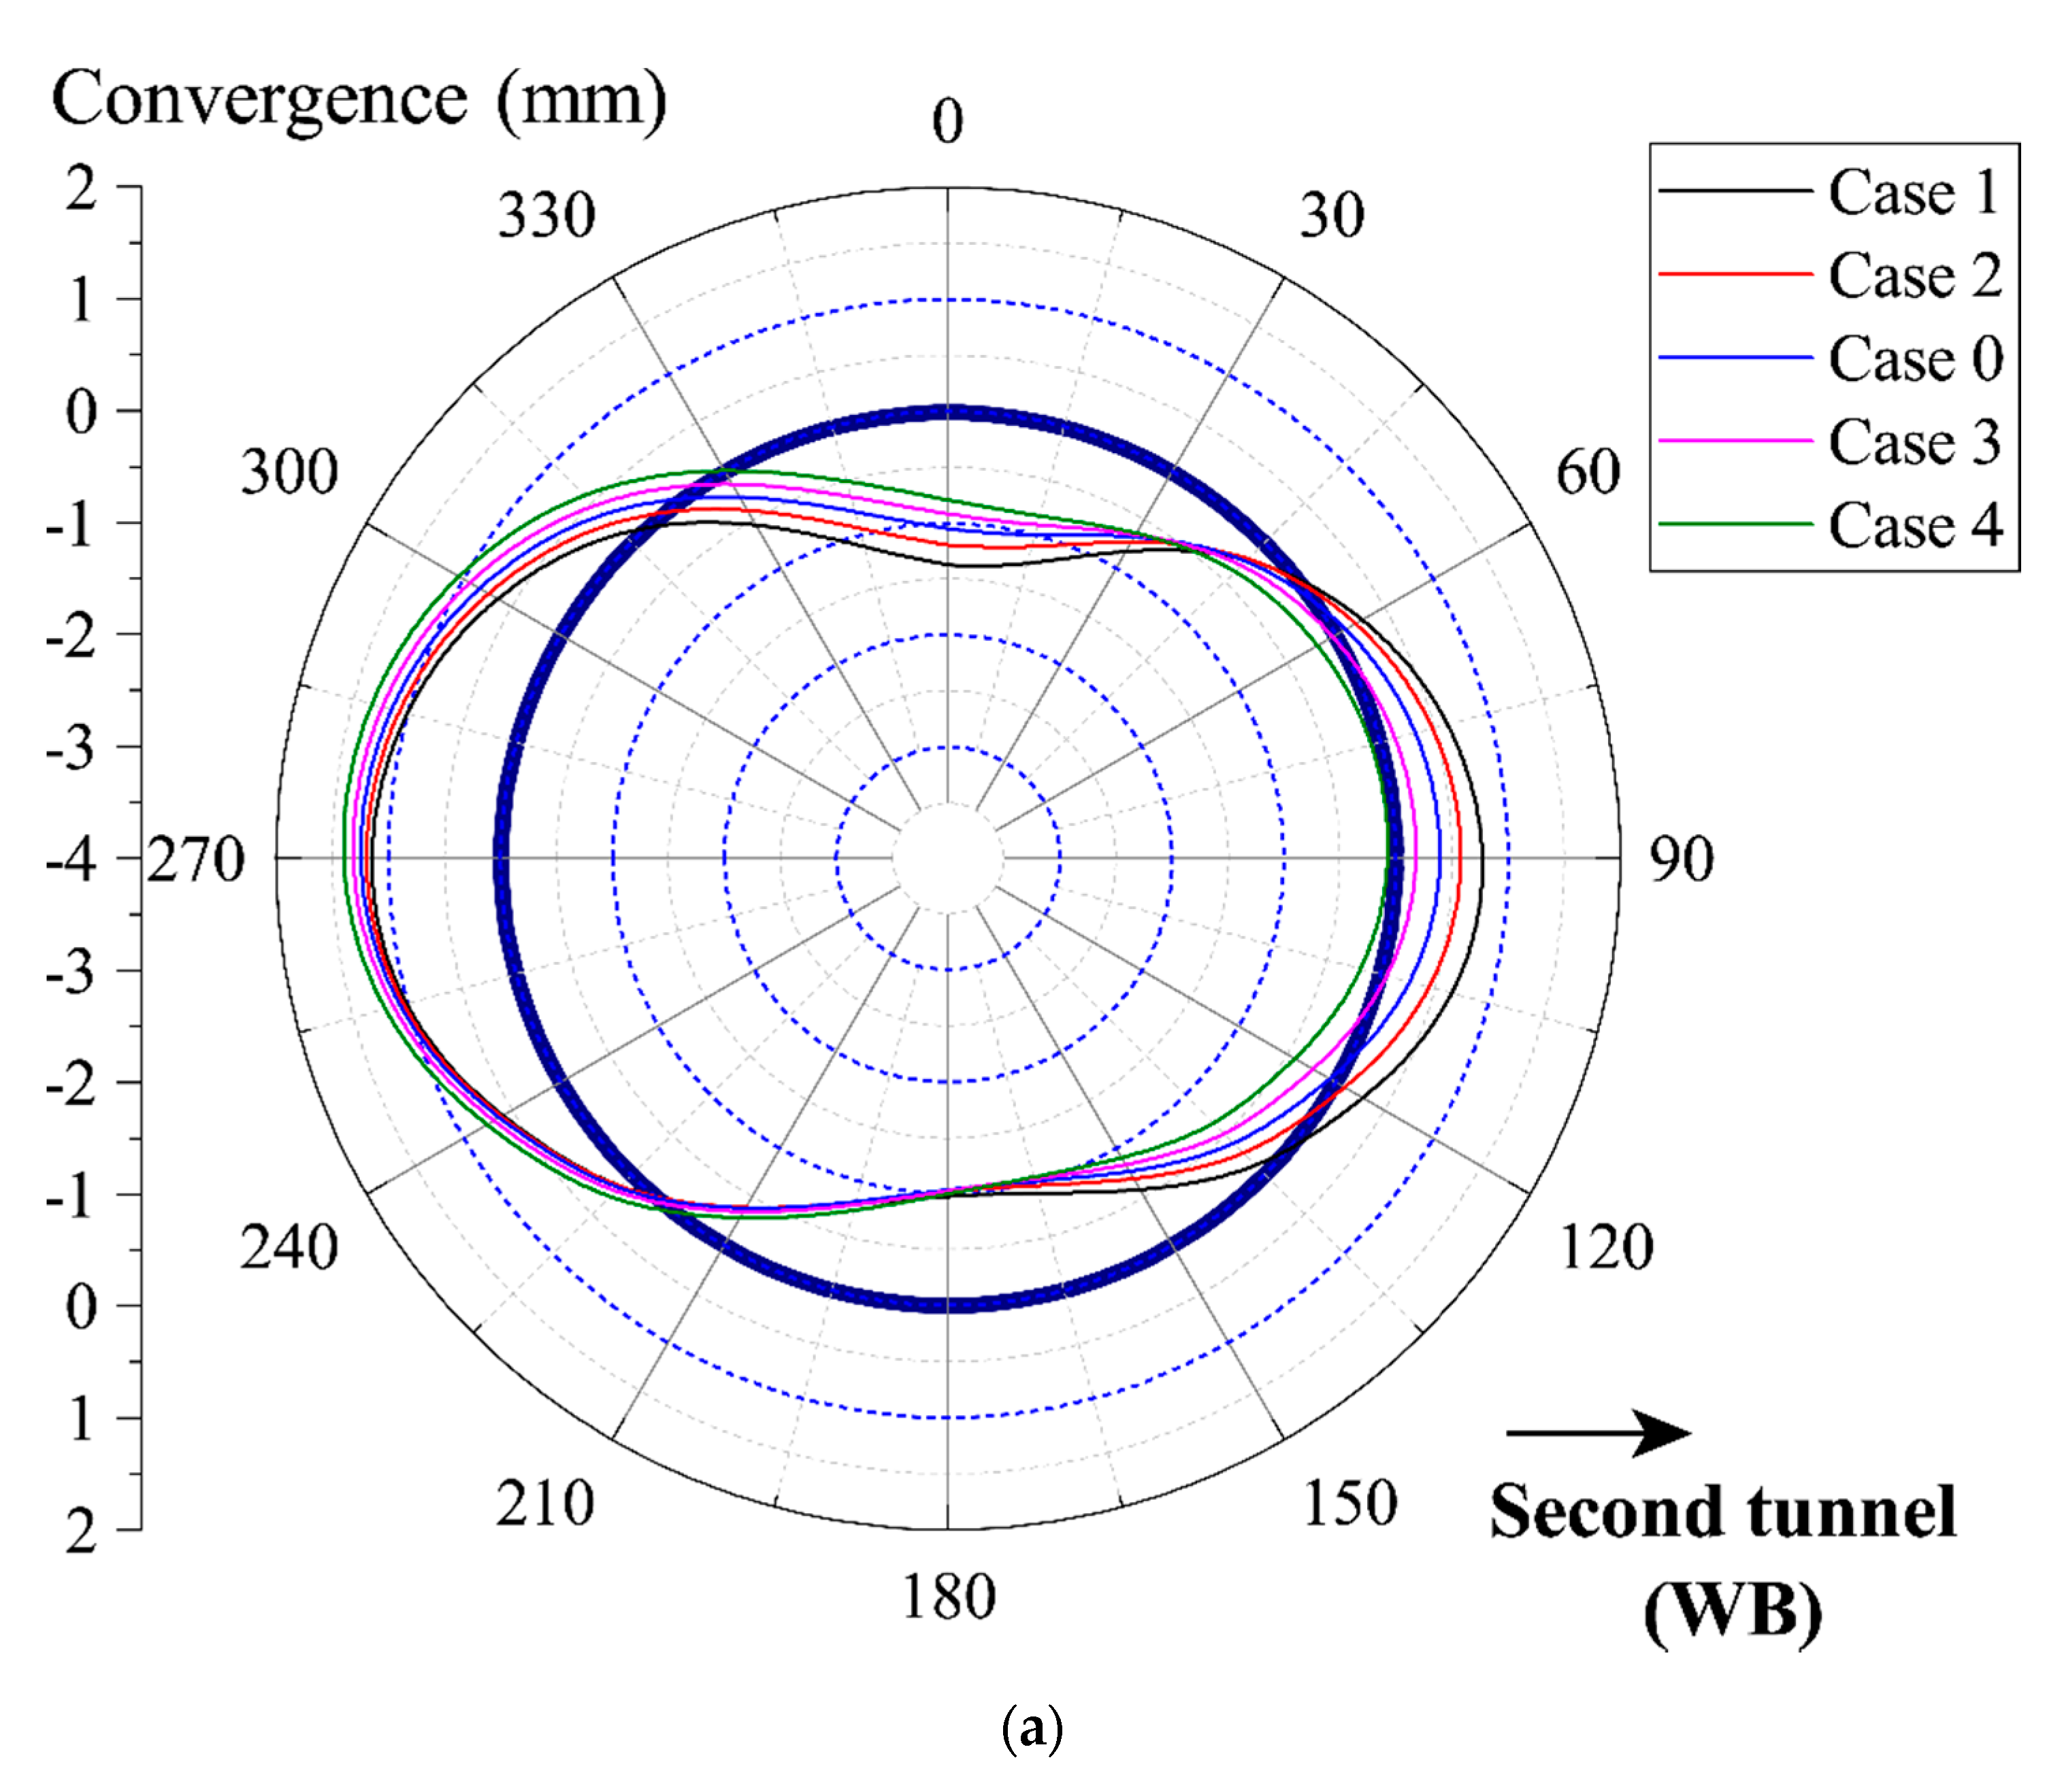
4.2. Tunnel Displacement and Convergence

(1) Tunnel displacement
The displacements of ER60 caused by the grouting pressure during the excavation of WR38 to WR50 (see Figure 8) are presented in Figure 10. The increasing C/D ratio in Figure 10 indicates the TBM advancing at the WB. A positive value of the vertical axis indicates lateral displacement towards the second tunnel. As illustrated in Figure 10, the lateral displacement towards the second tunnel decreases with increasing grouting pressure, indicating a notable ground supporting under sufficient grouting pressures. The inward displacement increases with the TBM advance in Case 2, Case 0, Case 3, and Case 4. However, the opposite phenomenon can be observed in Case 1, indicating that the effect of soil movement towards the second tunnel exceeds that of the second tunnel ovalization.
As shown in Figure 11, settlement can be observed at the top of the first tunnel during the TBM-driven process of the second tunnel. The first tunnel settlement shows negative correlation with the face supporting pressure. With the TBM advance, the maximum settlement of each case occurs at a C/D ratio within a range of 0.56–0.59. As the TBM was driven away from the monitoring section (i.e., ER60), the vertical displacement increases gradually, ascribing to the influence of the second tunnel upheaval. It can be observed from Figure 11 that the cases with a K s > 1 cannot prevent the first tunnel from settlement, although the settlement is small enough (less than 1 mm which is not easy to be measured by ordinary monitoring approaches) to be ignored.
(2) Tunnel convergence
Figure 12 illustrates the influence of grouting pressure and face supporting pressure on the convergence of ER60 in the first tunnel. As shown in Figure 12, a horizontally oval-shaped lining deformation can be observed. However, the lining ovalization is not symmetric, ascribing to the squeezing effect caused by the TBM-driven process of the second tunnel. As can be seen from Figure 12, with the increase of grouting pressure, the convergence of ER60 decreases at the top and increases at the side wall adjacent to the second tunnel, demonstrating that lower grouting pressure results in a smaller squeezing effect on the first tunnel. In Figure 12b, the development of lining convergence under different supporting pressure (i.e., Cases 5 to 8) shows the similar trend as that under different grouting pressures (i.e., Cases 1 to 4). However, different face supporting pressures have minor influence on the convergence of the first tunnel (ER60), ascribing to the reason that the acting direction of the face supporting pressure is perpendicular to the first tunnel convergence.

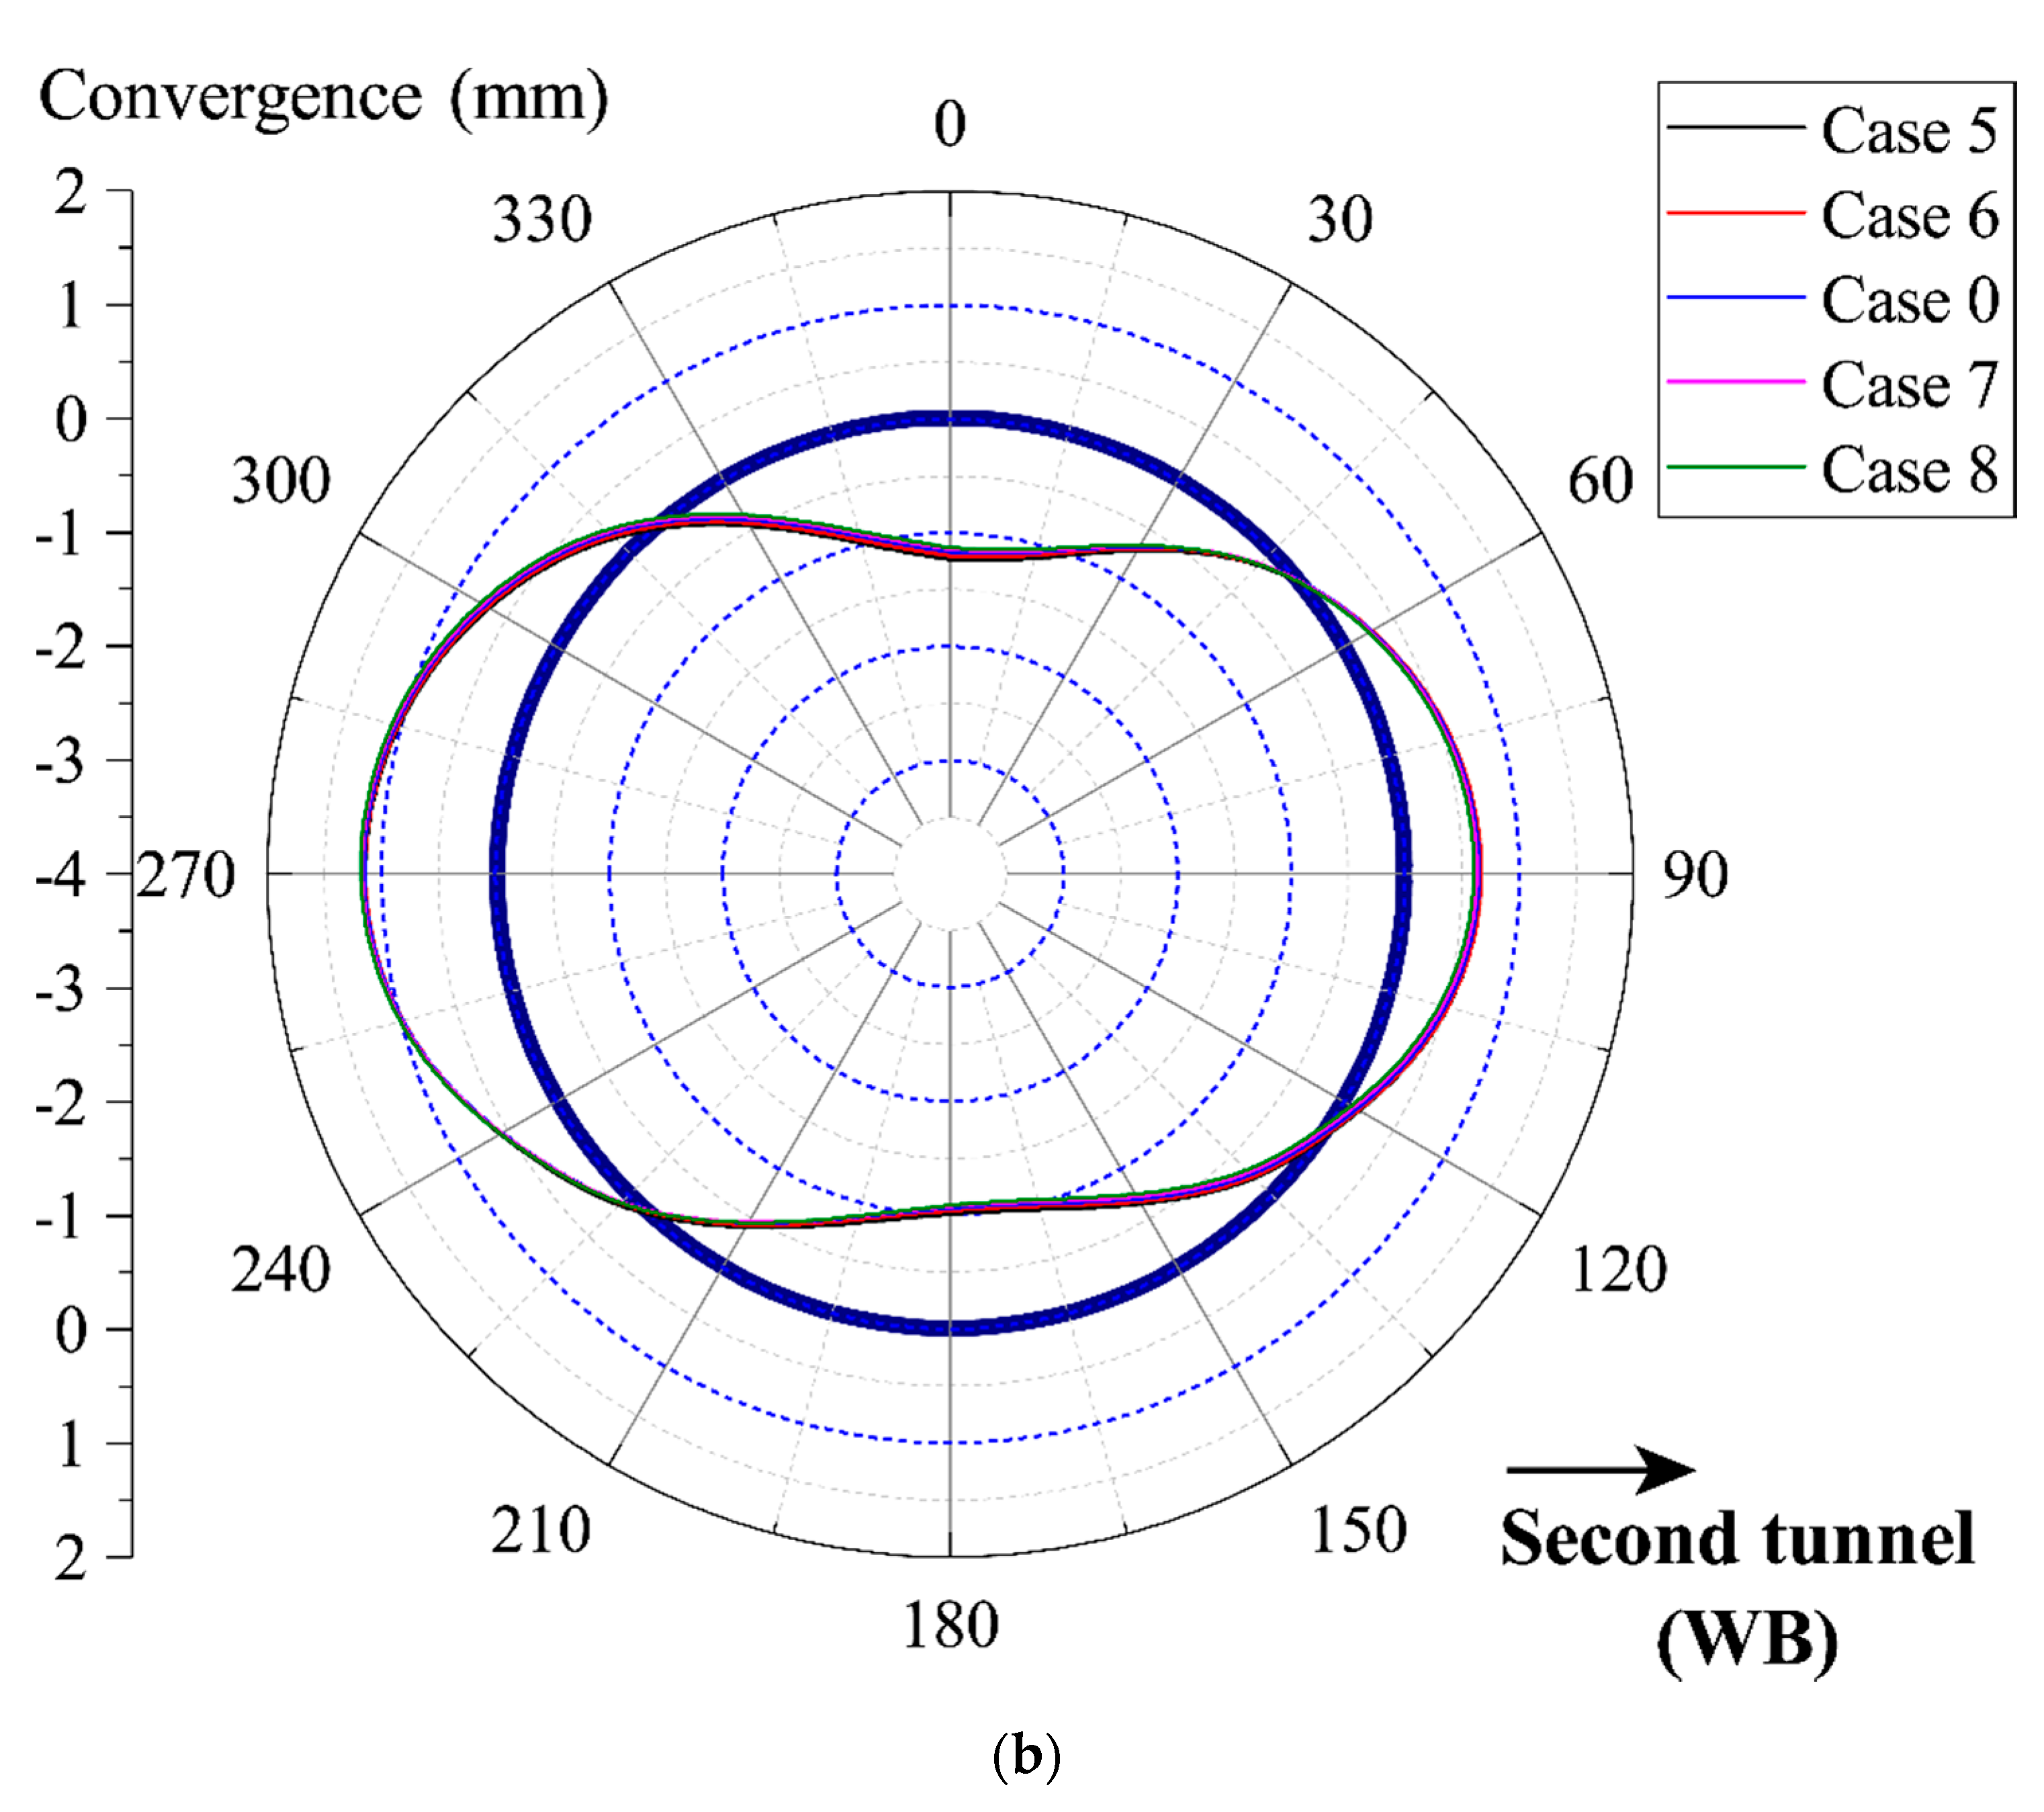
4.3. Bending Moment of Lining Segment

Figure 13 illustrates the changes in the lining bending moment of the segments in different cases. As can be seen in Figure 13, the grouting pressure of the second tunnel advance has significant effect on the bending moment of ER60 in the first tunnel. However, similar to the influence on the first tunnel convergence, the face supporting pressure has little influence on the bending moment of the first tunnel, since the face supporting pressure mainly affects the stress in the axial direction of the tunnel. As the grouting pressure increases, the positive bending moment decreases at the lining sidewall (see Figure 13a). This can be attributed to the unloading effect caused by insufficient grouting pressure in the second tunnel. The maximum positive bending moment in all cases is 113.4 kN·m in Case 1, with the minimum magnitude of 85.0 kN·m in Case 4. In all cases, the maximum magnitude of negative bending moment is −91.82 (Case1), and the minimum is −63.03 kN·m (Case 4).
In Figure 14, the relationship between the bending moment M and the grouting pressure index K g is fitted with linear functions (see Equation (19)). The similarity R 2 in different fitting functions are over 0.99.
M = a + b · K g
where a and b are the linear fitting parameters.
In Figure 14a, the max negative bending moment M n on the top of lining decrease with increasing K g . In addition, with the decrease of C/D, the slop b j and the magnitude of intercept a j decrease. In Figure 14b, the max positive bending moment on the EB sidewall lining decreases with the increase of K g . With the decrease of C/D, the magnitude of slop b i and the intercept a i of different fitting lines decrease. Notably, all fitting lines intersect at the point adjacent to K g = 1 (i.e., Case 0) in which the grouting pressure during the second tunnel construction is equal to G 0 , revealing that Case 0 is the most suitable case since the variation of the bending moment in the first tunnel is stable with the TBM advance of the second tunnel.
Figure 15 shows that the relationship between face supporting pressure and the bending moment under different tunnel depth can be fitted by Lognormal function:
M = M 0 + A 2 π w K s e [ ln K s / K c ] 2 2 w 2
where M 0 ,   A ,   w ,   K c are the fitting parameters in the Lognormal function with the details demonstrated in Table 4.
As shown in Figure 15a, when C/D exceeds 0.56, as the grouting pressure increases, the bending moment on the first tunnel side-wall firstly increases and then continuously decreases with the maximum value at K s = 0.7 . This can be explained as that the first tunnel bending moment can be affected by the loosened zone of the second tunnel, which formed by the soil arching effect. When the supporting pressure is greatly reduced, it not only affects the soil within the tunnel, but also the soil above the tunnel, resulting in the change of the loosened zone [47]. When C/D is lower than 0.56, the bending moment of the first tunnel continuously decreases as the supporting pressure increases. In Figure 15b, the bending moment can also be fitted by a lognormal curve, as expressed in Equation (20). With the increase of Ks, the bending moment continuously increases. When C/D is greater than 0.58, the bending moment value increases as the C/D decreases. However, the bending moment of ER55 (C/D = 0.6084) is greater than ER60 (C/D = 0.5821). This is due to the fact that when the overburden is thick enough, soil arching can be formed, which effectively reduces the bending moment of the first tunnel lining.
Figure 15a and Table 4 show that the peak phenomenon in bending moment of the sidewall gradually disappears with the C/D decreased to 0.55. Comparing with Figure 15b, a conclusion can be drawn that the critical C/D, under which the horizontal (see Figure 15a) and vertical (see Figure 15b) soil arching effect disappears, locates between 0.55–0.60. This is in consistent with previous research [33].

5. Conclusions

The paper presents an FEA investigation of the influence of the second tunnel construction on adjacent first tunnel lining. A comprehensive monitoring program was conducted on the internal force of the tunnel lining. The FEA model was validated by the comparison with the monitoring results. The ground surface settlement, as well as the deformation of the first tunnel, was also analyzed to study the influence of the adjacent TBM-driven process. The follow conclusions can be drawn.
(1)
A typical horizontal ovalization of the first tunnel was monitored, with the maximum and minimum bending moment located at the sidewall and top of the tunnel, respectively.
(2)
To take the TBM geometry into consideration, a non-uniform contraction mode with the maximum contraction δ = 6 mm was employed in the FEA model. The model was validated by comparison with the monitored bending moment. The FEA results show that a double-bottom settlement type occurred during the tunneling process of the second tunnel. In addition, the surface settlement of the first tunnel induced by the second tunnel advance is more sensitive to the grouting pressure than face supporting pressure.
(3)
The grouting pressure during the second tunnel construction has significant influence on the convergence of the adjacent first tunnel lining, ascribing to the squeezing effect caused by the grouting pressure. However, the face supporting pressure does not have notably influence on the first tunnel convergence.
(4)
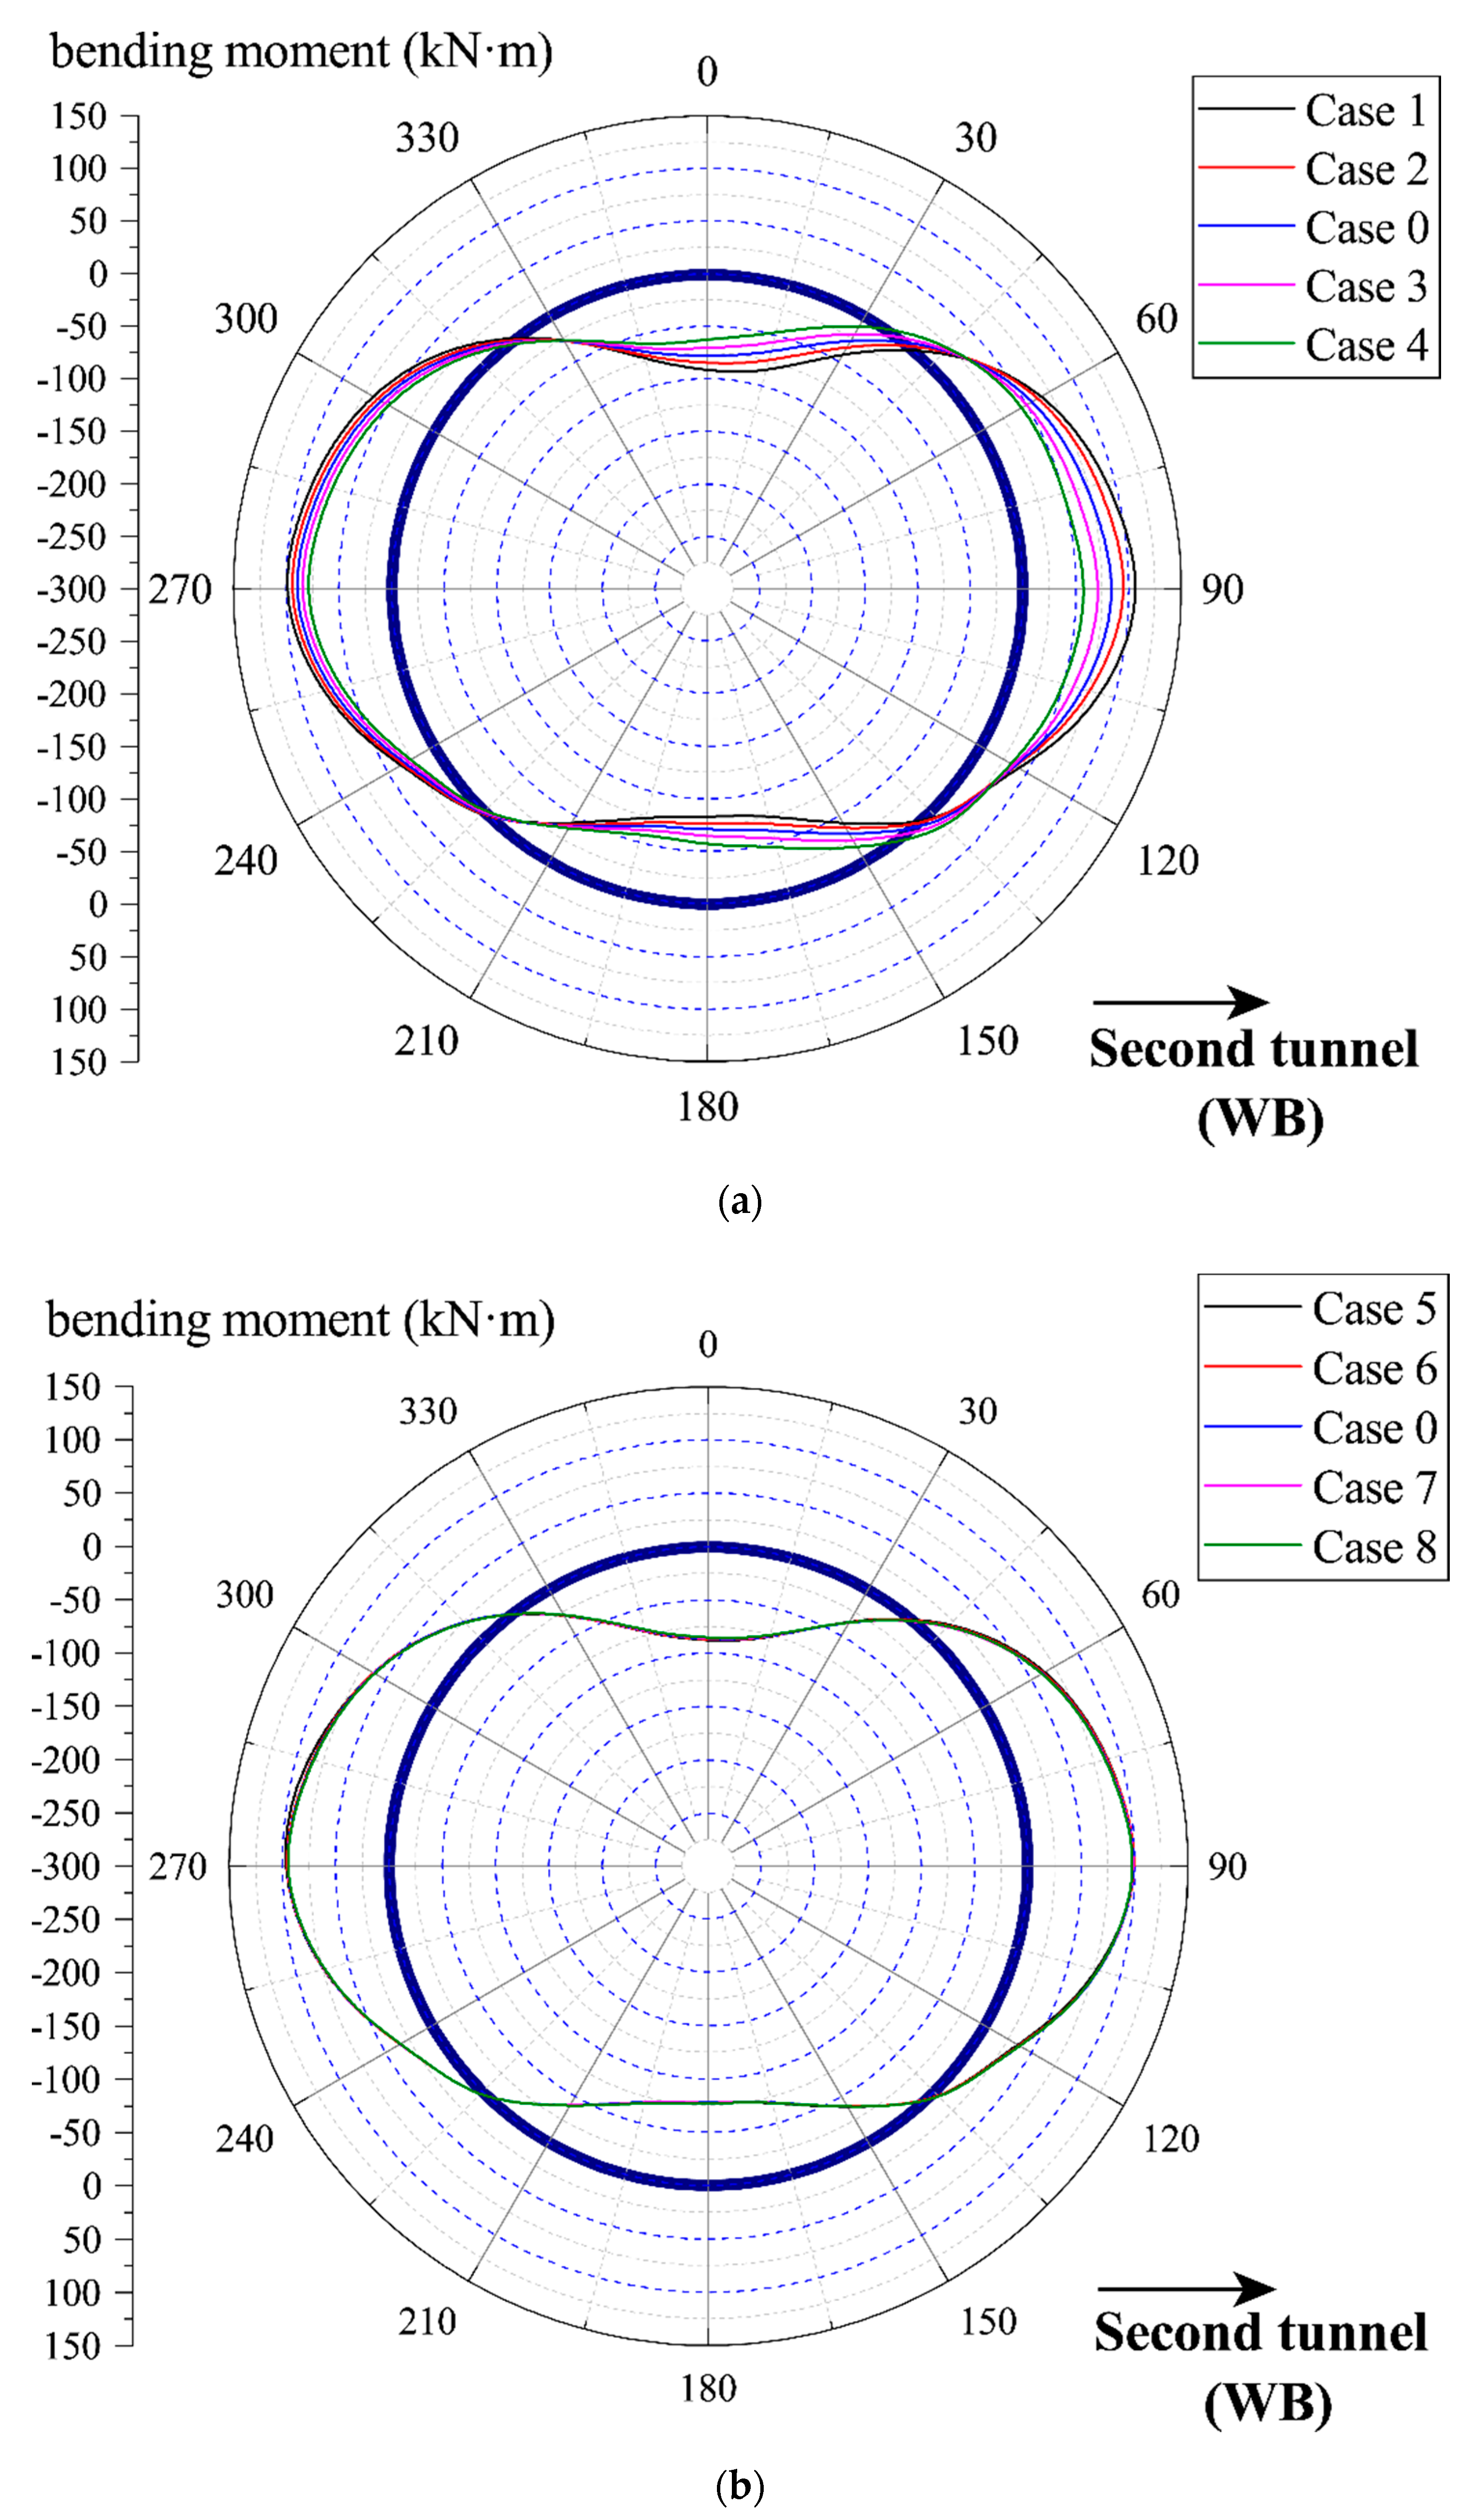
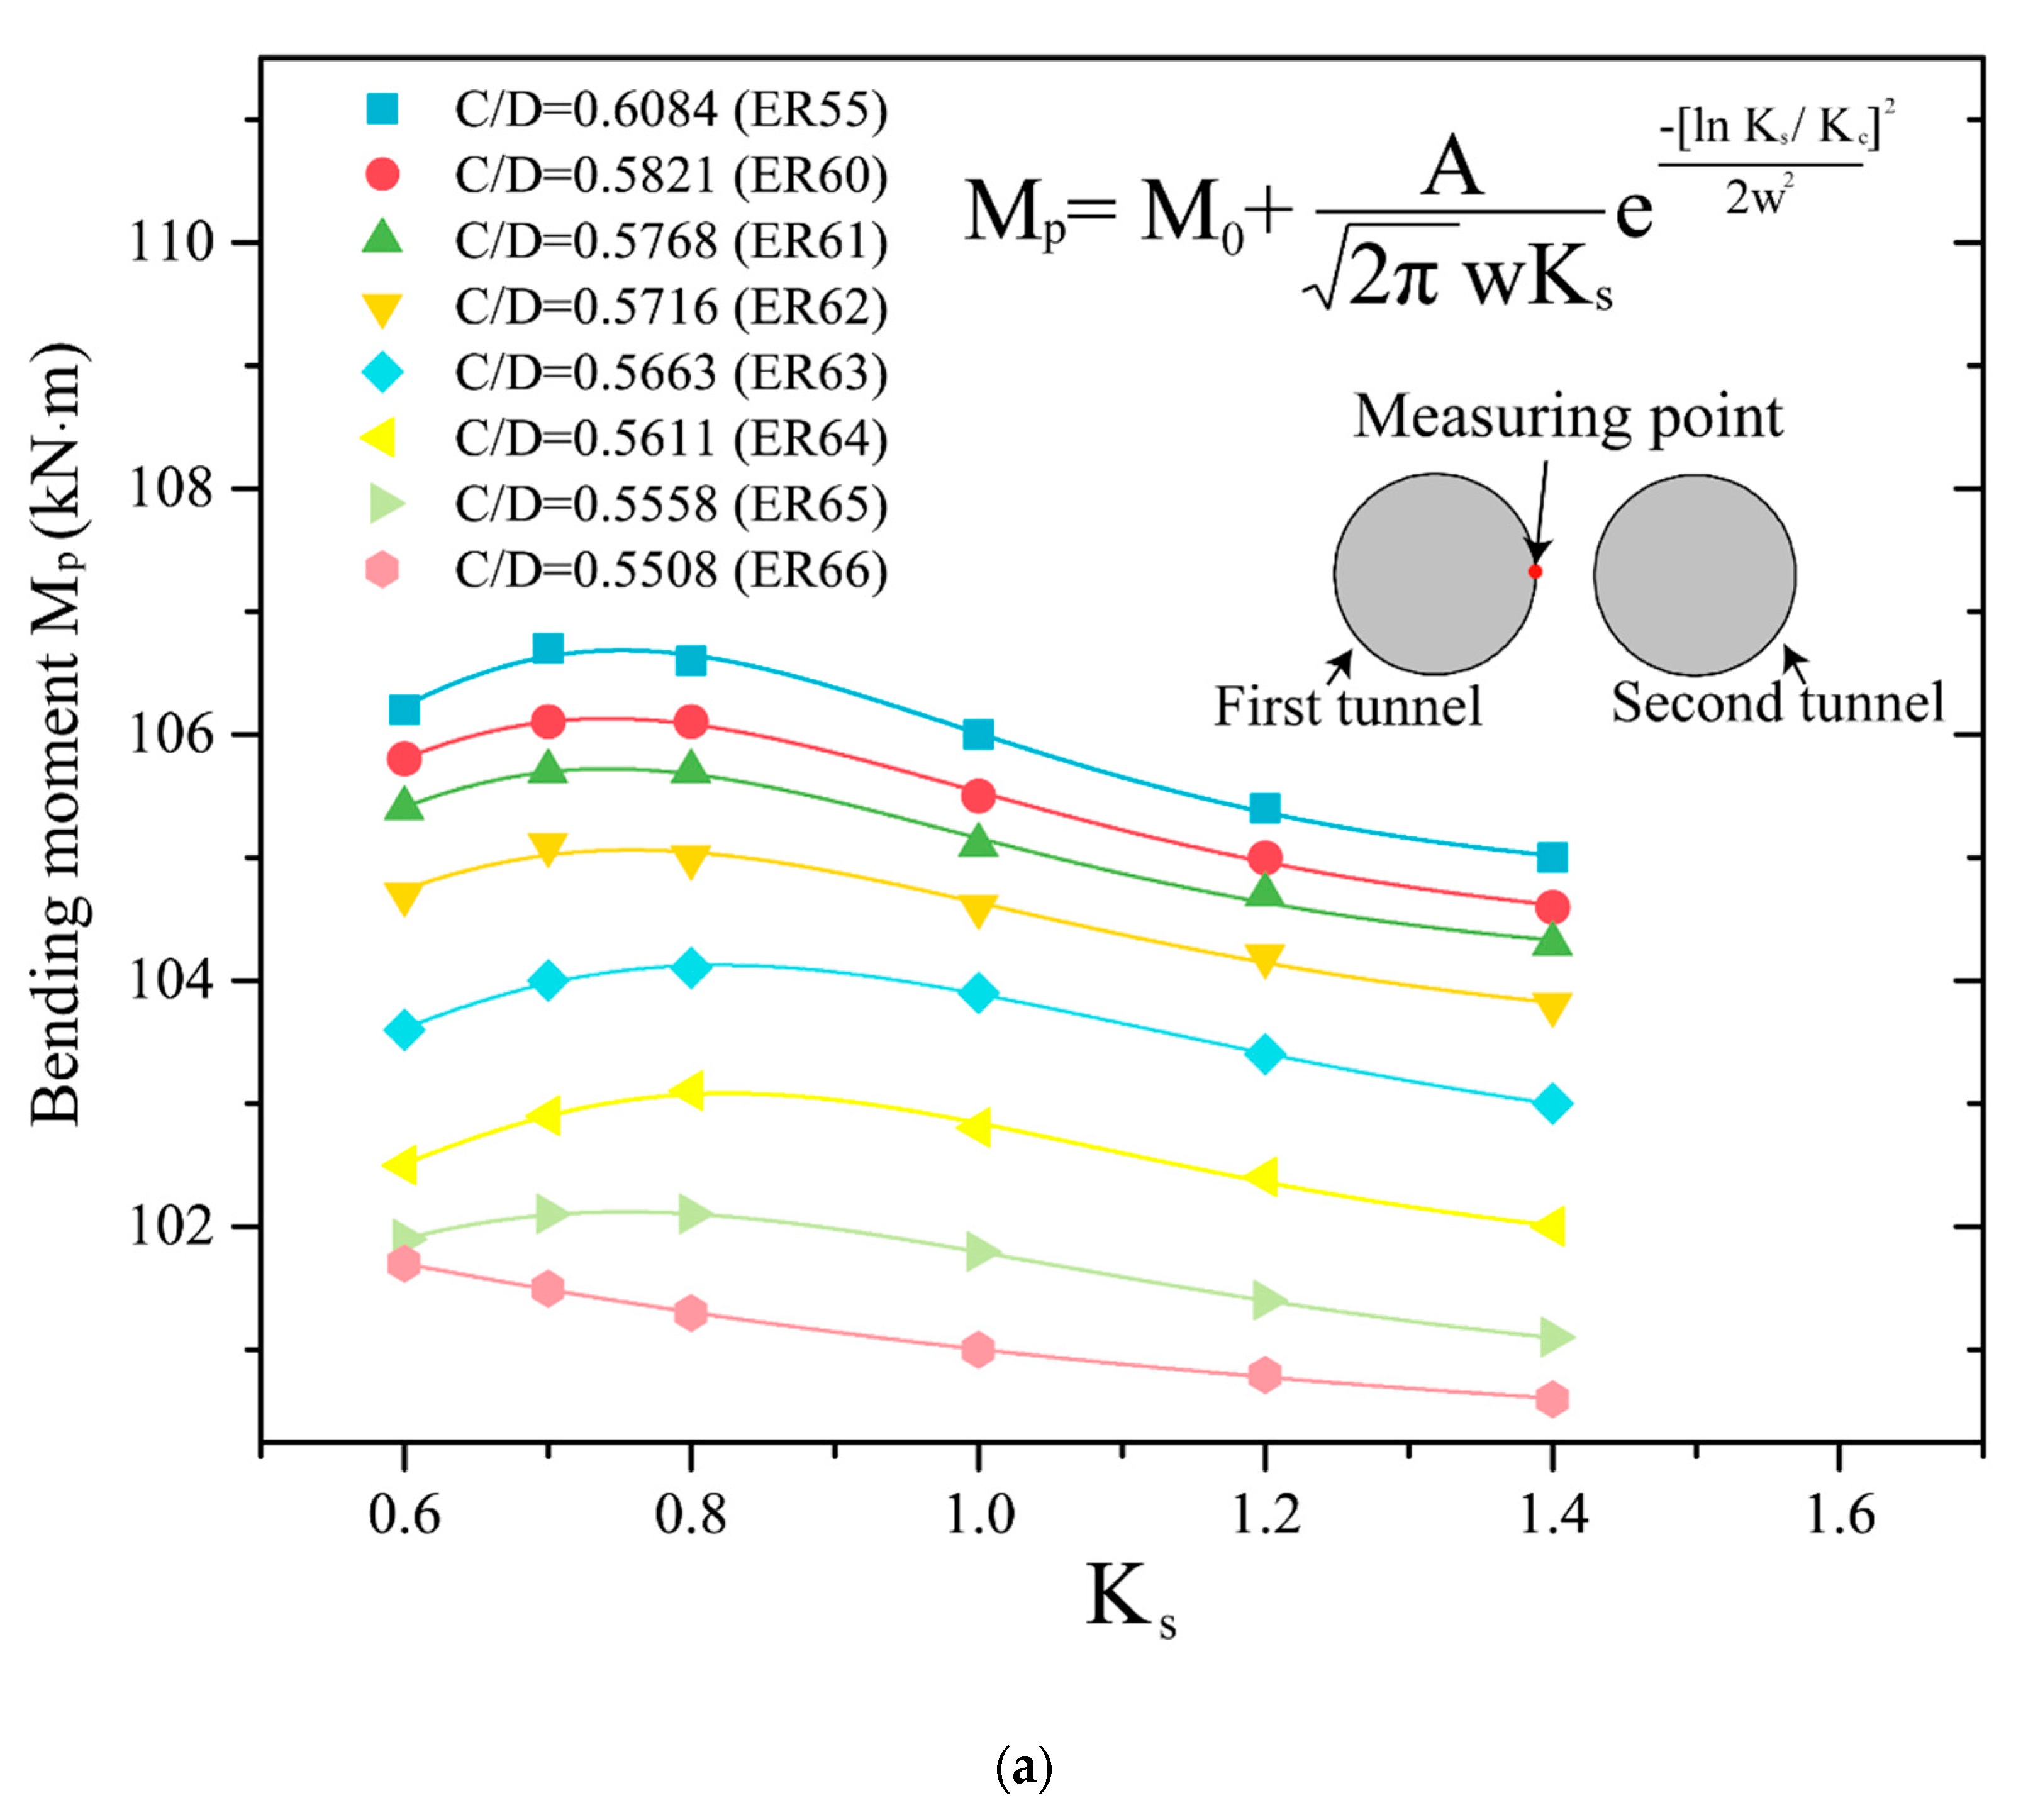
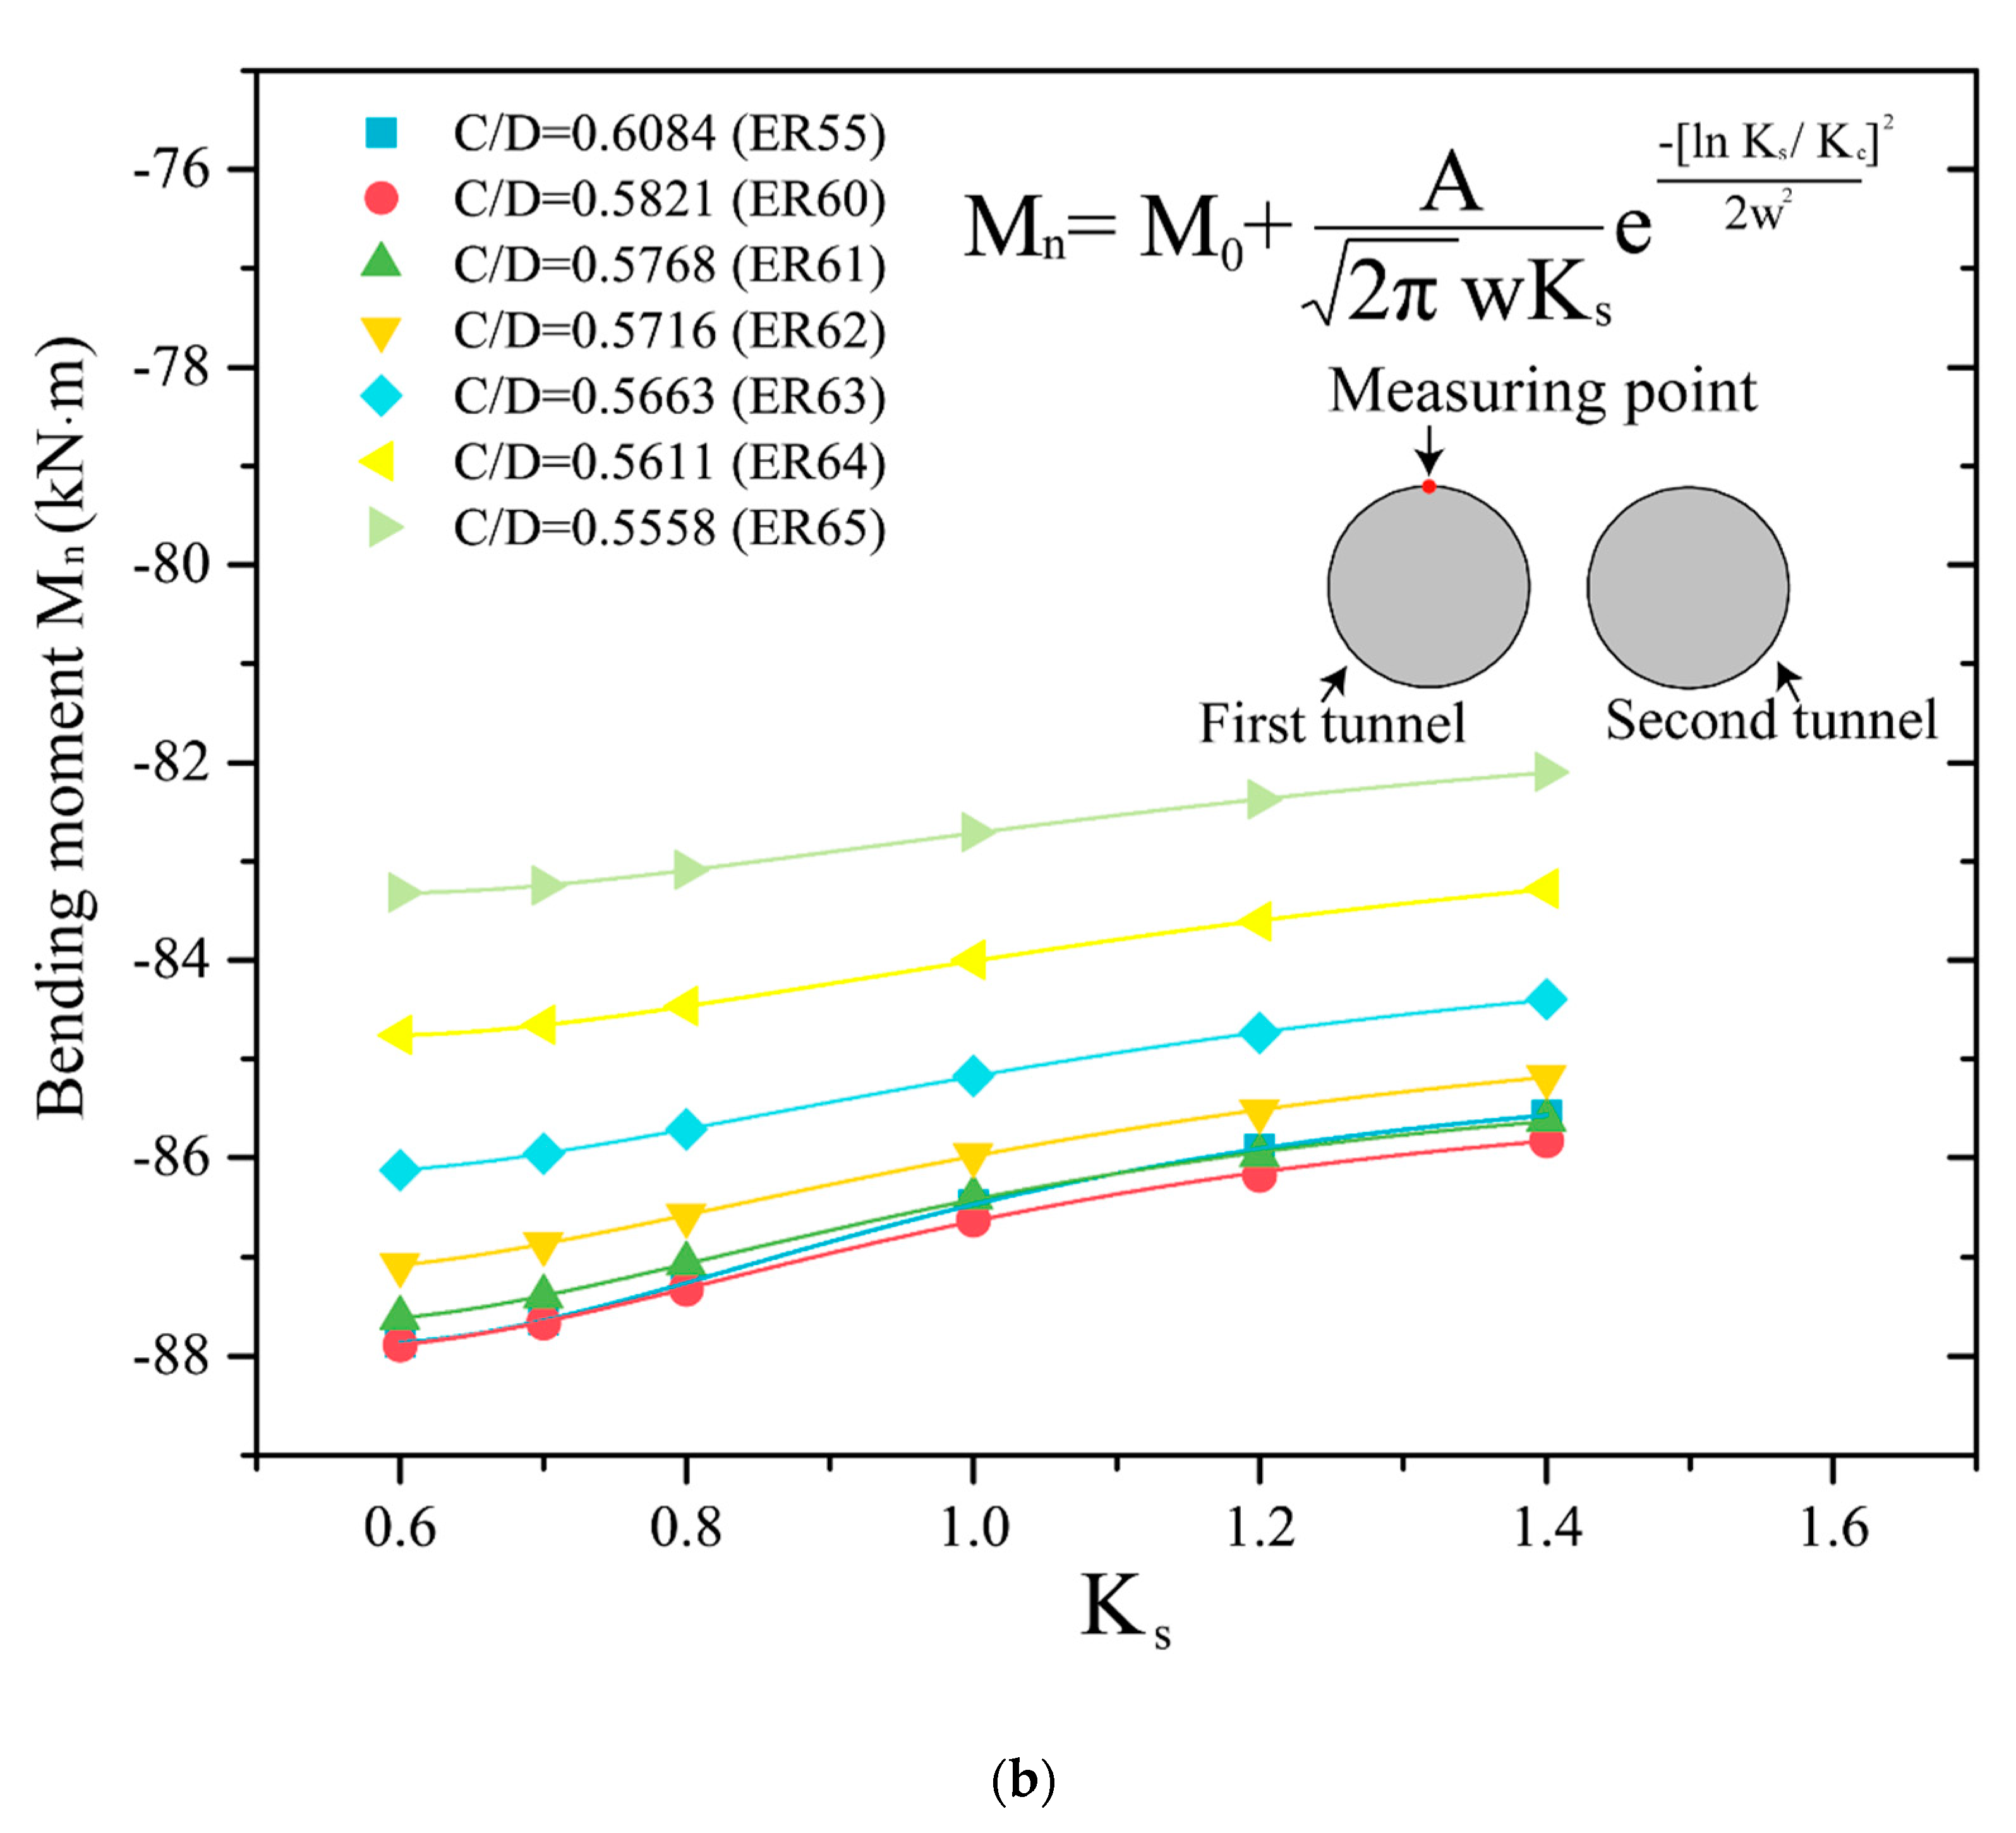
The relationship between the bending moment and the grouting pressure coefficient K g can be fitted in a linear function. A K g = 1.0 is the most suitable choice since the variation of the bending moment in the first tunnel is stable with the TBM advance of the second tunnel. The relationship between the face supporting pressure and the bending moment under different tunnel depths can be fitted by a lognormal function. A critical C/D ratio, under which the horizontal and vertical soil arching effect disappear, can be deduced to be within the range of 0.55–0.60.

Author Contributions

Conceptualization, C.L.; Funding acquisition, C.L.; Resources, H.J.; Supervision, H.L. and Y.Y.; Validation, W.C.; Writing—original draft, C.L. and Z.P.; Writing—review & editing, L.P. All authors have read and agreed to the published version of the manuscript.

Funding

The research was conducted with funding provided by Guangdong Natural Science Foundation (Grant No. 2018A030313132), National Science Foundation of China (Grant No. 51808150), and National Science Foundation of China (Grant No. 51808230).

Conflicts of Interest

The authors declare no conflict of interest.

References

  1. Liu, C.; Zhang, Z.X.; Regueiro, R.A. Pile and pile group response to tunnelling using a large diameter slurry shield—Case study in Shanghai. Comput. Geotech. 2014, 59, 21–43. [Google Scholar] [CrossRef]
  2. Berthoz, N.; Branque, D.; Wong, H.; Subrin, D. TBM soft ground interaction: Experimental study on a 1 g reduced-scale EPBS model. Tunn. Undergr. Space Technol. 2018, 72, 189–209. [Google Scholar] [CrossRef]
  3. Chen, R.-P.; Li, J.; Kong, L.-G.; Tang, L.-J. Experimental study on face instability of shield tunnel in sand. Tunn. Undergr. Space Technol. 2013, 33, 12–21. [Google Scholar] [CrossRef]
  4. Berthoz, N.; Branque, D.; Subrin, D.; Wong, H.; Humbert, E. Face failure in homogeneous and stratified soft ground: Theoretical and experimental approaches on 1 g EPBS reduced scale model. Tunn. Undergr. Space Technol. 2012, 30, 25–37. [Google Scholar] [CrossRef]
  5. Leung, C.; Meguid, M.A. An experimental study of the effect of local contact loss on the earth pressure distribution on existing tunnel linings. Tunn. Undergr. Space Technol. 2011, 26, 139–145. [Google Scholar] [CrossRef]
  6. Zhang, M.; Li, S.; Li, P. Numerical analysis of ground displacement and segmental stress and influence of yaw excavation loadings for a curved shield tunnel. Comput. Geotech. 2020, 118, 103325. [Google Scholar] [CrossRef]
  7. Zhang, C.; Cai, Y.; Zhu, W. Numerical Study and Field Monitoring of the Ground Deformation Induced by Large Slurry Shield Tunnelling in Sandy Cobble Ground. Adv. Civ. Eng. 2019, 2019, 1–12. [Google Scholar] [CrossRef] [Green Version]
  8. Avgerinos, V.; Potts, D.M.; Standing, J.R. Numerical investigation of the effects of tunnelling on existing tunnels. Geotechnique 2017, 67, 808–822. [Google Scholar] [CrossRef]
  9. Lavasan, A.A.; Zhao, C.; Barciaga, T.; Schaufler, A.; Steeb, H.; Schanz, T. Numerical investigation of tunneling in saturated soil: The role of construction and operation periods. Acta Geotech. 2017, 13, 671–691. [Google Scholar] [CrossRef]
  10. Do, N.-A.; Dias, D.; Oreste, P. 3D numerical investigation of mechanized twin tunnels in soft ground—Influence of lagging distance between two tunnel faces. Eng. Struct. 2016, 109, 117–125. [Google Scholar] [CrossRef]
  11. Hong, Y.; Soomro, M.A.; Ng, C.W.W.; Wang, L.Z.; Yan, J.J.; Li, B. Tunnelling under pile groups and rafts: Numerical parametric study on tension effects. Comput. Geotech. 2015, 68, 54–65. [Google Scholar] [CrossRef]
  12. Do, N.-A.; Dias, D.; Oreste, P.; Djeran-Maigre, I. Three-dimensional numerical simulation of a mechanized twin tunnels in soft ground. Tunn. Undergr. Space Technol. 2014, 42, 40–51. [Google Scholar] [CrossRef]
  13. Liu, H.Y.; Small, J.C.; Carter, J.P. Full 3D modelling for effects of tunnelling on existing support systems in the Sydney region. Tunn. Undergr. Space Technol. 2008, 23, 399–420. [Google Scholar] [CrossRef]
  14. Chehade, F.H.; Shahrour, I. Numerical analysis of the interaction between twin-tunnels: Influence of the relative position and construction procedure. Tunn. Undergr. Space Technol. 2008, 23, 210–214. [Google Scholar] [CrossRef]
  15. Li, S.; Li, P.; Zhang, M.; Liu, Y. Influence of Approaching Excavation on Adjacent Segments for Twin Tunnels. Appl. Sci. 2019, 10, 98. [Google Scholar] [CrossRef] [Green Version]
  16. Qiao, X.; Liu, W. Study on the Horizontal Axis Deviation of a Small Radius TBM Tunnel Based on Winkler Foundation Model. Appl. Sci. 2020, 10, 784. [Google Scholar] [CrossRef] [Green Version]
  17. Marshall, A.M.; Haji, T. An analytical study of tunnel–pile interaction. Tunn. Undergr. Space Technol. 2015, 45, 43–51. [Google Scholar] [CrossRef] [Green Version]
  18. Camós, C.; Molins, C. 3D analytical prediction of building damage due to ground subsidence produced by tunneling. Tunn. Undergr. Space Technol. 2015, 50, 424–437. [Google Scholar] [CrossRef] [Green Version]
  19. Cao, Y.; Jiang, J.; Xie, K.-H.; Huang, W.-M. Analytical solutions for nonlinear consolidation of soft soil around a shield tunnel with idealized sealing linings. Comput. Geotech. 2014, 61, 144–152. [Google Scholar] [CrossRef]
  20. Pinto, F.; Whittle, A. Ground Movements due to Shallow Tunnels in Soft Ground. I: Analytical Solutions. J. Geotech. Geoenviron. 2014, 140, 04013040. [Google Scholar] [CrossRef] [Green Version]
  21. Fahimifar, A.; Zareifard, M.R. A theoretical solution for analysis of tunnels below groundwater considering the hydraulic-mechanical coupling. Tunn. Undergr. Space Technol. 2009, 24, 634–646. [Google Scholar] [CrossRef]
  22. Osman, A.S.; Bolton, M.D.; Mair, R.J. Predicting 2D ground movements around tunnels in undrained clay. Geotechnique 2006, 56, 597–604. [Google Scholar] [CrossRef] [Green Version]
  23. Pham, A.T.; Sugimoto, M. The Effects of Tangential Ground-Lining Interaction on Segmental Lining Behavior Using the Beam-Spring Model. Appl. Sci. 2020, 10, 1084. [Google Scholar] [CrossRef] [Green Version]
  24. Mooney, M.A.; Grasmick, J.; Kenneally, B.; Fang, Y. The role of slurry TBM parameters on ground deformation: Field results and computational modelling. Tunn. Undergr. Space Technol. 2016, 57, 257–264. [Google Scholar] [CrossRef]
  25. Fargnoli, V.; Boldini, D.; Amorosi, A. Twin tunnel excavation in coarse grained soils: Observations and numerical back-predictions under free field conditions and in presence of a surface structure. Tunn. Undergr. Space Technol. 2015, 49, 454–469. [Google Scholar] [CrossRef]
  26. Li, Q. Long-Term Settlement Mechanisms of Shield Tunnels in Shanghai Soft Clay. Ph.D. Thesis, Hong Kong University of Science and Technology, Hong Kong, China, 2013. [Google Scholar]
  27. Standing, J.R.; Selemetas, D. Greenfield ground response to EPBM tunnelling in London Clay. Geotechnique 2013, 63, 989–1007. [Google Scholar] [CrossRef]
  28. Sun, Y.; Xu, Y.-S.; Shen, S.-L.; Sun, W.-J. Field performance of underground structures during shield tunnel construction. Tunn. Undergr. Space Technol. 2012, 28, 272–277. [Google Scholar] [CrossRef]
  29. Wongsaroj, J.; Soga, K.; Mair, R.J. Modelling of long-term ground response to tunnelling under St James’s Park, London. Geotechnique 2007, 57, 75–90. [Google Scholar] [CrossRef]
  30. Bezuijen, A.; Talmon, A.; Kaalberg, F.; Plugge, R. Field measurements of grout pressures during tunnelling of the Sophia rail tunnel. Soils Found. 2004, 44, 39–48. [Google Scholar] [CrossRef] [Green Version]
  31. Ge, X. Response of a Shield-Driven Tunnel to Deep Excavations in Soft Clay. Ph.D. Thesis, Hong Kong University of Science and Technology, Hong Kong, China, 2002. [Google Scholar]
  32. Peck, B. Deep Excavations and Tunneling in Soft Ground. In Proceedings of the 7th International Conference on Soil Mechanics and Foundation Engineering, Mexico City, Mexico, 1969; Volume 1, pp. 225–290. [Google Scholar]
  33. Liu, C.; Zhang, Z.X.; Kwok, C.Y.; Jiang, H.Q.; Teng, L. Ground responses to tunneling in soft soil using the URUP method. J. Geotech. Geoenviron. 2017, 143, 04017023. [Google Scholar] [CrossRef]
  34. Zhang, Z.X.; Liu, C.; Huang, X.; Kwok, C.Y.; Teng, L. Three-dimensional finite-element analysis on ground responses during twin-tunnel construction using the URUP method. Tunn. Undergr. Space Technol. 2016, 58, 133–146. [Google Scholar] [CrossRef] [Green Version]
  35. Hamdy, H.A.; Enieb, M.; Abdelmoamen Khalil, A.; Ahmed, A.S.H. Twin tunnel configuration for Greater Cairo metro line No. 4. Comput. Geotech. 2015, 68, 66–77. [Google Scholar]
  36. Gan, X.; Yu, J.; Gong, X.; Zhu, M. Characteristics and Countermeasures of Tunnel Heave due to Large-Diameter Shield Tunneling Underneath. J. Perform. Constr. Facil. 2020, 34, 04019081. [Google Scholar] [CrossRef]
  37. Zick, P.; Sugihara, H.; Takatoku, Y.; Sada, S. URUP (Ultra Rapid Underpass)—TBM excavation in soft ground from the surface elevation (zero overburden) without shaft and/or large scaled open cut pit. In Proceedings of the Transportation Research Board 92nd Annual Meeting, Washington, DC, USA, 13–17 January 2013; pp. 13–1080. [Google Scholar]
  38. Fujiki, H.; Nakamura, T.; Izawa, M. URUP (Ultra rapid Under Pass) method—The first Shield Tunneling method for launching and arrival at the ground level. In Proceedings of the World Tunneling Congress, Budapest, Hungary, 23–28 May 2009; pp. 112–116. [Google Scholar]
  39. Hayashi, M.; Miki, K.; Yokomizo, F.; Yoshida, M.; Izawa, M. The demonstration work of URUP method. In Proceedings of the 61st Annual Conference of Japan Society of Civil Engineers, Shiga Prefecture, Japan, 20 September 2006; pp. 485–486. [Google Scholar]
  40. Chen, J.S.; Mo, H.H. Numerical study on crack problems in segments of shield tunnel using finite element method. Tunn. Undergr. Space Technol. 2009, 24, 91–102. [Google Scholar] [CrossRef]
  41. Yang, Y.; Zhou, B.; Xie, X.; Liu, C. Characteristics and causes of cracking and damage of shield tunnel segmented lining in construction stage—A case study in Shanghai soft soil. Eur. J. Environ. Civil. Eng. 2017, 1–15. [Google Scholar] [CrossRef]
  42. Chen, W.; Jeng, D.; Chen, W.; Chen, G.; Zhao, H. Seismic-induced dynamic responses in a poro-elastic seabed: Solutions of different formulations. Soil Dyn. Earthq. Eng. 2020, 131, 106021. [Google Scholar] [CrossRef]
  43. Abaqus/CAE User’s Guide; Abaqus Software: Providence, RI, USA, 2010.
  44. Liu, W.; Xu, M.; Chen, Z.F. Parameters calibration and verification of concrete damage plasticity model of ABAQUS. Ind. Constr. 2014, 44, 167–171, 213. (In Chinese) [Google Scholar]
  45. Birtel, V.; Mark, P. Parameterised Finite Element Modelling of RC Beam Shear Failure. In Proceedings of the 19th Annual International ABAQUS Users’ Conference, Boston, MA, USA, 23–25 May 2006; pp. 95–108. [Google Scholar]
  46. Kasper, T.; Meschke, G. A 3D finite element simulation model for TBM tunnelling in soft ground. Int. J. Numer. Anal. Met. 2004, 28, 1441–1460. [Google Scholar] [CrossRef]
  47. Lin, X.T.; Chen, R.P.; Wu, H.N.; Cheng, H.Z. Three-dimensional stress-transfer mechanism and soil arching evolution induced by shield tunneling in sandy ground. Tunn. Undergr. Space Technol. 2019, 93, 13. [Google Scholar] [CrossRef]
Figure 1. Project location.
Applsci 10 03746 g001
Figure 2. Geological profile of the ultra-rapid underground pass (URUP) tunnel: (a) tunnel of east bound; and (b) tunnel of west bound (redrawn after [34]).
Applsci 10 03746 g002aApplsci 10 03746 g002b
Figure 3. Overview of the URUP tunneling procedure.
Applsci 10 03746 g003
Figure 4. Rebar stress meters (RSMs) arrangement: (a) measurement point arrangement; (b) arrangement of each segment; and (c) welded RSMs prior to segment cast.
Applsci 10 03746 g004aApplsci 10 03746 g004b
Figure 5. Geometry of the finite element analysis (FEA) model (redrawn after [34]).
Applsci 10 03746 g005
Figure 6. FEA modelling procedure: (a) step 1; (b) non-uniform contraction applied at the TBM boundary; and (c) activation of lining and grouting layer (redrawn after [34]).
Applsci 10 03746 g006aApplsci 10 03746 g006b
Figure 7. Results of field measurement and FEA modelling: (a) WR39, L = 1.2 m; (b) WR39, L = 2.4 m; (c) WR40, L = 1.2 m; and (d) WR40, L = 2.4 m.
Applsci 10 03746 g007aApplsci 10 03746 g007b
Figure 8. Illustration of the studied region: (a) the area of grouting pressure; (b) the area of supporting pressure.
Applsci 10 03746 g008
Figure 9. Surface settlement: (a) the cases with different grouting pressures; (b) the cases with different face supporting pressures.
Applsci 10 03746 g009aApplsci 10 03746 g009b
Figure 10. Lateral displacement of the lining under different grouting pressures.
Applsci 10 03746 g010
Figure 11. Vertical displacement of the lining under different supporting pressures.
Applsci 10 03746 g011
Figure 12. Convergence of ER60 in different cases: (a) influence of grouting pressure on ER60 convergence; (b) influence of face supporting pressure on ER60 convergence.
Applsci 10 03746 g012aApplsci 10 03746 g012b
Figure 13. Moment of E60 (C/D = 0.648) under different cases: (a) under different grouting pressures; (b) under different supporting pressures.
Applsci 10 03746 g013
Figure 14. Influence of grouting pressure on lining bending moment in different cases: (a) the minimum negative bending moment at ER60 top; and (b) the maximum positive bending moment at ER60 sidewall.
Applsci 10 03746 g014
Figure 15. Influence of the face supporting pressure on the lining bending moment in different cases: (a) influence on the bending moment at the tunnel side-wall; and (b) influence on the bending moment at the tunnel top.
Applsci 10 03746 g015aApplsci 10 03746 g015b
Table 1. Material parameters of FEA model [34].
ρ ( k g m 3 ) E ( M P a ) ν β d ( k P a ) K e 0
2 1.39150.3031.942.80.8281.031
1 b 1 1.37250.2723.955.20.8710.99
J 311 1.57250.2532.9110.80.8220.7
J 312 2.23600.20 0.5
J 313 2.542.1 × 10−30.21 0.3
Lining2.53.61 × 10−40.20
Grout1.950.40
Note: ρ : soil density; E : elastic modulus; ν : Poisson’s ration; β: inclination angle of yield surface in p t stress space; d : intercept of t axis of yield surface in p t stress space; K : flow stress ratio; e 0 : initial void ratio.
Table 2. Parameters used in presented FEA model [34].
K 0 Grouting Pressure at Tunnel CrownGrouting Pressure Gradient (kN/m)Ground Contraction δ (mm)
0.4Earth pressure7Non-uniform6
Note: K 0 denotes the lateral earth pressure coefficient used for determining the supporting pressure at the tunnel face.
Table 3. Demonstration of the coefficients used in parametric study.
Case K g K s
011
10.61
20.81
31.21
41.41
510.6
610.8
711.2
811.4
Table 4. Parameters of each lognormal fitting curve.
Fitting CurvesM0KcwAR2
1104.80.8250.3061.1540.9961
2104.30.8300.3371.2030.9983
3104.10.8240.3251.0410.9942
4103.50.8550.3461.0910.9881
5102.40.9390.3701.4100.9985
6101.70.9110.3140.9640.9950
7101.70.8840.4001.1950.9999
899.90.8261.0933.1120.9993
9−85.20.7110.455−1.9770.9999
10−85.40.7120.497−1.9830.9996
11−85.20.7160.510−1.9930.9995
12−84.50.7480.577−2.3790.9998
13−83.70.7880.597−2.4420.9994
14−82.50.8350.603−2.3790.9999
15−81.40.8510.610−2.0690.9999
Note: M0, Kc, w, A, R2 are the offset, center, width, amplitude, and similarity of lognormal fitting curves, respectively.

