Article

Effects of Soil Conditioning on Characteristics of a Clay-Sand-Gravel Mixed Soil Based on Laboratory Test
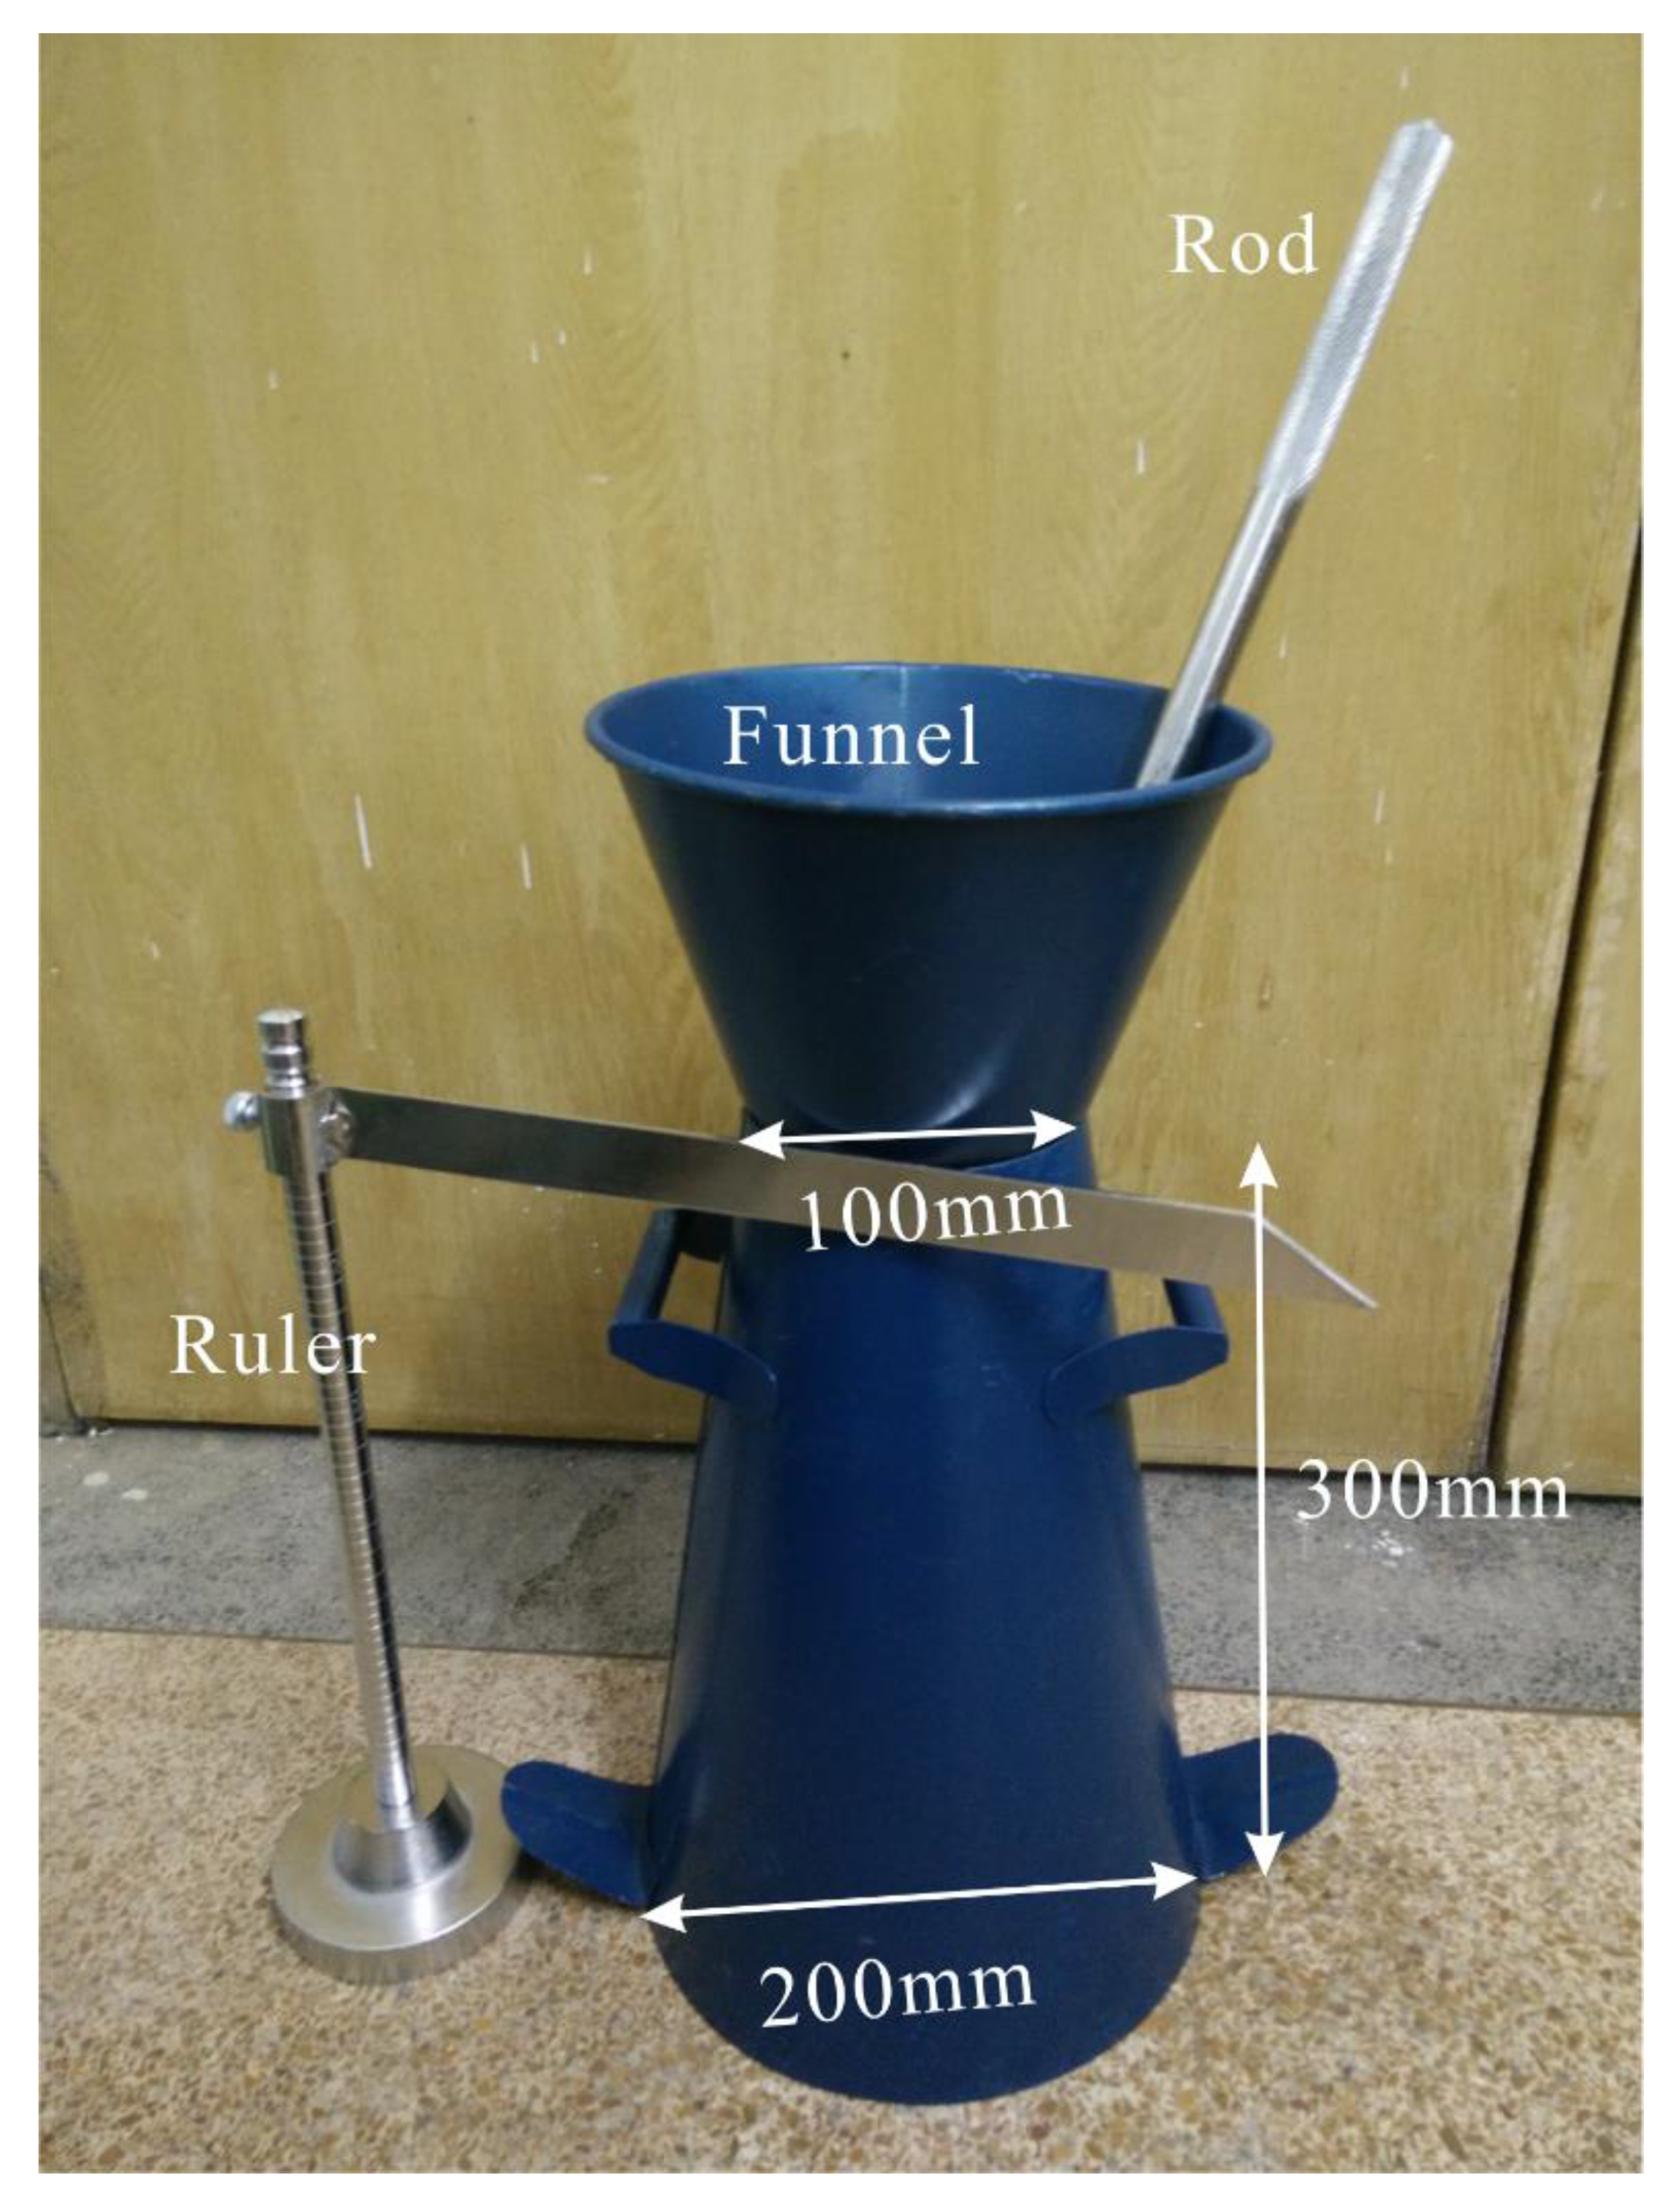
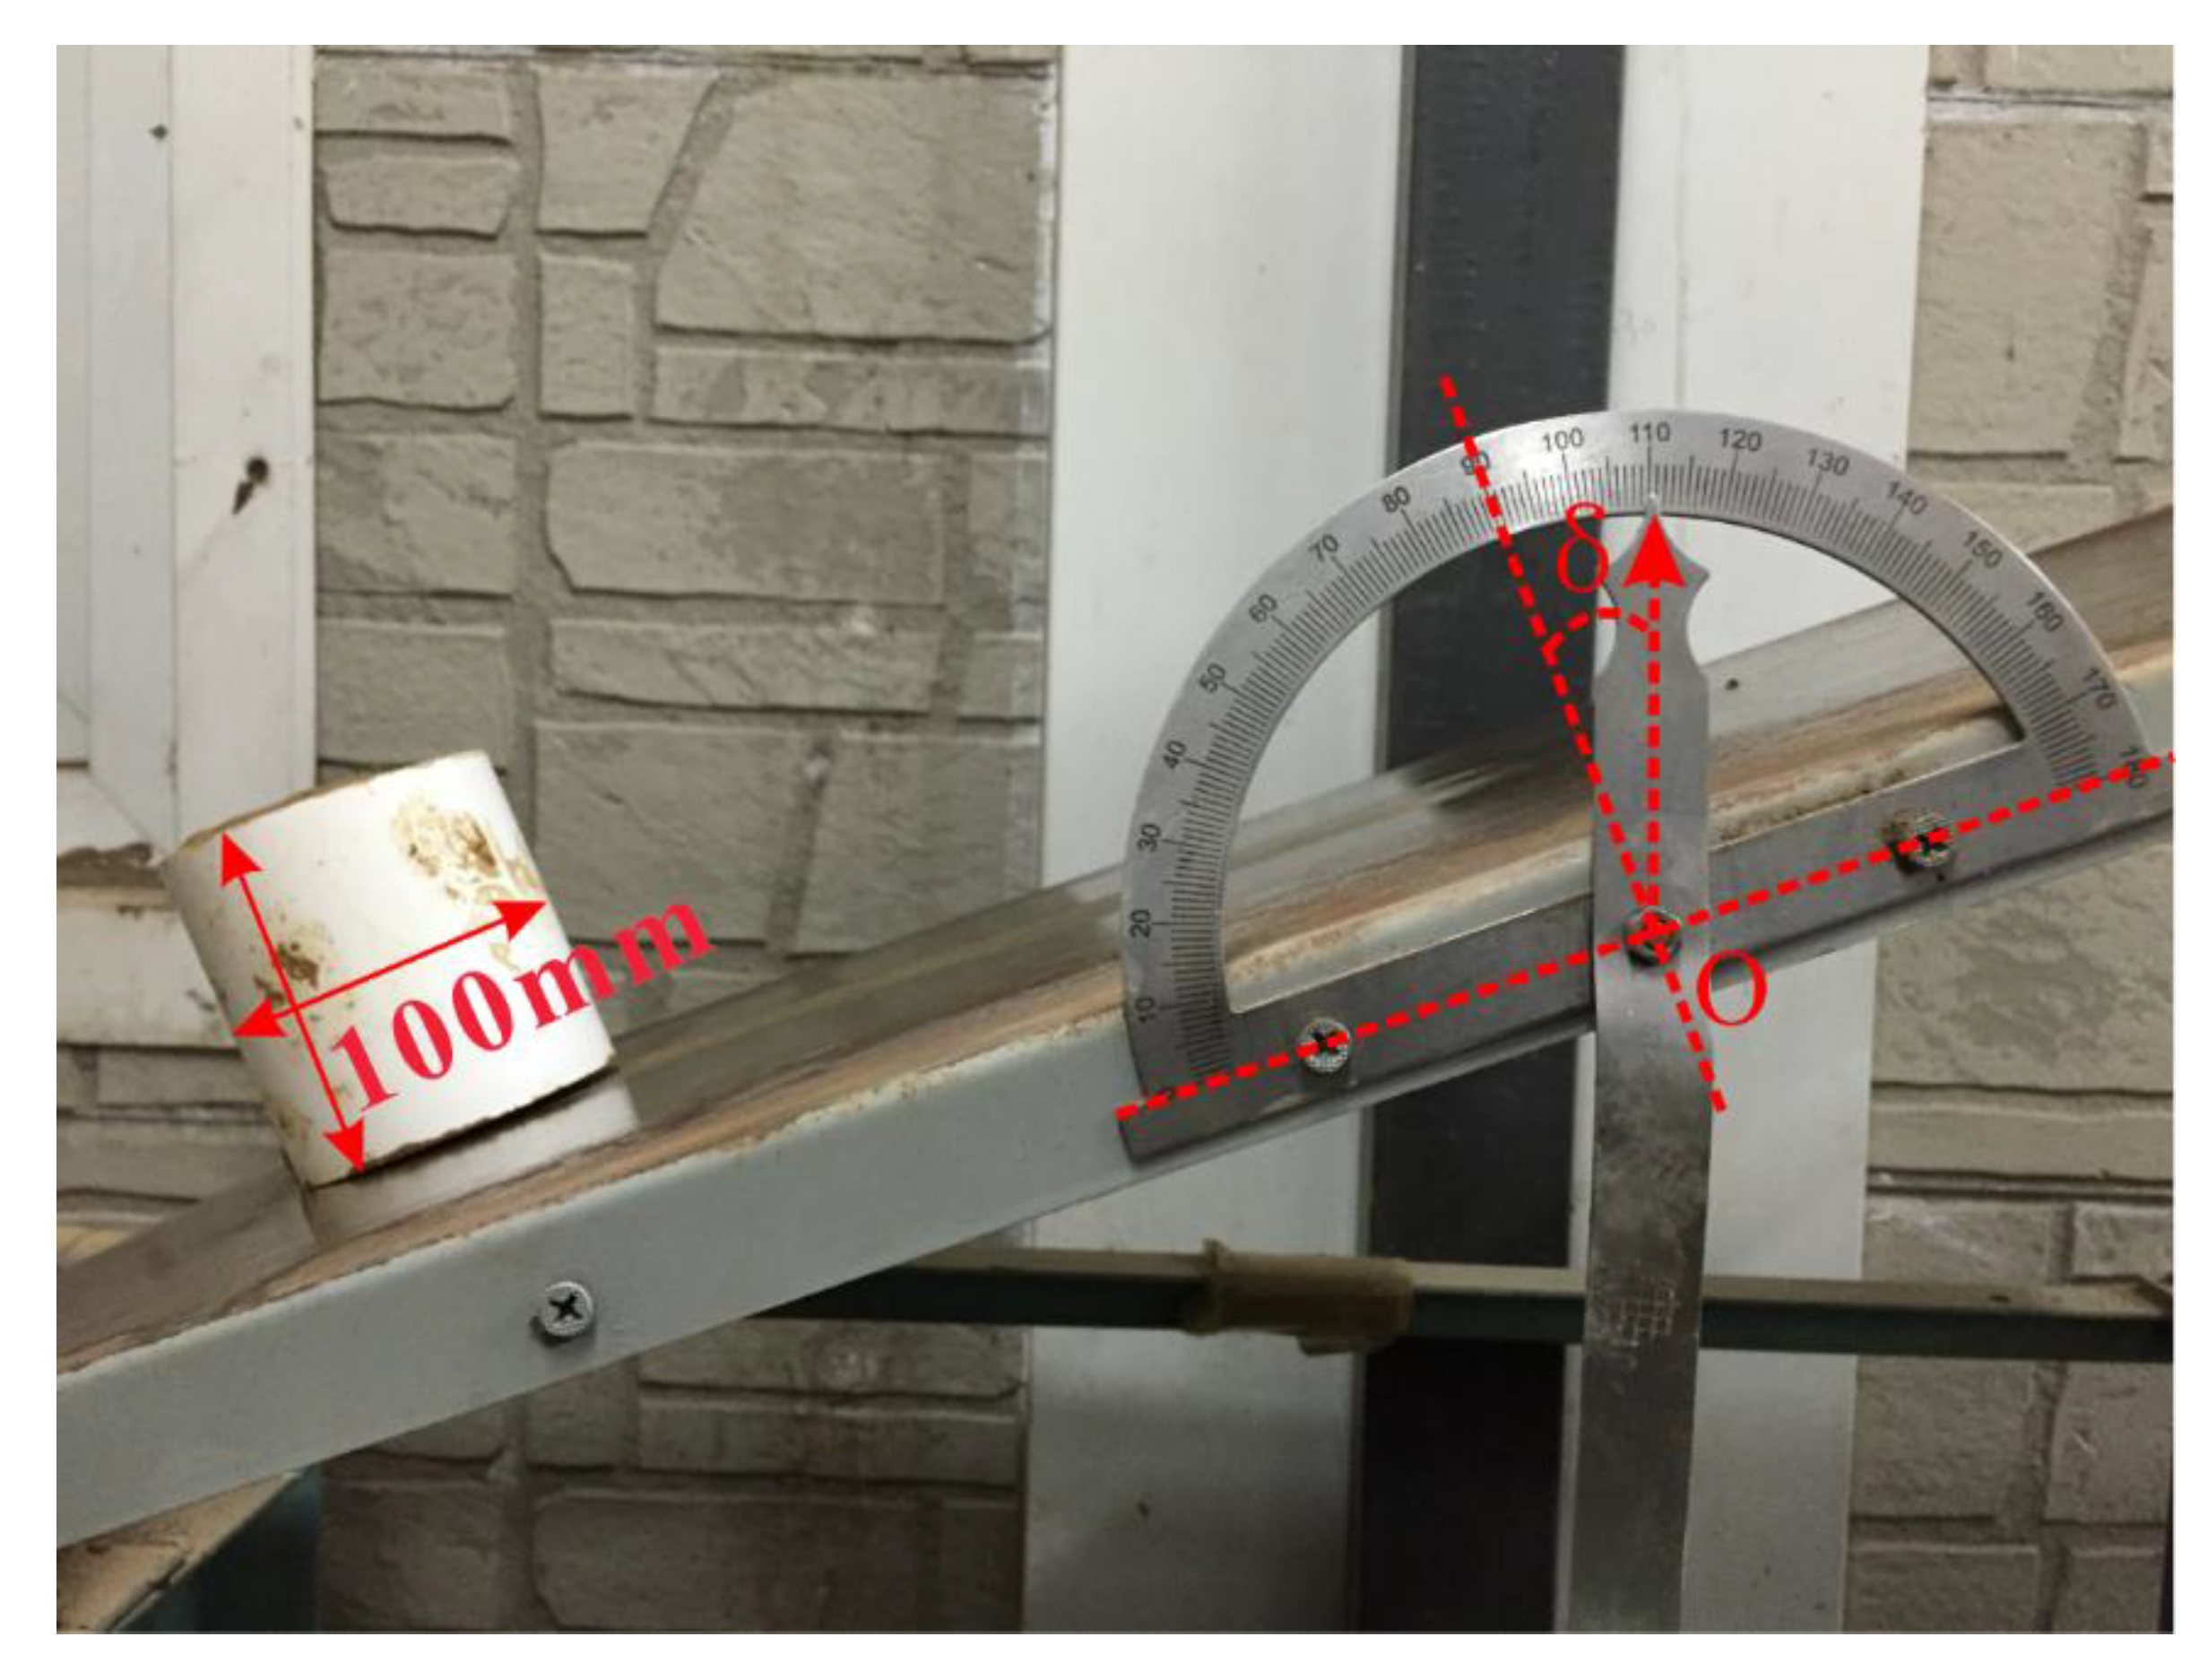
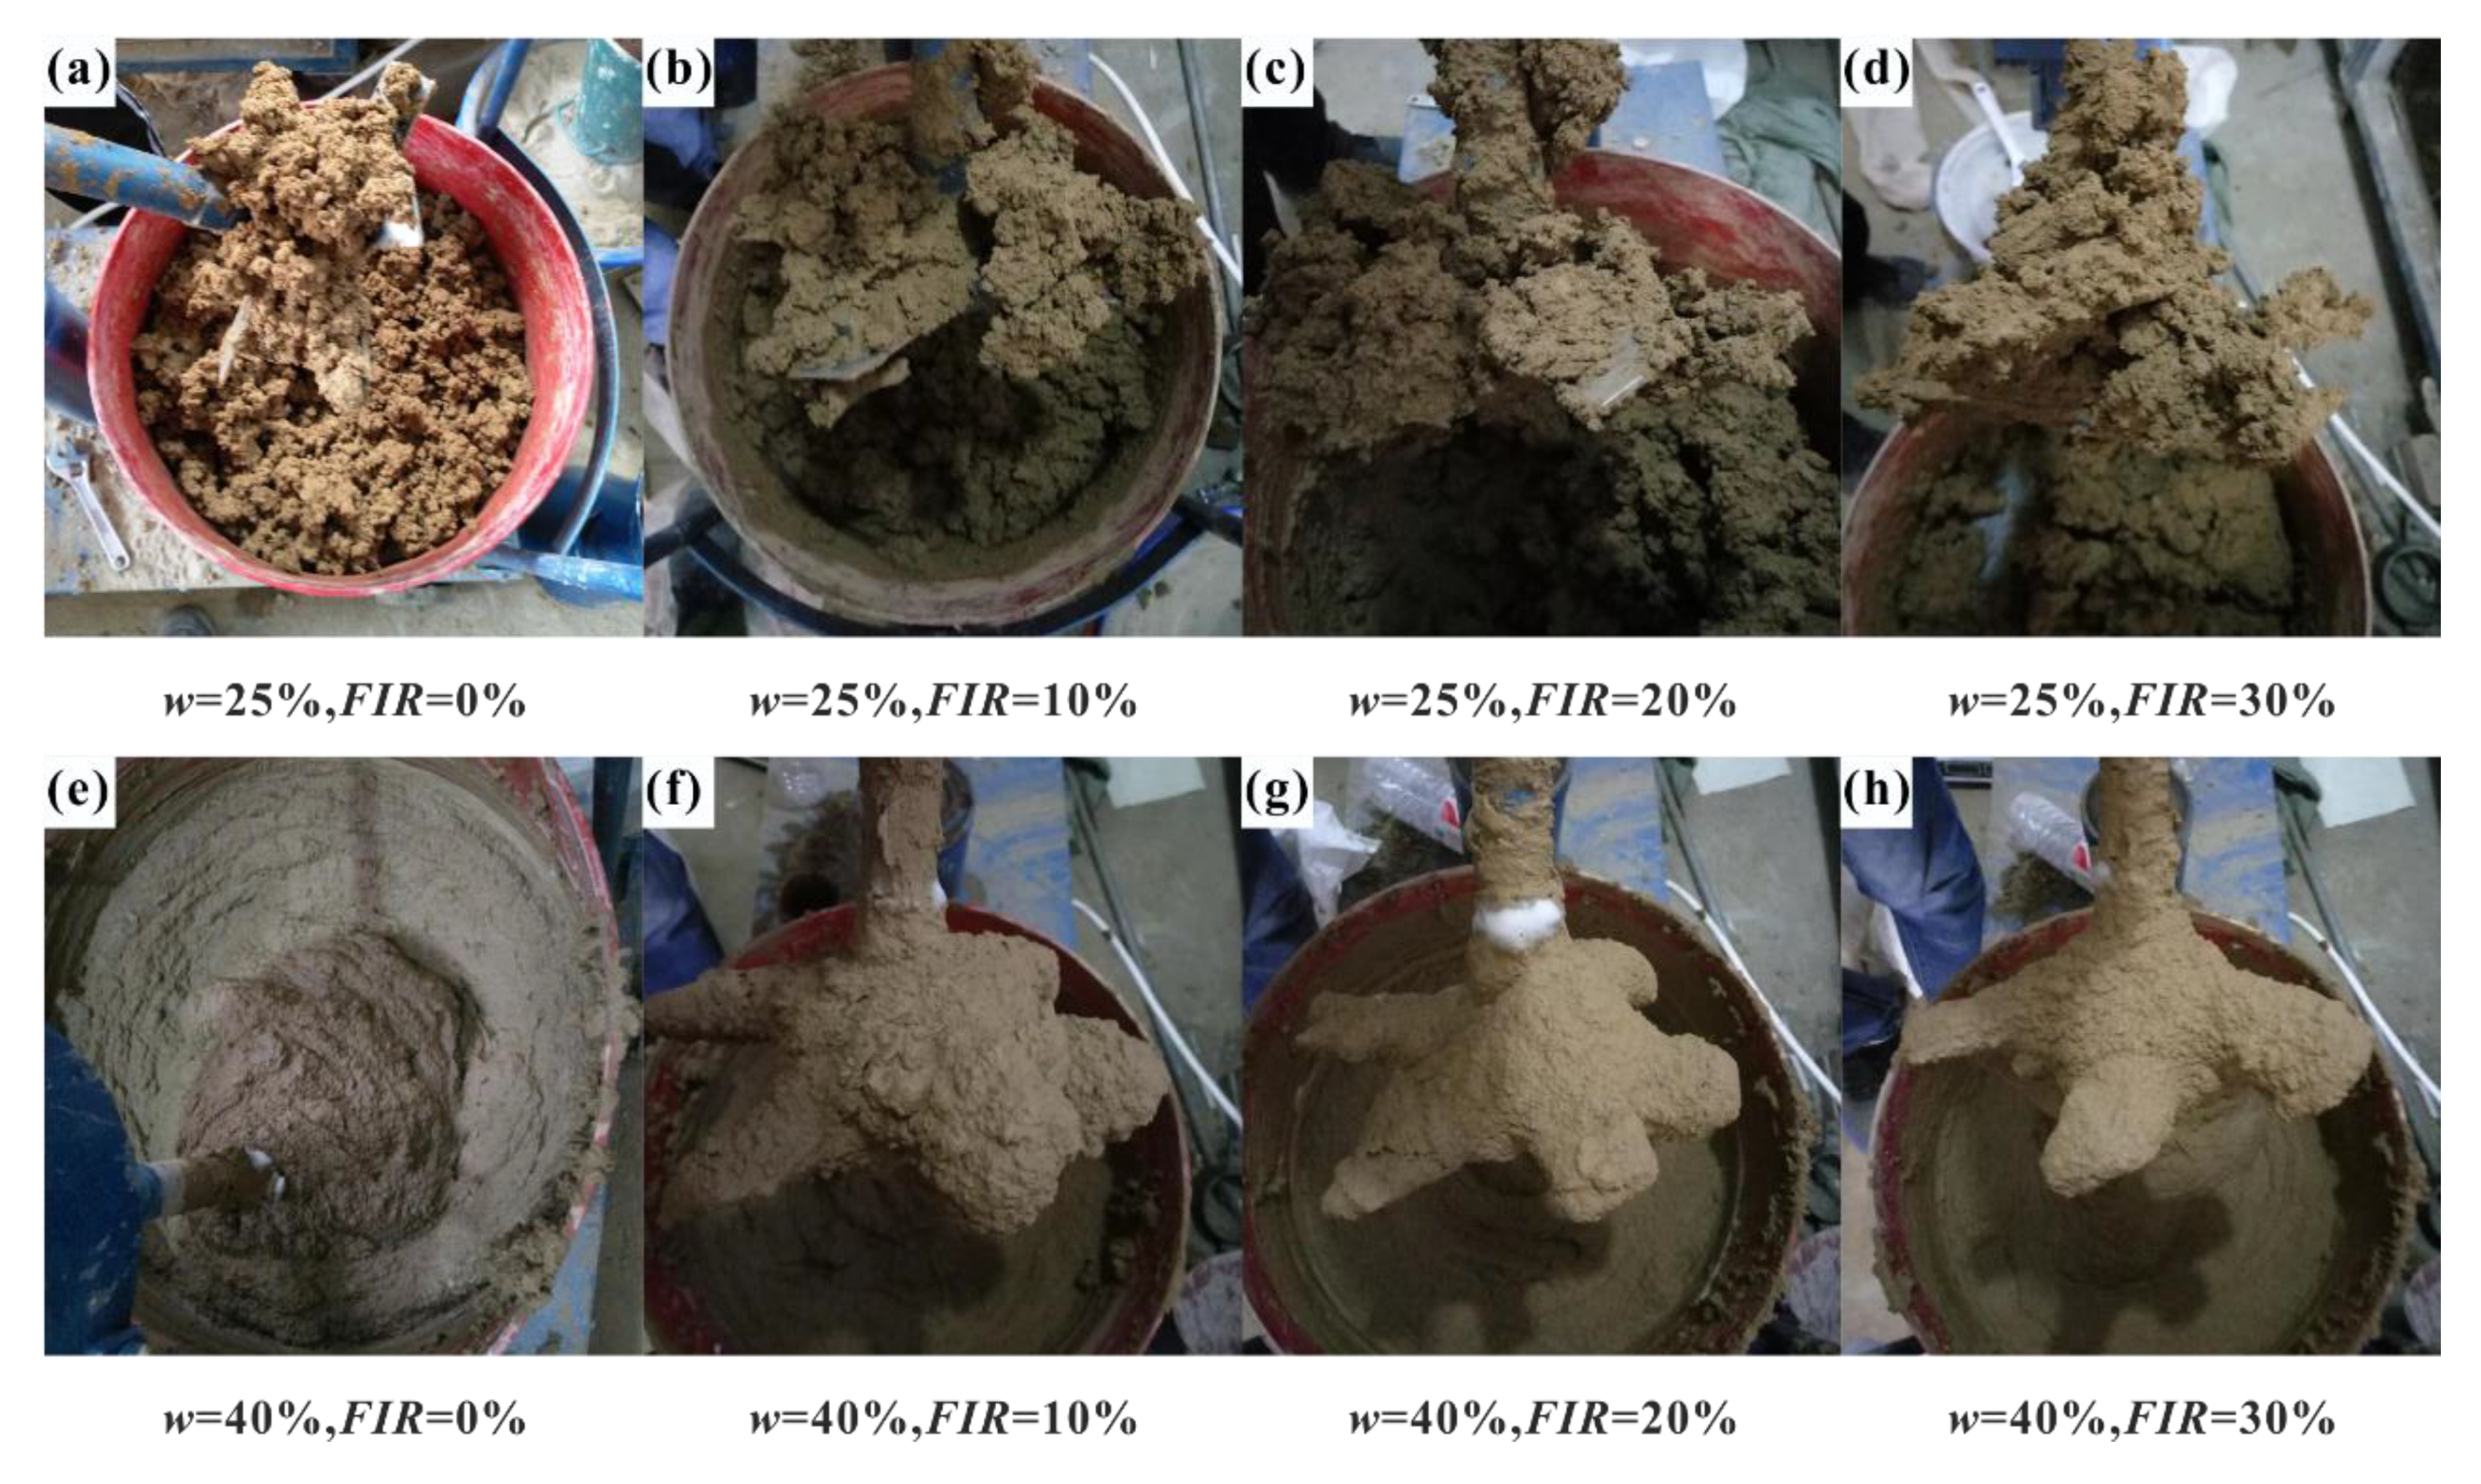
1
State Key Laboratory of Hydroscience and Engineering, Tsinghua University, Beijing 100084, China
2
AVIC Institute of Geotechnical Engineering Co., LTD., Beijing 100098, China
3
School of Engineering and Technology, China University of Geosciences (Beijing), Beijing 100083, China
*
Author to whom correspondence should be addressed.
Appl. Sci. 2020, 10(9), 3300; https://doi.org/10.3390/app10093300
Submission received: 22 April 2020 / Revised: 7 May 2020 / Accepted: 7 May 2020 / Published: 9 May 2020
(This article belongs to the Special Issue Advances in Geotechnical Engineering)

Abstract

:
Soil conditioning is of great significance for tunneling in soft ground with earth pressure balance shield (EPBS) machines, which leads to safe, highly efficient, and high-quality tunneling. To study the effects of soil conditioning on properties of a clay-sand-gravel mixed soil encountered in an EPBS tunneling project in Beijing, a series of geotechnical test methods was carried out based on laboratory test in this paper. The decay behaviors of foam particles generated by the Waring-Blender method were studied first using the image particle analysis system, and then the feasibility of soil conditioning on the mixed soil was qualitatively and quantitatively assessed through the mixing test, slump test, and friction coefficient test. The preliminary test results indicate that drainage of water in liquid film plays an important role in the decay of foam microstructure. The viscosity and flowability of the conditioned soil were modified dramatically by using various amount of water and foam, and a suitable state meeting the requirement of EPBS machines was obtained. The net power and mixing time, which reflects the interaction between the blending rods and tested soils, as well as the slump value, providing the overall indication for liquidity of the conditioned soils, and friction coefficient, reflecting the friction between steel and tested soils, were used to provide insight into the variation in viscosity and flowability of the tested soils.

1. Introduction

For the sustainable development of the big city, developing more underground space is effective, and the development of intensive tunnels, including metro tunnels, road tunnels, and utility tunnels, is carried out throughout the world. Earth pressure balance shield (EPBS) machines, which were originally developed and used in a close mode for fine grained soils or mixed grained soils with at least 30 wt.% fines (d < 0.06 mm) [1,2], have been extensively used in various tunnels because of their high security in driving, high efficiency in tunneling, and high feasibility in stratums. EPBS machines achieve stability of tunnel face by filling the chamber and applying chamber pressure at the back of cutterhead [3], and they have been used in many kinds of excavation soils with complicated characteristics, such as caking property of clayed soils [4], looseness of sandy soils [5], and abrasivity of gravelly soils [6]. Many studies on the application of soil conditioning in various given soils have been carried out in recent years. Today, EPBS tunneling is possible through almost all geological conditions, and more and more EPBS machines work in mixed ground due to their large excavation diameter [7] thanks to the application of the soil conditioning system and soil conditioning agents.
Soil conditioning, which is often done by injecting water, foam, bentonite slurry, or polymer in the excavation face, soil chamber, and screw conveyor during EPBS tunneling [8], is used to improve the stability of tunnel face and then minimize the deformation of ground surface, reduce cutting tools wear, and discharge the excavated soils smoothly [9,10]. The torque of cutterhead and the thrust of EPBS machines increases even if the screw conveyor does not work when the soil chamber and the screw conveyor are filled with excavated soils [11]. The workability of the excavated soils is improved dramatically after the mixing caused by cutters and cutterhead in tunnel face and stirring caused by rods in soil chamber. For soil conditioners, water is a common conditioner which is very easy to access. Foam agent is a widely used soil conditioner, and bentonite slurry are usually used to modify the grain size distribution of the excavated soils with unfavorable particle composition for EPBS tunneling [12]. For challenging geological conditions, in which the use of water is insufficient, foam and slurry, the structuring and water-binding polymers, are warranted to increase the muck cohesion and decrease permeability, respectively [7]. Foam produced by chemical products, named surfactants or surface-active agents, is usually used in two fields of underground works, including cellular concrete and drilling operations, although the industrial applications of foam are various [13]. In most cases, it is necessary to mix the excavated soils with some soil conditioners to modify the original characteristics of the natural soils to meet the requirement of EPBS machines. In order to obtain and evaluate the state and properties of the conditioned soils for various purposes, a series of evaluation methods were proposed, such as a mixing test, slump test, friction coefficient test, adhesive resistance test, penetration test, and compressibility test.
Among these tests, the mixing test is used to imitate the real mixing process in the soil chamber [14], and it is necessary to mix the soil conditioner with the tested soils in laboratory tests [15]. The variation of the electric motor power, the mixing time necessary to obtain a homogeneous mixture, and the quality and behavior of the mixture could be observed and evaluated during the evolution of the foam injection in the tested soil [13]. Some mixing tests have been carried out in previous studies [14,15,16]. The slump test [17], which is originally used for concrete materials, has been intensively used to evaluate the characteristics of conditioned soils in EPBS tunneling [3,5,12,13,14,16,18,19,20,21,22]. For the flowability of conditioned soils, slump values in the range of 100–200 mm are accepted and considered reasonable in soft ground tunneling [2,3,18,19], which means that the overall state of conditioned soils meets the requirement of EPBS machines during tunneling, and the EPBS machines could advance smoothly. The friction coefficient test, imitating the friction process of soil and steel, is used to obtain the frictional coefficient by measuring the friction angle between soil and steel or angle of external friction [14], which also reflects the effect of soil conditioning on the tested soils. The mixing test, slump test, and friction coefficient test are widely used in evaluating of properties of conditioned soils in laboratory-scale tests because of their simplicity, speed, and low cost.
EPBS machines, which were originally used for fine-grained or mixed -rained soils with at least 30 wt.% fines (d < 0.06 mm), have been proved to be applicable for coarse-grained and cohesionless soils by the utilization of soil conditioning, such as sand [19], rock masses [20], tar sand [12], weathered granite soil [3], and so forth. The current research mainly focused on the soil conditioning in single soils, while the feasibility of excavation soils from mix ground composed of cohesive soil and cohesionless soil have rarely been investigated to date, which is more difficult to resolve in EPBS tunneling. The characteristics of the mixed soil, which is abundant in large-diameter EPBS tunneling, are different from those of either clay or sand, as the conditioning agents applicable to single soils cannot be directly used in mixed soils. There are still some knowledge gaps in the application of soil conditioning in mixed soils.
This article presents an experimental investigation of effects of common foam and water on the characteristics of a mixed soil consisting of silty clay, fine-medium sand, and sandy gravel, from an EPBS tunneling project in Beijing. The microstructure of the foam particle was first investigated to explore the decay mechanism, followed by the description of the evaluation methods, testing procedures, and tested soil used in this study. After that, the detailed results and discussion of the laboratory tests, which demonstrates the effect of the soil conditioning, are presented.

2. Methods and Materials

2.1. Image Particle Analysis System

Foam was defined as a physical state in which a gaseous phase is dispersed in bubble form in a second liquid phase [13]. In order to obtain the decay behaviors of the used foam, the BT-1600-type image particle analysis system, which is the production of combing traditional microscopic methods with modern image processing techniques, was used to observe the variation in foam microstructure with time. The BT-1600-type image particle analysis system is a multifunctional particle analysis system consisting of optical microscope, digital charge coupled device (CCD) camera, image processing and analysis software, and so on. The test procedure is as follows: (1) The generated foam was dripped on the glass slide; (2) the dripped foam was covered with a coverslip immediately to obtain a thin foam layer; (3) videos and photos were taken under the condition of the microscope with 10-times eyepiece and 4-times objective lens magnification for 60 min; (4) the particle images were transferred to a computer using USB data transmission and the images were analyzed using special particle image analysis software; (5) the results were exported using the display and printer.

2.2. Mixing Test

To mix foam with tested soils and preliminarily obtain the flowability state of conditioned soils, a mixing tester with electric power meter was used in this study. The device consists of a vertically oriented steel cylindrical chamber with 385 mm in inner diameter and 255 mm in height, as shown in Figure 1. A rod with eight steel sheets driven by an electric motor can rotate inside the vertical container. The mixer has the capability of mixing water and foam with tested soils. The tested soils were mixed with soil conditioning agents according to the following procedure: (1) A quantity of 25 kg of mixed soils was first placed in the cylinder container; (2) water with the designed injection ratio was added into the soil and mixed thoroughly; (3) the generated foam with the required concentration of foam agent (Cf), foam expansion ratio (FER), and foam injection ratio (FIR) was added to soil samples; (4) the mixture was blended for 2 min and the mixing time necessary to obtain a homogeneous mixture without apparent foam. The electric motor power used for the mixing process and pictures of conditioned state after pulling up of the stirring rod, were recorded, monitored, and taken for each test.

2.3. Slump Test

After the mechanical mixing tests, slump tests were carried out to provide an overall indication of the flowability of the fully conditioned soil. A standard slump cone with 100 mm in diameter of top opening, 200 mm in diameter of bottom opening, and 300 mm in height was used, as shown in Figure 2. The procedure of the slump test is as follows: (1) The slump cone was filled three times, that is, to the height of 1/3, 2/3, and 3/3, respectively; (2) the filled soil was tamped after each fill; (3) the soil was flatted at the top opening and the cone was lifted slowly; (4) the dropping height of the tested materials was measured.

2.4. Friction Coefficient Test

To study the effect of soil conditioning on the viscosity of the conditioned soil, the friction coefficient between soil and steel was tested by measuring the friction angle using the friction coefficient test. The procedure of the friction coefficient test is as follows: (1) A plastic cylinder with an inner diameter of 100 mm and height of 100 mm was filled with soil samples and then it was placed on the flat steel plate; (2) one end of the plate was lifted up slowly and the angle on the angle dial was recorded when the cylinder starts to move, as shown in Figure 3; (3) the friction coefficient was obtained by the following equation:
f = tan δ
where f is the friction coefficient, and δ is the friction angle between soil and steel (°)

3. Soil Samples and Foam Agent Used in Experiments

A mixed soil consisting of silty clay, fine-medium sand, and sandy gravel, with a volume proportion of 2:2:1 encountered in an EPBS tunneling projects in Beijing, was used in this study. The selected properties of the soil were tested based on GB/T 50123 [23] and are listed in Table 1. For silty clay, X-ray diffraction tests were performed to determine the mineral constituent, as shown in Table 2. Figure 4 shows the grain size distribution of the fine-medium sand and sandy gravel. Based on the liquid-plastic limit combined method [23], the plastic limit (WP) and liquid limit (WL) of the silty clay were 30% and 44%, respectively. For the natural silty clay with a water content of 25%, the plasticity index (IP) and liquidity index (IL) were 14% and -0.36, respectively. The gravel particles wrapped by silty clay and sand particles cohere the cutting tools on the cutterhead and it is hard to discharge the mixed soils via screw conveyor. The mechanical behavior of the mixed soil is not suitable for EPBS tunneling. Soil conditioning is needed to modify characteristics of the mixed soil to meet the requirement of EPBS machine. The natural water content of the mixed soil was approximately 25%, and the original water content was set to 25% for a group of soil sample test in this study.
For foam agents, there are two performance indicators which are often used to characterize foaming behaviors and select a foam agent: Foamability and foam stability. Foamability means how many volumes of bubbles with stable structure and moderate size can be produced by a given amount of a foaming agent, which is quantified by the ratio between the resulting volume of the foam and the volume of foaming liquid (foaming agent + water), that is, the foam expansion ratio (FER). Foam stability (or drainage behavior) means how long the foam can remain and how long foamed soils can sustain the desirable properties or behaviors. The half-life period (T1/2), representing the time for half volume of the liquid matrix flowing out of the foam, can be used to characterize the foam stability. There are several important conditioning parameters for foam agent, which are defined as follows [2,15]:
C f = V f V L × 100 ( % )
F E R = V F V L
F I R = V F I R V S × 100 ( % )
where Cf is the concentration of the foaming agent (%), FER is the foam expansion ratio (dimensionless), FIR is the foaming injection ratio (%), Vf is the volume of foaming agent (mL), VF is the volume of foam (mL), VL is the volume of foaming agent and water (mL), and VS is the volume of soil (mL).
In order to obtain the foam during laboratory test, a commonly used method called the Waring-Blender method was used in this study. The procedure of foam production in the Waring-Blender test is as follows: (1) 100 mL foaming liquid (foaming agent + water) with different concentration of foaming agent (Cf, vol.%) was added into a mixer; (2) the foaming liquid was thoroughly mixed for 1 min at a rotational speed of 3000 rpm (revolutions per minute), as shown in Figure 5a. Then, the foamability (i.e., FER) and foam stability (i.e., T1/2) of the generated foam were tested, as shown in Figure 5b. Finally, the foam agent with Cf = 4%, FER = 7 and T1/2 = 30 min under the room temperature of 25 ℃ was used in this study. The generated foam was used for the observation of the microstructure and subsequent evaluation tests of the conditioned soil. The generated foam was added after thoroughly mixing of tested soils and water (see Figure 6a). The foam injection ratios (FIR) were set as 0%, 10%, 20%, and 30% for various soil samples. After that, the injected foam and soil were stirred into a homogeneous mixture (see Figure 6b).

4. Results and Discussions

4.1. Analysis of Decay Behavior of Foam Microstructure

Foam is a gas-liquid two-phase conditioner. The picture of foam microstructure before treatment under 40-times magnification is clearly shown in Figure 7, and the pictures of microstructure under different decay times are shown in Figure 8. The inside nucleus was filled with air and the surface is covered with liquid film. After 0.5 min of decay, the generated bubbles were separated by the thick liquid film full of free water and microbubbles. The shape of bubble particle was approximately circle or oval regardless of bubble size, as shown in Figure 8a. After 5 min of decay, the relatively large size bubbles became bigger, while the relatively small bubbles become smaller gradually until vanishment. The shape of bubbles started to be polygon, especially for large-size bubbles, as shown in Figure 8b. After 10 min of decay, the bubble size further became larger, and the bubbles were firmly attached to each other because of thinner liquid film induced by the loss of free water. The number of bubble particles decreased further on account of the vanishment of microbubbles and small bubbles because of the merger. The shape of the remaining bubbles became polygon, while the pentagon and hexagon were the most common, as shown in Figure 8c. After 15 min, 20 min, 25 min, and 30 min of decay, it can be seen that the bubble size further became larger and the liquid film further became thinner. The liquidity of the bubbles dried up gradually and the bubbles no longer had obvious deformations, as shown in Figure 8d–g. After 60 min of decay, the film was adsorbed and bent by the micro solid body and the bubble structure had all but disappeared (see Figure 8h).
The above phenomena were caused by the drainage of water in liquid film and air fusion among bubbles [16]. The drainage of water in the liquid film was caused by gravity and pressure difference. The free water flowed under the influence of gravity when the liquid film was full of free water. Meanwhile, a plateau boundary was formed at the intersection of adjacent bubbles (see Figure 9a). The movement of free water caused by pressure difference can be expressed by the Laplace equation as follows:
P A P B = σ R
where P A , P B are the pressure at A point and B point, respectively; σ is surface tension of liquid film; and R is radius of constant volume circle. Free water flows from A point to B point when P A > P B , as shown in Figure 9a. The existence of microbubbles in the liquid film hinders the movement of the free water and contributes to the stability of the bubble microstructure. When the angle of plateau boundary is 120°, the pressure at A point and B point is the minimum, and the bubble is stable. Therefore, the shape of bubble in two-dimension plane is hexagon, which expresses the phenomena of existence of hexagon in Figure 8c–e.
Figure 9b shows the sketch of curved surface in three dimensional. The pressure difference can be expressed as follows:
Δ P = γ ( 1 R 1 1 R 2 )
where Δ P is pressure difference, γ is coefficient of surface tension, and R 1 and R 2 are curvature radius at orthogonal plane.
If the bubble is the standard spherical, then R 1 = R 2 = R , and then the Equation (6) can be changed to:
Δ P = 2 γ R
The pressure difference between large size bubble and the adjacent small size bubble can be expressed as:
Δ P = P s P b = 2 γ ( 1 R s 1 R b )
where P s and P b are the pressure in small size bubbles and adjacent large size bubbles, respectively; and R s and R b are the radius of small size bubbles and adjacent large size bubbles, respectively.
According to Equation (8), the air in small-size bubbles diffuses into adjacent large-size bubbles, and then the size of small bubbles becomes smaller until vanishment while adjacent large size bubbles become larger. The large size bubbles become larger as the micro and small bubbles are continuously captured by the neighboring large size bubbles with higher adsorption energy. To make the foam stable and maximum its effect, the water should be sufficient to prevent from the decay of foam microstructure induced by drainage of water.

4.2. Results and Discussion of Mixing Test

Various amounts of water content (25 w.t.% and 40 w.t.%) and foam injection ratios (0 vol.%, 10 vol.%, 20 vol.%, and 30 vol.%) were added to the tested soil to achieve different conditioned soils. Figure 10 shows the pictures of tested soils with various water content and FIR after 2 min of mixing. For the soil sample with w = 25% &FIR = 0%, the soil composed of loose soil clumps, which was caused by the gravel particle wrapped by silty clay and fine-medium sand, showed a dry, loose, and rigid state, as shown in Figure 10a. For w = 25% &FIR = 10%, w = 25% &FIR = 20%, and w = 25% &FIR = 30%, the tested soils showed a sticky, stiff, and water shortage state, as shown in Figure 10b–d. The foam could not work in a water shortage soil because the water in liquid film of foam was easily absorbed by the unsaturated soil, which was found in the foam microstructure test. Therefore, it was necessary to improve the water content in the tested soils before the addition of foam, and then the other group soil samples with w = 40% were adopted. For tested soil with w = 40% &FIR = 0%, the state was consistent and the flowability increased, as shown in Figure 10e. For w = 40% &FIR = 10%, w = 40% &FIR = 20%, and w = 40% &FIR = 30%, the tested soils were turned into a loose and fluffy state, where the soil volume left on the rod decreased as FIR increased, as shown in Figure 10f–h. This indicates that the flowability increased and viscosity decreased because of the lubrication and dispersion induced by foam air bubbles.
Each mixing test was conducted for 2 min and the mixing time necessary to obtain a homogeneous mixture without apparent foam was recorded by a timer, as shown in Figure 11. The time used for foamed soils with w = 25% &FIR = 10% was less than the time used for foamed soils with w = 25% &FIR = 20%. This might have been caused by the smaller amount and faster defoaming in tested soils with w = 25% &FIR = 10%. For tested soils with w = 40%, the general mixing time was less than tested soils with w = 25% because the soils already had a good flowability at w = 40%. The general mixing time for soils with w = 40% decreased as FIR increased, which might have been caused by the decrease of viscosity induced by foam dispersion and increase of flowability induced by foam lubrication.
Meanwhile, the net power of the electric mixer motor with a resolution of 1 W was monitored during the mixing test, as shown in Figure 12. The net power value and fluctuation value induced by the soils with w = 25% were higher than tested soils with w = 40%, which might have been caused by the poor liquidity and high viscosity. The average net power and standard deviation, as well as the change rate of the net power for various tested soils, are further plotted in Figure 13. Figure 13a indicates that the fluctuation of net power for tested soils with w = 25% did not change significantly with increase of FIR, while the fluctuation of net power for tested soils with w = 40% decreased drastically as the FIR increased from 0% to 10%. Figure 13b shows the change rate of net power with FIR. For tested soils with w = 25%, the change rate of net power increased as FIR increased from 0% to 10% and then decreased with the further injection of foam. This might have been caused by the increase of viscosity in the mixed soils because of the defoaming of foam at w = 25% &FIR = 10% caused by insufficient water in soil. However, the net power of tested soils with w = 40% decreased by 50% as FIR increased from 0% to 30%, which might have been caused by the decrease of viscosity and increase of flowability in the mixed soils because of the dispersion and lubrication induced by enough air bubbles. The decrease of net power value and fluctuation value in the mixing test means that the cutter head torque, as well as electric energy, could be decreased during EPBS tunneling after the reasonable application of soil conditioning in this mixed soil.

4.3. Result and Discussion of Slump Test

After the mechanical mixing test, a series of slump tests were carried out in triplicate on each soil sample to evaluate the workability and flowability of the conditioned soils quantitatively. Figure 14 shows the selected pictures of the slump test, and the test results are summarized in Table 3. For conditioned soils with w = 25% regardless of foam injection ratio, the soil sample was dry, rigid, and stiff, such that they either stood straight with very small drop value (see Figure 14a–c) or collapsed (see Figure 14d) once the cones were lifted. For tested soils with w = 25% in Table 3, the slump values show that the foamed soil had a small increase in liquidity as FIR increased, although a collapse still occurred after the lifting of the cone. It was hard to obtain a desirable state when w = 25%. Proper slump values of 100–200 mm were obtained when the water content was improved to 40% regardless of foam injection ratio. The mean slump values of w = 40% &FIR = 0%, w = 40% &FIR = 10%, w = 40% &FIR = 20%, and w = 40% &FIR = 30% were 154.3 mm, 174.7 mm, 179.0 mm, and 182.3 mm, respectively, as shown in Table 3. The slump value increased as the foam injection ratio increased. Figure 14e–h shows that the foamed soils with w = 40% had an increased liquidity and no collapse occurred. It indicates that the flowability of tested soils with w = 40% was improved dramatically after the improvement of water content, and the flowability increases with increase of FIR. Tested soils with w = 40% regardless of FIR meet the requirement of EPBS tunneling according to the slump value. It also indicates that if the water content is enough, even low FIR can cause it to be too fluid-like [3].

4.4. Results and Discussion of Friction Coefficient Test

The friction coefficient test device, developed by the China University of Geosciences in Beijing, China, was adopted to conduct the friction coefficient test in triplicate on each tested soil after the mechanical mixing test. The angle of external friction and friction coefficient are shown in Figure 15. For soil group with w = 25%, it can be seen that the friction angle and friction coefficient first increased to an apparent maximum as the FIR increases from FIR = 0% (without foam) to FIR = 10%. As the FIR continued to increase beyond 10% until FIR = 30%, the friction angle and friction coefficient decreased. The trend is consistent with the trend of net motor power in Figure 13, which might have been caused by the increase of viscosity because of dissolution of foam. For the tested soils with w = 40% regardless of FIR, the friction angle and friction coefficient were less than the tested soils with w = 25% and they decreased as FIR increased from 0% to 30%, as shown in Figure 15. This also indicates that the increase of water dramatically changes the characteristics of tested soils firstly, and then the foam reduces the viscosity and improve the flowability. The increase of flowability and decrease of viscosity are good for the discharging of the mixed soil in soil chamber through screw conveyor during EPBS operation in soft ground.

5. Conclusions

This article presents the results of an experimental study, which assessed the influence of foam on a mixed soil consisting of silty clay, fine-medium sand, and sandy gravel utilizing several geotechnical methods to provide a reference for soil conditioning on mixed soils often encountered in EPBS tunneling. Based on the preliminary tests conducted in this study, the main findings specific to the soils and conditioners tested in this study can be summarized as follows:
Foam microstructure changes with the decay of the liquid film. The microstructure test carried out in this study showed that the bubbles decayed as the time went by and the decay mechanism was the drainage of water in the liquid film caused by the gravity and pressure difference, and the foam fusion among various size bubbled due to the pressure difference.
Water plays an important role in modifying the characteristics of the mixed soil. When the water was at the low level (w = 25%), the foam failed to modify the properties of the mixed soil because of its failure behavior of foam particle induced by the tested soil with insufficient water content. However, when w = 40%, the flowability increased and viscosity decreased dramatically.
Foam plays an important role in increasing flowability and decreasing viscosity when the water is sufficient in the mixed soil. The mixed soil in this study could be modified into a proper state to meet the slump requirement of 100–200 mm by mixing the foam with the water content of 40%. Foam could maximum its effect when the mixed soil with sufficient water content (i.e., 40%).
When the water content was 40%, the mixing time, net power value and fluctuation value, slump value, external friction angle and friction coefficient were better than soil samples with water content of 25%. The net power caused by mixed soil with w = 40% and FIR = 30% could decrease by approximately 50%. The foam could improve the properties of mixed soil further when the water is sufficient.

Author Contributions

Conceptualization, Y.W.; methodology, Y.W.; software, Y.W., J.L.; validation, J.L.; formal analysis, Y.W. and D.W.; investigation, Y.W. and D.W.; resources, Y.W.; writing—original draft preparation, Y.W.; supervision, D.W. and Y.J.; project administration, Y.W.; funding acquisition, Y.W. All authors have read and agreed to the published version of the manuscript.

Funding

This research was funded by the National Natural Science Foundation of China (NSFC), Grant number41472278, and the National Key Research and Development Program of China, Grant number2017YFC0805008.

Conflicts of Interest

The authors declare no conflict of interest.

References

  1. Herrenknecht, M.; Thewes, M.; Budach, C. The development of earth pressure shields: from the beginning to the present/ Entwicklung der Erddruckschilde: Von den Anfängen bis zur Gegenwart. Geomech. Tunn. 2011, 4, 11–35. [Google Scholar] [CrossRef]
  2. Budacha, C.; Thewes, M. Application ranges of EPB shields in coarse ground based on laboratory research. Tunn. Undergr. Space Technol. 2015, 50, 296–304. [Google Scholar] [CrossRef]
  3. Kim, T.H.; Kim, B.K.; Lee, K.H.; Lee, I.M. Soil conditioning of weathered granite soil used for EPB shield TBM: A laboratory scale study. KSCE J. Civ. Eng. 2019, 23, 1829–1838. [Google Scholar] [CrossRef]
  4. Ye, X.Y.; Wang, S.Y.; Yang, J.S.; Sheng, D.C.; Xiao, C. Soil Conditioning for EPB Shield Tunneling in Argillaceous Siltstone with High Content of Clay Minerals: Case Study. Int. J. Geomech. 2017, 17, 05016002. [Google Scholar] [CrossRef]
  5. Wang, S.M.; Lu, X.X.; Wang, X.M.; He, C.; Xia, X.; Ruan, L.; Jian, Y.Q. Soil Improvement of EPBS Construction in High Water Pressure and High Permeability Sand Stratum. Adv. Civ. Eng. 2019, 2019, 1–9. [Google Scholar] [CrossRef] [Green Version]
  6. Zhao, B.Y.; Liu, D.Y.; Jiang, B. Soil Conditioning of Waterless Sand–Pebble Stratum in EPB Tunnel Construction. Geotech. Geol. Eng. 2018, 36, 2495–2504. [Google Scholar] [CrossRef]
  7. Langmaack, L.; Lee, K.F. Difficult ground conditions? Use the right chemicals! Chances-limits-requirements. Tunn. Undergr. Space Technol. 2016, 57, 112–121. [Google Scholar] [CrossRef]
  8. Alavi Gharahbagh, E.; Rostami, J.; Talebi, K. Experimental Study of the Effect of Conditioning on Abrasive Wear and Torque Requirement of Full Face Tunneling Machines. Tunn. Undergr. Space Technol. 2014, 41, 127–136. [Google Scholar] [CrossRef]
  9. Merritt, A.S.; Mair, R.J. Mechanics of Tunnelling Machine Screw Conveyors: Model Tests. Géotechnique 2006, 56, 605–615. [Google Scholar] [CrossRef]
  10. Merritt, A.S.; Mair, R.J. Mechanics of Tunnelling Machine Screw Conveyors: A Theoretical Model. Géotechnique 2008, 58, 79–94. [Google Scholar] [CrossRef]
  11. Yang, Y.Y.; Li, H.A. Failure mechanism of large-diameter shield tunnels and its effects on ground surface settlements. J. Cent. South Univ. Technol. 2012, 10, 2958–2965. [Google Scholar] [CrossRef]
  12. Martinelli, D.; Peila, D.; Campa, E. Feasibility study of tar sands conditioning for earth pressure balance tunneling. J. Rock Mech. Geotech. Eng. 2015, 7, 684–690. [Google Scholar] [CrossRef] [Green Version]
  13. Quebaud, S.; Sibai, M.; Henry, J.-P. Use of Chemical Foam for Improvements in Drilling by Earth-Pressure Balanced Shields in Granular Soils. Tunn. Undergr. Space Technol. 1998, 13, 173–180. [Google Scholar] [CrossRef]
  14. Yang, Y.Y.; Wang, G.H.; Li, H.A.; Huang, X.G. The new clay mud and its improvement effects of tunnels. Appl. Clay Sci. 2013, 79, 49–56. [Google Scholar] [CrossRef]
  15. Wei, Y.J.; Yang, Y.Y.; Qiu, T. Effects of soil conditioning on tool wear for earth pressure balance shield tunneling in sandy gravel based on laboratory test. J. Test. Eval. 2019, 49. [Google Scholar] [CrossRef]
  16. Yang, Y.Y.; Wang, G.H. Experimental Study on Amelioration Effects of Foam for EPBS Tunnels. Disaster Adv. 2012, 5, 1734–1740. [Google Scholar]
  17. ASTM C143-C143M-15a. Standard Test Method for Slump of Hydraulic-Cement Concrete; ASTM International: West Conshohocken, PA, USA, 2015. [Google Scholar] [CrossRef]
  18. Vinai, R. A Contribution to the Study of Soil Conditioning Techniques for EPB TBM Applications in Cohesionless Soils. Ph.D. Thesis, PhD-Turin Institure for Technology, Turin, Italy, 12 April 2006. [Google Scholar]
  19. Vinai, R.; Oggeri, C.; Peila, D. Soil conditioning of sand for EPB applications A laboratory research. Tunn. Undergr. Space Technol. 2008, 23, 308–317. [Google Scholar] [CrossRef]
  20. Peila, D.; Oggeri, C.; Borio, L. Using the Slump Test to Assess the Behavior of Conditioned Soil for EPB Tunneling. Environ. Eng. Geosci. 2009, 3, 167–174. [Google Scholar] [CrossRef]
  21. Peila, D.; Picchio, A.; Chieregato, A. Earth pressure balance tunnelling in rock masses: Laboratory feasibility study of the conditioning process. Tunn. Undergr. Space Technol. 2013, 35, 55–66. [Google Scholar] [CrossRef]
  22. Peila, D. Soil conditioning for EPB shield tunneling. KSCE J. Civ. Eng. 2014, 18, 831–836. [Google Scholar] [CrossRef]
  23. GB/T 50123. Standard for geotechnical testing method. National Standard of the People’s Republic of China (in Chinese). 2019. Available online: http://www.waizi.org.cn/bz/66863.html (accessed on 2 August 2019).
Figure 1. Mixer with power meter (after [14]).
Applsci 10 03300 g001
Figure 2. Slump test device.
Applsci 10 03300 g002
Figure 3. Friction coefficient test device.
Applsci 10 03300 g003
Figure 4. Grain size distribution curves of tested soil sample.
Applsci 10 03300 g004
Figure 5. Warning-Blender method: (a) Waring-Blender tester, (b) generated foam.
Applsci 10 03300 g005
Figure 6. Addition of foam agent: (a) Injection of foam before mixing, (b) homogenous mixtures after mixing.
Applsci 10 03300 g006
Figure 7. Microstructure of liquid film before treatment.
Applsci 10 03300 g007
Figure 8. Variation of foam microstructure under 40-times magnification after treatment (a) 0.5 min; (b) 5 min; (c) 10 min; (d) 15 min; (e) 20 min; (f) 25 min; (g) 30 min; (h) 60 min.
Applsci 10 03300 g008
Figure 9. Diagram of foam microstructure: (a) Plateau junction; (b) surface tension on a three-dimensional surface.
Applsci 10 03300 g009
Figure 10. Photographs of tested soils with various water content and foam injection ratio (FIR) after mixing: (a) w = 25%, FIR = 0%; (b) w = 25%, FIR = 10%; (c) w = 25%, FIR = 20%; (d) w = 25%, FIR = 30%; (e) w = 40%, FIR = 0%; (f) w = 40%, FIR = 10%; (g) w = 40%, FIR = 20%; (h) w = 40%, FIR = 30%.
Applsci 10 03300 g010
Figure 11. Mixing time for various foamed soils.
Applsci 10 03300 g011
Figure 12. The measured net power during the mixing tests in various tested soils with w = 25% and 40% and: (a) FIR = 0%; (b) FIR = 10%; (c) FIR = 20%; (d) FIR = 30%.
Applsci 10 03300 g012
Figure 13. Variation of net power during mixing test: (a) Net power value, (b) the change rate of net power.
Applsci 10 03300 g013
Figure 14. Photographs of slump test with water contents of 25% and 40%, as well as foam injection ratios of 0%, 10%, 20%, and 30%: (a) w = 25%, FIR = 0%; (b) w = 25%, FIR = 10%; (c) w = 25%, FIR = 20%; (d) w = 25%, FIR = 30%; (e) w = 40%, FIR = 0%; (f) w = 40%, FIR = 10%; (g) w = 40%, FIR = 20%; (h) w = 40%, FIR = 30%.
Applsci 10 03300 g014
Figure 15. Variation of external friction angle and friction coefficient.
Applsci 10 03300 g015
Table 1. Geotechnical properties of tested soil.
SoilsNatural Bulk Density Void RatioCohesionInternal Friction Angle
ρecφ
(g/cm3) (kPa)(°)
Silty clay1.960.772510
Fine to medium sand2.000.60030
Sandy gravel2.050.45045
Table 2. Mineral constituent of silty clay.
SoilMineral TypePercent by Mass (%)
Silty clayQuartz39
Plagioclase23
Microcline7
Calcite7
hematite2
mica9
montmorillonite9
Clinochlore4
Table 3. Test results of slump test of conditioned soil.
No.w C f FERFIRSlump (mm)
(%)(%)(-)(%)Test 1Test 2Test 3Mean
Sample 1254700---
Sample 2254710-42-
Sample 325472075--
Sample 4254730--7-
Sample 540470160154149154.3
Sample 6404710173180171174.7
Sample 7404720179183175179.0
Sample 8404730187182178182.3

