Article

High-Performance Green Extraction of Polyphenolic Antioxidants from Salvia fruticosa Using Cyclodextrins: Optimization, Kinetics, and Composition

by
Spyros Grigorakis
1,2,
Amina Benchennouf
1,
Abedalghani Halahlah
1 and
Dimitris P. Makris
3,*
1
Food Quality & Chemistry of Natural Products, Mediterranean Agronomic Institute of Chania (M.A.I.Ch.), International Centre for Advanced Mediterranean Agronomic Studies (CIHEAM), P.O. Box 85, Chania 73100, Greece
2
Department of Food Science & Nutrition, School of Environment, University of the Aegean, Mitr. Ioakim Street, Myrina 81400, Greece
3
Green Processes & Biorefinery Group, Department of Food Science & Nutrition, School of Agricultural Sciences, University of Thessaly, N. Temponera Street, Karditsa 43100, Greece
*
Author to whom correspondence should be addressed.
Appl. Sci. 2020, 10(10), 3447; https://doi.org/10.3390/app10103447
Submission received: 28 April 2020 / Revised: 8 May 2020 / Accepted: 14 May 2020 / Published: 16 May 2020
(This article belongs to the Special Issue Antioxidants in Natural Products)

Abstract

:
S. fruticosa, collectively known as Cretan sage, is a medicinal plant to which a number of bioactivities have been attributed. In spite of its importance in nutrition and pharmacy, reports on the extraction of major polyphenols using sustainable processes are particularly limited. In this study, three common cyclodextrins, namely, methyl β-cyclodextrin (m-β-CD), hydroxypropyl β-cyclodextrin (HP-β-CD), and β-cyclodextrin (β-CD), were tested as green boosters of aqueous extraction of polyphenols from aerial parts of S. fruticosa. To examine simultaneously important extraction parameters, including the concentration of cyclodextrins (CCD), pH, and liquid-to-solid ratio (RL/S), a Box–Behnken design was chosen, with three central points. Temperature effects on the extraction yield were also considered, by carrying out kinetics. The results showed that m-β-CD was the most effective extraction booster, providing total polyphenols yields that amounted to 98.39 mg gallic acid equivalents g−1 dry mass. The kinetic assay demonstrated that extraction was highly effective at 80 °C, increasing significantly polyphenol yield, as well as the ferric-reducing power and antiradical activity of the extracts. It was also proven that extraction with m-β-CD was the least energy-demanding process. Liquid chromatography-tandem mass spectrometry examination revealed that m-β-CD might possess higher affinity for luteolin 7-O-glucuronide extraction, but β-CD for rosmarinic acid extraction.

1. Introduction

Salvia is the most multitudinous genus of the Lamiaceae family, embracing over than 800 species around the globe [1]. Several tens of Salvia species are considered plants with high pharmacological potency, being an integral part of folk medicine in many countries [2]. The therapeutic properties of Salvia plants have been mostly attributed to major constituents, such as terpenoids and phenolic acids, yet a wide diversity of flavonoid compounds may also occur in Salvia specimens [3,4].
The biological significance of medicinal plants has triggered the development of a high number of extraction techniques, which aim at the effective recovery of polyphenolic substances. These techniques may involve the use of volatile and toxic solvents, while the extracts obtained may afterwards require several steps of downstream processes for effective solvent removal and extract recovery. On the other hand, contemporary trends in polyphenol extraction, driven by the need for less environmentally aggravating and safer processes, dictate the development of extraction methodologies that would minimize cost, energy consumption, and emission of volatile substances [5]. On this philosophy, the replacement of conventional extraction media by novel, green, and non-toxic ones is imminent.
Cyclodextrins (CDs) are cyclic oligosaccharides, composed of α (1→4)-linked subunits of D-glucopyranose. The most common CDs are α-, β-, and γ-CDs, composed of six, seven, and eight glucose units, respectively, obtained by enzymic degradation of starch, possessing a truncated cone shape, with the hydroxyl functions located towards to the outer cavity surface (Figure 1). This three-dimensional structure of the CD molecules is characterized by a hydrophilic outer surface and an internal hydrophobic cavity and provides both water solubility and ability to encapsulate within the cavity hydrophobic molecules of suitable size, thus forming inclusion complexes [6].
Applications of CDs have been increasing on an annual basis in pharmaceutical, chemical, and other disciplines, but most uses are related to food [7]. The utilization of CDs in food products pertains mainly to stabilization of flavors, solubilization of poorly water-soluble substances, protection of labile additives, and so on. However, CDs use for extraction of polyphenolic compounds is a state-of-the-art trend, offering unprecedented opportunities in the so-called “green extraction”. This is because, although common organic solvents regularly used for polyphenol recovery (e.g., ethanol, ethyl acetate) display excellent potency for polyphenols dissolution and extraction, their use poses serious environmental concerns. Aqueous systems containing CDs may be regarded as green solvents, with a prospect of replacing organic solvents in relevant processes [8].
In this frame, this investigation was performed with the objective to study the use of various cyclodextrins, namely, β-cyclodextrin (β-CD), hydroxypropyl β-cyclodextrin (HP-β-CD), and methyl β-cyclodextrin (m-β-CD), on the extraction of polyphenols from S. fruticosa, using aqueous solutions. The investigation was based on experimental design considering critical extraction parameters, such as the CD concentration, the liquid-to-solid ratio, and pH. Finally, temperature effects were assayed by carrying out kinetics, while selectivity issues were checked with liquid chromatography-mass spectrometry analyses.

2. Materials and Methods

2.1. Chemicals

β-Cyclodextrin, hydroxypropyl β-cyclodextrin, and methyl β-cyclodextrin were from Sigma–Aldrich (St. Louis, MO, USA). Ethanol (99.8%) was from Acros Organics (Geel, Belgium). Anhydrous sodium carbonate was from Carlo Erba Reactifs (Val de Reuil, France). Folin–Ciocalteu reagent, 2,4,6-tripyridyl-s-triazine (TPTZ, 99%) and ferric chloride hexahydrate were from Fluka (Steinheim, Germany). 2,2-Diphenyl-1-picrylhydrazyl radical (DPPH), citric acid, gallic acid, and ascorbic acid were from Aldrich (Steinheim, Germany). Chromatography solvents were high-performance liquid chromatography (HPLC) grade.

2.2. Plant Material

Cretan sage (Salvia fruticosa, Lamiaceae) was provided by a local store (Chania, Crete, Greece) of certified botanicals. The plant material was delivered dried in air-tight packaging and stored in a dark and dry chamber for no longer than a week. The material was pulverised using a table domestic mill (Tristar, Tilburg, The Netherlands) to provide a powder with mean particle size of 1.28 mm. This powder was used for all examinations.

2.3. Batch Stirred-Tank Solid–Liquid Extraction

The powdered plant material was extracted with aqueous solvents, which contained 1% (w/v) citric acid, adjusted to the desired pH, and various amounts of either β-CD, HP-β-CD, or m-β-CD. The pH, as well as the exact amount of each cyclodextrin and powdered material, were defined by the experimental design (see paragraph 2.4). CDs were incorporated into the aqueous solutions prior to extractions. The extractions were performed under continuous magnetic stirring at 400 rpm, at ambient temperature (22 ± 1 °C), at a final volume of 25 mL, in glass vials, for 180 min. After each extraction, centrifugation of samples was carried out at 10,000× g and the clear supernatant was utilized for further analyses.

2.4. Experimental Design

The scope of the investigation was to study the effect of cyclodextrin (β-CD, HP-β-CD, m-β-CD) concentration (CCD), pH, and liquid-to-solid ratio (RL/S) on the performance of aqueous extraction of polyphenols from S. fruticosa. To accomplish this, a response surface methodology was employed, using the Box–Behnken experimental design including three central points, which enables determination of the first- and second-order coefficients of the mathematical model with high reliability [9]. Total polyphenol yield (YTP) was the screening response and codification of the variables chosen (CCD, pH, RL/S) between −1 (lower limit) and 1 (upper limit), and was performed as follows:
x i = X i X 0 Δ X i ,   i = 1 ,   2 ,   3
where xi is the dimensionless value of the independent variable i, and Xi is its actual value. X0 represents the actual value of variable i at the central point of the design, and ΔXi is the step change of Xi, corresponding to a change by a unit of the dimensionless value (Table 1). The ranges used for the independent variables were chosen on the basis of critical evaluation of literature data. The significance of the model, each polynomial coefficient, and the model coefficient R2 were acquired by performing analysis of variance (ANOVA). On the basis of this analysis, insignificant dependent terms (p > 0.05) were not included in the mathematical equations (models). The desirability function enabled the determination of the optimal extraction conditions for maximizing YTP and visualization of the independent variable effect on YTP was delivered as 3D response surface plots. Model validation was done by comparing predicted and experimental response values, after carrying out experiments under optimal extraction conditions.

2.5. Determination of Total Polyphenols (TP)

A method reported elsewhere was employed [10]. Aliquot of 0.5 mL of extract was combined with an equal volume of methanol containing 1% (w/v) trichloroacetic acid in a 1.5 mL Eppendorf tube. A volume of 0.02 mL of this mixture was then combined with 0.05 mL Folin–Ciocalteu reagent and 0.78 mL distilled water. After a 2 min reaction at room temperature, 0.15 mL Na2CO3 solution (20% w/v) was added and the samples were left to react for 60 min, in the dark. The absorbance at 740 nm was then obtained, using appropriate blank, and the concentration in total polyphenols (CTP, mg L−1) was calculated from a calibration curve, constructed with gallic acid as standard. Total polyphenol yield (YTP) was estimated by the following equation and expressed as mg gallic acid equivalents (GAEs) g−1 dry mass (dm):
Y TP   ( mg   GAE   g 1 ) = C TP × V dm
where V is the volume (in L) of extraction and dm the dry mass of the plant material (in g).

2.6. Antiradical Activity (AAR) Measurement

For the determination AAR, a DPPH assay was used [10]. Samples were diluted 1:20 with methanol before each analysis. A volume of 0.025 mL of diluted sample was mixed with 0.975 mL of DPPH solution (100 μM in methanol) and the absorbance was immediately recorded at 515 nm (A515(i)). The mixture was allowed to react for 30 min and then recording of absorbance at 515 nm was repeated (A515(f)). AAR was calculated as follows:
A AR = C DPPH C TP × ( 1 A 515 ( f ) A 515 ( i ) ) × Y TP
where CDPPH is the DPPH concentration (μM) and CTP is the and total polyphenol concentration (mg L−1) in the reaction mixture; A515(f) is the A515 at t = 30 min and A515(i) the A515 at t = 0; and YTP is the total polyphenol yield (mg g−1) of the extract. AAR was expressed as μmol DPPH g−1 dm.

2.7. Ferric-Reducing Power (PR) Determination

PR of the extracts was assayed as described previously [10]. A volume of 0.05 mL of extract, diluted 1:20 with methanol, was combined with 0.05 mL FeCl3 (4 mM in 0.05 M HCl) and the mixture was incubated in a thermostated water bath, set at 37 °C, for 30 min. After incubation, 0.9 mL TPTZ solution (1 mM in 0.05 M HCl) was added, and after exactly 10 min, the absorbance at 620 nm was measured. PR was determined from an ascorbic acid calibration curve (50–300 μM) and given as μM ascorbic acid equivalents (AAEs) g−1 dm.

2.8. High-Performance Liquid Chromatography (HPLC)

The equipment was a FinniganMAT P4000 pump and a UV6000LP diode array detector (Thermo Scientific, Waltham, MA, USA). Chromatography was performed with a 10 μL injection loop, on a Superspher RP-18 column, 125 mm × 2 mm, 4 μm, maintained at 40° C. The eluents were (A) and (B) were 2.5% acetic acid and methanol, respectively. The elution program used was as follows: 0 min, 100% A; 22 min, 65% A; 32 min, 65% A; 60 min, 0% A; 65 min, 0% A. The flow rate was 0.3 mL min−1.

2.9. Liquid Chromatography-Tandem Mass Spectrometry (LC/MS/MS)

The chromatograph was a TSQ Quantum Access LC/MS/MS, with a surveyor pump (Thermo Scientific, Walltham, MA, USA), interfaced by XCalibur 2.1, TSQ 2.1 software. Analyses were carried out on a Superspher RP-18 column, 125 mm × 2 mm, 4 μm, at 40 °C, with 10 μL injection volume and a flow rate of 0.3 mL min−1. Eluents and elution program were as described above. Mass spectra were acquired in negative ionization mode, with the following settings: sheath gas pressure, 30 mTorr; capillary temperature, 300 °C; collision pressure at 1.5 mTorr; auxiliary gas pressure, 15 mTorr. Quantification was accomplished with external standard methodology, using a luteolin 7-O-glucoside (5–1500 μg L−1, R2 = 0.9982) and a rosmarinic acid (50–3000 μg L−1, R2 = 0.9985) calibration curve. The standards were dissolved in HPLC grade methanol and stored at −17 °C.

2.10. Statistical Analysis

All extraction procedures were accomplished at least twice, and all determinations were carried out in triplicate. Values were given as average values ± standard deviation. All statistics pertaining to the experimental design were provided by JMP Pro 13. Linear and non-linear correlations, as well as curve fittings, were performed at least at a 95% significance level, with SigmaPlot 12.5.

3. Results and Discussion

3.1. Optimisation of the Extraction Performance

The process implemented was designed to appraise the effect of three crucial extraction variables, CCD, RL/S, and pH, and to identify possible synergistic functions between them. Evaluation of the fitted model and the suitability of response surface were based on the ANOVA and lack-of-fit test (Table 2), by considering the closeness of the predicted and measured values (Table 3). The second-degree polynomial equations (mathematical models), considering only the significant terms, are presented in Table 4, along with the square correlations coefficients (R2) of the models, which are indicators of the total variability around the mean determined by the model. Because all total R2 of the models were equal or higher than 0.97, and the p-value for lack of fit (assuming a confidence interval of 95%) was highly significant for all models, it can be argued that equations exhibited excellent fit to the experimental data. The contour plots constructed on the basis of the models, which are presented on a comparative arrangement in Figure 2, provide an at-a-glance image of how the experimental variables affected response (YTP), but also illustrate the differences between the three CDs used.
For the extraction with β-CD, CCD was found to exert a non-significant effect, suggesting that any shift in CCD within the range tested cannot impact YTP. The same was observed for HP-β-CD, but for m-β-CD, this variable was highly significant (p = 0.0047). This outcome strongly indicated that the nature of the CD used may play a key role in extraction. On the other hand, no cross term between m-β-CD concentration and either RL/S or pH was significant, showing that combined effects did not occur. Contrary to those, for the extractions performed with any CD, both RL/S and pH were significant.
Quadratic effects of these variables were also significant for the extractions with β-CD and m-β-CD, but for HP-β-CD, a significant quadratic effect was seen only for pH. Moreover, for HP-β-CD and m-β-CD, cross terms of RL/S and pH were significant too, demonstrating that combinations of these two variables may have either a negative (HP-β-CD) or positive (m-β-CD) influence on the extraction yield.
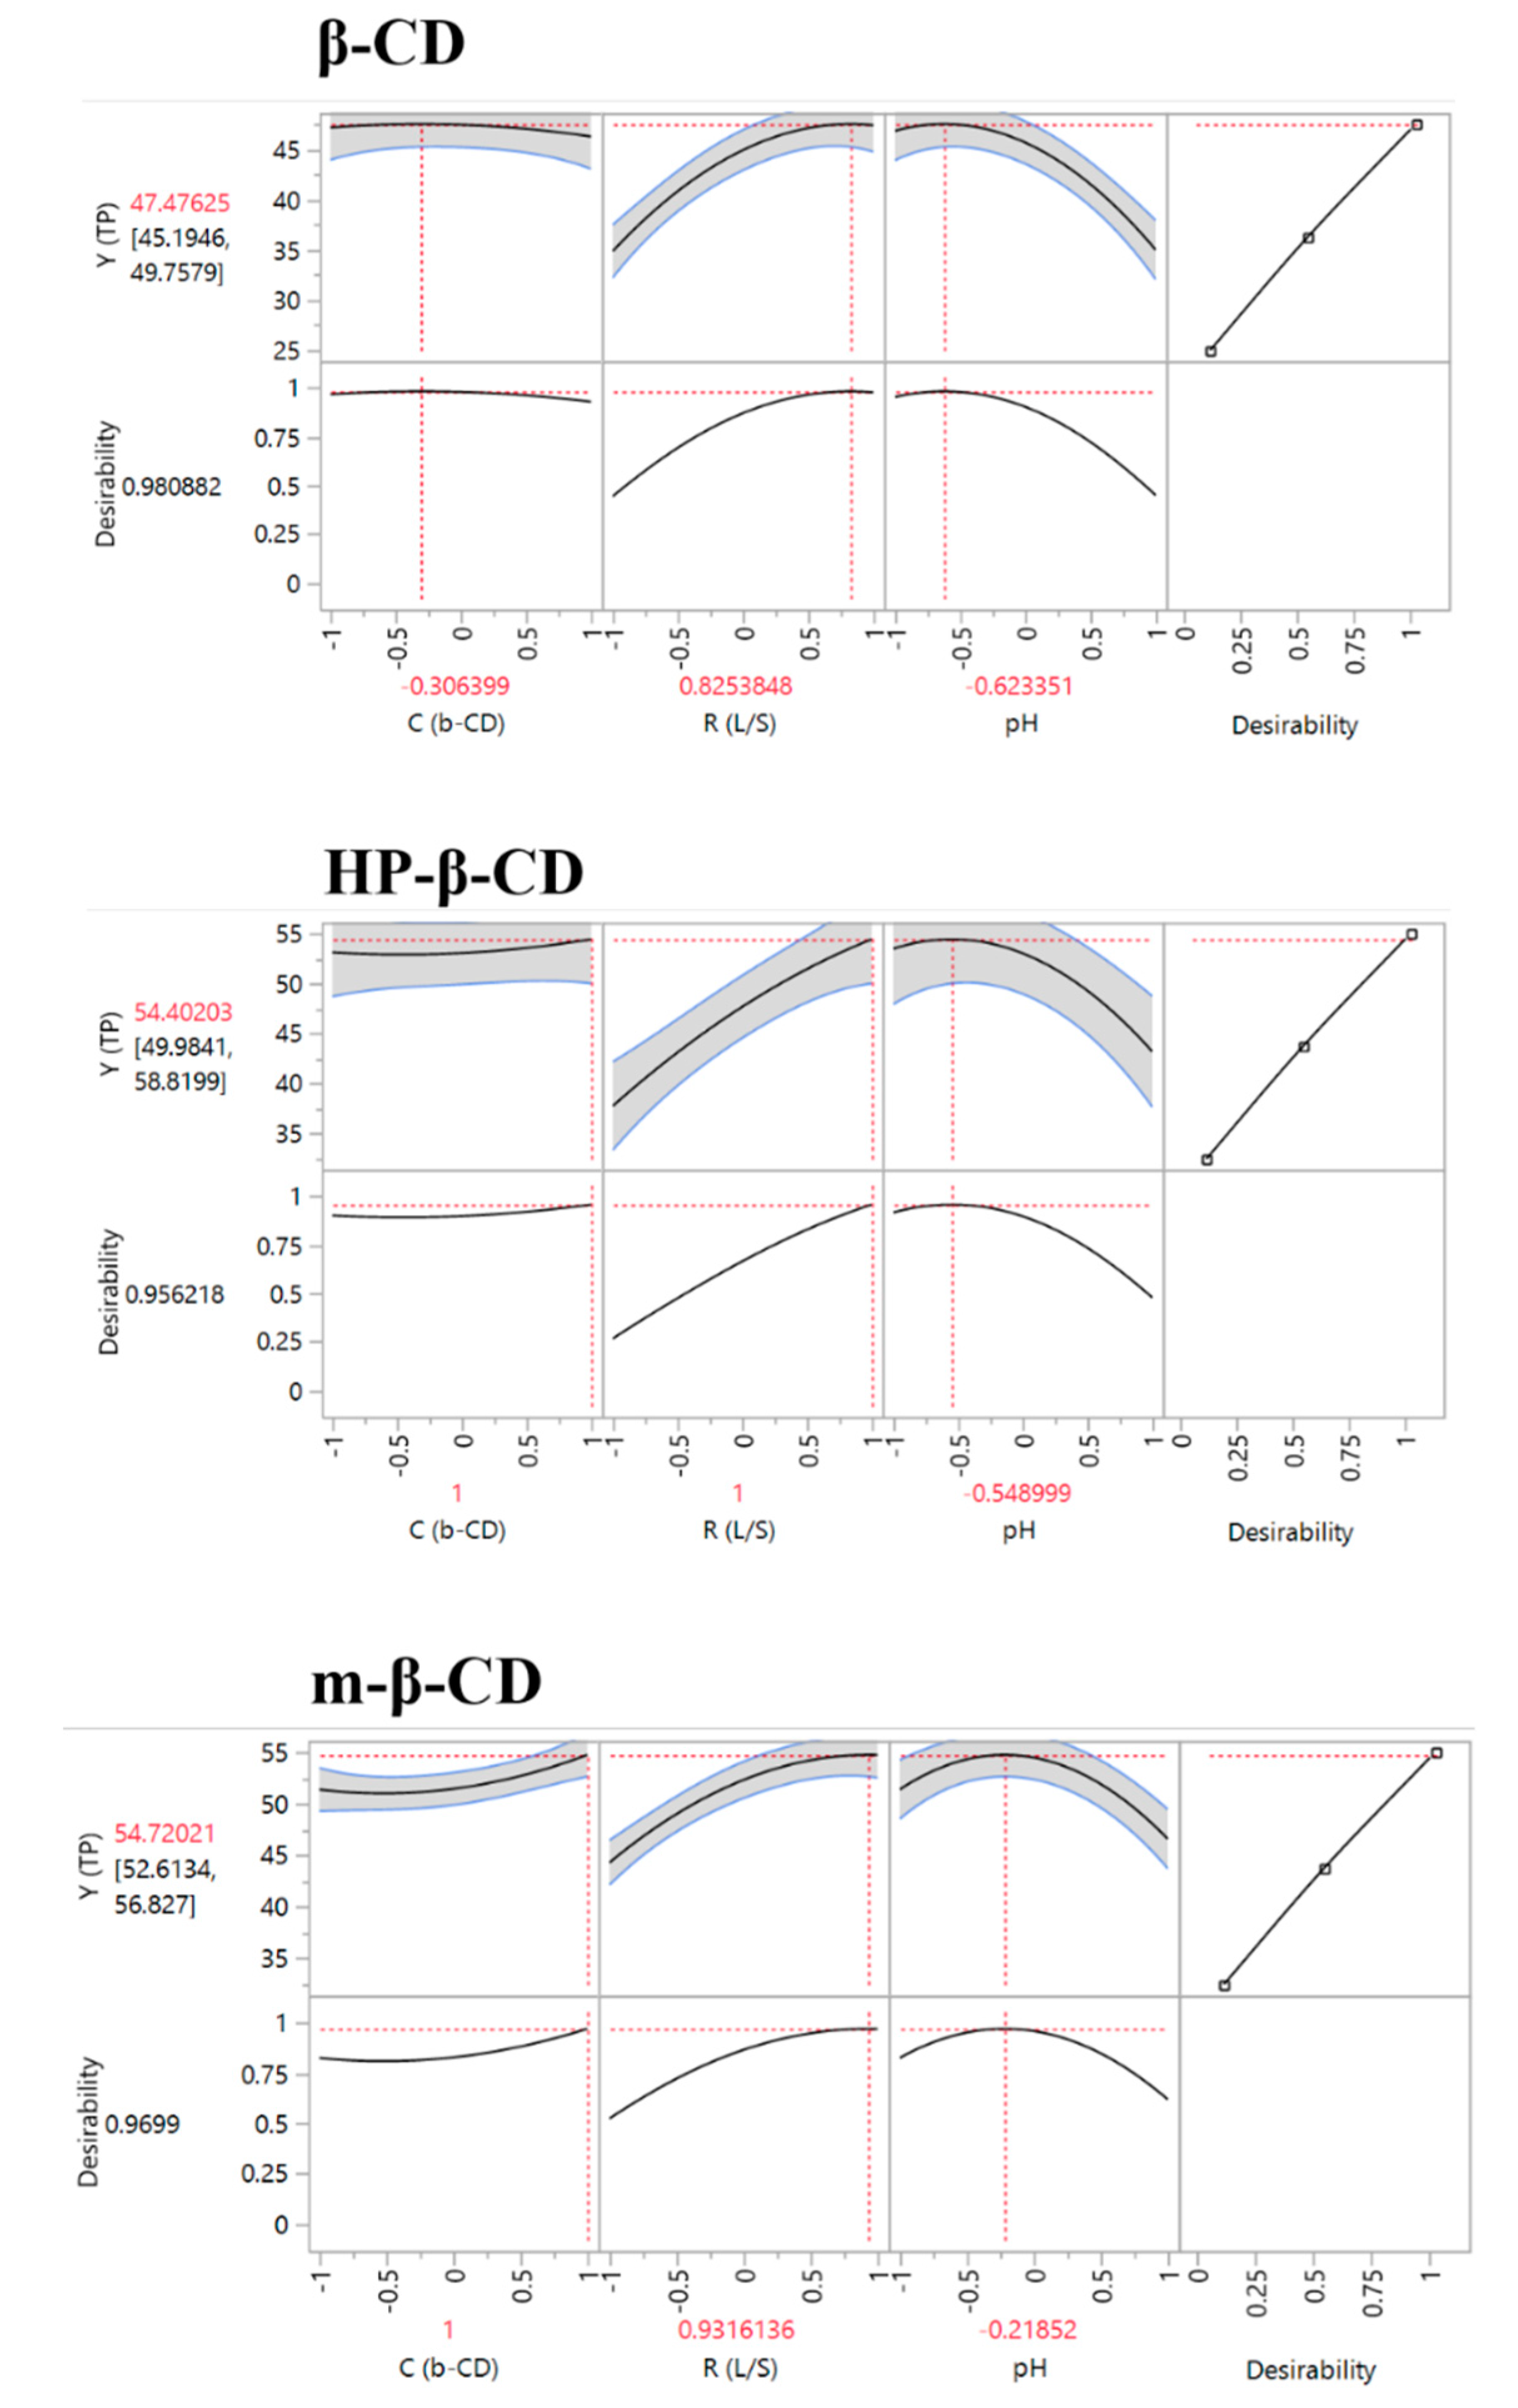
The desirability function (Figure 3) enabled the estimation of the optimal predicted response for each CD tested (Table 5). The YTP achieved with HP-β-CD and m-β-CD were identical and significantly higher than that obtained with β-CD (p < 0.05). This finding highlighted the prominent role of the nature of the CD used for the extraction. In support of this are pertinent results on the extraction of olive pomace polyphenols, where HP-β-CD exhibited superior extraction capacity compared with either m-β-CD or γ-CD [11]. Data on polyphenol extraction from pomegranate fruit were in the same line [12], stressing the superiority of HP-β-CD against β-CD as a polyphenol extraction booster. In opposition, anthocyanin extraction was more efficient with β-CD rather than HP-β-CD [13]. Such discrepancies might emerge from the different encapsulating capacity of the CDs used towards structurally unrelated polyphenolic constituents. Indeed, examinations with pure polyphenols (catechin) demonstrated a more efficient encapsulation with β-CD than HP-β-CD or m-β-CD [14]. Therefore, the higher-performance extraction of S. fruticosa polyphenols observed with m-β-CD might reflect the manifestation of such phenomena. Given that the modelling performed revealed significant effect of CCD only for m-β-CD, then it could be postulated that m-β-CD interacted more strongly with S. fruticosa polyphenols than β-CD or HP-β-CD within the CCD limits tested.
For all CDs, optimum RL/S varied closely within 93–100 mL g−1 (Table 5). This outcome showed that the influence exerted by RL/S on the extraction performance was not significantly affected by the structure of CD. The magnitude of RL/S is related with the concentration gradient between the liquid phase (extraction medium) and the surface of the solid particle, which is directly involved in mass transfer. If RL/S is below a certain limit, then the equilibria established may not favor fast diffusion of the solute during extraction, owing to non-negligible resistance to mass transfer [15]. Several examinations on polyphenol extraction from plant tissues using conventional organic solvents suggested RL/S optima between 81 [16] and 100 mL g−1 [17,18,19]. Considering that the average RL/S value in this study was 96 mL g−1, it could be argued that an aqueous medium containing any of the CDs assayed would behave as a common solvent in this regard.
The statistically significant effects of pH revealed by the models for the extraction with any of the CDs assayed pointed emphatically to the role of the pH in the extraction performance. For all CDs, the optimal pH was below 5, which evidenced that extractions were favoured at acidic pH. One possible reason for this might be related to the ionisation of the phenolic hydroxyl groups, which possess weak acidity. Assuming that encapsulation of polyphenols within the CD cavity is the main effect that enhances extraction, then polyphenol dissociation would increase their polarity, leading to weaker interactions with CD cavity, which is hydrophobic. As dissociation would increase at a higher pH, it would be likely that suppression of dissociation at pH < 5 would maintain polyphenols in their molecular (non-dissociated) form, hence promoting more powerful polyphenol–CD interactions. In support of such a hypothesis were results on naproxen interactions with β-CD, where increasing pH was demonstrated to provoke instability on the inclusion complex, a fact ascribed to lower affinity of charged drug for the hydrophobic β-CD cavity [20].
Although accurate determination has shown that pKa may lie well above 7 for several substituted phenolics [21], for some flavonols such as quercetin, which are frequently encountered in plant tissues, pKa1 may vary within 5.06 to 7.36 [22]. In any case, at pH > 5, even limited dissociation of the most acidic phenolic hydroxyls could occur, provoking a significant increase in polyphenol polarity. This issue was also addressed in previous studies on polyphenol extraction with water/ethanol mixtures [23,24,25], where optimal extraction pH for total polyphenols was always <5. In these cases, increased extraction yield was ascribed to higher solubility of non-dissociated polyphenols in ethanol-containing solvents and increased polyphenol stability at acidic pH.
Variations in CCD concentration within the limits tested for β-CD and HP-β-CD were shown to exert non-significant impact on YTP, but it was not clear whether the presence of any CD used could affect YTP. To examine this, extractions were performed with each CD under optimised conditions, as well as with aqueous solutions under the same RL/S and pH, without the addition of CD (Table 6). In every case, it was demonstrated that addition of CDs provoked significantly higher YTP, highlighting the importance of the CDs used as aqueous extraction boosters. The highest difference in YTP was found for m-β-CD (22.06%), followed by HP-β-CD (19.32%) and β-CD (11.28%).

3.2. Extraction Kinetics and Temperature Effects

To appraise the temperature effects on polyphenol recovery, kinetics was traced using all three CDs over a range of 40 to 80 °C (Figure 4). The model that could effectively describe the patterns recorded was second-order kinetics [26]:
Y TP ( t ) = Y TP ( s ) 2 k t 1 +   Y TP ( s ) k t
where YTP(t) and YTP(s) represent the TP yield at any time t and at equilibrium (saturation), respectively. k is the second-order extraction rate constant. When t approaches 0, the initial extraction rate, h, given as YTP(t)/t, is defined as follows:
h = k Y TP ( s ) 2
In Table 7, the values determined for k, YTP(s) and h, using SigmaPlot 12.5, can be seen. For all CDs, the three kinetic parameters exhibited an increase as a response to raising the temperature up to 80 °C.
The highest YTP(s) was achieved with m-β-CD (98.39 mg GAE g−1 dm) at 80 °C, and it was only 5.3% lower than that achieved with 60% methanol (Figure 5). Both β-CD and HP-β-CD were significantly less effective, giving YTP(s) 75.85 and 81.93 mg GAE g−1 dm, respectively. To further assess the impact of temperature, samples obtained at the end of each treatment (180 min) were also assayed for antioxidant activity (Figure 6). In line with YTP(s), extracts obtained with m-β-CD exhibited the highest AAR (1112.51 μmol DPPH g−1 dm), followed by HP-β-CD (836.17 μmol DPPH g−1 dm) and β-CD (824.08 μmol DPPH g−1 dm). The results for PR were in concurrence, giving corresponding values of 241.88, 210.72, and 185.74 μmol AAE g−1 dm. This outcome suggested that, using m-β-CD, polyphenol-enriched extracts with improved antioxidant characteristics may be produced at 80 °C.
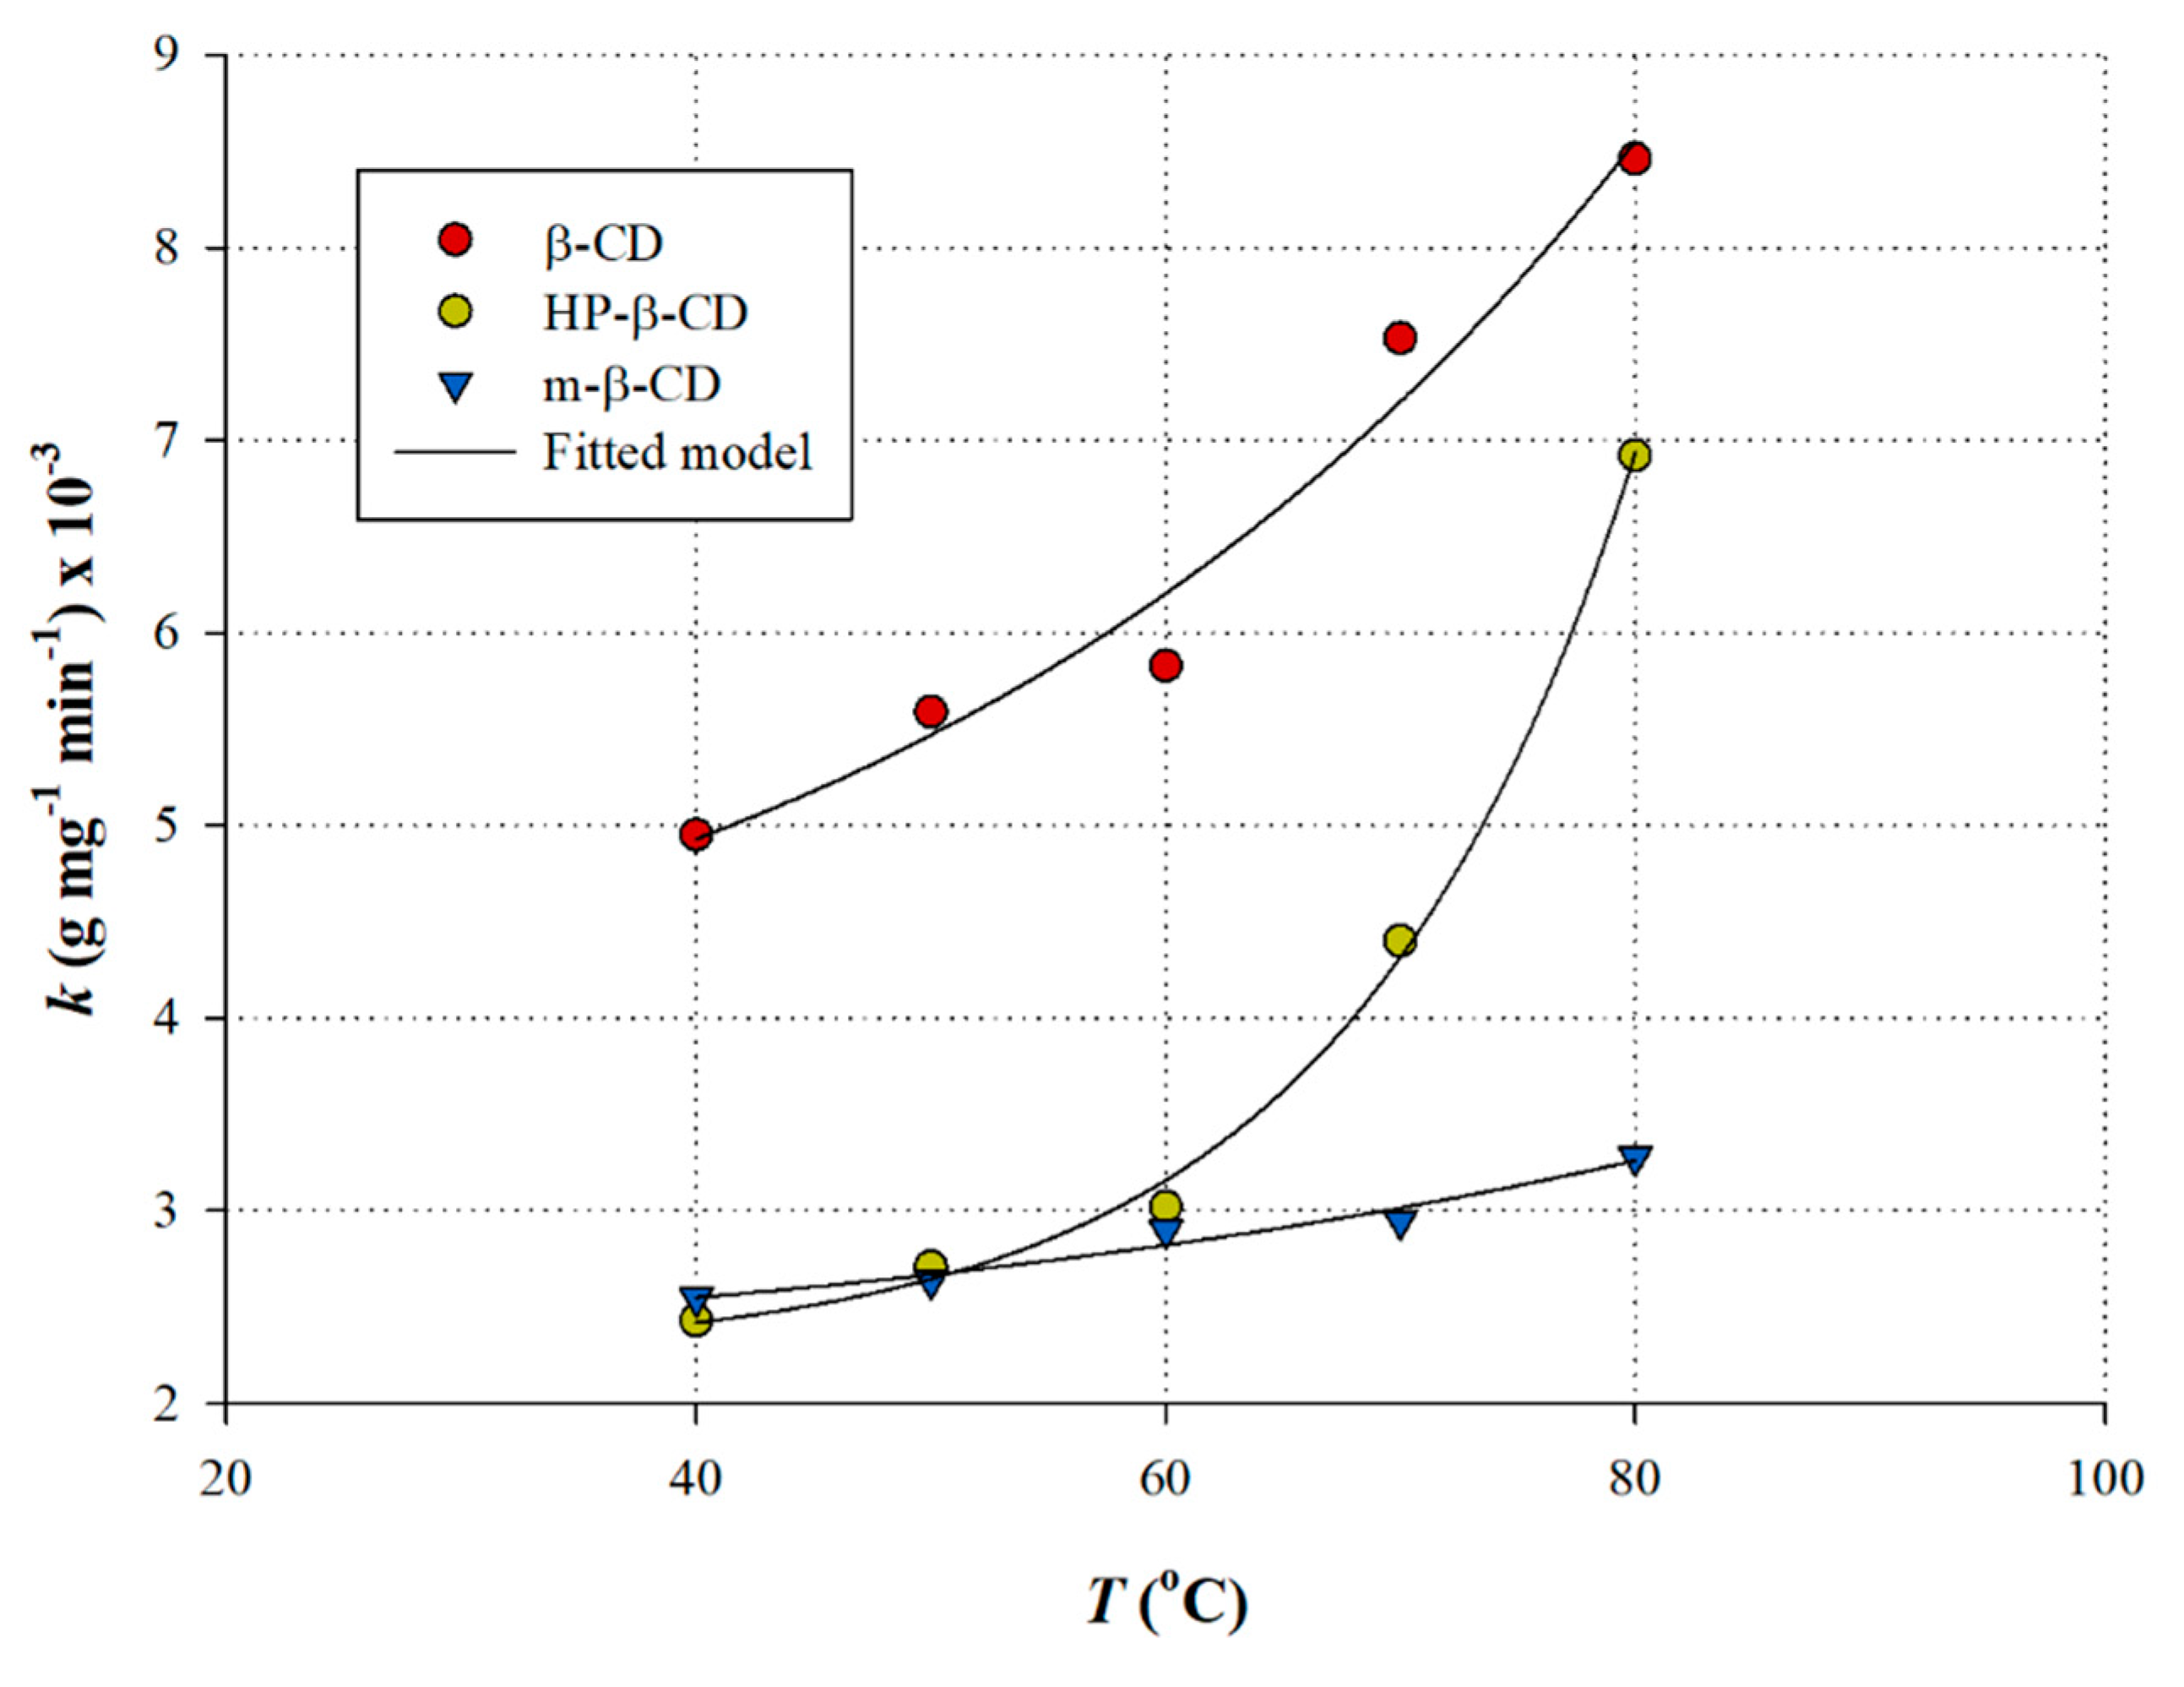
The effect of temperature on k was better illustrated by establishing correlations between k and T (Figure 7). These correlations could be very effectively described using an exponential model [27]: k = k0
k   =   k 0 + a e b T
where k corresponds to the second-order extraction rate and k0 to a pre-exponential factor. In Table 8, the parameters k0, a, and b, calculated by SigmaPlot 12.5, are given analytically. Extraction with m-β-CD displayed the lowest b value, which suggested that it was the least affected by temperature, as opposed to the extraction with HP-β-CD. This finding evidenced that m-β-CD provided the most effective and the least energy-demanding extraction of polyphenols. To ascertain this and obtain a tentative estimation of the barriers required for the extraction with each CD tested, the activation energy was determined as follows [28]:
l n ( k r e f k ) = ( E a R ) ( 1 T 1 T r e f )
where Tref was chosen as the mean temperature of testing (60 °C) and T = 40 °C. kref and k were the corresponding second-order extraction rate constants. Ea is the activation energy (J mol−1) and R the universal gas constant (8.314 J K−1 mol−1). Ea thus estimated for the extraction with β-CD, HP-β-CD, and m-β-CD were 7.18, 9.50, and 5.64 kJ mol−1, respectively. This finding did confirm that the extraction with m-β-CD was the least energy-demanding process.

3.3. Polyphenolic Profile

A chromatogram of a S. fruticosa extract, monitored at 350 nm, is given in Figure 8. The chromatograms corresponding to extracts obtained with either of the cyclodextrins tested did not display any significant difference (data not shown). In total, nine polyphenols could be reliably detected by carrying out LC/MS/MS, but for peak #1, no tentative structure could be proposed (Table 9). Peaks #2–9 were tentatively identified based on the information provided by previous studies [29,30].
To assess the efficiency of the CDs tested for polyphenol extraction, the two major constituents were considered, luteolin 7-O-glucuronide and rosmarinic acid, in order to minimize variations attributed to extraction. As can be seen in Table 10, extraction with m-β-CD afforded 7.7% higher luteolin 7-O-glucuronide yield compared with β-CD and 34.4% compared with HP-β-CD. On the other hand, β-CD was 10.1% more effective compared with m-β-CD and 13.3% compared with HP-β-CD in extracting rosmarinic acid. This outcome suggested that the structural differences in CDs may account for selectivity towards different polyphenols. In all cases, it was observed that HP-β-CD was the least effective of the three CDs tested, and future studies pertaining to cyclodextrin-aided extraction of polyphenols such as flavonoid glycosides and rosmarinic acid, should consider m-β-CD as the most efficacious extraction booster.

4. Conclusions

The current investigation examined in detail the aqueous extraction of bioactive polyphenols from the medicinal plant S. frutocosa, aided by the use of three different cyclodextrins. Following process optimization, m-β-CD was proven as the most efficient extraction booster, providing extracts with significant polyphenol yield and improved antioxidant characteristics. Extraction kinetics showed that (i) extraction performance and antioxidant activity may be even more enhanced at 80 °C and (ii) extraction with m-β-CD was the least energy demanding. LC/MS/MS analyses revealed that luteolin 7-O-glucuronide and rosmarinic acid were the predominant polyphenols in the extracts obtained with either CD, and that m-β-CD might exhibit higher affinity for luteolin 7-O-glucuronide, and β-CD for rosmarinic acid. The conclusions drawn may be of value in developing green extraction processes for effective polyphenol recovery, not only for S. frutocosa, but also other botanical species possessing similar polyphenolic composition. Furthermore, the selectivity issue concerning various CDs should be more thoroughly tested on plant matrices with variable polyphenolic composition, in order to study the effect of structural features on polyphenol extractability.

Author Contributions

Conceptualization, S.G. and D.P.M.; formal analysis, S.G., A.B., and A.H.; investigation, S.G., A.H., and D.P.M.; writing—original draft preparation, S.G. and D.P.M.; writing—review and editing, S.G. and D.P.M.; supervision, D.P.M. All authors have read and agreed to the published version of the manuscript.

Funding

This research received no external funding.

Conflicts of Interest

The authors declare no conflict of interest.

Nomenclature

AARantiradical activity (μmol DPPH g−1)
CCDcyclodextrin (β-CD, HP-β-CD, m-β-CD) concentration (%, w/v)
dmdry mass (g)
Eaactivation energy (kJ mol−1)
k0pre-exponential factor (g mg−1 min−1)
ksecond-order extraction rate constant (g mg−1 min−1)
krefsecond-order extraction rate constant at reference T (g mg−1 min−1)
PRreducing power (μmol AAE g−1)
Runiversal gas constant (8.314 K−1 mol−1)
RL/Sliquid-to-solid ratio (mL g−1)
ttime (min)
Ttemperature (°C)
Trefreference T (°C)
YTPyield in total polyphenols (mg GAE g−1)

References

  1. Xu, J.; Wei, K.; Zhang, G.; Lei, L.; Yang, D.; Wang, W.; Han, Q.; Xia, Y.; Bi, Y.; Yang, M. Ethnopharmacology, phytochemistry, and pharmacology of Chinese Salvia species: A review. J. Ethnopharmacol. 2018, 225, 18–30. [Google Scholar] [CrossRef]
  2. Hao, D.-C.; Ge, G.-B.; Xiao, P.-G. Anticancer drug targets of Salvia phytometabolites: Chemistry, Biology and omics. Cur. Drug Targ. 2018, 19, 1–20. [Google Scholar] [CrossRef]
  3. Lu, Y.; Foo, L.Y. Polyphenolics of Salvia—A review. Phytochemistry 2002, 59, 117–140. [Google Scholar] [CrossRef]
  4. Wang, J.; Xu, J.; Gong, X.; Yang, M.; Zhang, C.; Li, M. Biosynthesis, chemistry, and pharmacology of polyphenols from Chinese Salvia species: A review. Molecules 2019, 24, 155. [Google Scholar] [CrossRef] [Green Version]
  5. Belwal, T.; Ezzat, S.M.; Rastrelli, L.; Bhatt, I.D.; Daglia, M.; Baldi, A.; Devkota, H.P.; Orhan, I.E.; Patra, J.K.; Das, G. A critical analysis of extraction techniques used for botanicals: Trends, priorities, industrial uses and optimization strategies. TrAC Trends Anal. Chem. 2018, 100, 82–102. [Google Scholar] [CrossRef]
  6. Mura, P. Analytical techniques for characterization of cyclodextrin complexes in aqueous solution: A review. J. Pharm.. Biomed. Anal. 2014, 101, 238–250. [Google Scholar] [CrossRef] [PubMed]
  7. Astray, G.; Gonzalez-Barreiro, C.; Mejuto, J.C.; Rial-Otero, R.; Simal-Gandara, J. A review on the use of cyclodextrins in foods. Food Hydrocol. 2009, 23, 1631–1640. [Google Scholar] [CrossRef]
  8. Cai, R.; Yuan, Y.; Cui, L.; Wang, Z.; Yue, T. Cyclodextrin-assisted extraction of phenolic compounds: Current research and future prospects. Trends Food Sci. Technol. 2018, 79, 19–27. [Google Scholar] [CrossRef]
  9. Bezerra, M.A.; Santelli, R.E.; Oliveira, E.P.; Villar, L.S.; Escaleira, L.A. Response surface methodology (RSM) as a tool for optimization in analytical chemistry. Talanta 2008, 76, 965–977. [Google Scholar] [CrossRef]
  10. Karakashov, B.; Grigorakis, S.; Loupassaki, S.; Makris, D.P. Optimisation of polyphenol extraction from Hypericum perforatum (St. John’s Wort) using aqueous glycerol and response surface methodology. J. Appl. Res. Med. Arom. Plants 2015, 2, 1–8. [Google Scholar] [CrossRef]
  11. Albahari, P.; Jug, M.; Radić, K.; Jurmanović, S.; Brnčić, M.; Brnčić, S.R.; Čepo, D.V. Characterization of olive pomace extract obtained by cyclodextrin-enhanced pulsed ultrasound assisted extraction. LWT 2018, 92, 22–31. [Google Scholar] [CrossRef]
  12. Diamanti, A.C.; Igoumenidis, P.E.; Mourtzinos, I.; Yannakopoulou, K.; Karathanos, V.T. Green extraction of polyphenols from whole pomegranate fruit using cyclodextrins. Food Chem. 2017, 214, 61–66. [Google Scholar] [CrossRef] [PubMed]
  13. Zhang, Y.; Chen, F.-f.; Sang, J. Green approach for sample preparation and determination of anthocyanins from Lycium ruthenicum Murr. using a β-cyclodextrin-based extraction method coupled with UPLC-DAD Analysis. Food Anal. Methods 2018, 11, 2141–2148. [Google Scholar] [CrossRef]
  14. Ho, S.; Thoo, Y.Y.; Young, D.J.; Siow, L.F. Cyclodextrin encapsulated catechin: Effect of pH, relative humidity and various food models on antioxidant stability. LWT 2017, 85, 232–239. [Google Scholar] [CrossRef]
  15. Rakotondramasy-Rabesiaka, L.; Havet, J.-L.; Porte, C.; Fauduet, H. Estimation of effective diffusion and transfer rate during the protopine extraction process from Fumaria officinalis L. Separ. Purif. Technol. 2010, 76, 126–131. [Google Scholar] [CrossRef]
  16. Paleologou, I.; Vasiliou, A.; Grigorakis, S.; Makris, D.P. Optimisation of a green ultrasound-assisted extraction process for potato peel (Solanum tuberosum) polyphenols using bio-solvents and response surface methodology. Biomass Convers. Bioref. 2016, 6, 289–299. [Google Scholar] [CrossRef]
  17. Blidi, S.; Bikaki, M.; Grigorakis, S.; Loupassaki, S.; Makris, D.P. A comparative evaluation of bio-solvents for the efficient extraction of polyphenolic phytochemicals: Apple waste peels as a case study. Waste Biomass Valor. 2015, 6, 1125–1133. [Google Scholar] [CrossRef]
  18. Shehata, E.; Grigorakis, S.; Loupassaki, S.; Makris, D.P. Extraction optimisation using water/glycerol for the efficient recovery of polyphenolic antioxidants from two Artemisia species. Separ. Purif. Technol. 2015, 149, 462–469. [Google Scholar] [CrossRef]
  19. Philippi, K.; Tsamandouras, N.; Grigorakis, S.; Makris, D.P. Ultrasound-assisted green extraction of eggplant peel (Solanum melongena) polyphenols using aqueous mixtures of glycerol and ethanol: Optimisation and kinetics. Environ. Proc. 2016, 3, 369–386. [Google Scholar] [CrossRef]
  20. Cirri, M.; Maestrelli, F.; Corti, G.; Furlanetto, S.; Mura, P. Simultaneous effect of cyclodextrin complexation, pH, and hydrophilic polymers on naproxen solubilization. J. Pharm. Biomed. Anal. 2006, 42, 126–131. [Google Scholar] [CrossRef]
  21. Liptak, M.D.; Gross, K.C.; Seybold, P.G.; Feldgus, S.; Shields, G.C. Absolute pKa determinations for substituted phenols. J. Am. Chem. Soc. 2002, 124, 6421–6427. [Google Scholar] [CrossRef] [PubMed]
  22. Herrero-Martínez, J.M.; Repollés, C.; Bosch, E.; Rosés, M.; Ràfols, C. Potentiometric determination of aqueous dissociation constants of flavonols sparingly soluble in water. Talanta 2008, 74, 1008–1013. [Google Scholar] [CrossRef] [PubMed]
  23. Mylonaki, S.; Kiassos, E.; Makris, D.P.; Kefalas, P. Optimisation of the extraction of olive (Olea europaea) leaf phenolics using water/ethanol-based solvent systems and response surface methodology. Anal. Bioanal. Chem. 2008, 392, 977. [Google Scholar] [CrossRef] [PubMed]
  24. Kiassos, E.; Mylonaki, S.; Makris, D.P.; Kefalas, P. Implementation of response surface methodology to optimise extraction of onion (Allium cepa) solid waste phenolics. Innov. Food Sci. Emerg. Technol. 2009, 10, 246–252. [Google Scholar] [CrossRef]
  25. Karvela, E.; Makris, D.P.; Kalogeropoulos, N.; Karathanos, V.T. Deployment of response surface methodology to optimise recovery of grape (Vitis vinifera) stem polyphenols. Talanta 2009, 79, 1311–1321. [Google Scholar] [CrossRef] [PubMed]
  26. Makris, D.; Kefalas, P. Kinetic modelling for polyphenol extraction from onion (Allium cepa) solid wastes using acidified water/ethanol mixture. Acta Alimen. 2015, 44, 482–492. [Google Scholar] [CrossRef] [Green Version]
  27. Peleg, M.; Normand, M.D.; Corradini, M.G. The Arrhenius equation revisited. Crit. Rev. Food Sci. Nutr. 2012, 52, 830–851. [Google Scholar] [CrossRef]
  28. van Boekel, M. Statistical aspects of kinetic modeling for food science problems. J. Food Sci. 1996, 61, 477–486. [Google Scholar] [CrossRef]
  29. Atwi, M.; Weiss, E.-K.; Loupassaki, S.; Makris, D.P.; Ioannou, E.; Roussis, V.; Kefalas, P. Major antioxidant polyphenolic phytochemicals of three Salvia species endemic to the island of Crete. J. Herbs Spices Med. Plants 2016, 22, 27–34. [Google Scholar] [CrossRef]
  30. Koutsoulas, A.; Čarnecká, M.; Slanina, J.; Tóth, J.; Slaninová, I. Characterization of phenolic compounds and antiproliferative effects of Salvia pomifera and Salvia fruticosa extracts. Molecules 2019, 24, 2921. [Google Scholar] [CrossRef] [Green Version]
Figure 1. Cyclodextrin structures tested in this study. Assignments: m-β-CD, methyl β-cyclodextrin; HP-β-CD, hydroxypropyl β-cyclodextrin; β-CD, β-cyclodextrin.
Applsci 10 03447 g001
Figure 2. Contour graphs presenting the effect of simultaneous variation of independent variables on the response. Assignments: β-CD, β-cyclodextrin; HP-β-CD, hydroxypropyl β-cyclodextrin; m-β-CD, methyl β-cyclodextrin.
Applsci 10 03447 g002
Figure 3. Desirability function for each of the CDs tested, displaying optimal conditions and maximum predicted response values. Assignments: m-β-CD, methyl β-cyclodextrin; HP-β-CD, hydroxypropyl β-cyclodextrin; β-CD, β-cyclodextrin.
Applsci 10 03447 g003
Figure 4. Kinetics of polyphenol extraction from S. fruticosa, with each of the CDs tested, within a range from 40 to 80 °C. Extractions were performed under optimized conditions. Assignments: m-β-CD, methyl β-cyclodextrin; HP-β-CD, hydroxypropyl β-cyclodextrin; β-CD, β-cyclodextrin.
Applsci 10 03447 g004
Figure 5. Plot showing YTP achieved using each of the CDs tested, under optimized conditions, at 80 °C, after 180 min.
Applsci 10 03447 g005
Figure 6. Diagram illustrating the AAR and PR of the extracts produced using each of the CDs tested, under optimized conditions, after 180 min, at 80 °C. Assignments: m-β-CD, methyl β-cyclodextrin; HP-β-CD, hydroxypropyl β-cyclodextrin; β-CD, β-cyclodextrin.
Applsci 10 03447 g006
Figure 7. Non-linear regression between second-order extraction rates (k) and T.
Applsci 10 03447 g007
Figure 8. HPLC trace recorded at 330 nm, of a S. fruticosa extract, obtained with m-β-CD under optimized conditions, at 80 °C, after 180 min.
Applsci 10 03447 g008
Table 1. Process variables (actual and coded levels) considered for the design of experiment.
Independent VariablesCode UnitsCoded Variable Level
−101
CCD (%, w/v)X10.601.001.40
RL/S (mL g−1)X22060100
pHX3357
Table 2. Statistical data associated with the mathematical models, built using response surface methodology. m-β-CD, methyl β-cyclodextrin; HP-β-CD, hydroxypropyl β-cyclodextrin.
TermStandard Errort RatioProbability > tSum of SquaresF Ratio
β-CD
Intercept0.84662451.50<0.0001 *6.31901-
CCD0.5184491.710.1471239.914512.9386
RL/S0.51844910.560.0001 *252.90005111.5718
pH0.518449−10.840.0001 *12.14523117.6107
CCD RL/S0.733198−2.380.06340.115605.6481
CCD pH0.733198−0.230.82580.656100.0538
RL/S pH0.733198−0.550.60451.934080.3051
CCDCCD0.763136−0.950.386553.141680.8994
RL/S RL/S0.763136−4.970.0042 *82.8260824.7134
pH pH0.763136−6.210.0016 *6.3190138.5181
Lack-of-Fit 0.10679.9721758.5298
HP-β-CD
Intercept1.0531944.02<0.0001 *1.88180-
CCD0.6449450.750.4859298.779010.5655
RL/S0.6449459.480.0002 *130.8153189.7874
pH0.644945−6.270.0015 *3.1862339.3119
CCD RL/S0.9120890.980.37286.943230.9575
CCD pH0.9120891.440.208222.944102.0865
RL/S pH0.912089−2.630.0468 *1.931866.8950
CCDCCD0.9493330.760.48059.207760.5806
RL/S RL/S0.949333−1.660.157180.324132.7671
pH pH0.949333−4.910.0044 *1.8818024.1386
Lack-of-Fit 0.115315.3328757.8313
m-β-CD
Intercept0.54715587.27<0.0001 *34.56961
CCD0.2735777.600.0047 *195.8996057.7357
RL/S0.33506218.090.0004 *193.40255327.1775
pH0.335062−17.970.0004 *0.18923323.0072
CCD RL/S0.386897−0.560.61333.276100.3160
CCD pH0.3868972.340.101317.096635.4715
RL/S pH0.5471555.340.0128 *6.9176328.5536
CCDCCD0.473853.400.0425 *20.8041311.5533
RL/S RL/S0.47385−5.890.0097 *79.9532534.7456
pH pH0.47385−11.560.0014 *34.56961133.5322
Lack-of-Fit 0.85470.48406870.1844
Asterisk (*) denotes statistically significant value, at least at a 95% significance level.
Table 3. Experimental design points and the corresponding predicted and measured YTP values for the extractions carried out with each of the CDs used. GAE, gallic acid equivalent.
Design PointIndependent VariablesResponse (YTP, mg GAE g−1 dw)
CCD (X1)RL/S (X2)pH (X3)β-CDHP-β-CDm-β-CD
MeasuredPredictedMeasuredPredictedMeasuredPredicted
1−1−1030.7430.9739.0339.8038.1638.21
2−11046.9745.4149.9450.2451.0350.77
31−1034.6836.2439.2938.9942.5442.80
411043.9443.7053.7753.0054.5454.49
50−1−135.6334.8134.6435.6642.6842.37
60−1125.3524.3833.8532.3626.5024.47
701−145.6046.5751.1852.6748.6448.64
801133.7034.5240.8139.7942.1342.44
9−10−142.1242.7049.0947.3048.4748.73
1010−145.5644.8246.3545.6351.0351.08
11−10131.0631.8035.8636.5834.9334.88
1210133.8233.2438.3940.1841.1140.85
1300043.9343.6045.7246.3648.5647.75
1400043.9943.6046.1046.3648.5047.75
1500042.8843.6047.2746.3646.9447.75
Table 4. Mathematical models and associated statistics derived from the experimental design.
Cyclodextrin2nd Order Polynomial EquationsR2p
β-CD43.60 + 5.48X2 − 5.63X3 − 3.79 X 2 2 − 4.74 X 3 2 0.980.0006
HP-β-CD46.36 + 6.11X2 − 4.04X3− 2.39X2X3 − 4.66 X 3 2 0.970.0025
m-β-CD47.75 + 2.08X1 + 6.06X2 − 6.02X3 + 2.92X2X3 − 2.79 X 2 2 − 5.48 X 3 2 1.000.0024
Table 5. Values of the optimal predicted conditions and maximum predicted YTP (± sd) for S. fruticosa polyphenol extraction by the CDs tested.
CyclodextrinMaximum Predicted Response (YTP, mg GAE g−1 dw)Optimal Conditions
CCD (w/v, %)RL/S (mL g−1)pH
β-CD47.48 ± 2.290.88933.75
HP-β-CD54.40 ± 4.421.401003.90
m-β-CD54.72 ± 2.111.40944.54
Table 6. The effect of each of the CDs tested on the extractability of polyphenols from S. fruticosa, compared with equally buffered deionized water, under optimal RL/S.
Extraction MediumYTP (mg GAE g−1 dw)Extraction Conditions
CCD (w/v, %)RL/S (mL g−1)pH
β-CD45.75 ± 1.110.88933.75
Buffered dH2O40.59 ± 1.01-933.75
HP-β-CD50.52 ± 1.191.401003.90
Buffered dH2O40.76 ± 1.02-1003.90
m-β-CD54.25 ± 1.351.40944.54
Buffered dH2O42.28 ± 1.05-944.54
Table 7. Kinetic parameters determined for the extraction of S. fruticosa polyphenols with the CDs tested. Extractions were accomplished under optimal CCD, RL/S, and pH.
T (°C)Kinetic Parameters
k (×10−3)
(g mg−1 min−1)
h (mg g−1 min−1)YTP(s) (mg GAE g−1)
β-CD
404.9511.7648.74
505.5914.4550.86
605.8321.5160.75
707.5333.7066.89
808.4648.6875.85
HP-β-CD
402.438.9160.53
502.7111.0963.92
603.0216.3073.41
704.4028.8480.92
806.9246.4781.93
m-β-CD
402.5514.6668.99
502.6417.9982.56
602.9021.7986.71
702.9525.9793.89
803.2831.7698.39
Table 8. Fitting parameter values determined by correlating second-order extraction rates (k) with T.
CDParameter Estimates
k0 (×10−6)a (×10−5)bR2p
β-CD3.4090.45000.03050.970.0320
HP-β-CD2.2420.00680.08161.000.0022
m-β-CD2.1030.17270.02380.960.0351
Table 9. Spectral information pertaining to polyphenols detected in S. fruticosa extracts, obtained with either CD tested.
NoRt (min)UV/Vis (λmax)[M − H] (m/z)Other Ions (m/z)Tentative Identity
119.58270, 340593-Unknown
222.28280, 3444773016-Hydroxy luteolin 7-O-glucoside
324.38256, 352461285Luteolin 7-O-glucuronide
425.25258, 348593285Luteolin 7-O-rutinoside
525.82270, 3524912996-Methoxyluteolin 7-O-glucoside (nepitrin)
626.62246, 316359161Rosmarinic acid
727.50264, 346445269Apigenin 7-O-glucuronide
829.55270, 3524752996-Methoxyluteolin derivative
930.12274, 332461299, 2836-Methoxyluteolin derivative
Table 10. Quantitative data on the recovery of major S. fruticosa polyphenols with the CDs tested, under optimal conditions.
ExtractYield (mg g−1 dm)
Luteolin 7-O-glucuronideRosmarinic Acid
β-CD3.35 ± 0.027.12 ± 0.00
HP-β-CD2.38 ± 0.026.17 ± 0.10
m-β-CD3.63 ± 0.036.40 ± 0.20

