1. Introduction
Barrett’s Esophagus (BE) is a known precursor for Esophageal AdenoCarcinoma (EAC), a form of gastrointestinal cancer with a particularly poor prognosis. For this reason, patients with BE undergo regular endoscopic surveillance. This offers early detection of neoplasia and enables endoscopic treatment, which has an excellent prognosis [
1,
2]. However, the current BE surveillance protocol is suboptimal, mainly due to the fact that neoplasia is difficult to detect because of their subtle endoscopic appearances [
1]. Additionally, BE surveillance is time consuming, expensive, and has a high potential for sampling error of random biopsies [
3].
Generally, endoscopic diagnosis is established in two stages. First, primary detection of a suspected lesion is determined with White Light Endoscopy (WLE) in overview, followed by a detailed inspection of the mucosa for any visible abnormalities and to identify the lesion boundaries. This inspection is often performed using Narrow Band Imaging (NBI), an imaging modality that exploits light of specific blue and green wavelengths to enhance the visible details of e.g., the surface texture of the mucosa. More specifically, NBI is used in combination with a magnified view to improve the visualization of mucosal and vascular patterns. Several different NBI clinical classification systems have been proposed, which involve complicated and diverse criteria, all of which have demonstrated suboptimal diagnostic accuracy and inter-observer agreement [
4,
5,
6]. In daily practice, endoscopists performing BE surveillance struggle with the evaluation of NBI imagery in magnified view for characterization of BE neoplasia. New advances in Computer-Aided Detection (CAD), more specifically deep learning techniques, may be able to overcome limitations related to the varying observations of different endoscopists, and thereby improve on the diagnostic accuracy for detailed inspection.
Especially deep learning techniques have shown promising results in a variety of different scientific research domains, including gastrointestinal endoscopy [
7,
8,
9]. Recently, our group demonstrated a highly effective computer-aided detection system, that recognizes and localizes BE neoplasia on WLE overview images in real time with high accuracy, enabling primary detection [
10]. The aim of the current study is to investigate the feasibility of a deep learning algorithm for the characterization of NBI-zoom imagery after primary detection in WLE.
To our knowledge, there is no prior art pertaining to the classification of early cancerous lesions in BE using NBI-zoom videos. However, other work has investigated the use of NBI-zoom
still images [
11] or NBI in overview [
12] for the classification of colorectal tumors. In earlier work, we initially explored extracting the additional information contained in multi-modal imaging, using deep learning and a combination of NBI and WLE in overview, to improve localization scores for dysplasia in BE [
13]. Ebigbo et al. [
14] performed a similar classification study using both WLE as well as NBI images, using the near-focus functionality of the endoscope. However, results in these studies were preliminary and based on small image-based data sets to illustrate a proof of concept.
In this work, a large data set of NBI-zoom imagery is used for the classification of dysplasia in BE. In contrast to prior work, endoscopic zoom
videos, rather than still images, are used to improve the classification performance. Additionally, this work does not rely on ImageNet pretraining. Instead, it builds further upon endoscopy-driven pretraining, as introduced in previous work [
15,
16]. Networks that do not depend on ImageNet pretraining are preferable, since there are licences associated with the ImageNet data set. In this work, we give another empirical example in favor of endoscopic pretraining. Besides this, we show the benefit of a pseudo-labeled bootstrap ensemble for classification of NBI-zoom videos.
2. Methods
This section is structured as follows: first, the setting of the study is discussed in
Section 2.1. Second, in
Section 2.2, the employed pre-training and training data sets are discussed together with a few examples of the training set. Third, an in depth description of the employed deep learning model is presented in
Section 2.3. Fourth, the pretraining methodology is discussed in
Section 2.4. Fifth, the additional training details of the employed algorithm and the comparison to other pretraining strategies are presenter in
Section 2.5 and
Section 2.6, respectively. Finally, the metrics that are used to compare the different models are explained in
Section 2.7.
2.1. Setting
This study was performed at at the departments of Gastroenterology and Hepatology of the Amsterdam University Medical Centers, location Academic Medical Center, and Karolinska University Hospital, Stockholm, both tertiary referral centers for Barrett neoplasia. Official approval for the use of all imagery was obtained by the local Ethics’ Committee at both centers. The technical development was performed at the Video Coding and Architectures research group in the department of Electrical Engineering of the Eindhoven University of Technology.
2.2. Data Sets
2.2.1. GastroNet Data Set
The pretraining data set, which we have coined GastroNet, contains
endoscopic images from
patients [
15,
16]. The images in this set contain a variety of endoscopic imagery (e.g., colon, stomach, duodenum, esophagus). All images were collected retrospectively, during the years 2012–2018 at the Amsterdam University Medical Centers, location Academic Medical Center, and automatically anonymized after extraction from the database. From this set, 3743 of the images were labeled by two gastroenterology research fellows into five categories: colon (
n = 679), duodenum (
n = 339), stomach (
n = 876), esophagus (
n = 1305), or other (
n = 544). This set is used for pretraining with the pseudo-labeled bootstrapping algorithm, as described in prior work [
15], thereby also exploiting the unlabeled data. The GastroNet database contains images (All imagery was recorded with HQ190, HQ180, HQ140, and HQ290 endoscopes (Olympus, Japan), and the 700 series endoscopes (Fujifilm, Japan)) with a large variety of resolutions, which are normalized to 256 × 256 pixels.
2.2.2. NBI-Zoom Data Set
For this work, 159 endoscopic NBI-zoom videos from 51 patients were collected. The videos were unaltered except for resizing, i.e., no optically bad videos or frames were removed prior to analysis. Of these patients, 17 were diagnosed with dysplasia in BE and 34 patients had a Non-Dysplastic Barrett’s Esophagus (NDBE), as confirmed by histopathology. For each imaged region within the BE of a patient, a biopsy was obtained for histopathological assessment. In total, 59 videos of our data set contain dysplasia and 100 videos show NDBE only. All videos were resized to 256 × 256 pixels for computational efficiency (original video resolution: 720 × 576 pixels). The average duration of each NBI-video was 10 seconds. These short videos consisted solely of one tissue type, either NDBE or neoplastic BE. From the endoscopic videos, frames were sampled at 5 frames per second and assigned the label of the corresponding video. In this work, all videos of a single patient are always designated to the same set (training or validation). Two examples of regions with a dysplastic lesion and without a lesion are shown in
Figure 1a and
Figure 1b, respectively.
2.3. Deep Learning Architecture Description
The applied deep learning encoder-decoder network used in this study was adopted from previous work (details are provided in [
15]). An encoder-decoder network is a type of architecture that converts a particular input representation (in this case an rgb image) into an abstact feature space using a encoder. A decoder then takes this abstract feature space and converts it into a different representation (e.g., a segmentation mask, an image caption, or a depth map). Note that this architecture comprises of an encoder-decoder network capable of both classification and segmentation. Since endoscopic-zoom videos only require classification, the decoder branch of the model is not used in this study. A schematic overview of the designed classifier is shown in
Figure 2. The classification network is a Resnet-based architecture, which enables a mapping from a single input image (
pixels) to a frame classification score
.
Each green block (residual module) in
Figure 2 consists of two convolutional layers with ReLU (Rectified Linear Unit) activation functions. A residual skip-connection is used as proposed by He et al., in the original ResNet paper [
17]. Batch normalization [
18] is used after each convolutional layer for normalization purposes. After each residual module, an average-pooling operation is performed with kernel size 2 and stride 2 to reduce the feature-map resolution by a factor 2 at each level. In the first residual module, 32 filters are employed. The amount of convolutional filters in each subsequent level is multiplied by a factor 2 after each pooling operation, as is standard in nearly all classification algorithms. After the final residual module, a global average pooling filter is employed to convert the 3D feature map to a single vector which contains the encoded relevant features. Finally, two small fully connected layers followed by a softmax activation function, are used to assign a classification score to the input frame where values closer to unity indicate dysplasia and values close to zero indicate non-dysplastic Barrett’s esophagus.
2.4. Pretraining Methodology
The network is pretrained on a large variety of endoscopic imagery (
Section 2.2.1), instead of the natural images contained in the ImageNet [
19] data set. Endoscopy-driven pretraining has two main advantages. (1) The images in the GastroNet data set are more similar to the target domain compared to ImageNet and are therefore more likely to be a good initialization. (2) While the ImageNet data set and labels are freely available for scientific research, the data cannot be used for commercial use, which is important if CAD algorithms emerge in a clinical setting. In this work, 5 models with different initializations are trained to create the ensemble. In order to pretrain the networks, Pseudo-Labeled Bootstrapping (PLB) is employed. An overview of the PLB algorithm can be summarized as follows. First, the portion of the GastroNet data set that has labels is used to create a supervised model. Second, pseudo-labels are generated for the remaining data using this supervised model. Third, 5 unique subsets of the entire data set with the newly generated pseudo-labels are used to pretrain 5 models. A more in-depth description of the PLB methodology used for pretraining is described in prior work [
15]. Resulting from the 5 models, multiple instances of the network are available, which are exploited to create a diverse ensemble to increase the algorithm performance.
2.5. Training Details
The algorithm is trained using Adam [
20] and AMS-grad [
21] with a weight decay of
. A cyclic cosine learning-rate scheduler [
22] is used to control the learning rate. Binary cross-entropy is employed for the classification loss, as defined by Equation (
1), which is given by:
where the binary coefficient
is the true classification label and
is the predicted classification score.
Additionally, batch normalization is used to regularize the network. The model is further regularized with data augmentation. Images are randomly rotated with
degrees and randomly flipped along the
x- and
y-axis with probability
. Moreover, random permutations are made to the color, contrast and brightness of the images. Furthermore, images are randomly sheared by up to 8 degrees and randomly translated by up to
of the image width. Lastly, random crops of various sizes are taken from the original images without resizing, to preserve consistency in feature size. All experiments are performed on a desktop PC with the following specifications, Xeon CPU E5-1650 v4, operating at 3.60 GHz, RAM of 32 GB, Titan Xp 12-GB GPU. Since all frames in any given video have the same pathology, a video-level prediction score is calculated by taking the average over all frame predictions of a single video which is thresholded to obtain a classification label per video. These labels are then finally used to calculate the metrics described in
Section 2.7. Fourfold subject-wise cross-validation is used to train and test the algorithm, where all videos of a single patient are contained in a single fold to avoid intra-patient bias.
2.6. Comparison to ImageNet and without Pretraining
To assess the added value of domain-specific, endoscopic pretraining, the exact same neural network architecture is used to train models without pretraining and pretraining with ImageNet. As described in
Section 2.5, 5 different models are trained with GastroNet from different initializations. To facilitate a fair comparison, a
no-pretraining ensemble is created using 5 different random weight initializations and an ImageNet ensemble is created using the model pretrained on ImageNet with 5 different random seeds.
Table 1 in the results section shows the averaged metrics of the 5 models as well as the ensemble predictions.
2.7. Metrics
In line with conventional detection and classification algorithms, we measure true positives
, true negatives
, false positives
and false negatives
. In our implementation, cancerous frames are defined as positive samples. Using the aforementioned parameters, we evaluate all models on the following four metrics:
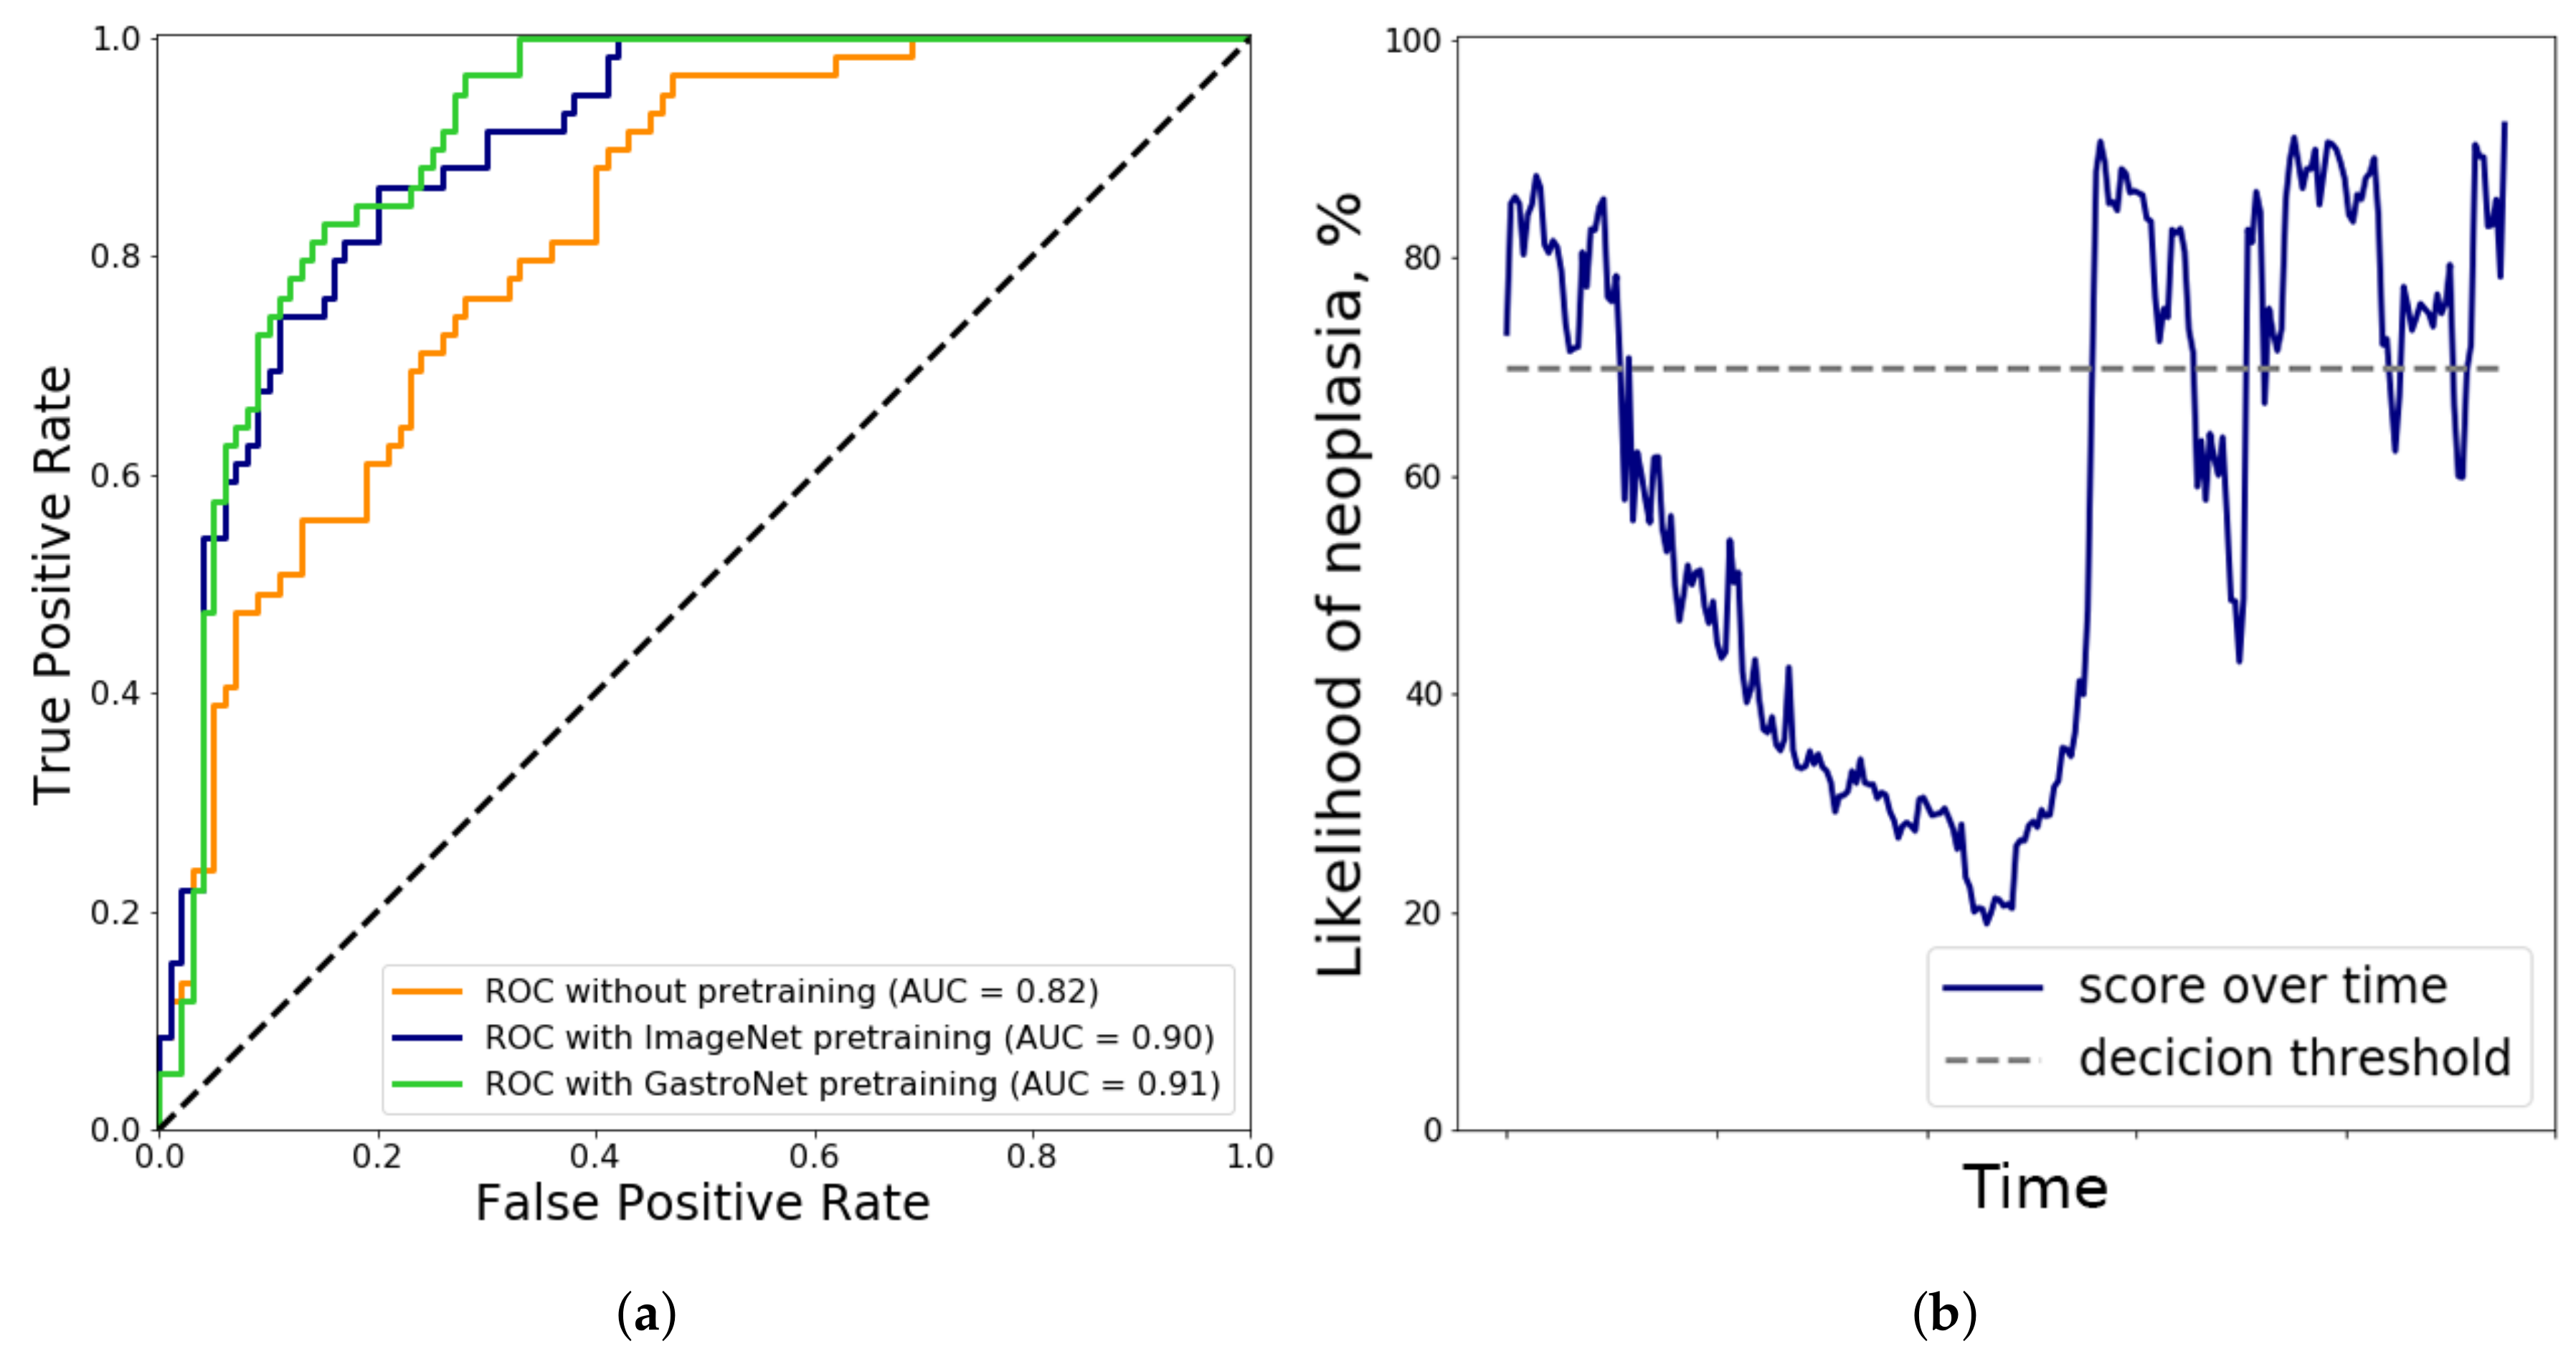
In addition to these metrics, the ROC curves with corresponding Area Under the Curve (AUC) of the 3 ensemble models are computed to yield an indication of the performance over several different operating points.
4. Discussion
Endoscopic diagnosis of early BE neoplasia is generally a two-step process of primary detection in overview, followed by detailed inspection of visible abnormalities using Narrow Band Imaging. However, endoscopists struggle with characterizing NBI-zoom imagery of subtle abnormalities, because NBI classifications are either too crude (‘regular’ vs. ‘irregular’) or consist of too many sub-classifications, which results in a subjective assessment. In adjunct to our earlier work on CAD analysis of WLE overview imagery for primary detection of neoplasia [
9,
10,
16], this work improves on BE characterization using CAD analysis of NBI-zoom imagery. Here we have reported the first results of a well-developed and tested deep learning CAD system for the characterization of NBI-zoom videos of in BE.
Most classification algorithms applied to the medical domain use models pretrained with ImageNet. This is a valid approach, considering that large data sets of more related imagery are usually not available. Additionally, models that employ pretraining typically outperform non-pretrained models. However, pretraining with ImageNet is not necessarily optimal. In previous work [
15], we hypothesized that endoscopy-driven pretraining is preferable to more general pretraining with natural images. For the classification of NBI-zoom videos, in this work we provide empirical proof that endoscopy-driven pretraining outperforms not only the absence of pretraining, but standard pretraining as well. Moreover, ImageNet cannot be used for commercial use straightforwardly, which is essential when CAD algorithms are going to be deployed in clinical practice.
High specificity is vital for successful clinical implementation of a CAD system for BE characterization in the second zoom-enhanced stage of the endoscopic diagnosis process. During surveillance endoscopies, endoscopists will most likely first be triggered by abnormal areas in overview, after which they will interrogate this area in detail for the presence of neoplasia using NBI. A characterization CAD system with high specificity would then be able to decrease the number of false-positive predictions by endoscopists, thereby reducing unnecessary biopsies. This system is vital for successful implementation of the primary detection system in WLE overview. Our previous work was conducted on high quality overview images in white light, captured by expert endoscopists. If this primary detection system is tested in real-life by non-expert endoscopists on endoscopic videos, the number of false-positive predictions would increase incrementally due to the presence of low quality and non-informative frames. In order to make this primary detection system more clinically-applicable, we propose a second NBI zoom algorithm to reduce the number of false positive predictions. Subsequently this may decrease the number of unnecessary biopsies, and thus decrease procedure time and increase cost-effectiveness. Additionally, the NBI zoom algorithm can investigate all potentially suspicious areas after the endoscopist or primary detection algorithm and thereby detect additional neoplastic areas.
Work by Sharma et al. [
6] has shown that good system performance can be achieved (85% accuracy) with an internally validated clinical classification system. Additionally, performance can be increased further when only assessing high confidence samples are evaluated (Accuracy 92%). However, an average high level of confidence among experts was achieved only in 62% of the examinations. This indicates that assessor inter-variability remains a problem for these clinical systems. While detection of dysplasia might be higher for experienced endoscopists for now, a CAD system as proposed in this work could aid practicing endoscopists in making better decisions.
Although the performance of the proposed algorithm is promising, the current results do not yet support its application in clinical practice. In contrast to earlier work which used WLE imagery [
10], one drawback of this study is the relatively small amount of unique patients that are used for training and testing. While the deep learning algorithm is exposed to a large amount of single frames, the correlation between sequential frames is very high, since the videos are focused on a single area. For this reason, the practical benefit of using all video frames is limited and only 5 frames are extracted per second instead of the 25 that are available. Additionally, different videos from the same patient are subject to intra-patient correlation as well. While each video is recorded at a unique site, intra-patient correlation can still lead to reduced performance. However, we corrected for this when analyzing the NBI zoom videos, to reduce the intra-patient bias. A second drawback of the current study is that the collection of the zoom videos was performed in multiple hospitals, by different endoscopists and endoscopes, which results in varying levels of image quality and levels of magnification. Normally, this would help generalization over larger populations. However, due to the limited sample size of this pilot study, the algorithm may not be robust against this background noise, which is a clear constraint of the current acquisition approach. Dysplasia in BE is relatively rare which makes data acquisition more difficult, so that simply collecting more data is not a viable short-term solution. Finally, upon review, decreased video quality such as blurring, specular reflections and lens movement was observed in many of the incorrectly classified videos. For example, in
Figure 3b, the likelihood of dysplasia is plotted as a function of time. There is a pronounced dip in the confidence of the algorithm in the first half of the segment. This coincides with lens movement and blurring in this specific video. This indicates that artifacts such as movement, blurring and specular reflections pose a time-varying problem when classifying NBI-zoom videos.
In future work, efficacy of the algorithm can be improved by excluding non-informative frames prior to classifying an NBI-zoom video. Other work has shown that removal of non-informative frames is beneficial for classification performance of videos using white light endoscopy [
24]. The artifacts that cause non-informative frames are less prevalent in zoom video compared to standard endoscopies, since the entire segment is focused on a single site in the NBI-zoom case. However, analysis from this study has shown that performance also decreases in some cases due to the occurrence of non-informative frames in the video.
As alternative future work, more extensive experiments should be performed with additional problems and data sets related to the gastrointestinal tract, such as for example: angiodysplasia detection with pill-cam imagery, polyp detection and classification using colonoscopy imagery, and stomach cancer classification using white light endoscopy. Together with a prior study [
15], two separate experimental setups have indicated that endoscopy-driven pretraining is beneficial for BE CAD problems. Future work could indicate whether this finding holds for other gastrointestinal diseases as well.
5. Conclusions
Detailed inspection of the mucosa in Barrett’s esophagus is often performed using Narrow Band Imaging with a magnified view, to improve visualization of mucosal and vascular patterns. However, most clinical classification systems have suboptimal diagnostic accuracy and inter-observer agreement. Computer-aided detection is able to overcome limitations in the varying observations of different endoscopists and help improve diagnostic accuracy.
This work has presented the benefit of endoscopy-driven pretraining for the classification of NBI-zoom videos. The accuracy of the ensemble based on pseudo-labeled bootstrapping with 5 models, increases by 10% when a domain-specific endoscopy data set (GastroNet) is used to initialize the weights compared to random initialization. Additionally, this training approach outperforms ImageNet pretraining by approximately 2% for the classification of NBI-zoom videos in addition to more stable convergence as indicated clearly by the lower standard deviation. Since the performance of the proposed model is non-inferior, and even slightly better, compared to the broadly used conventional ImageNet pretraining, we anticipate that it serves as a better source for pretraining other models related to endoscopic image analysis. Future studies should confirm this hypothesis.

 ,
, 


