Article

Seismic Performance of Various Piles Considering Soil–Pile Interaction under Lateral Cycle Loads for Integral Abutment Jointless Bridges (IAJBs)

1
Key Lab of Fujian Province on Prevention Disaster of Civil Engineering, College of Civil Engineering, Fuzhou University, Fuzhou 350108, China
2
College of Civil Engineering, Fuzhou University, Fuzhou 350108, China
*
Authors to whom correspondence should be addressed.
Appl. Sci. 2020, 10(10), 3406; https://doi.org/10.3390/app10103406
Submission received: 21 April 2020 / Revised: 7 May 2020 / Accepted: 11 May 2020 / Published: 14 May 2020
(This article belongs to the Special Issue Advances on Structural Engineering)

Abstract

:
The flexural pile foundation is used in integral abutment jointless bridges (IAJBs) in practical engineering to effectively dissipate the horizontal reciprocating deformation induced by the ambient temperature or earthquake loadings. Various types of flexural piles including the H-shaped steel pile (HP), prestressed concrete pile (PC), prestressed high-strength concrete pile (PHC) as well as the reinforcement concrete pile (RC) have been implemented in IAJBs. However, there is a lack of comprehensive studies on the flexural deformation and seismic performances of these piles. In order to investigate and compare their mechanical behaviors and seismic performances, a low-cycle pseudo-static test on several different types of piles was carried out. The test results indicated that the plastic hinge location of piles moved to a deeper pile depth with the increase of reinforcement ratio, buried pile depth and prestressing level, which led to better pile–soil interaction. The crack resistance of a concrete pile was improved as the reinforcement ratio and prestressing level increased. Moreover, the rectangular pile had a better soil–pile interaction and energy dissipation capacity than the circular pile. The inflection point of the pile deformation shifted deeper as reinforcement ratio, buried pile depth and prestressing level increased, which improved the effective length and horizontal deformation capacity of piles. The H-shaped steel pile showed a better elastic-plastic deformation capacity, ductility and energy dissipation capacity as compared to the concrete pile. Moreover, the pile having a higher bearing ratio sustained larger lateral loads whereas the surrounding soil was subjected to higher loads. Finally, new seismic design criteria of three-stage seismic fortification and five damage level for the concrete piles of IAJBs were proposed.

1. Introduction

The integral abutment jointless bridge (IAJB) has many advantages including beneficial integrity, durability, comfortable driving and favorable seismic behavior. The pile foundations of IAJBs may be subjected to cyclic longitudinal deformations due to expansion and contraction of girders induced by ambient temperature and earthquakes, which result in a remarkable soil–pile interaction [1,2,3,4,5]. Therefore, ductile piles are commonly used in IAJBs to sustain the cyclic deformations.
Currently, various piles with different sections and materials such as the reinforcement concrete (RC) pile, prestressed concrete (PC) pile, H-shaped steel pile, steel tubular pile, and concrete-filled steel tubular (CFST) pile are widely adopted in the IAJBs. Several IAJBs supported on H-shaped steel piles have been constructed in North America and Europe, and researchers showed that the H-shaped steel pile is the best type of pile foundation for the IAJBs [6,7,8,9,10]. Lafave et al. [11], Xiao et al. [12], Karalar et al. [13] and Far et al. [14] studied the mechanical behaviors of a H-shaped steel pile subjected to ambient temperature and earthquake loadings. The test results indicated that the H-shaped steel pile had good plastic deformation capacity and was widely adopted in IAJBs. Nevertheless, in some countries, the concrete pile and other types of piles are also used to support the IAJBs because of economy, habitual principle, etc. Germany, Sweden and China [15,16] collaboratively evaluate the feasibility of employing the concrete pile in the IAJBs. Kong et al. [17,18] and Gama et al. [19] used finite element models to investigate the mechanical behaviors of a concrete pile supporting a IAJB. It was found that the pile-abutment connections significantly affect the mechanical behavior of IAJBs and when a reinforcement concrete pile was designed appropriately, its concrete cracking resistance was substantially improved. Kamel et al. [20] used the computer program LPILE to analyze the behavior of concrete piles in various types of soil for the IAJB. It was found that concrete piles had limited flexibility under lateral loads and can be only used in short-span IAJBs. Chen et al. [21] and Huang et al. [22] proposed a displacement-based simplified calculation method to analyze the soil–pile interaction of reinforced concrete and PHC pipe piles for IAJBs. It was shown that results obtained from the simplified method had a good agreement with the test results. In addition, several studies on PC piles were carried out and indicated that they can be used to support IAJBs [23,24,25]. The application of the rectangular concrete piles was also studied for the IAJBs [26,27]. Huang et al. [28] conducted a pseudo-static low-cycle experiment on the PHC pipe piles buried in sand type soil to investigate their failure modes and seismic behaviors, considering the soil–pile interaction. It is shown that the PHC pipe pile can support the foundation of IAJBs. Rollins et al. [29,30] and Nimityongskul et al. [31] carried out the full-scale pile test to obtain similar understanding about pile mechanics.
Most of the aforementioned studies were concentrated on the behavior of one type of pile foundation for the IAJBs and, clearly, there is a lack of comparative study on the seismic performance of various types of pile for the practical engineering of IAJBs. Therefore, in this research, a pseudo-static low-cyclic test was conducted on various types of pile having different cross-sections, materials, reinforcement ratios, prestressing levels and buried length. A comparative study was performed to find their behaviors in terms of damage mechanism, deformation shape, bearing capacity, strain and bending moment distribution, etc. Finally, new seismic design criteria of three-stage seismic fortification and five damage level for the concrete piles of integral bridges were put forward based on the seismic design criteria of piers, which can be provided as a reference for the design specifications.

2. Description of Test

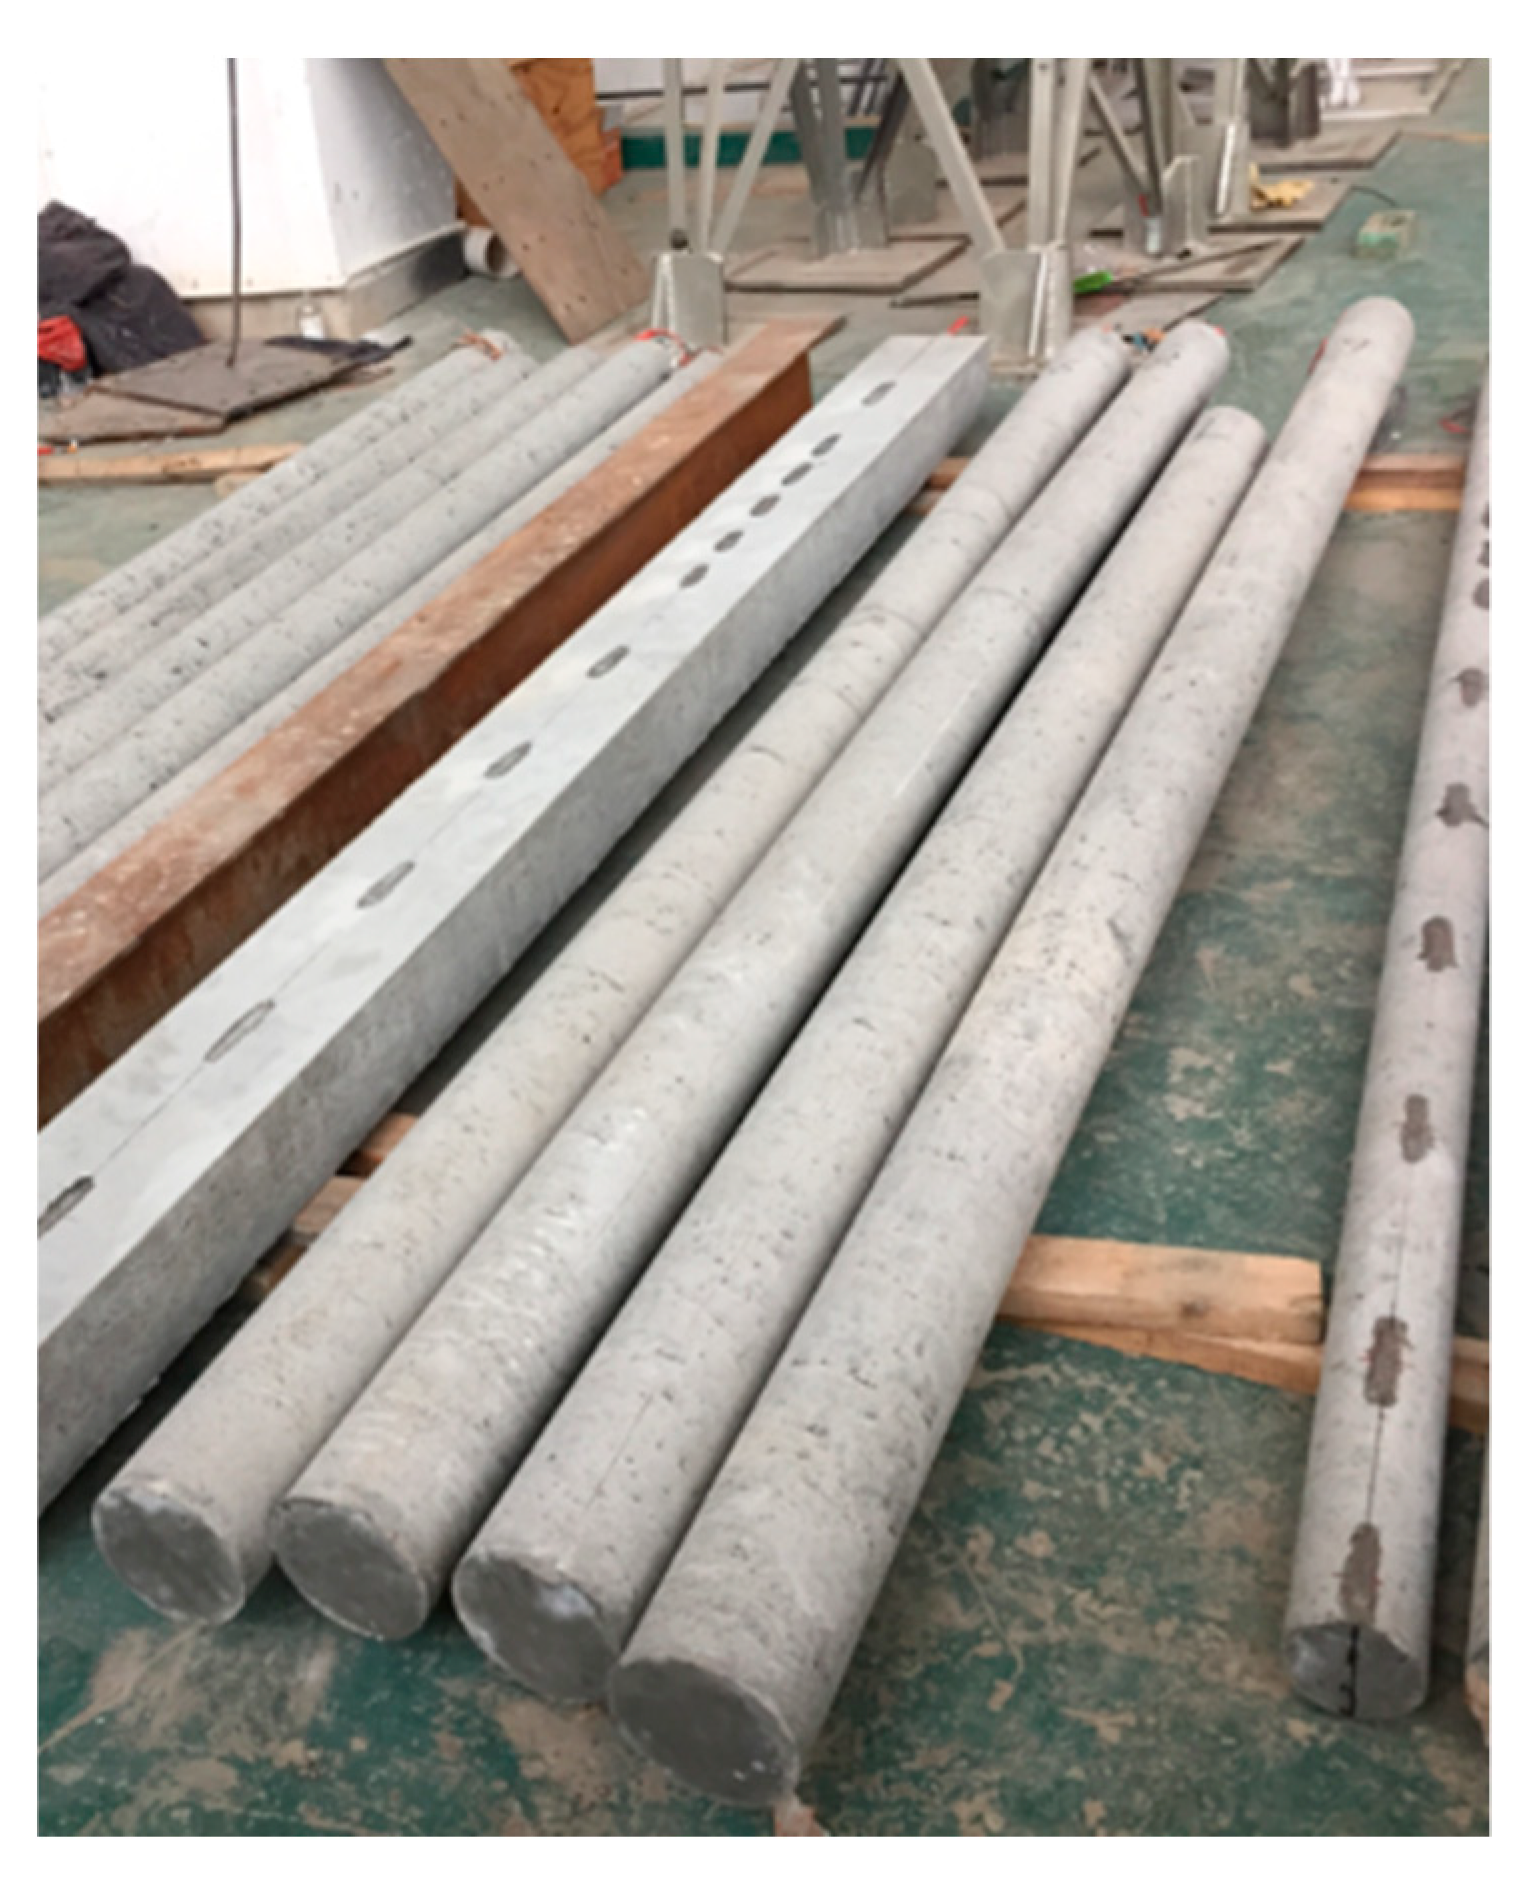
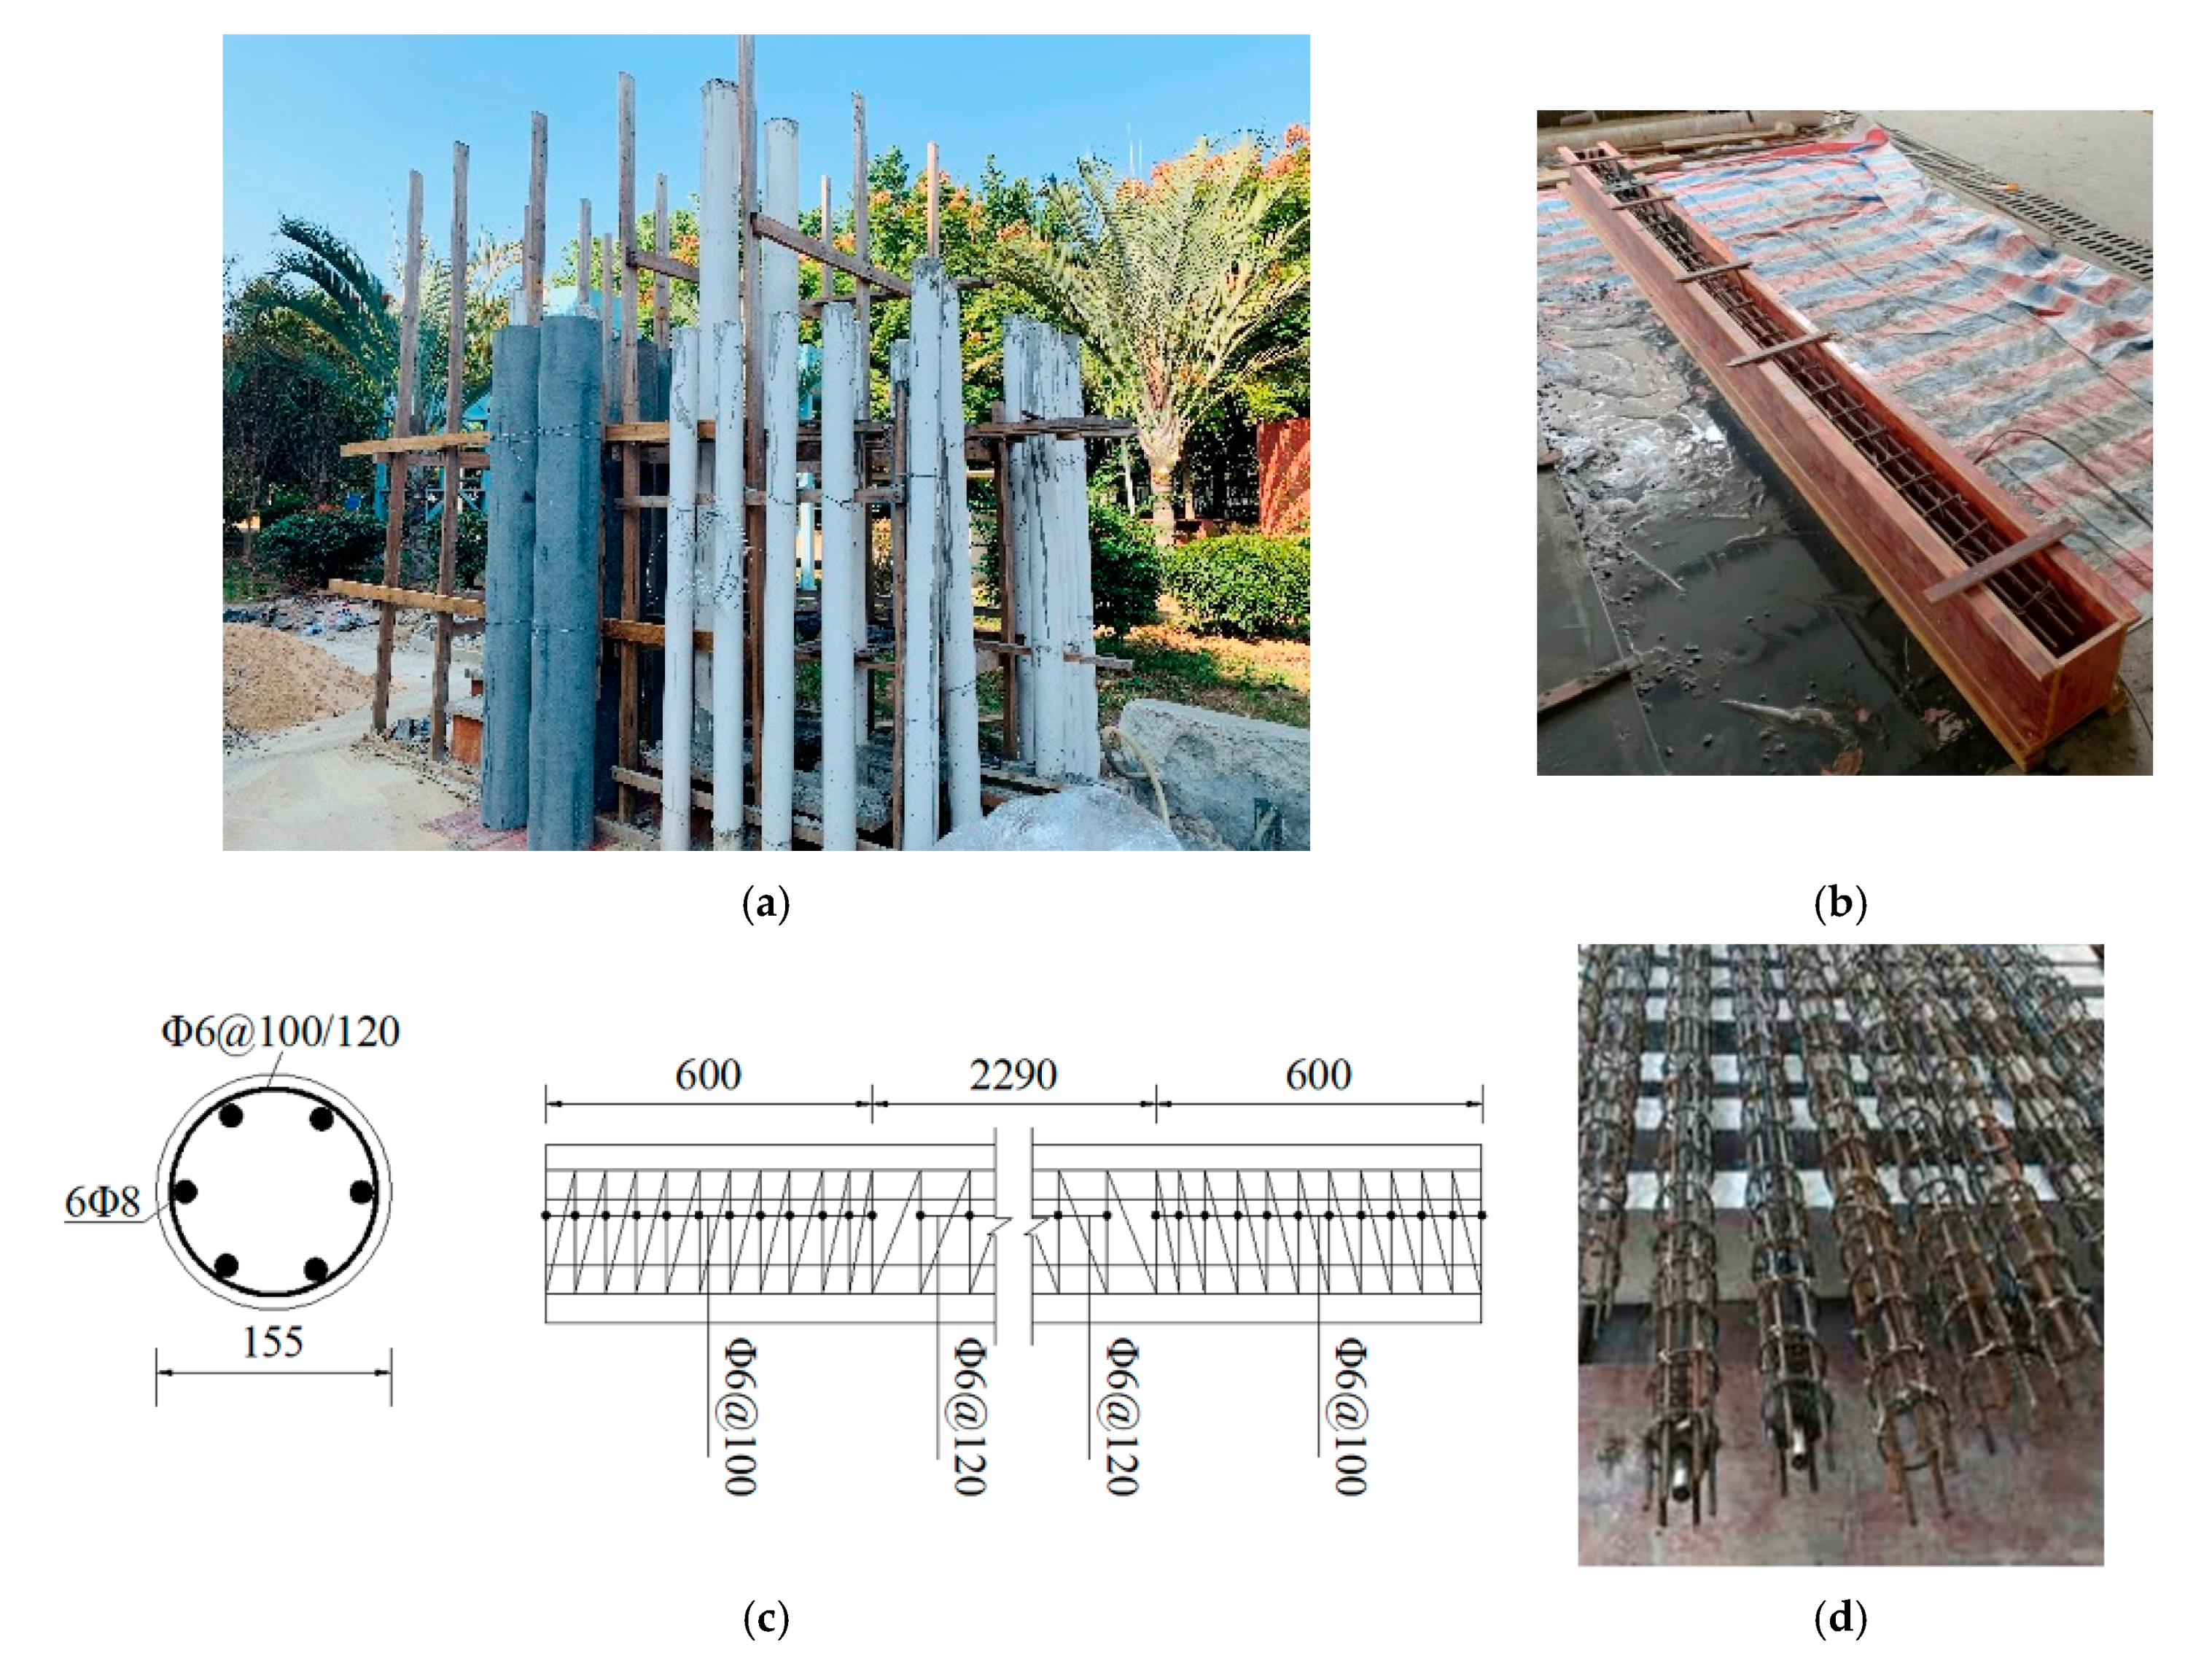
2.1. Specimen Design and Fabrication

2.1.1. Specimen Design

The specimen design was based on an existing IAJB in Fujian Province, China. The total length of the bridge is 136 m, including four 30-m-long spans and two 8-m-long approach slabs. Four piles support the abutment. The pile has 12 m height and a rectangular cross-section of 0.7 m × 0.5 m was aligned with its weak axis along the longitudinal direction of the bridge.
Due to the limitations of test equipment, soil box and Lab condition, the maximum geometric scale ratio of 0.31 was selected for the specimens. The scale model was in good agreement with the prototype as shown in Table 1. The test results basically can reflect the mechanical behavior and pressure distribution of the pile foundation.
In this paper, L, E and ρ are the basic parameters. The dimension and similarity ratios are SL = [L], SE = [E] and Sρ = [ρ], respectively. The dimensional similarity ratios of other parameters can be calculated based on the three basic parameters. In addition, in the scale model, SL equals 31/100 and SE equals 1.0 due to the use of the same material as in that of prototype.
A total of nine specimens were designed and fabricated for testing as shown in Figure 1. The diameter of seven concrete circular piles was 155 mm that was the same with the reference [28]. These concrete pile (CP) and prestressed concrete pile (PC) specimens were labeled as CP-1 to CP-5 and PC-6 to PC-7, respectively, having different height H, reinforcement ratio r and prestressing level P. CP-1 to CP-3 and PC-6 to PC-7 specimens’ height were H = 3.5 m, and CP-4 and CP-5 specimens’ height were 3.19 and 3.81 m, respectively. The rectangular reinforced concrete pile (RP) was labeled as the RP-8 specimen and was fabricated based on an existing IAJB [26]. The last specimen was an H-shaped steel pile (HP) and was labeled as HP-9. The RP-8 and HP-9 specimens had a cross-section of 217 mm × 155 mm (length, L × width, W) and height of 3.5 m and their weak axis was aligned along the loading direction. The flange and web thickness of HP-9 specimen were t1 = 6 mm and t2 = 9 mm, respectively. The design parameters and properties of all specimens are summarized in Table 2. Furthermore, the details of prestressed high-strength concrete piles (PHC), PHC-1 to PHC-4 specimens having the same diameter of 155 mm from the reference [28] are also listed in Table 2 for comparison.

2.1.2. Specimen Materials and Soil Properties

Specimen Materials’ Characteristics

C40 grade concrete was used for the concrete specimens, which was consistent with the compressive strength of the existing prototype. The 28-day concrete compressive strength of the specimen was fcu = 47.6 MPa and its elastic modulus was E = 3.25 × 10⁴ MPa. HRB335 grade steel (Fuzhou futai steel co. LTD, Fuzhou, Fujian, China) was employed for the reinforcement and its yield strength measured by the tensile test was 337 MPa with the ultimate tensile strength of 454 MPa. Q235 grade steel (Fuzhou futai steel co. LTD, Fuzhou, Fujian, China) was used for HP-9 specimen and its yield strength and elastic modulus were fy = 238 MPa and E = 2.08 × 10⁵ MPa, respectively.

Soil Properties

The soil for testing was obtained from Min River in Fujian Province, China. The soil bulk density and relative density were 19 kN/m3 and 53%, respectively. Its average Standard Penetration Test (SPT) blow count of the sand was 11. This soil is classified as medium dense sand according to ASTM Standards [32]. The properties of sand are shown in Table 3.

2.1.3. Specimen Fabrication

Except for specimen RP-8, all concrete pile specimens were fabricated in an upright position to facilitate the ease of erection and casting as shown in Figure 2a. The RP-8 specimen with rectangular cross-section was fabricated in a horizontal position as shown in Figure 2b. The fabrication procedure of specimens is as follows.
The first step was assembling the reinforcing bars of all specimens. The confining reinforcement of CP-1 to CP-5, PC-6 to PC-7 and RP-8 specimens was 6 mm diameter and was spaced at 100 mm at both ends for 600 mm length and in between the spacing was 120 mm. The dimension and reinforcement details of specimens are shown in Figure 2c,d. The second step was installing the formwork of all specimens. PVC formwork was used for all circular concrete piles, while timber formwork was used for the RP-8 specimen. Then, after the reinforcing bars of all specimens were placed in the formwork, the concrete mix was poured.

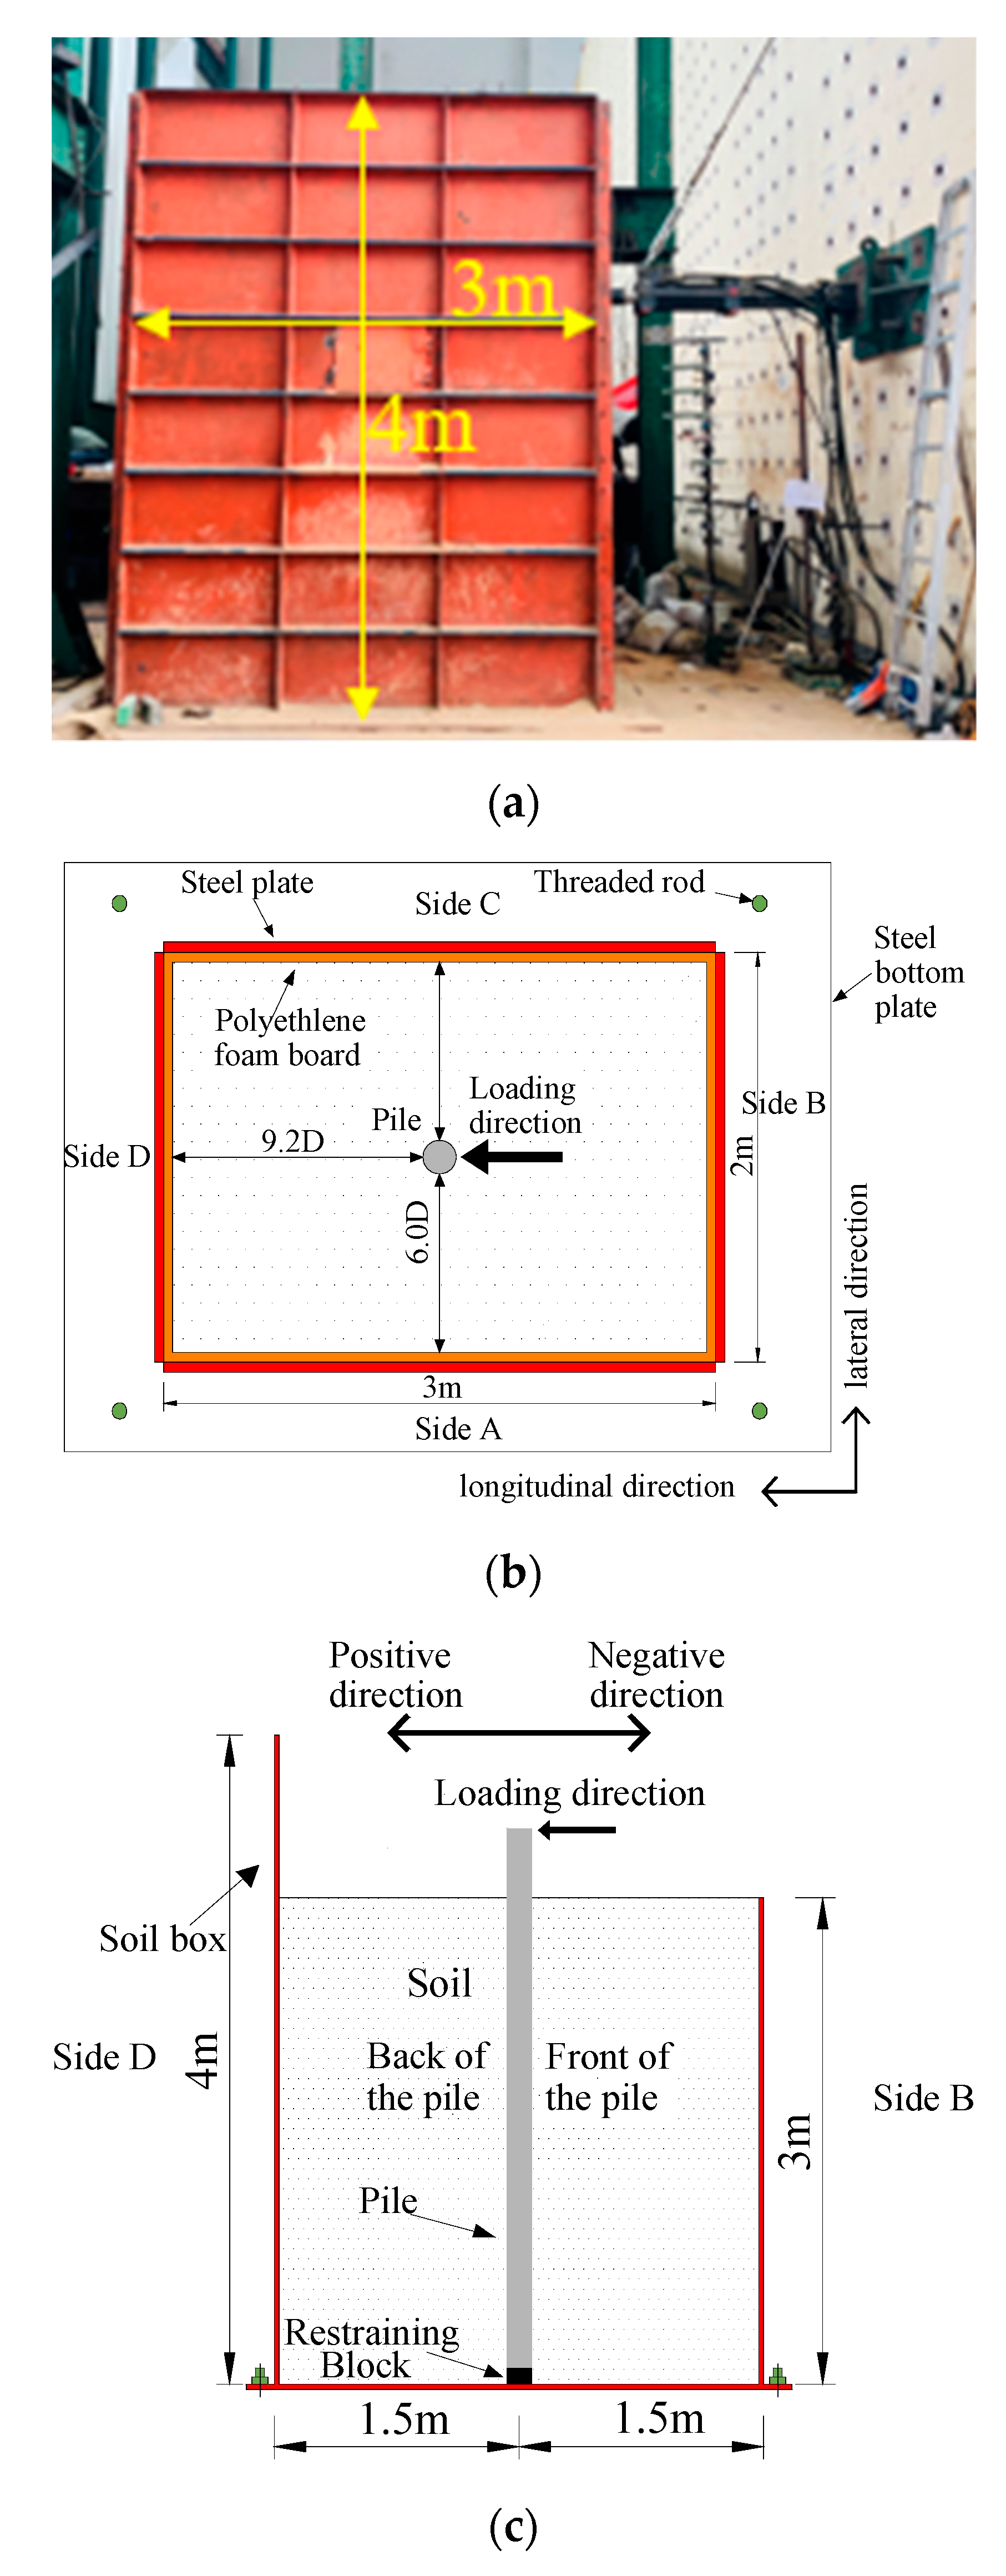
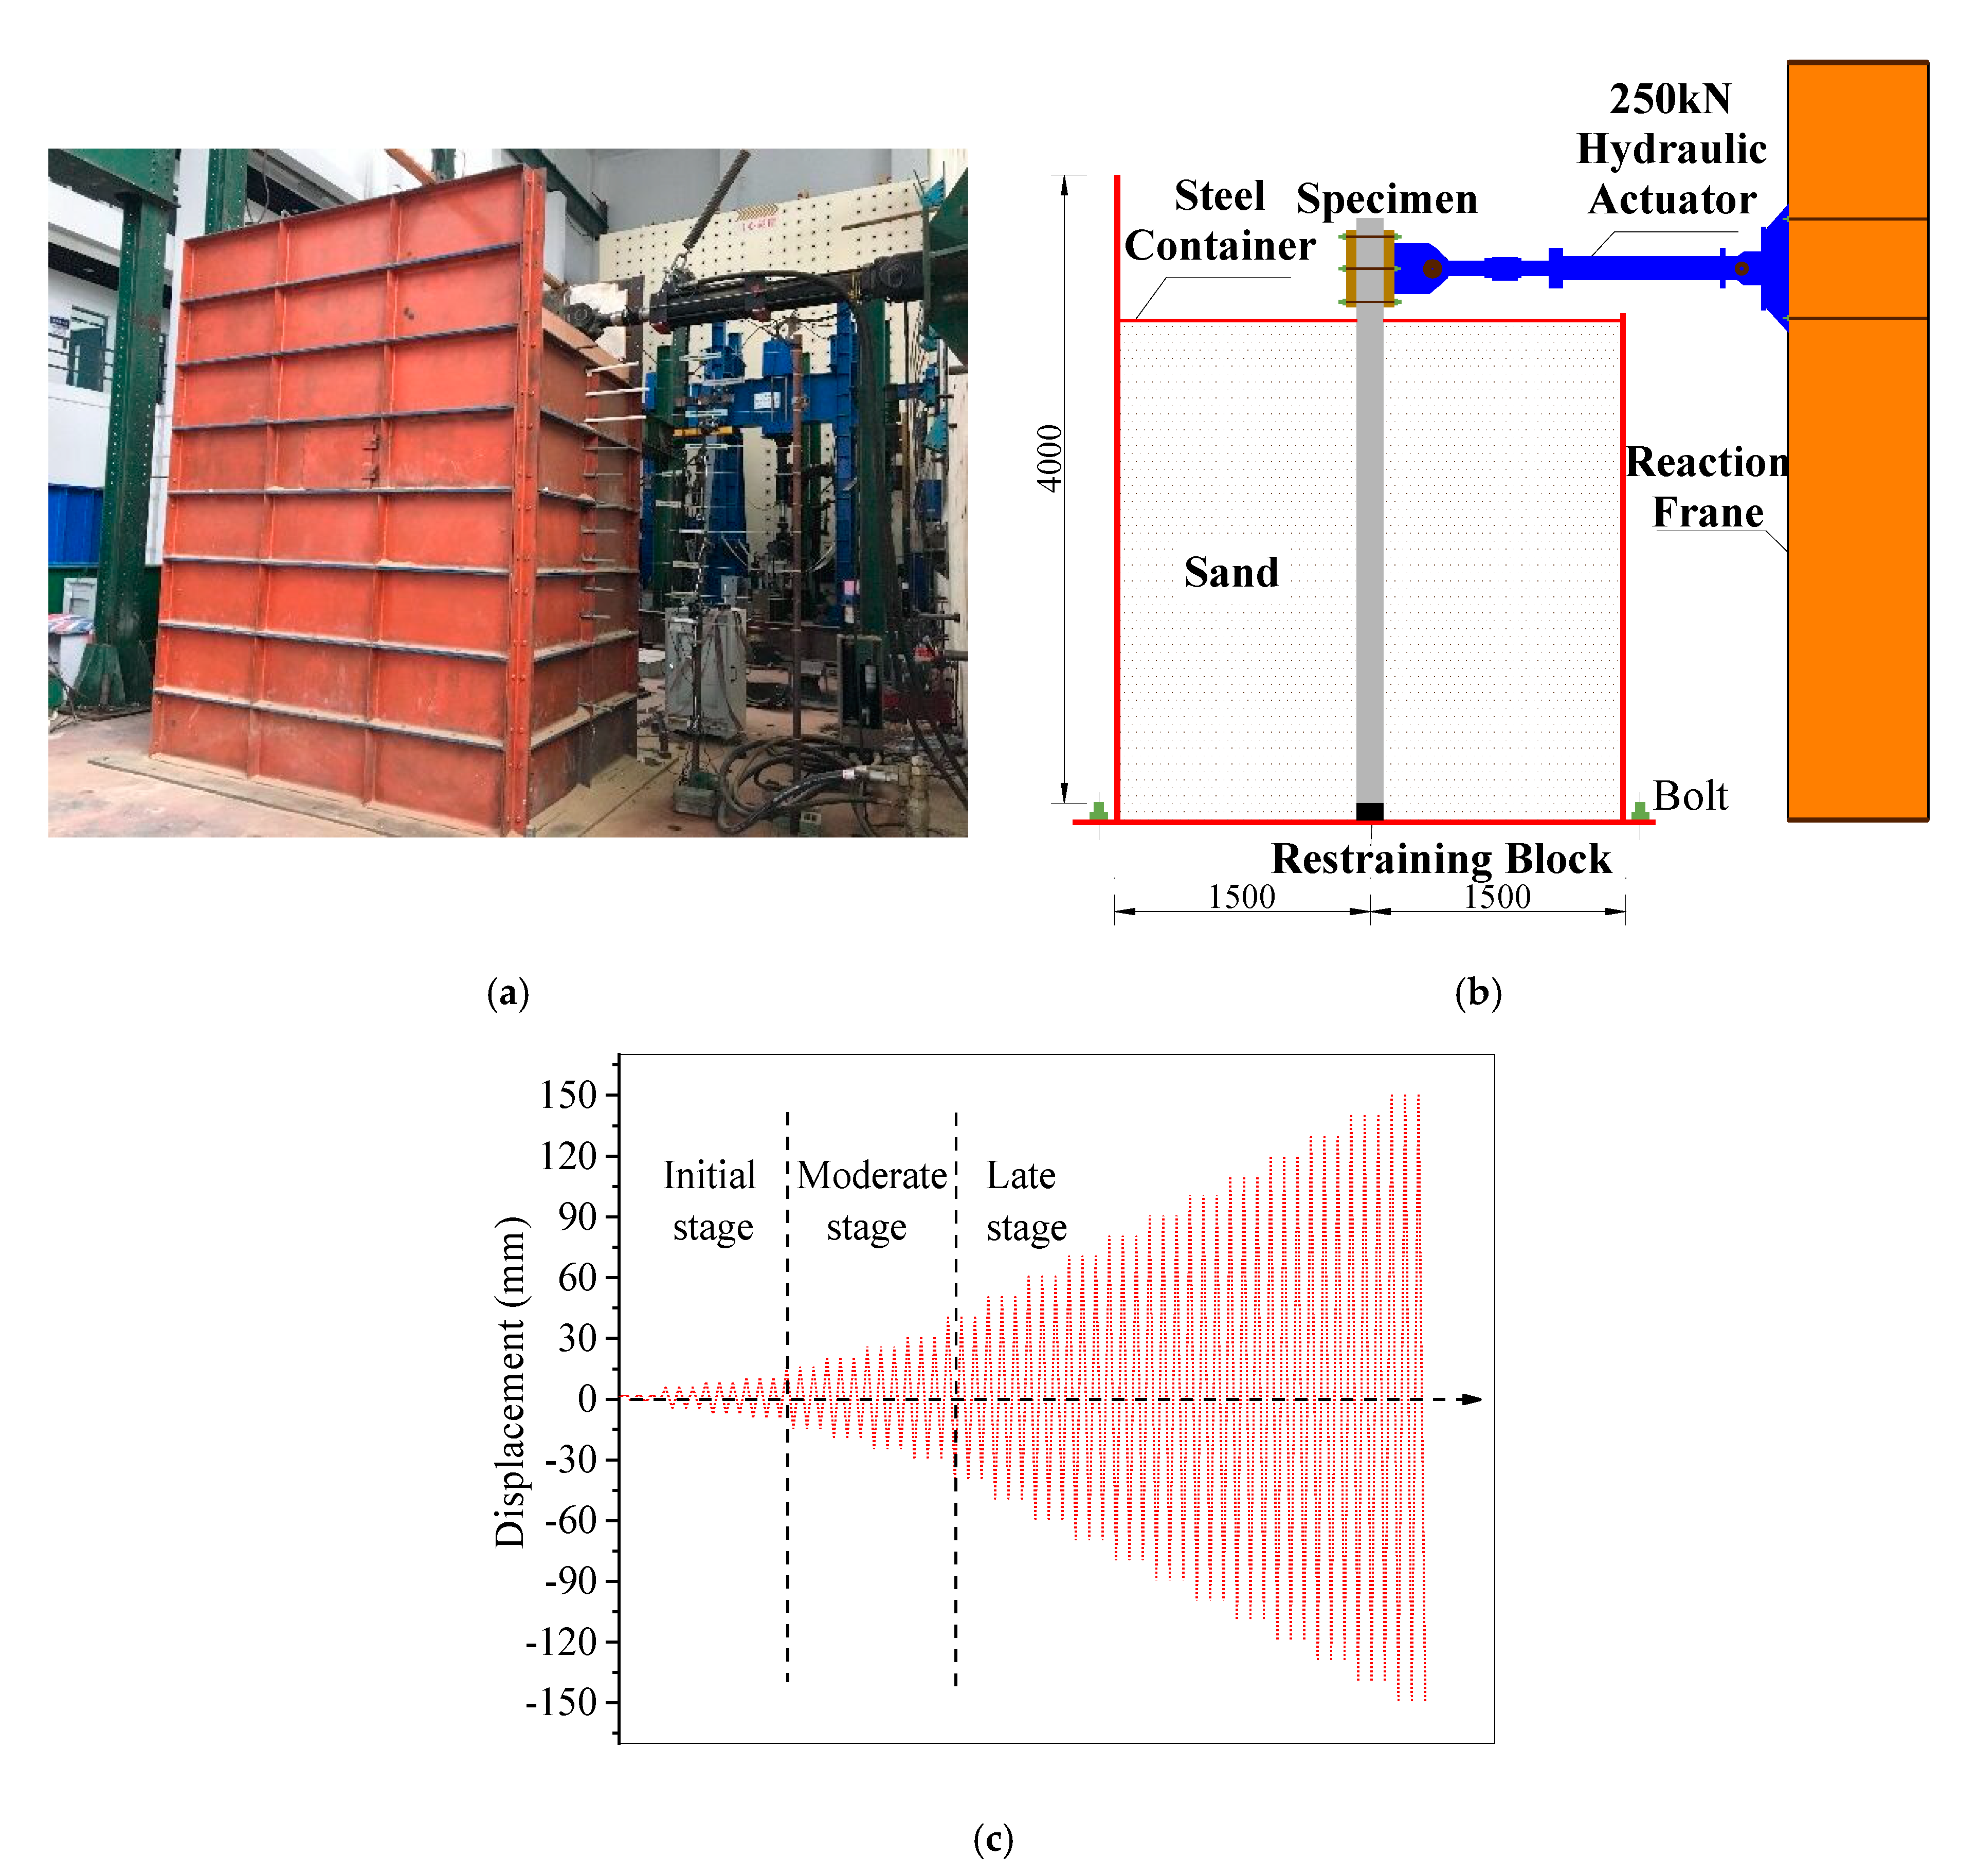
2.2. Soil Box Design and Specimen Installation

2.2.1. Soil Box Design

Since the test was carried out in a soil box at the laboratory, the boundary effect of soil was considered during the design of the soil box. The boundary effect can be neglected when the boundary length is 10 times larger than the pile diameter [28,33,34]. Based on the size of the test specimen and the boundary requirements, the distances from the pile to the soil box should be no less than 1.50 m. Therefore, the soil box was designed to be 3 m long (larger than 1.50 m), 2 m wide and 4 m tall (Figure 3a), which is one of the largest testing soil boxes used in China. Figure 3b,c shows the top and elevation views of the specimen and the soil box. In addition, 5 cm thick polyethylene foam boards were used to reduce the boundary effect. The soil box was fixed on the laboratory platform by 4 threaded rods. The height of the soil box for sides A, C and D was 4 m, while the side B height was 3 m to allow the actuator head movement. The pile specimen installation was similar to the drilled shaft construction method in the field.

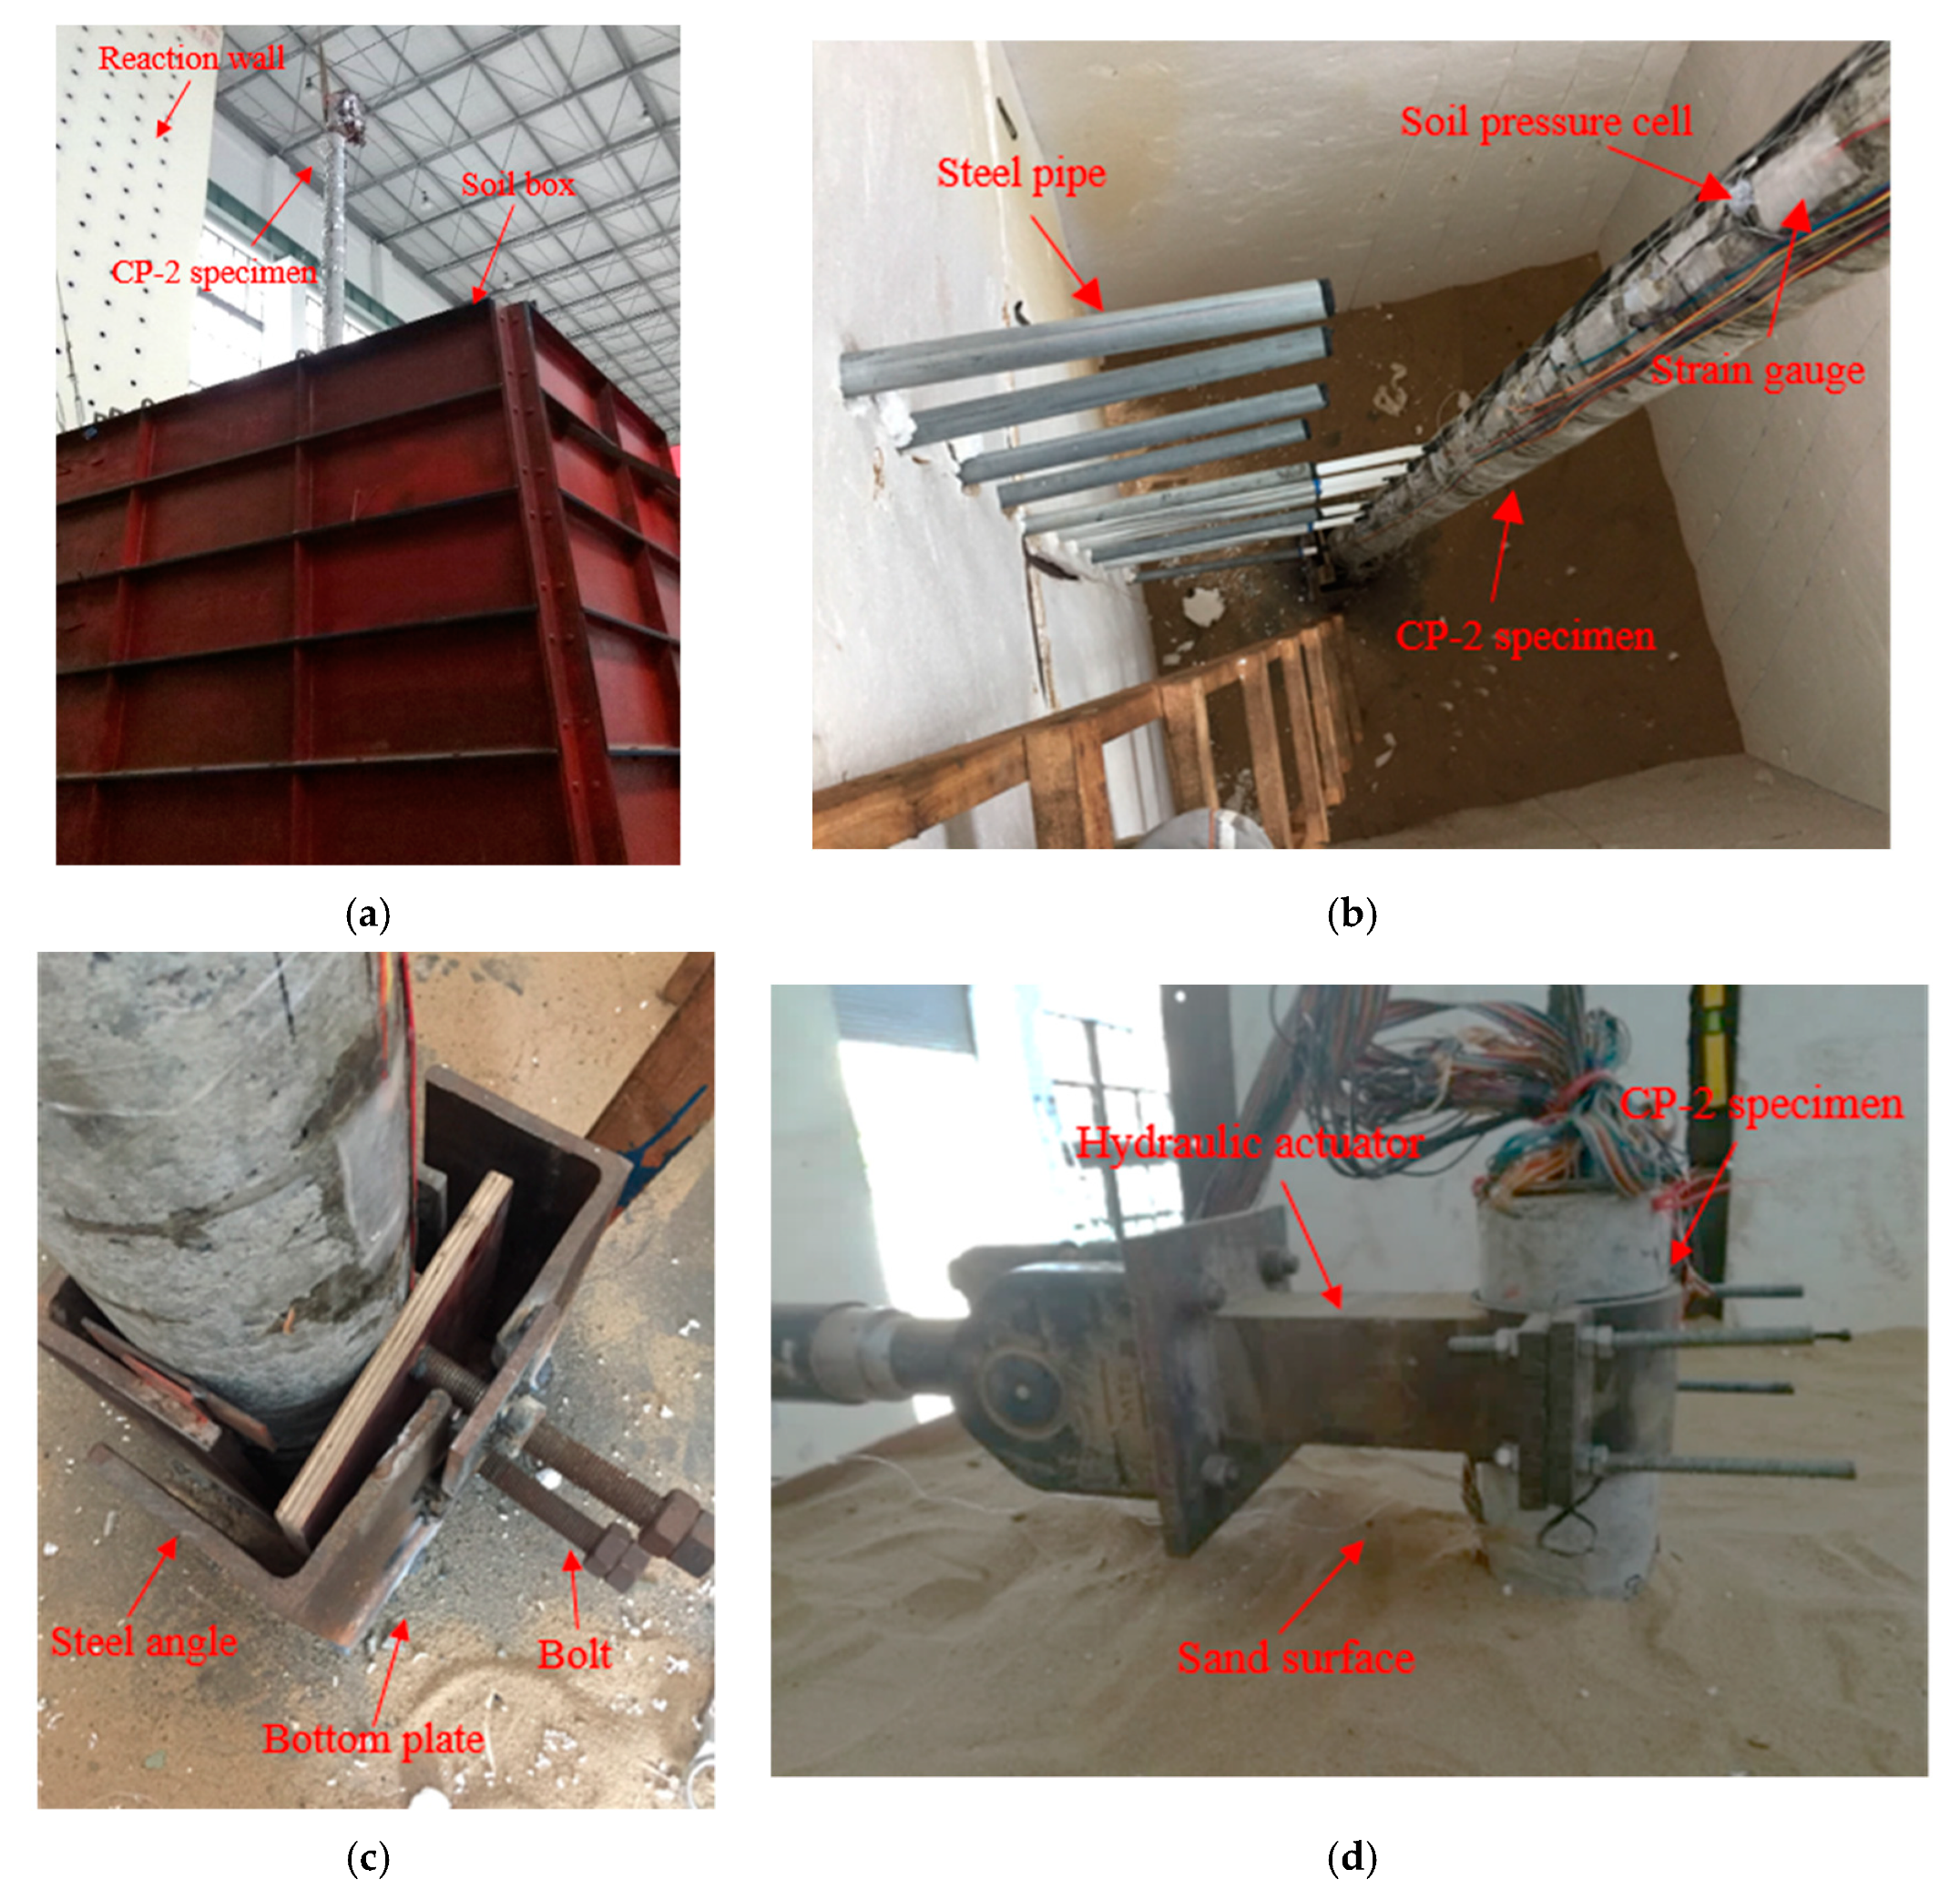
2.2.2. Specimen Installation

The specimen was placed in the soil box as shown in Figure 4a,b. The pile end was fixed by a restraining block device at the base of the soil box (see Figure 3c). The restraining block device consisted of several steel angles and bolts welded to the bottom plate of the soil box as shown in Figure 4c. Thereafter, the soil was filled and compacted in the soil box in layers of 25 cm up to a height of 3 m of the box, as shown in Figure 4d. The installation is similar to the construction method of drilled shafts.

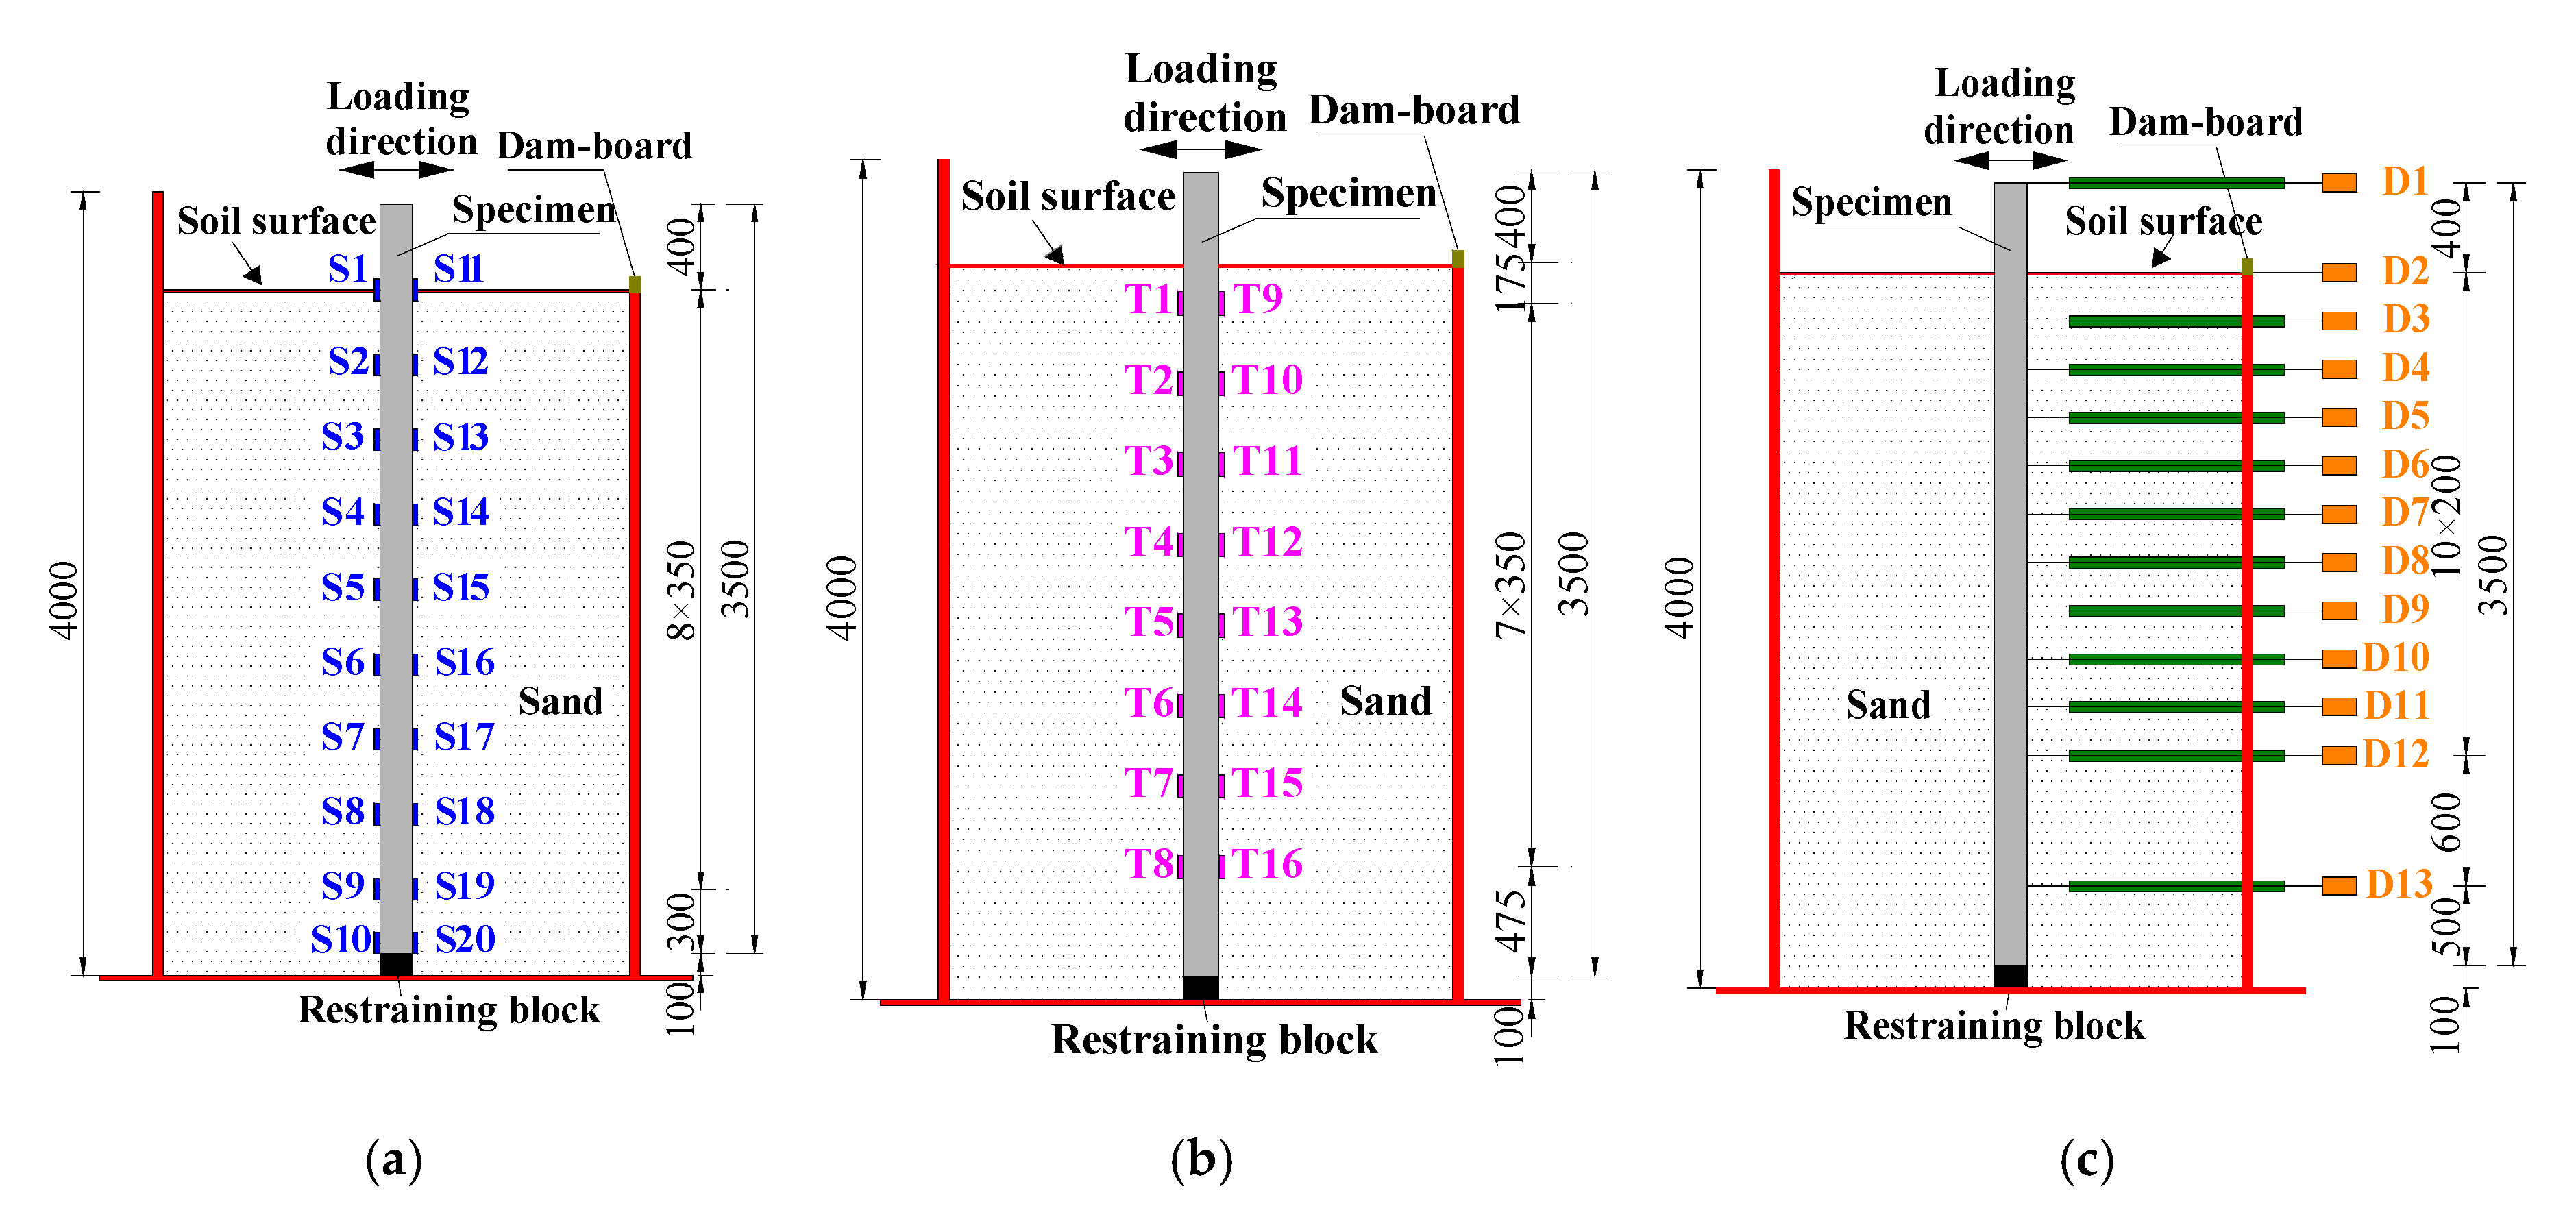
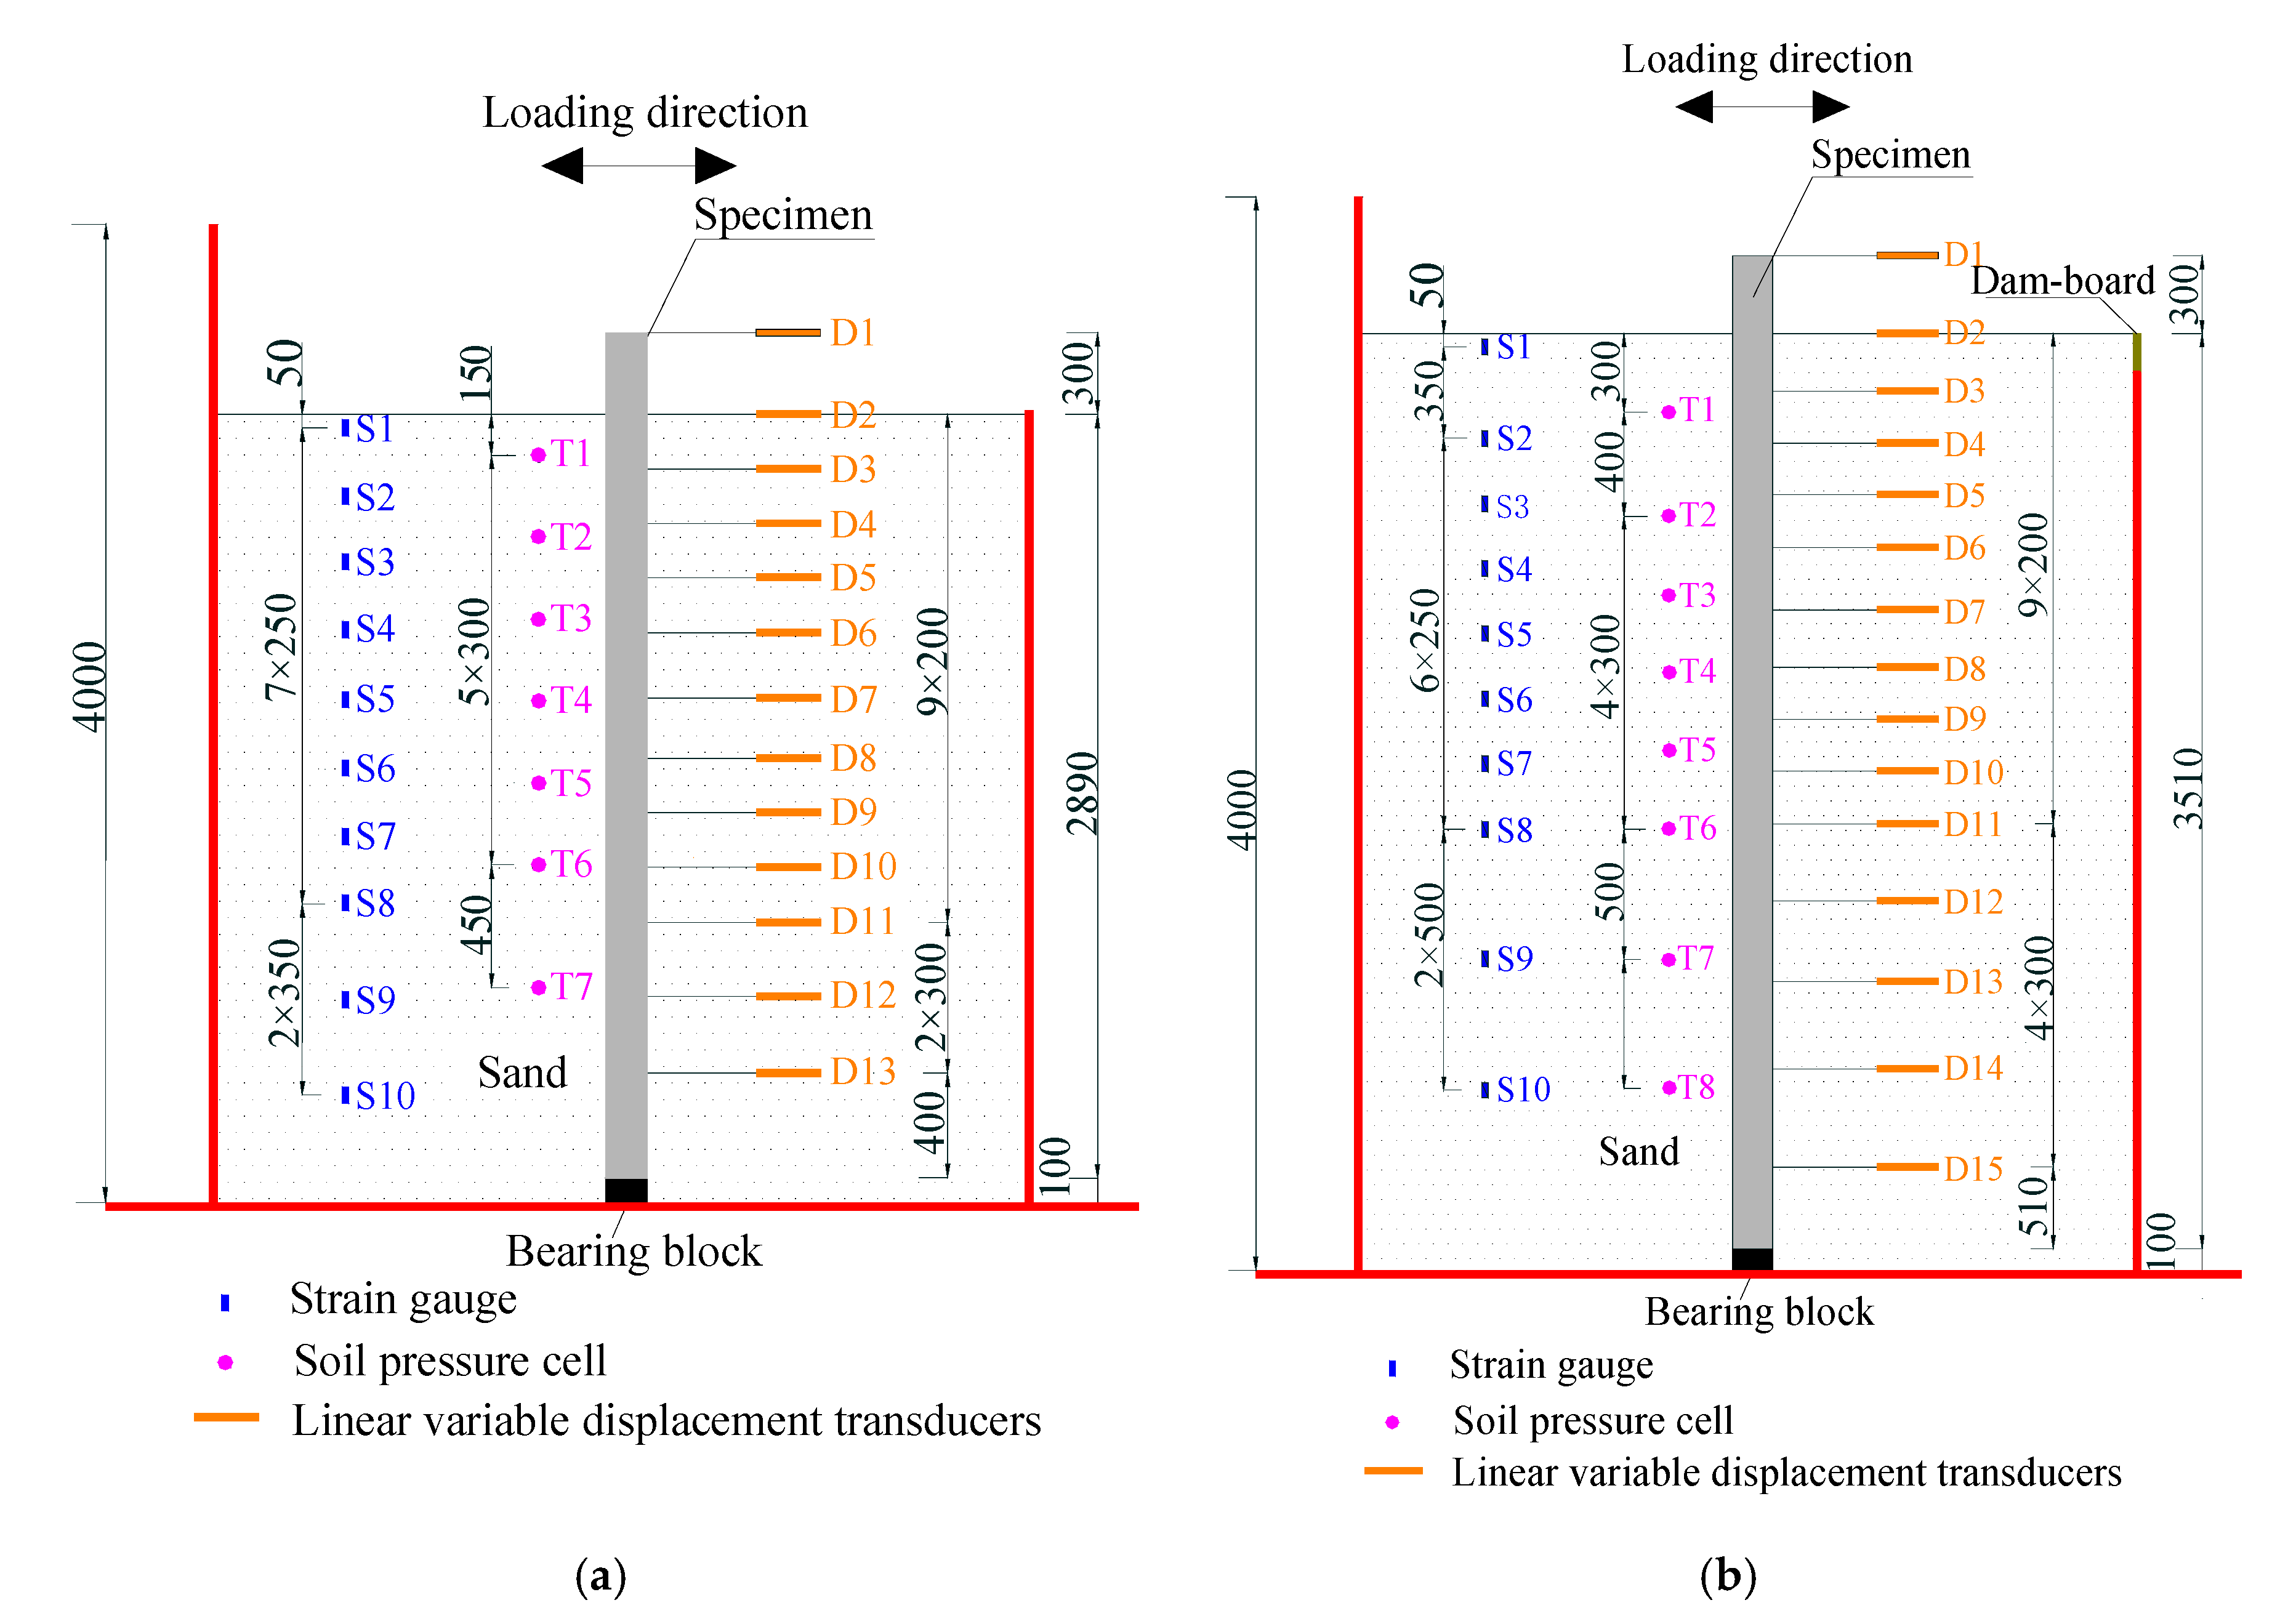
2.3. Layout of Measuring Sensors

For all specimens except specimens CP-4 and CP-5, the buried depth, Lt was 3.10 m and 0.4 m height of the specimens left unburied, as shown in Figure 5. A total of 20 strain gauges, 16 soil pressure cells and 13 linear variable displacement transducers (LVDTs) were used for these specimens to measure their strain distributions, soil pressures and lateral displacements, respectively. The strain gauges were symmetrically attached to both sides of the piles and labeled as S1 to S20 as illustrated in Figure 5a. The first two soil pressure cells were attached to the pile at the buried depth of 175 mm below the soil surface, and rest were spaced at 350 mm interval along the height of the pile and labeled as T1 to T16 as shown in Figure 5b. Figure 5c shows LVDTs locations of D1 to D13. The LVDT D1 was located at the top of the specimen and the remaining LVDTs were placed from the soil surface to the bottom of the specimen at 200 mm spacing.
While for CP-4 and CP-5 specimen, the buried depth Lt was 2.79 and 3.41 m, respectively and 0.4 m height of these specimens left unburied. The arrangement of the three different sensors for CP-4 and CP-5 specimens is shown in Figure 6. Similar to other specimens, the strain gauges and soil pressure cells of CP-4 and CP-5 specimens were arranged symmetrically in the front and back of the pile, while the LVDTs were arranged at one side. The displacement measurement proposed by the reference [28] for buried piles was used in the test.

2.4. Loading Protocol

The mechanical testing simulation (MTS) electro-hydraulic servo loading system was horizontally attached to the specimen head, as shown in Figure 7a,b. The cyclic displacement loading (Figure 7c) was applied to all the specimens. The loading scheme included three stages: (1) in the initial stage, the loading step was 2, 5, 8 and 10 mm, (2) in the moderate stage, the loading increased from 10 mm to 30 mm at a constant increment rate of 5 mm and (3) in the last stage, after 30 mm loading, the displacement loading increased by 10 mm in each loading step. The test was terminated when the force dropped to 85% of the obtained peak value. The loading speed was 1.0 mm/s and each loading step had 3 cycles.

3. Experimental Results
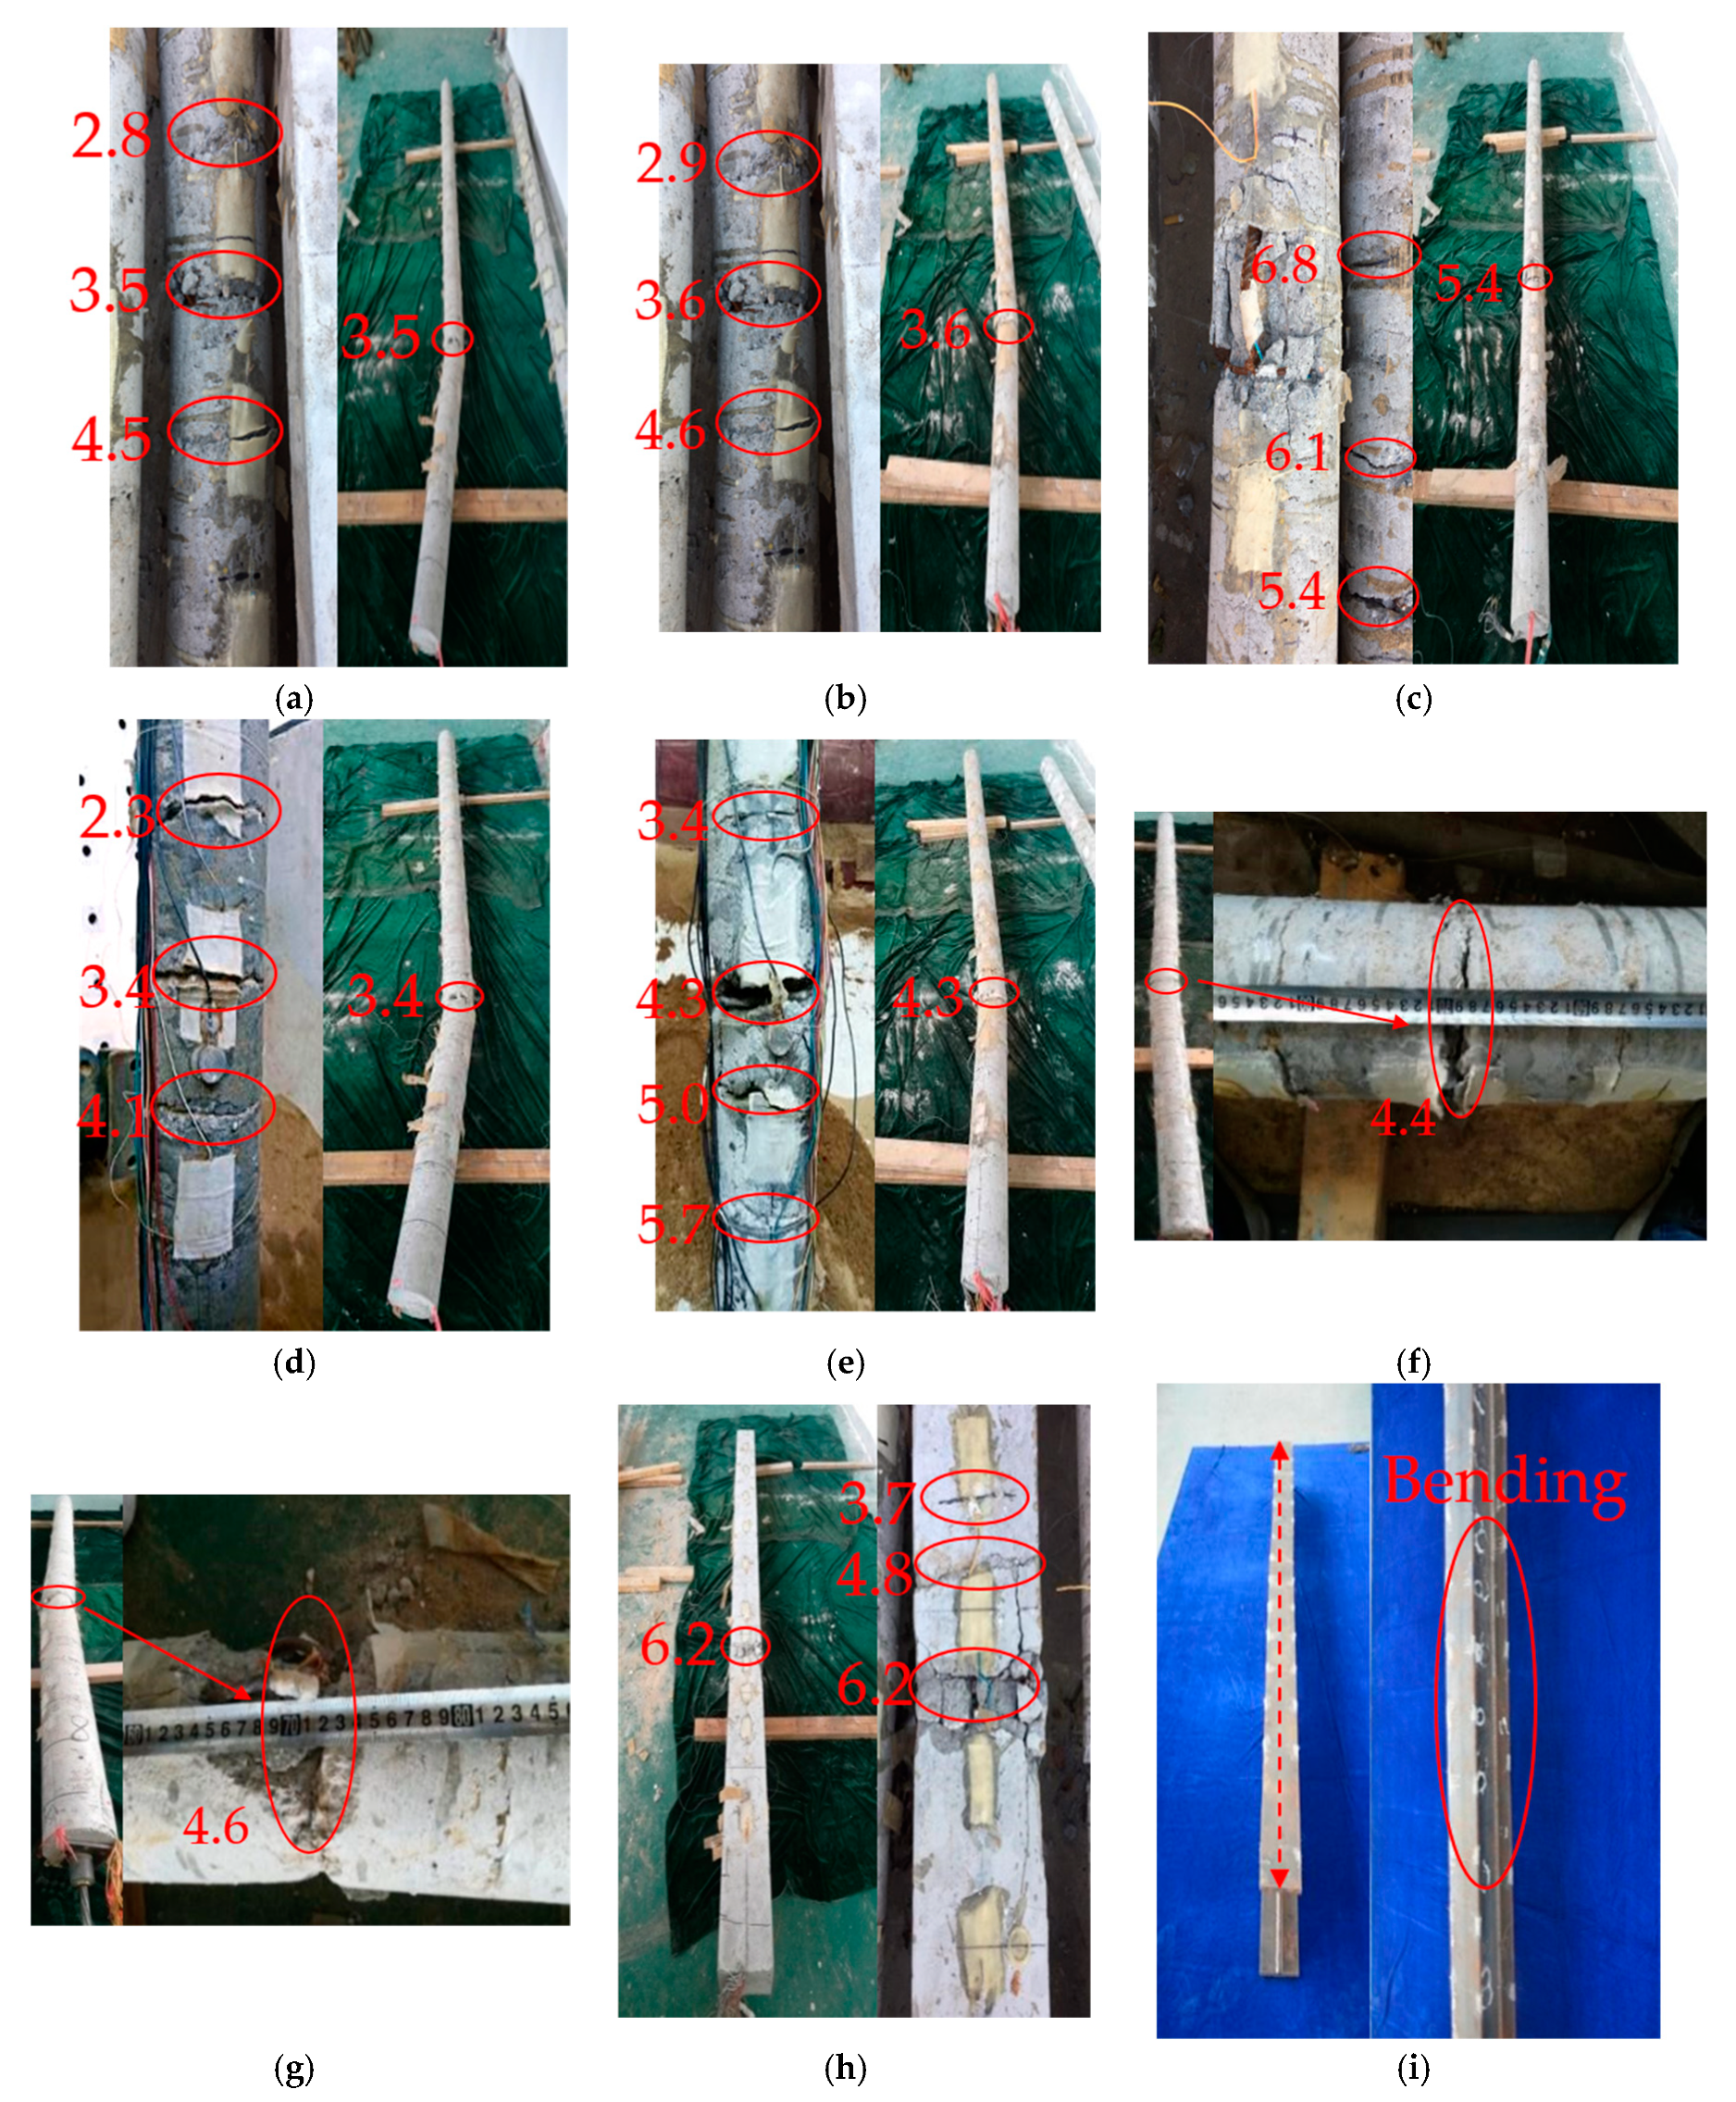
3.1. Damage Modes

Figure 8 shows all tested specimens with their damage locations and failure modes. Table 4 presents the crushing locations of concrete pile specimens after the maximum load decreased by 85%. Further comparisons on the damage of PHC-1 to PHC-4 specimens were also listed in Table 4 based on the reference [28]. It can be observed from Figure 8a–g and Table 4 that the crushing locations of CP-1 to CP-5 were at 3.5 D, 3.6 D, 5.4 D, 3.4 D, 4.3 D, and PC-6 and PC-7 were at 4.4 D and 4.6 D of the buried depths, respectively. It was found that the crushing location became deeper with the increase of reinforcement ratio, buried pile depth and prestressing level. Figure 8h shows the crushing location of the RP-8 specimen was located at 6.2 D of the buried depth. It can be observed that the pile with larger cross-section had a better soil-pile interaction and deeper crushing location as compared to another pile (CP-2) with the same material and reinforcement ratio. For the HP-9 specimen (Figure 8i), only the bending deformation was observed without any sign of buckling phenomenon in the flange and the web of the pile, which indicates that the HP-9 specimen performed a favorable elastic-plastic behavior compared to the CP, PC, RP and PHC specimens.
In Table 4 the crushing length Lci was measured from the soil surface. For instance, Lc1 represents the distance from the crushing location of the CP-1 specimen to the soil surface. Lci/Lc1 is the crushing length ratio of other specimens versus the CP-1 specimen. The damage locations of the CP specimens were in the range of 3.4 D to 5.4 D of the buried depth. For the PC specimens, the damage locations were in the range of 3.6 D to 4.6 D of the buried depth. The damage locations were in the range of 4.2 D to 7.7 D of the buried depth for the PHC specimens. The main damage of the RP-8 specimen was located at 6.2 D of the buried depth. From Figure 8 and Table 4, it can be concluded that the soil-pile system had a better interaction at deeper buried depth and more efficient with the larger reinforcement ratio, buried pile depth, prestressing level, cross-sectional dimension and concrete strength.

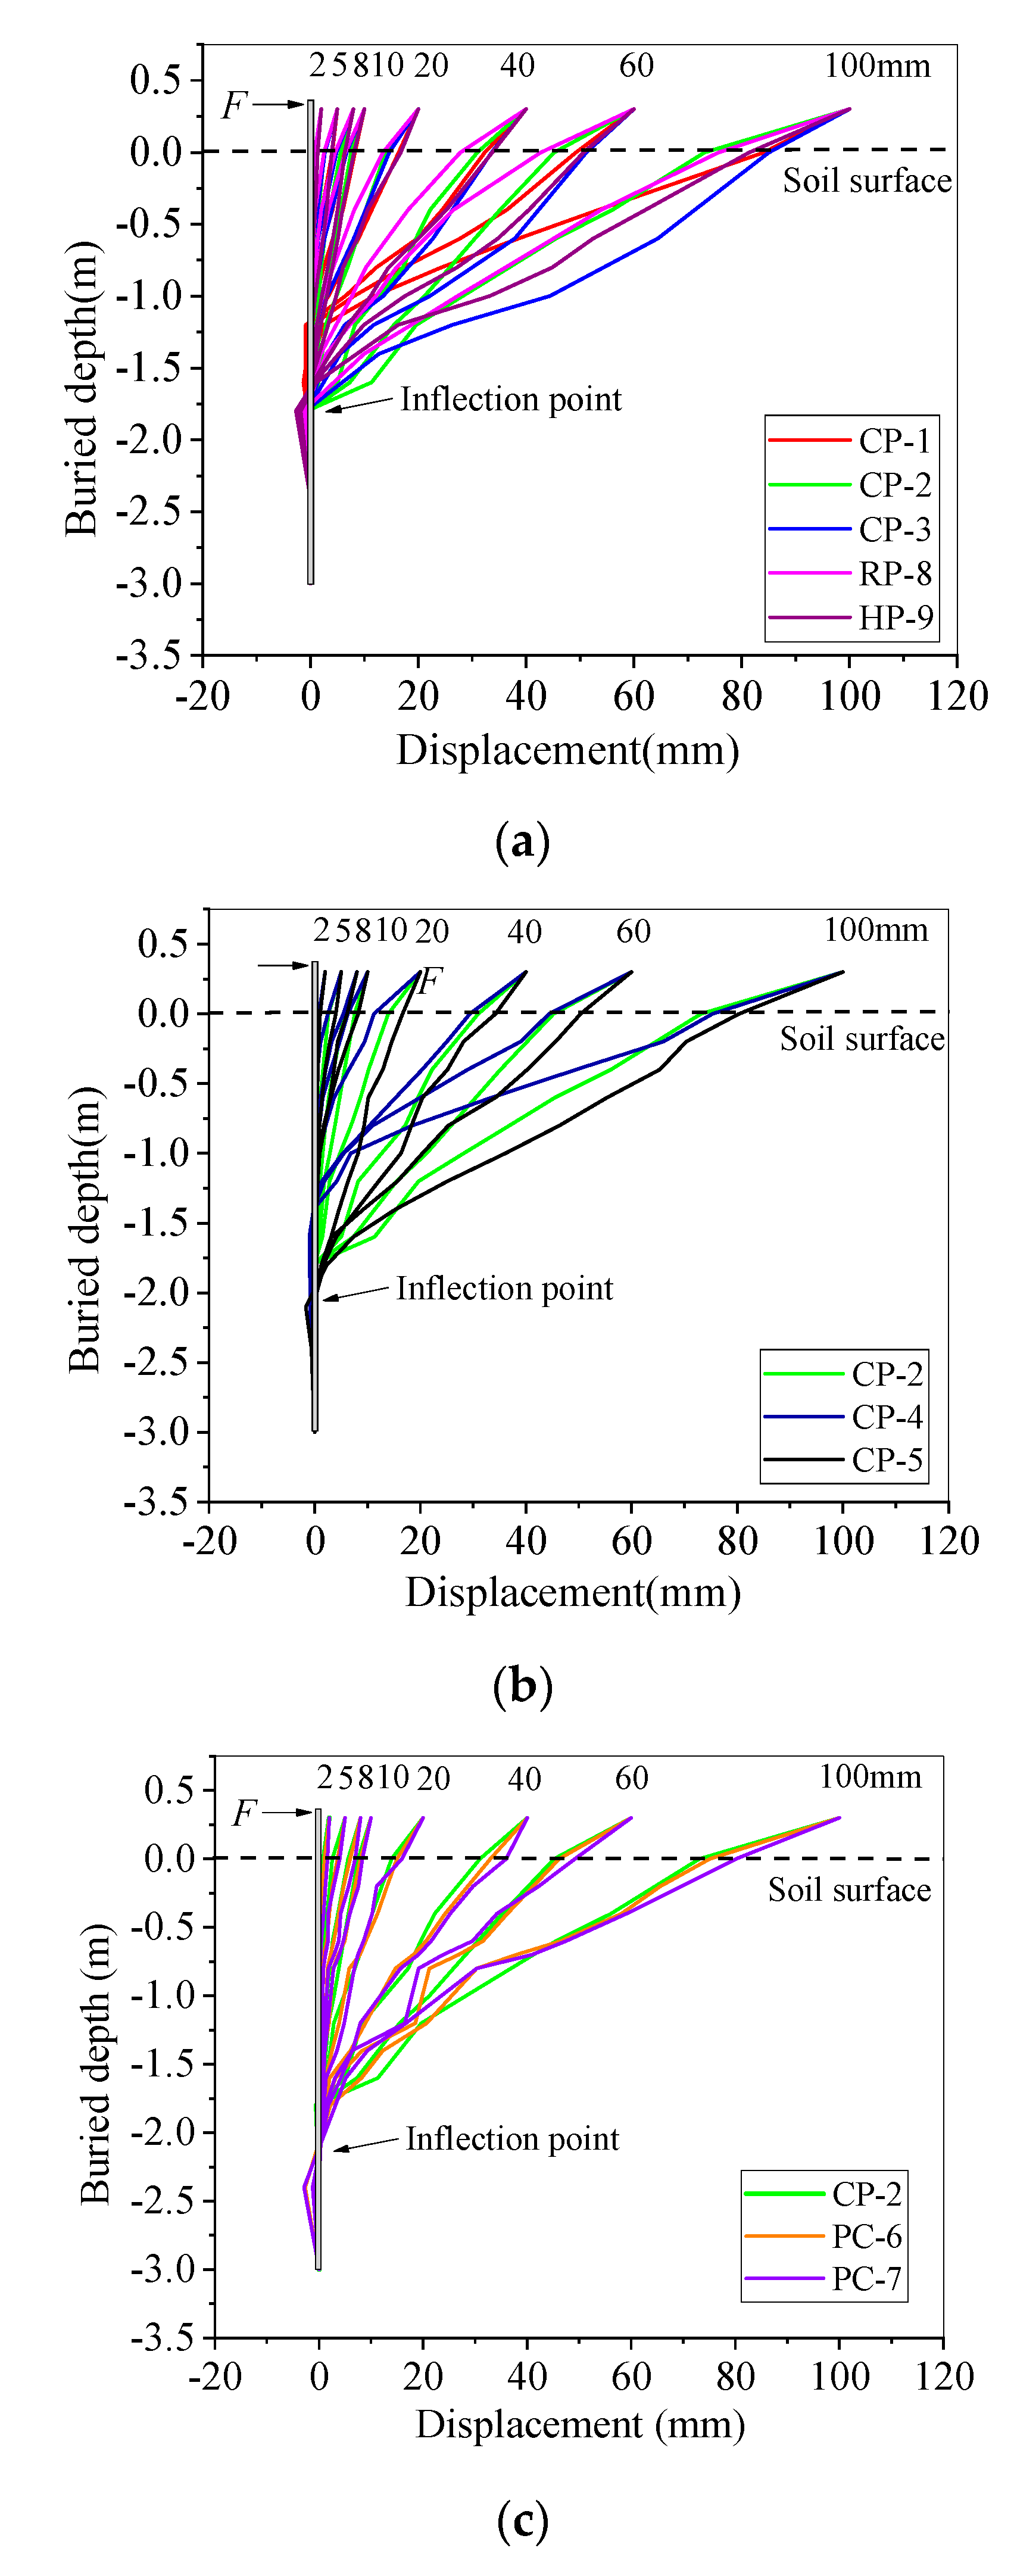
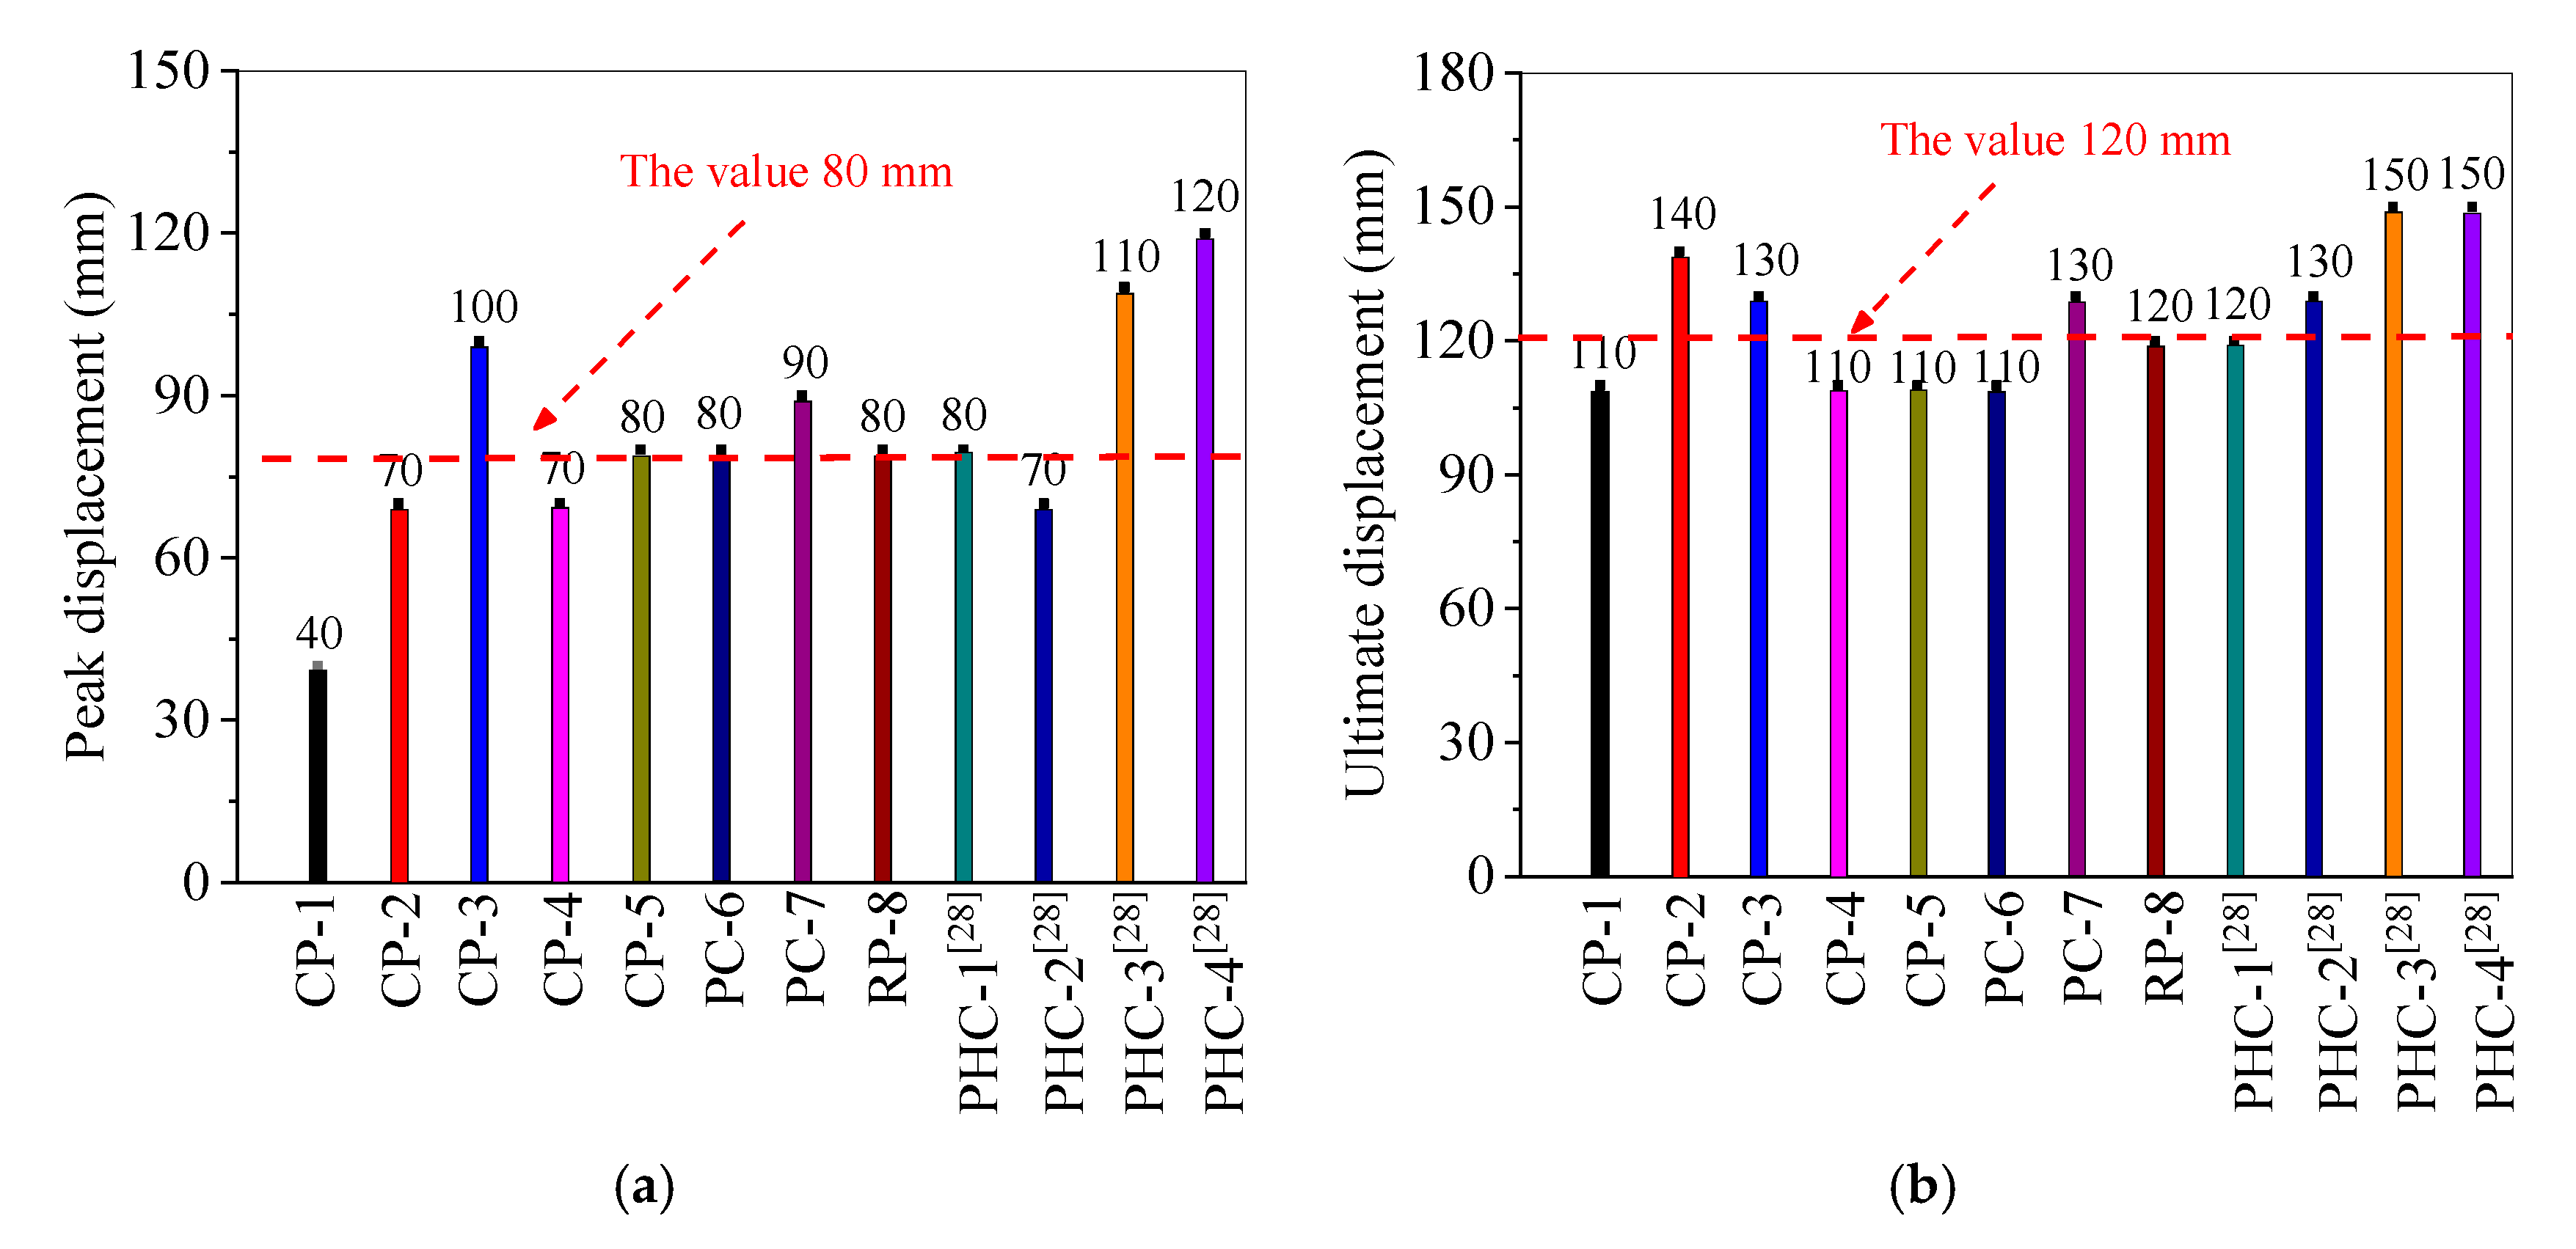
3.2. Horizontal Deformations

Figure 9 presents the deformation shapes of nine specimens. As Figure 9 shows, all the specimens had a flexural deformation along the buried depth, which indicates that these specimens were ductile piles. The maximum deformation was at the top of all the specimens and deformation reduced to zero gradually at 10.3 D of the buried depth (around 1.6 m) for the CP-1, CP-2 and CP-4 specimens, 11.6 D of the buried depth (around 1.8 m) for the CP-3, RP-8 and HP-9 specimens, and 13.5 D of the buried depth (around 2.1 m) for CP-5, PC-6 and PC-7, respectively. The inflection points were shifted to the deeper buried depth with the increase of displacement loadings. The inflection points were located at the pile depth of 1.5 m to 2.1 m as shown in Figure 10. The specimens had reserved deformations below the inflection point and beyond 2.5 m buried depth the deformation was negligible.
From Figure 9 it can be seen that the CP-3, CP-5 and PC-7 specimens had a better deformation capacity as the displacement loadings increased, which also shows that the larger reinforcement ratio, buried pile depth and prestressing level can significantly increase the deformation capability of pile foundations. In addition, the HP-9 specimen experienced the largest negative deformation, which was −2.5 mm. The CP-3 and RP-8 specimens’ negative deformations were −1.51 mm and −1.53 mm, respectively. The H-shaped steel pile had better plastic deformation and ductility as compared to the reinforced concrete piles. The rectangular RP-8 specimen had a better deformation capacity as compared to the circular CP-2 specimen.
As shown in Figure 10, the inflection points of the CP-1 to CP-5 and PC-6 to PC-7 specimens shifted downward with the increase of the reinforcement ratio, buried pile depth and prestressing level. The depths of the inflection point of the CP-3, RP-8 and HP-9 specimens were the same. The PHC specimens with a lower prestressed level had the same inflection point depth. As the reinforcement ratio of the piles increased, the inflection point depths also increased. The aforementioned analyses indicated that the reinforcement ratio, buried pile depth, prestressed level and cross-section size have significant effect on the depth of the inflection point of the pile. Therefore, the flexural and cyclic deformation capacity of the pile can be improved by increasing the reinforcement ratio, buried pile depth, prestressed level and cross-section size.

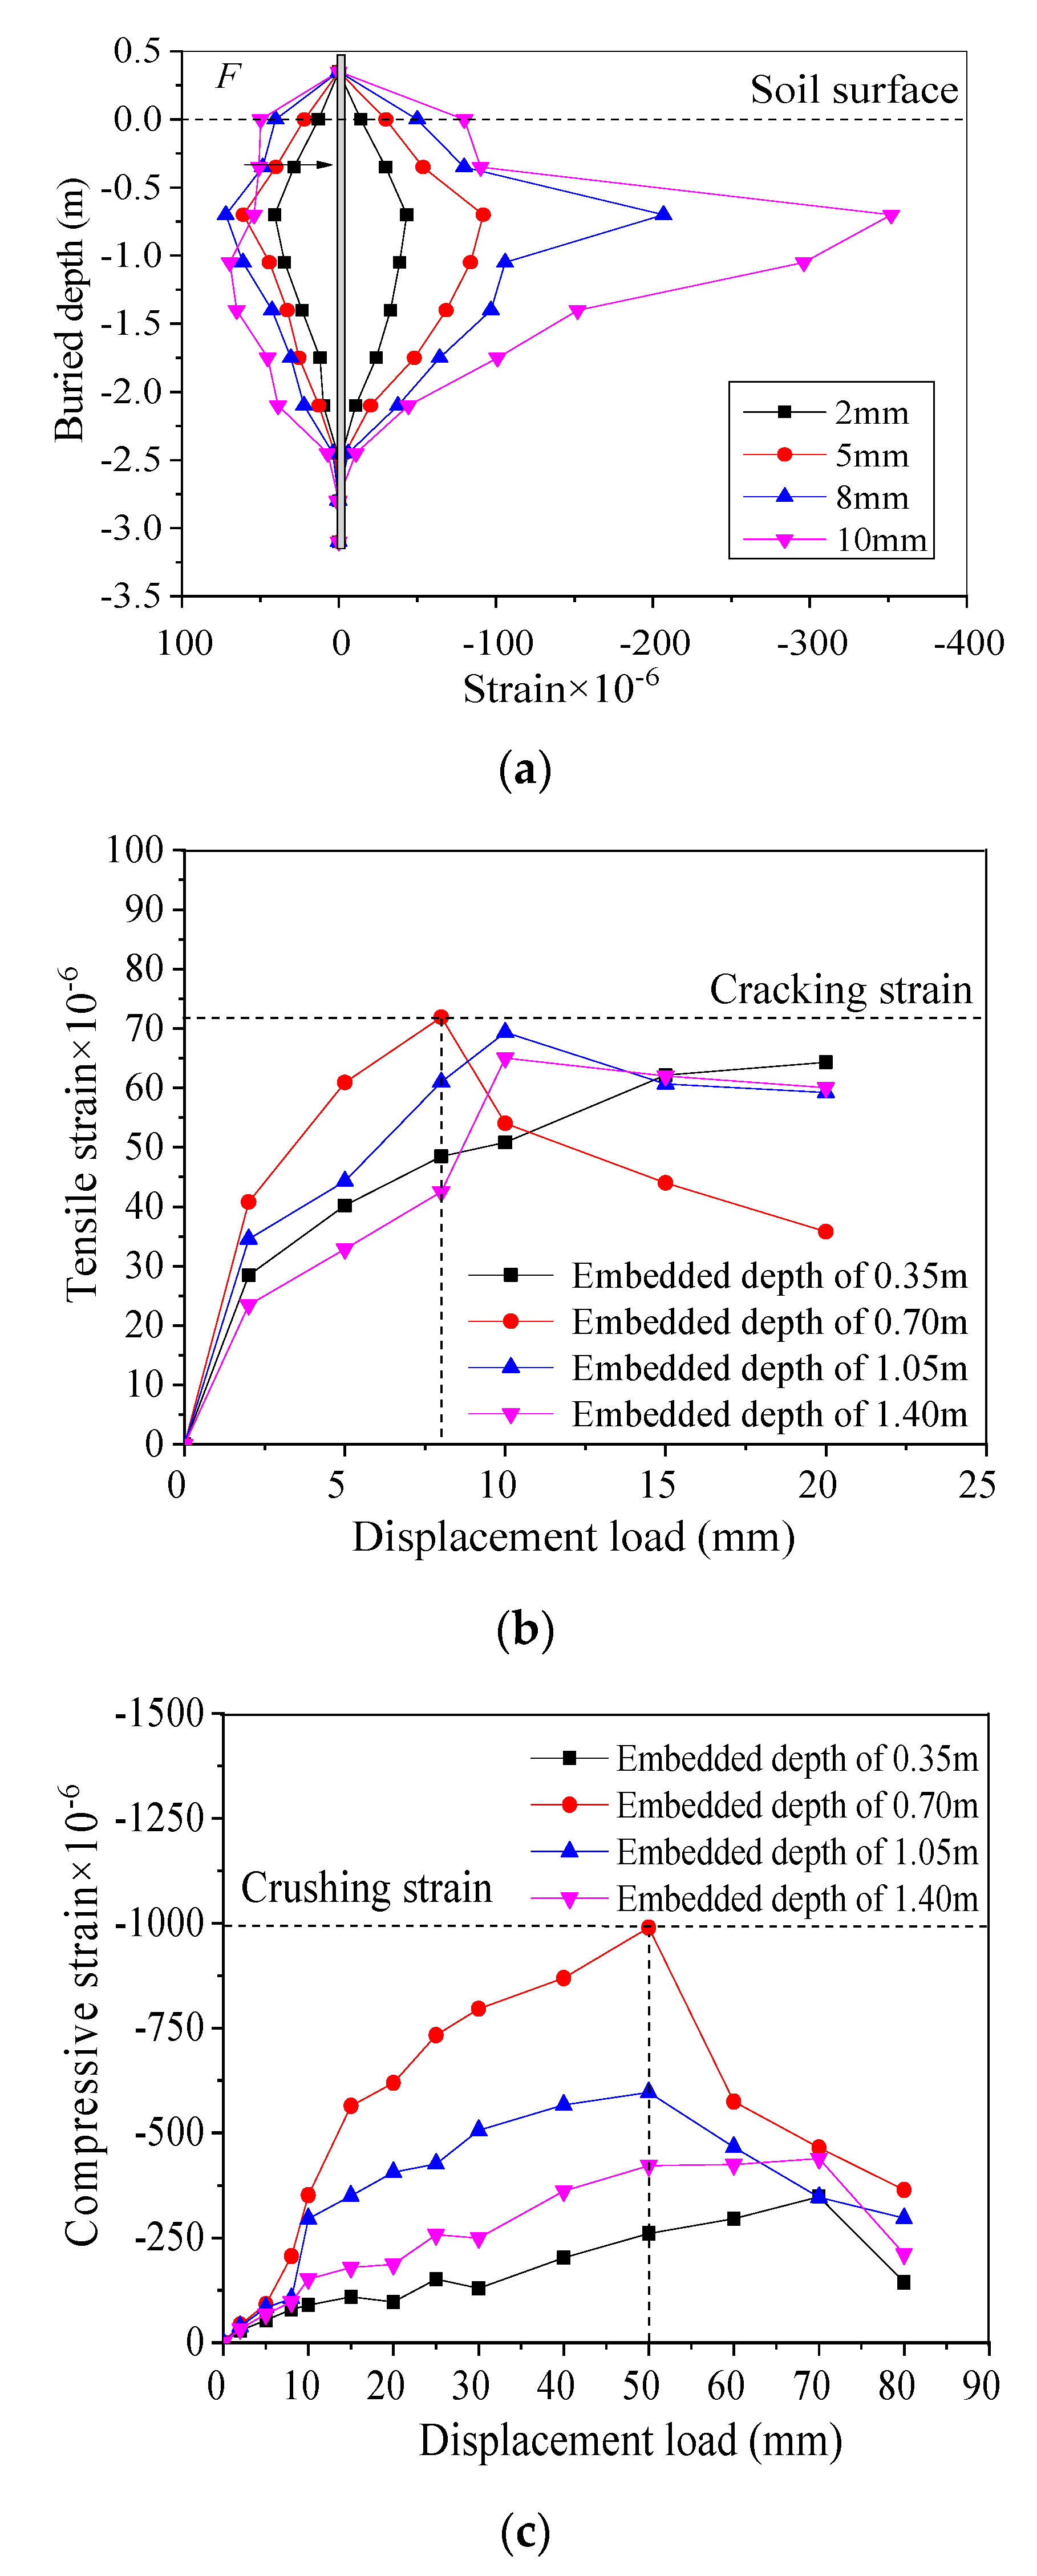
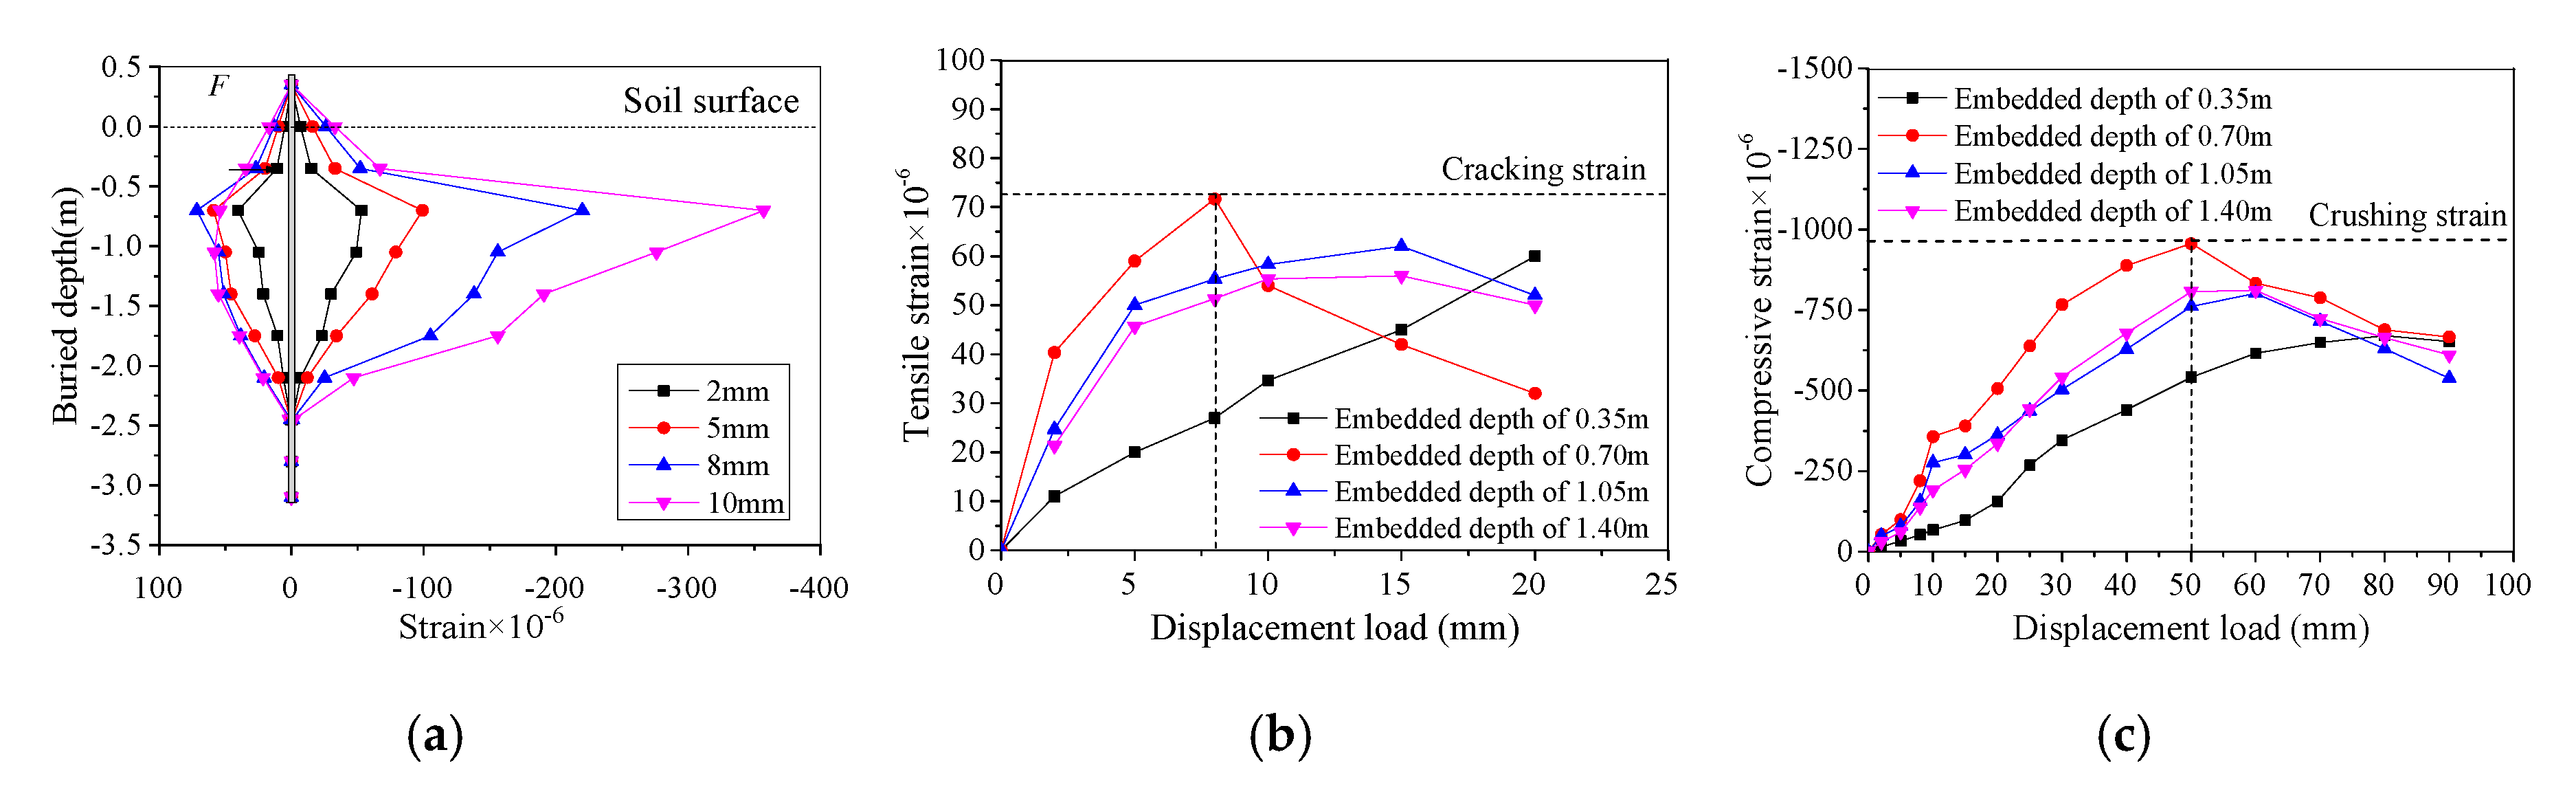
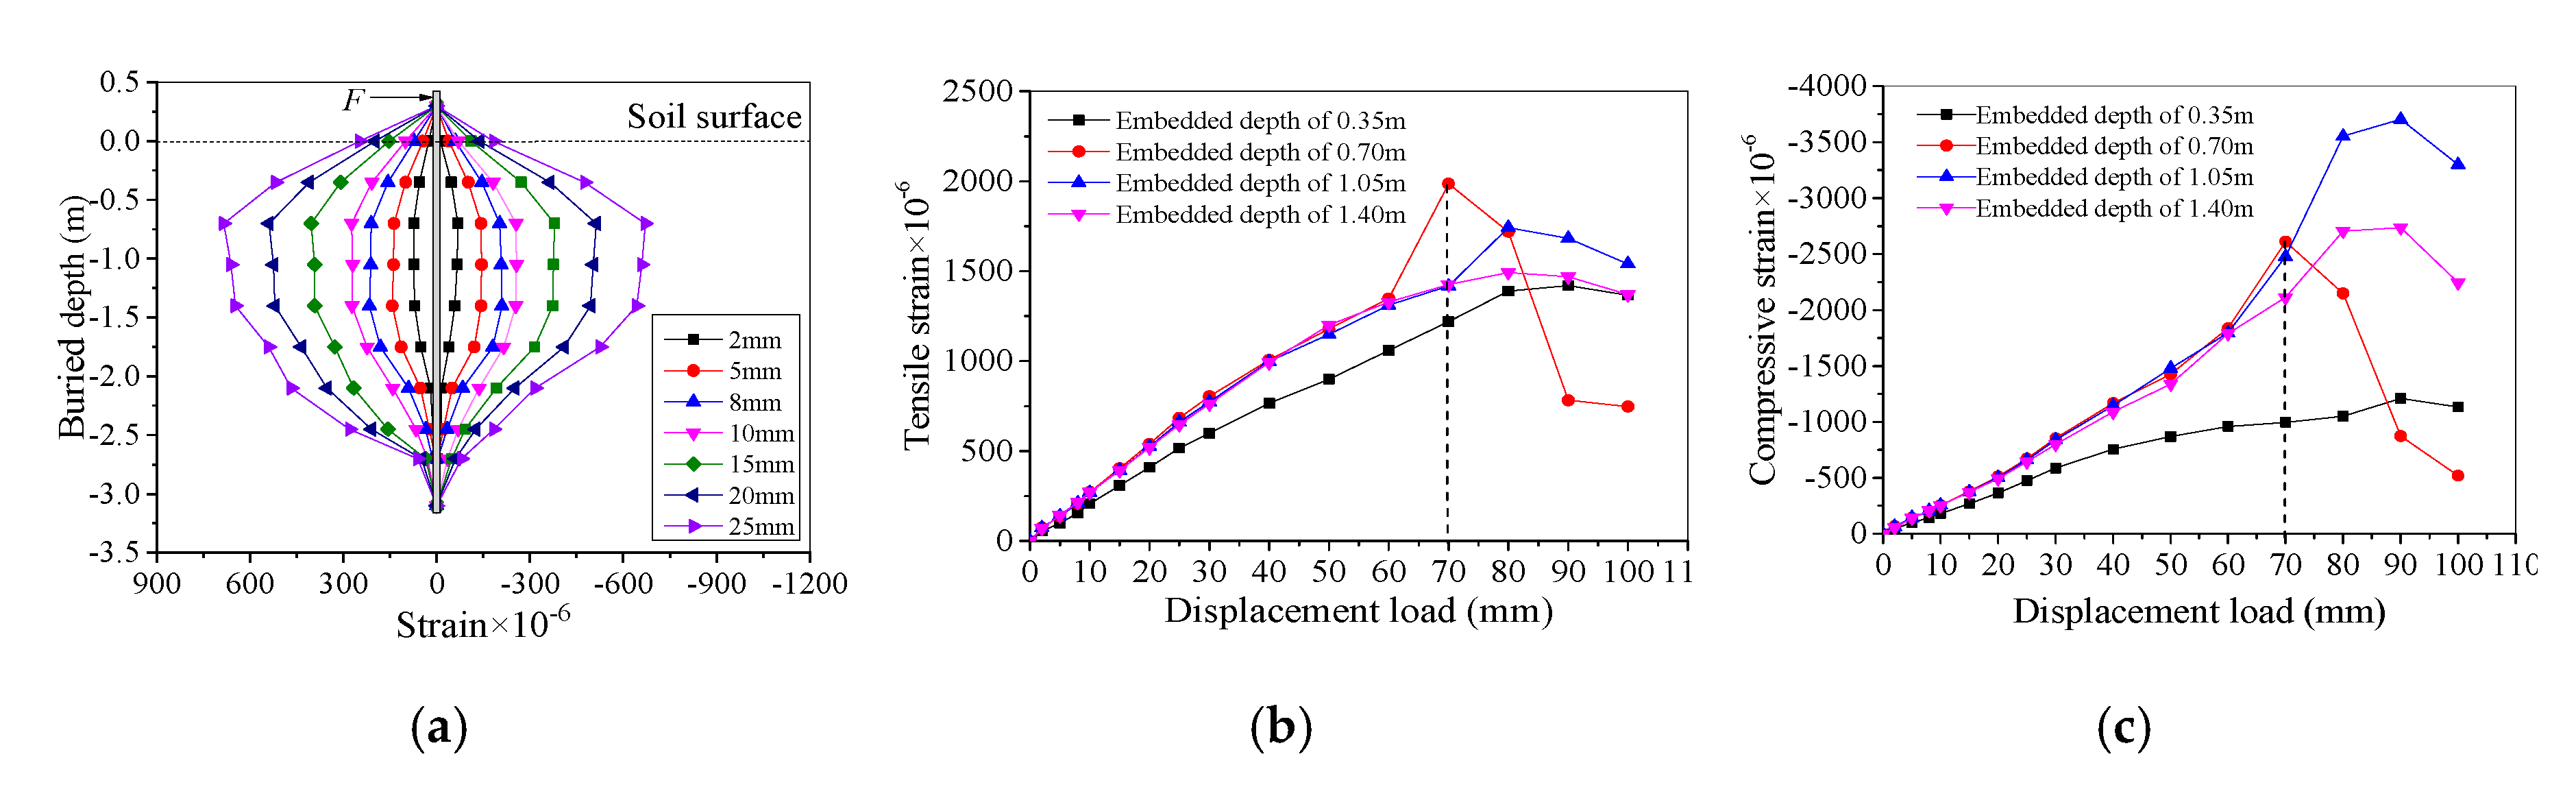
3.3. Strain Distributions

The strains of pile specimens were measured to evaluate the damage states of piles under cyclic displacements. For the sake of brevity, only strain distribution for the CP-2, RP-8 and HP-9 specimens are presented in Figure 11, Figure 12 and Figure 13, respectively.
As seen in Figure 11a and Figure 12a, the tensile and compressive strain distributions of the CP-2 and RP-8 specimens were symmetrical at 2 to 5 mm loading steps, which indicates that the soil–pile system remained elastic. When the displacement loading increased to 8 mm, the tensile and compressive strain distributions started to behave asymmetrically. The compressive strain was continued to increase while the tensile strain remained almost the same as the load reached 8 mm. This is mainly because the concrete started to crack after 5 and 8 mm loading steps at the buried depth of 4.5 D (0.7 m) for the CP-2 and RP-8 specimens and thereby, there was a substantial decrease in the tensile strain of piles after these loading steps, as shown in Figure 11b and Figure 12b. Similar behavior was also observed for the PHC specimens [28].
Figure 13a shows the tensile and compressive strain distributions of the HP-9 specimen were symmetrical up to 25 mm loading, which indicates that the H-shaped steel pile has more favorable flexibility than the common RC and PC piles. Moreover, as Figure 13b,c demonstrates, the tensile and compressive strains of the HP-9 specimen start to decrease at 70 mm loading at 0.7 mm buried depth. It indicates that the H-shaped steel pile showed a substantial elastic-plastic deformation capacity.
Figure 14 presents the cracking and crushing displacements of the CP-1 to CP-5, PC-6 to PC-7, RP-8 specimens as well as the PHC-1 to PHC-4 specimens from the reference [28]. It can be observed from Figure 14a that for the CP-1 to CP-3 specimens the cracking displacement increased with the increase of reinforcement ratios. The cracking displacement of the CP-2, PC-6 to PC-7 and PHC-1 to PHC-4 specimens increased with the increment of the prestressing level. It can be concluded that the larger reinforcement ratio and prestressing level will result in a better concrete cracking resistance for CP, PC and PHC pipe piles in IAJBs. This is the key aspect of designing CP and PC pile foundations for crack resistance in IAJBs. Furthermore, the crushing displacement of concrete was around 40 mm of displacement loading, as illustrated in Figure 14b.

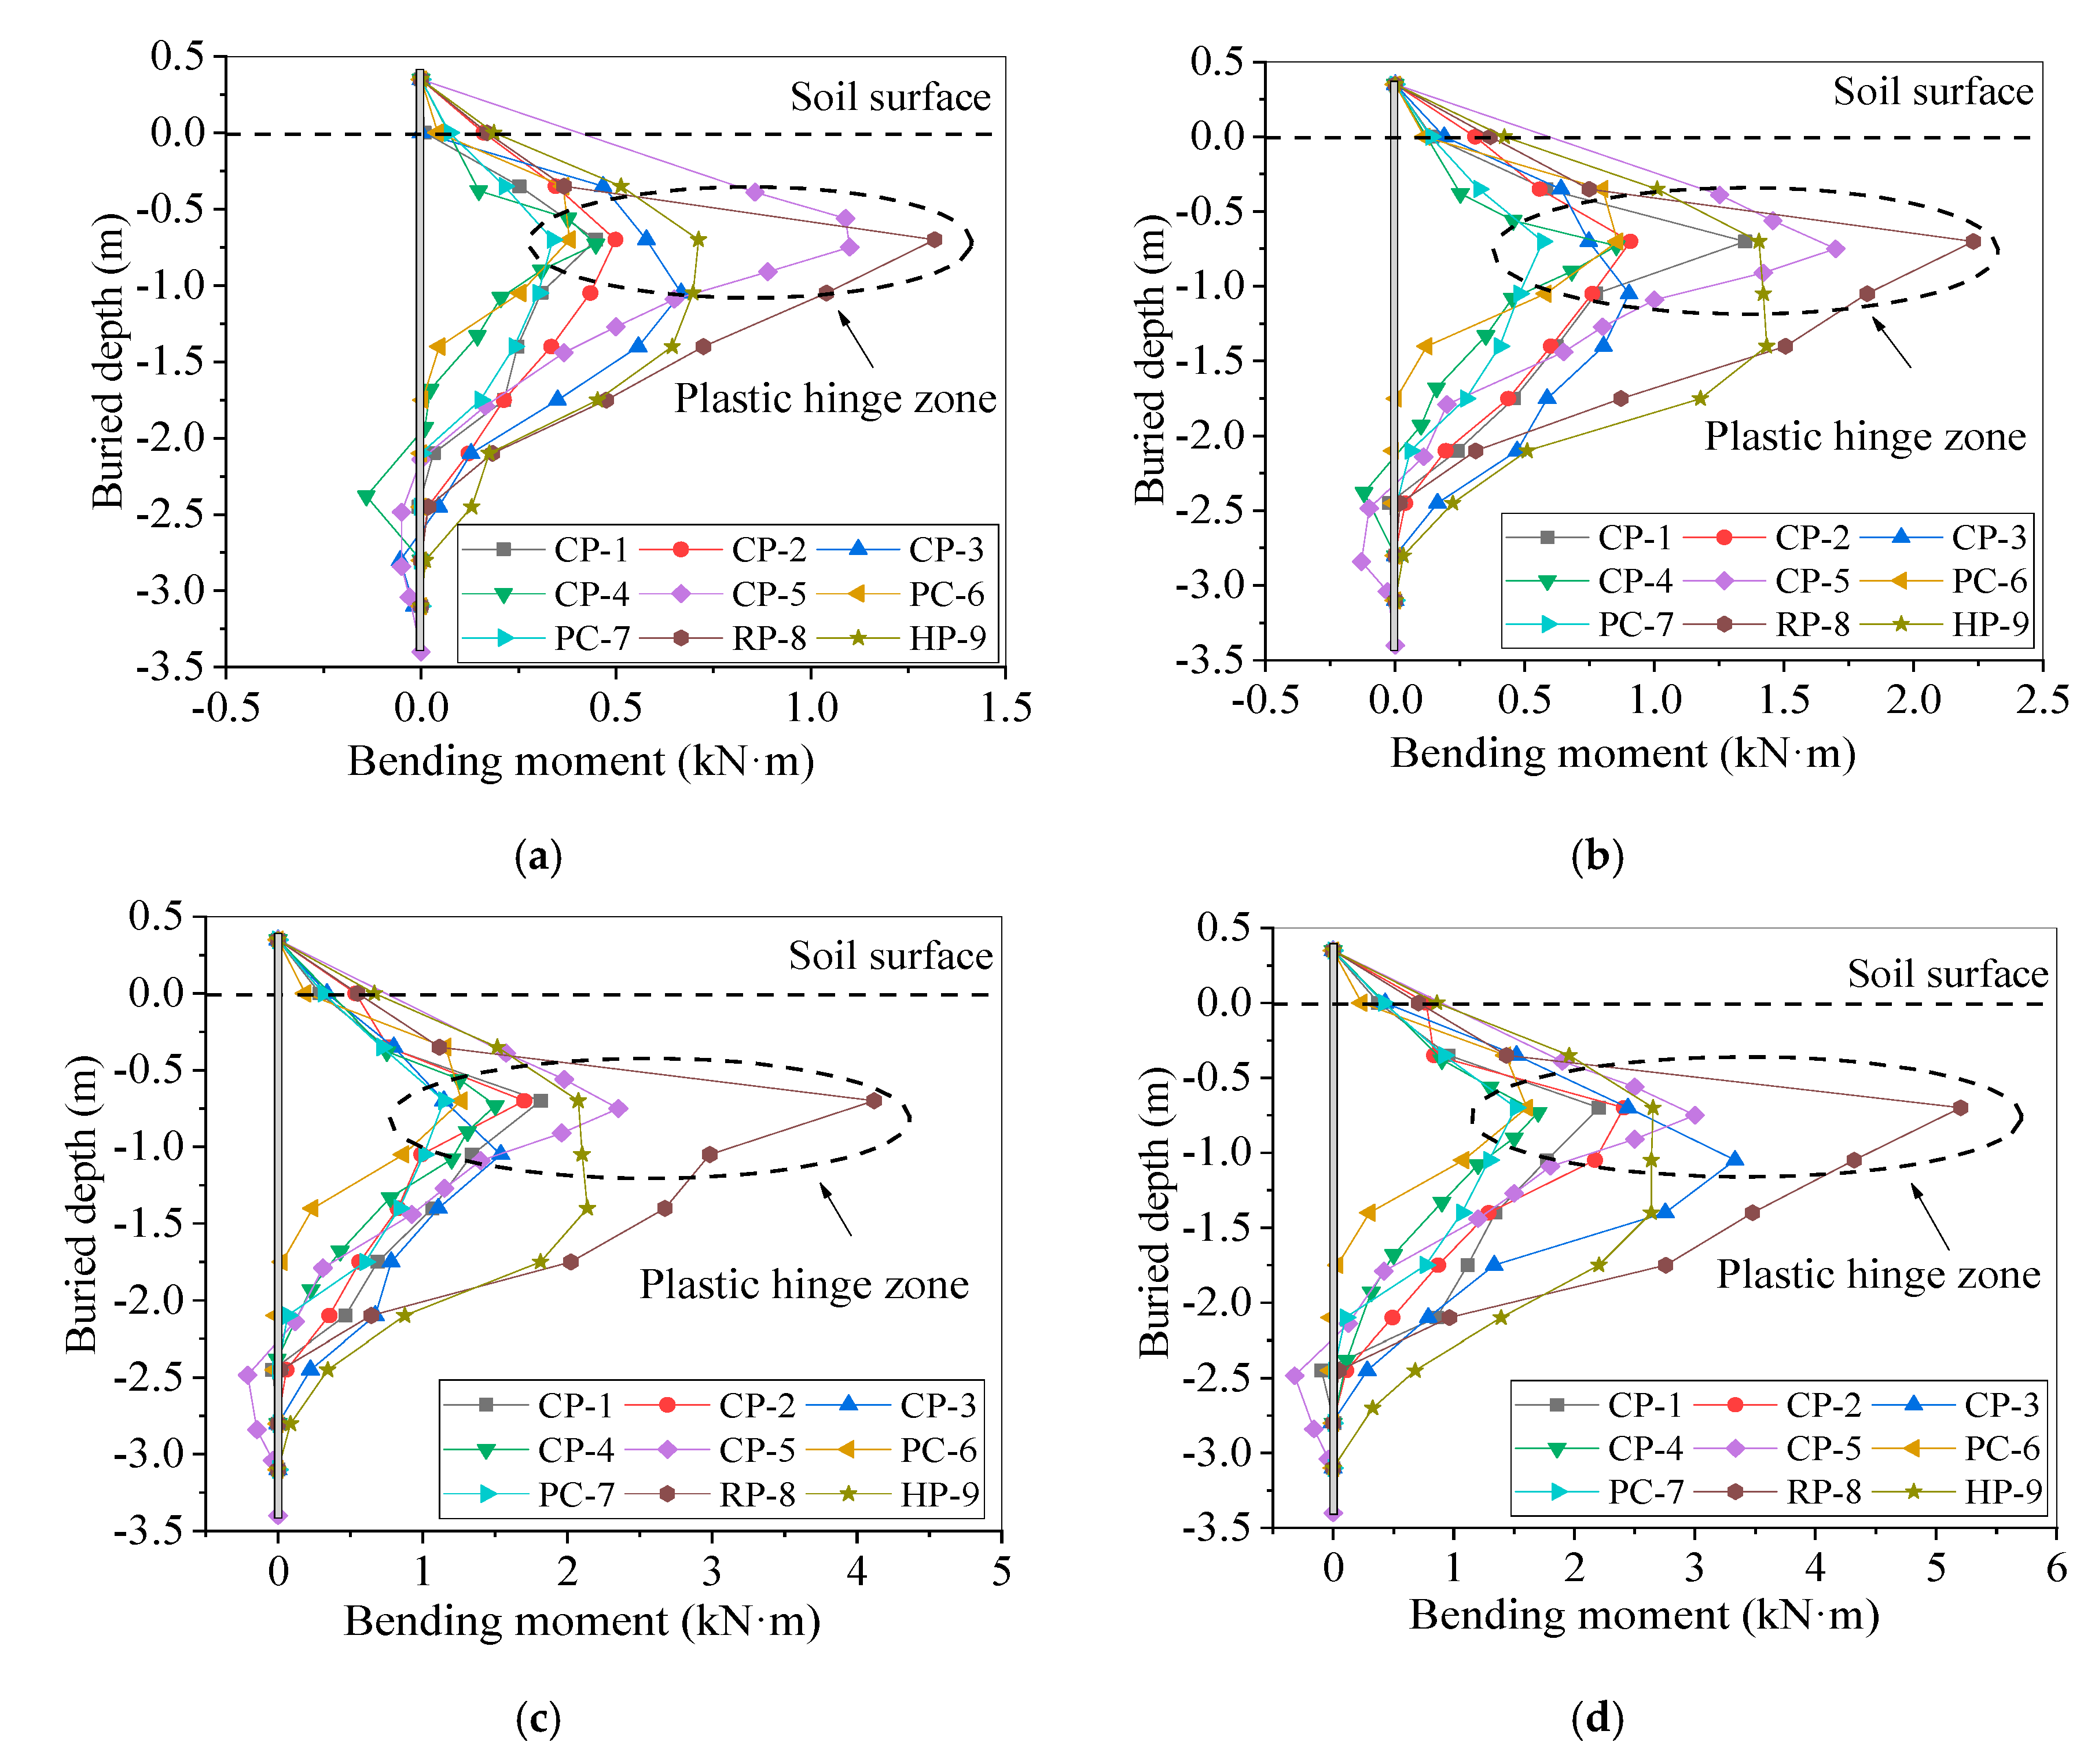
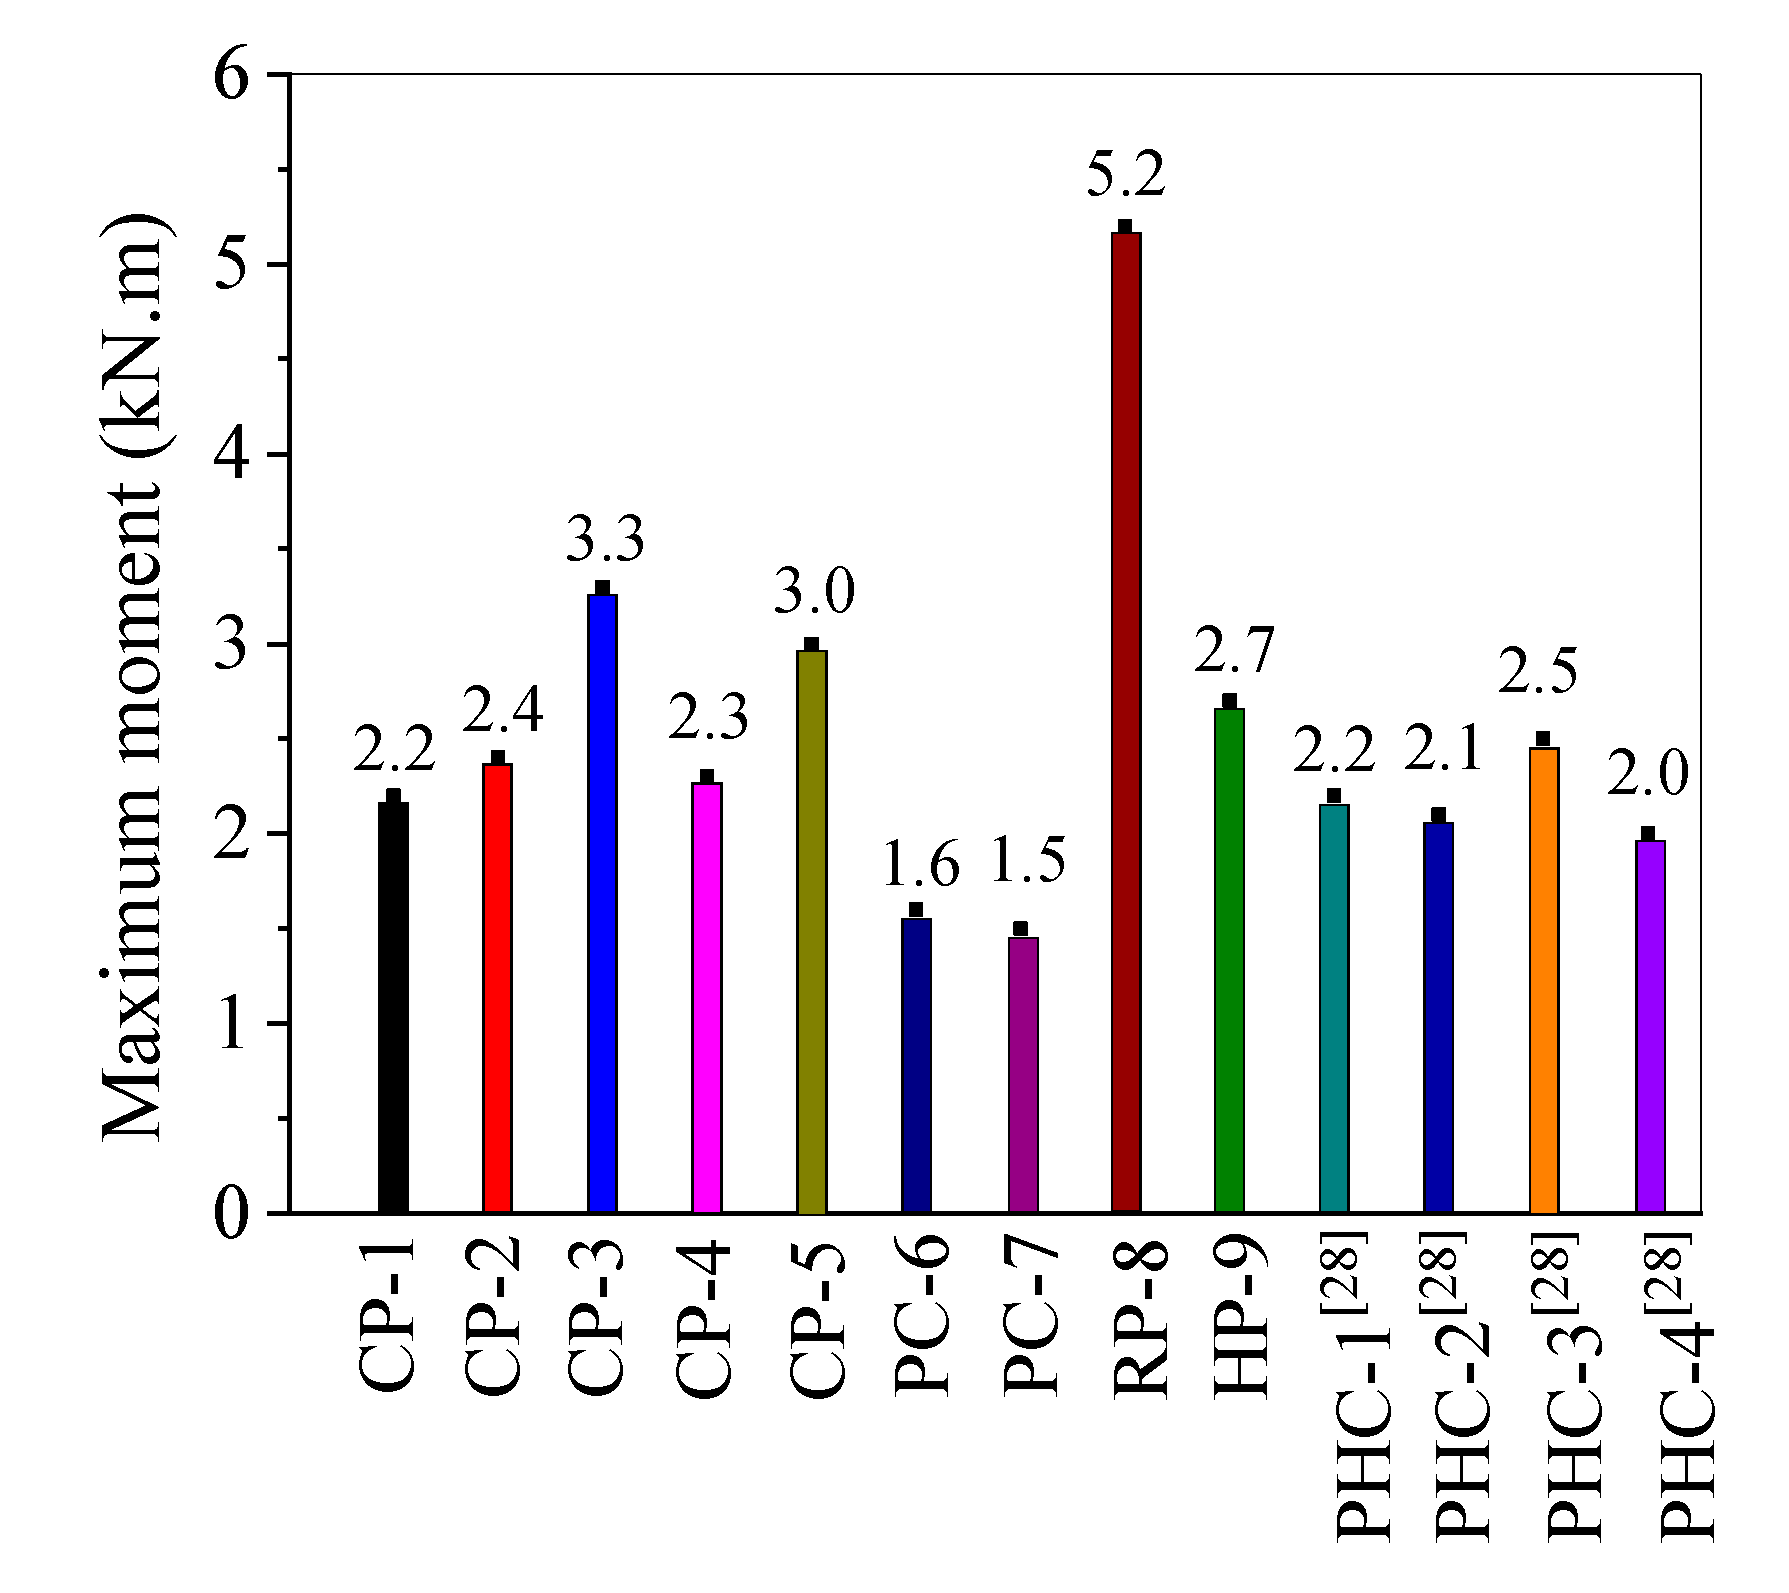
3.4. Bending Moment of Piles

3.4.1. Calculation of Bending Moment

The bending moment M of specimens in the elastic range can be calculated from the measured strains by assuming that the section remained elastic, and can be calculated by the following formula:
M = E I ( ε t ε c ) D
where E is the elastic modulus of concrete; I is the moment of inertia for the section; εt and εc are the measured tensile and compressive strains at the outmost edges of the section, and D is the diameter of pile. All specimens remained elastic under small-displacement loadings. The measured tensile and compressive strains were used to calculate the bending moments. Figure 15a–d show the bending moment distributions at the 2, 5, 8 and 10 mm loading steps for all specimens.
As Figure 15 shows, the maximum moment of the CP-1 to CP-5 and PC-6 to PC-7 specimens was at the depth of 0.7 m and for the RP-8 and HP-9 specimens was at the depth of 1.05 m and 0.7 m, respectively. For the CP-1 to CP-5, PC-6 to PC-7 and RP-8 specimens, the location of the plastic hinge or concrete cracking and crushing was at around the maximum bending moment location.
It can be observed from Figure 16 that with the increment of reinforcement ratio and buried pile depth, the maximum bending moment of the CP-1 to CP-5 specimens also increased. However, with the increase of the prestressing level, the maximum bending moment of the CP-2 and PC-6 to PC-7 specimens decreased. The maximum bending moment of the PHC specimens was almost the same, showing that the variation of the prestressing level has an insignificant effect on the bending moment in the PHC specimens. Moreover, the rectangular RP-8 specimen showed relatively a higher bending moment capacity (53.8% higher) than the circular CP-2 specimen owing to its larger inertia moment.

3.4.2. The Analyses of Bearing Ratio

The bearing ratio (v) is used to evaluate the soil-pile interaction of the pile foundation, and it was calculated by the following equation:
v = M / M 0
M 0 = F l
where M is the bending moment calculated by equation 1; M0 is the external moment, neglecting the soil effect and assuming that the pile is a cantilever beam; F is the lateral force imposed by the actuator; l is the lever arm length. Table 5 presents the bending moments and the bearing ratios of the CP-1 to CP-5, PC-6 to PC-7, RP-8 and HP-9 specimens at 0.7 m of buried depth for 5, 8, 10 and 15 mm displacement loadings. The force F was applied at 0.3 m above the soil surface, thus the external lever arm length was 1.0 m.
As Table 5 indicates, the pile specimens were subjected to the larger external load with the increase of the bearing ratio. However, the bearing ratio of pile decreased after concrete cracked and its surrounding soil bore a larger external load. For the CP-1, CP-4 and PHC-2 to PHC-4 specimens, the bearing ratio reached the maximum value at 8 mm displacement loading and decreased after the concrete cracked. The bearing ratio of the CP-2, RP-8 and PHC-1 specimens reached the maximum value at 10 mm displacement loading, and then it was decreasing. For the CP-3 and CP-5 specimens, the bearing ratio slightly decreased at 15 mm displacement loading. The bearing ratio of the PC-6 and PC-7 specimens reached the maximum value at 15 mm displacement loading. It can be concluded that the soil–pile interaction increases with the increase of reinforcement ratio, buried pile depth and prestressing level. Moreover, the bearing ratio of the HP-9 specimen was slightly decreased as the loading increased, indicating that the HP-9 specimen remained in the elastic range and the surrounding soil was subjected to increasing load.

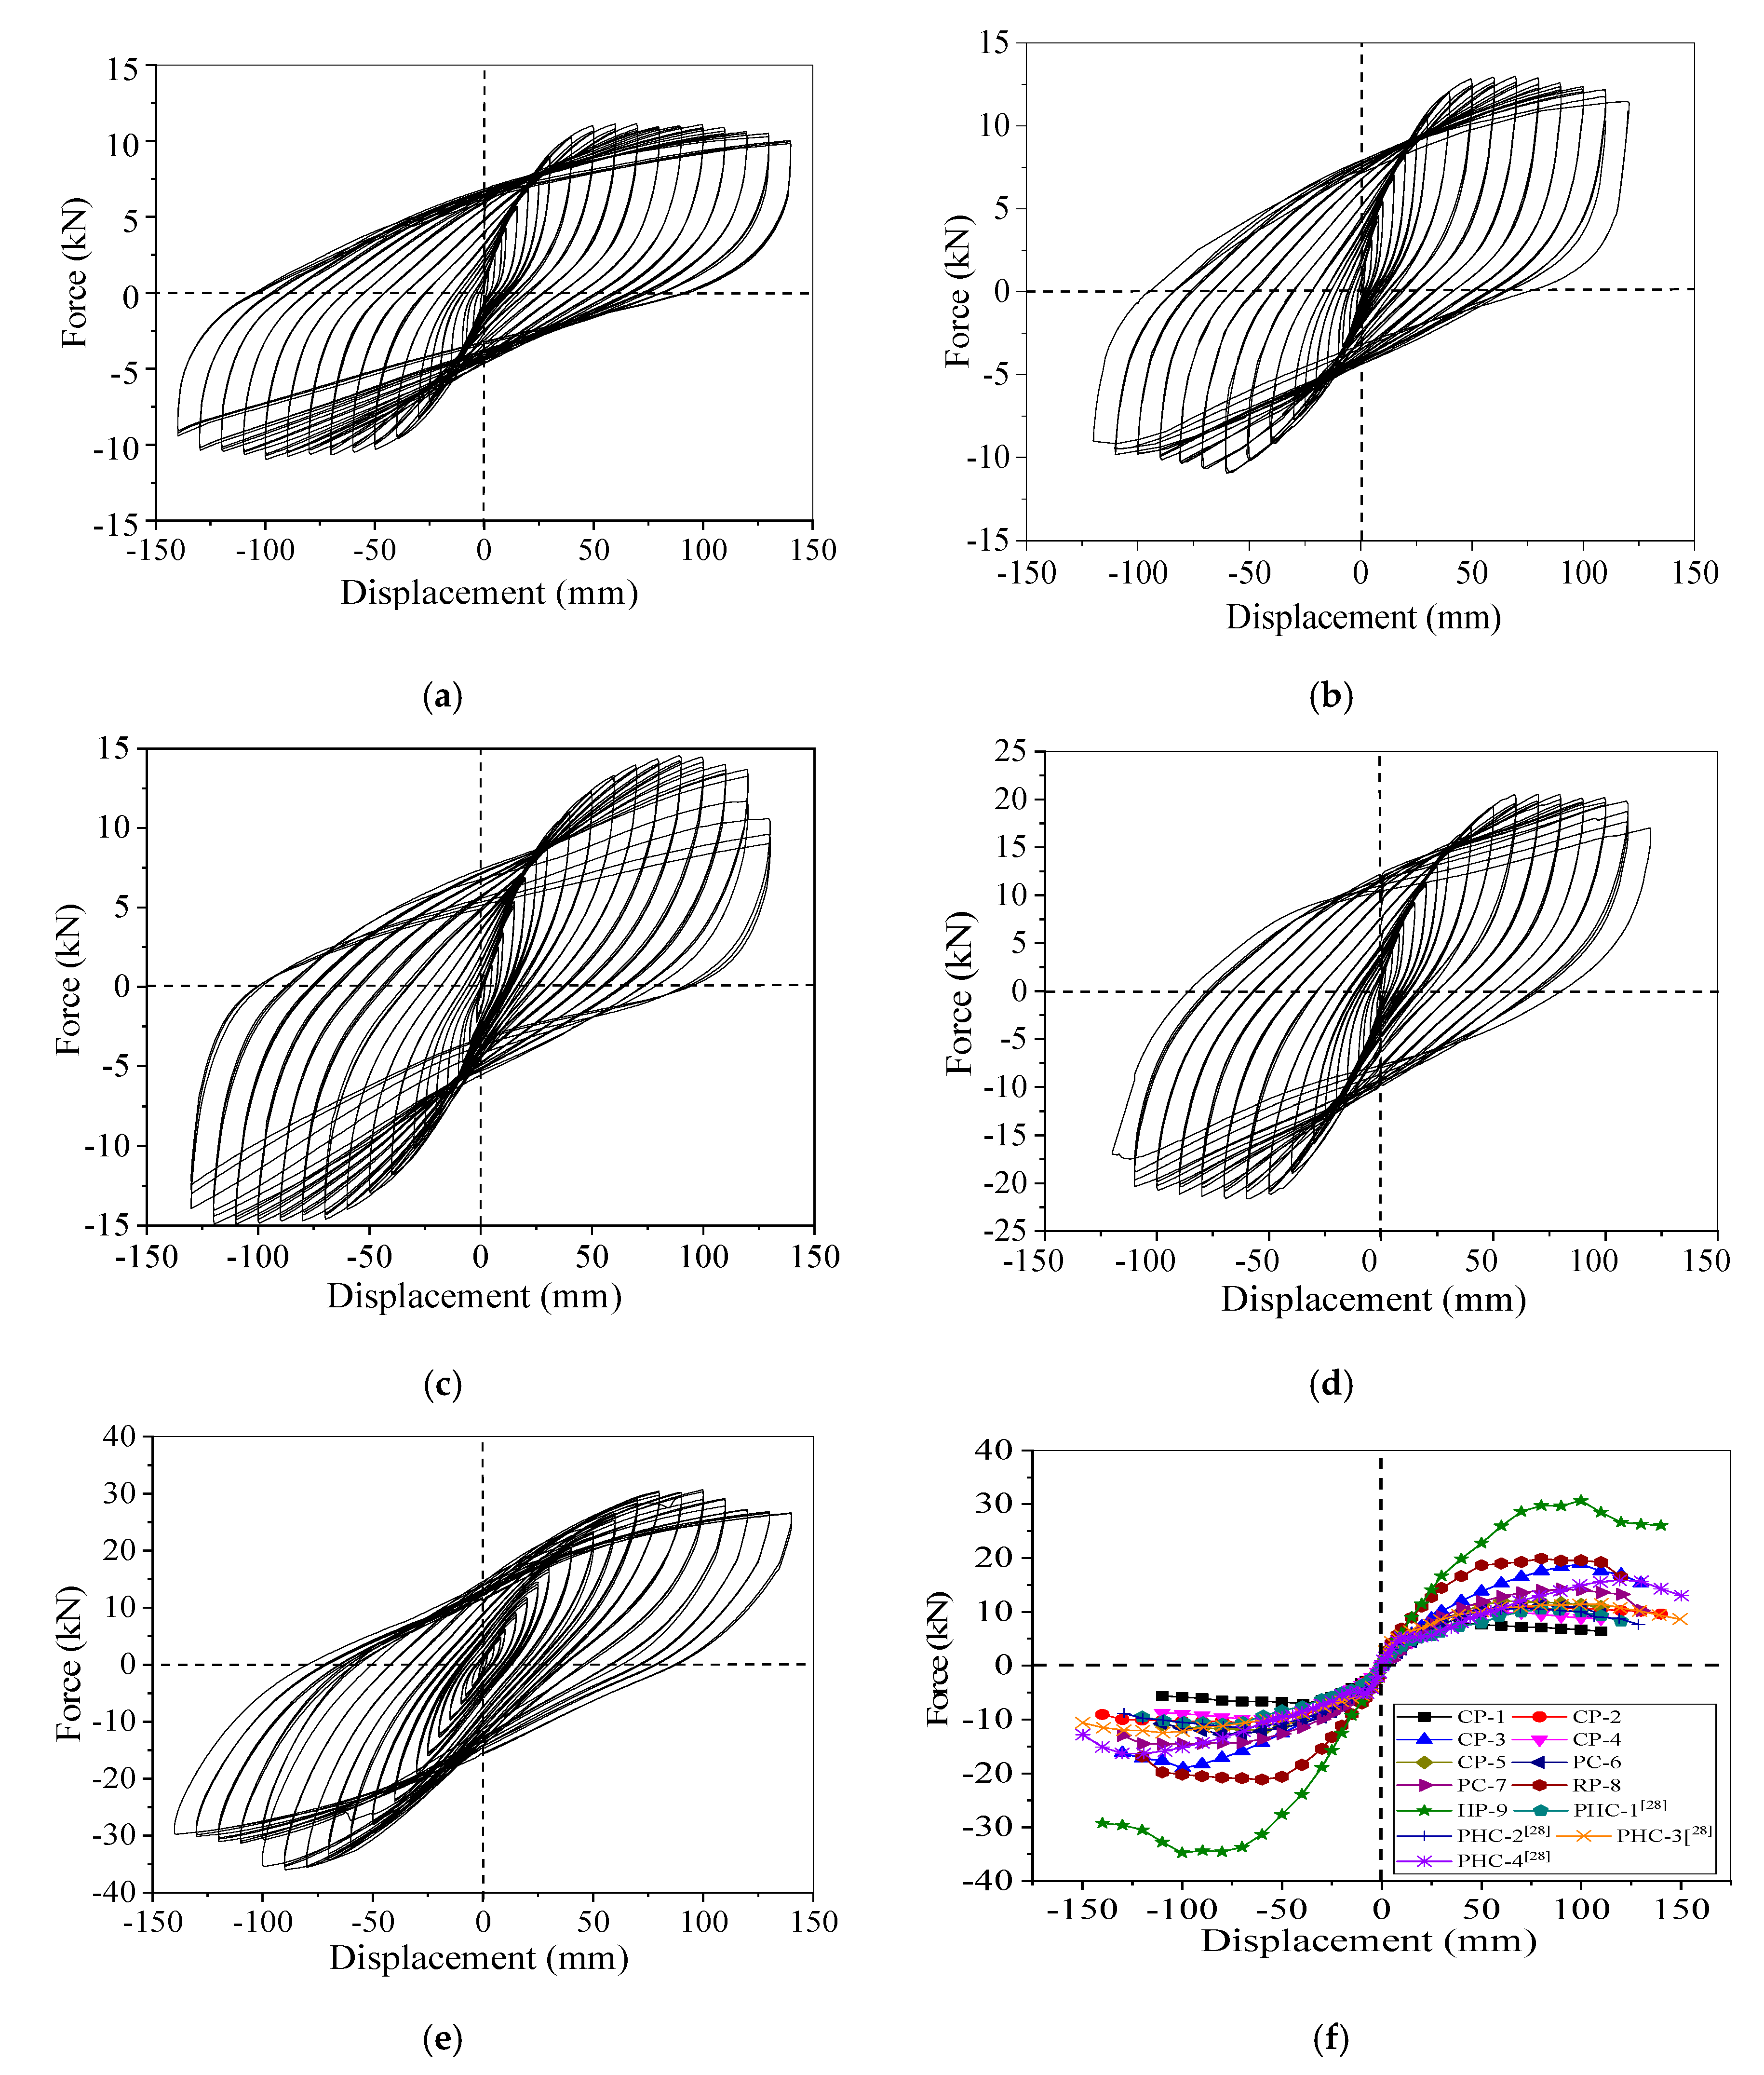
3.5. Hysteresis and Backbone Curves

3.5.1. Hysteresis Curves

Figure 17 shows the hysteresis curves of the CP-2, CP-5, PC-6, RP-8 and HP-9 specimens and the backbone curves of all specimens [28] that are used to evaluate their energy dissipation and lateral load-bearing capacities.
The energy dissipation capacity of the HP-9 steel specimen was better than the CP and PC concrete specimens, as it had larger hysteresis loops. The CP-5 specimen with larger buried pile depth had a better energy dissipation capacity as compared to the CP-2 and RP-8 specimens. It also found that the RP-8 specimen had a better energy dissipation capacity as compared to the CP-2 specimen due to its larger cross-section that increased the soil-pile interaction.
As Figure 17f shows, the lateral bearing capacity of the HP-9 specimen was the largest, followed by RP-8 specimen. The maximum bearing capacity of the HP-9 specimen was 54% larger than the RP-8 specimen. The maximum bearing capacity of the CP-5, PC-7 and RP-8 specimens was 7.6%, 27% and 78.7% larger than CP-2 specimen, respectively. The lateral bearing capacity and ductility of piles were improved with the increase of the reinforcement ratio, prestressing level and cross-section size.

3.5.2. Backbone Curves

As Figure 18a shows, with the increase of reinforcement ratio, buried pile depth and prestressing level, the peak displacement of specimens also increased and generally reached 80 mm for all concrete specimens. The ultimate displacement of specimens was also increased as the reinforcement ratio, buried pile depth and prestressing level increased and generally reached to 120 mm for all concrete specimens, as shown in Figure 18b. It worth mentioning that the reinforcement ratio and prestressing level had similar effects on increasing the peak and ultimate displacements of the piles.
Figure 19 shows the typical force-displacement curve of the pile with respect to its failure mechanism based on the backbone curves of all specimens. The curve is divided into seven stages: elastic behavior, imperceptible crack but linear behavior, minor damage, moderate damage but repairable, significant damage but repairable, significant damage but no collapse, unacceptable damage. For the elastic behavior stage, the horizontal deformation was limited to 5 mm, which was in the elastic range. For the second stage, the pile had a linear behavior as observed from the backbone curves and imperceptible cracks had occurred as observed from the tension strains of the concrete pile. The horizontal deformation was limited to 10 mm for this stage. For the third stage, the obvious cracks with minor damage had occurred under the horizontal deformation of 20 mm. In the fourth stage, the horizontal deformation reached 40 mm and the concrete was crushed with moderate damage. In the last stage, the deformations reached to 80 mm and 120 mm with significant damage to the pile.

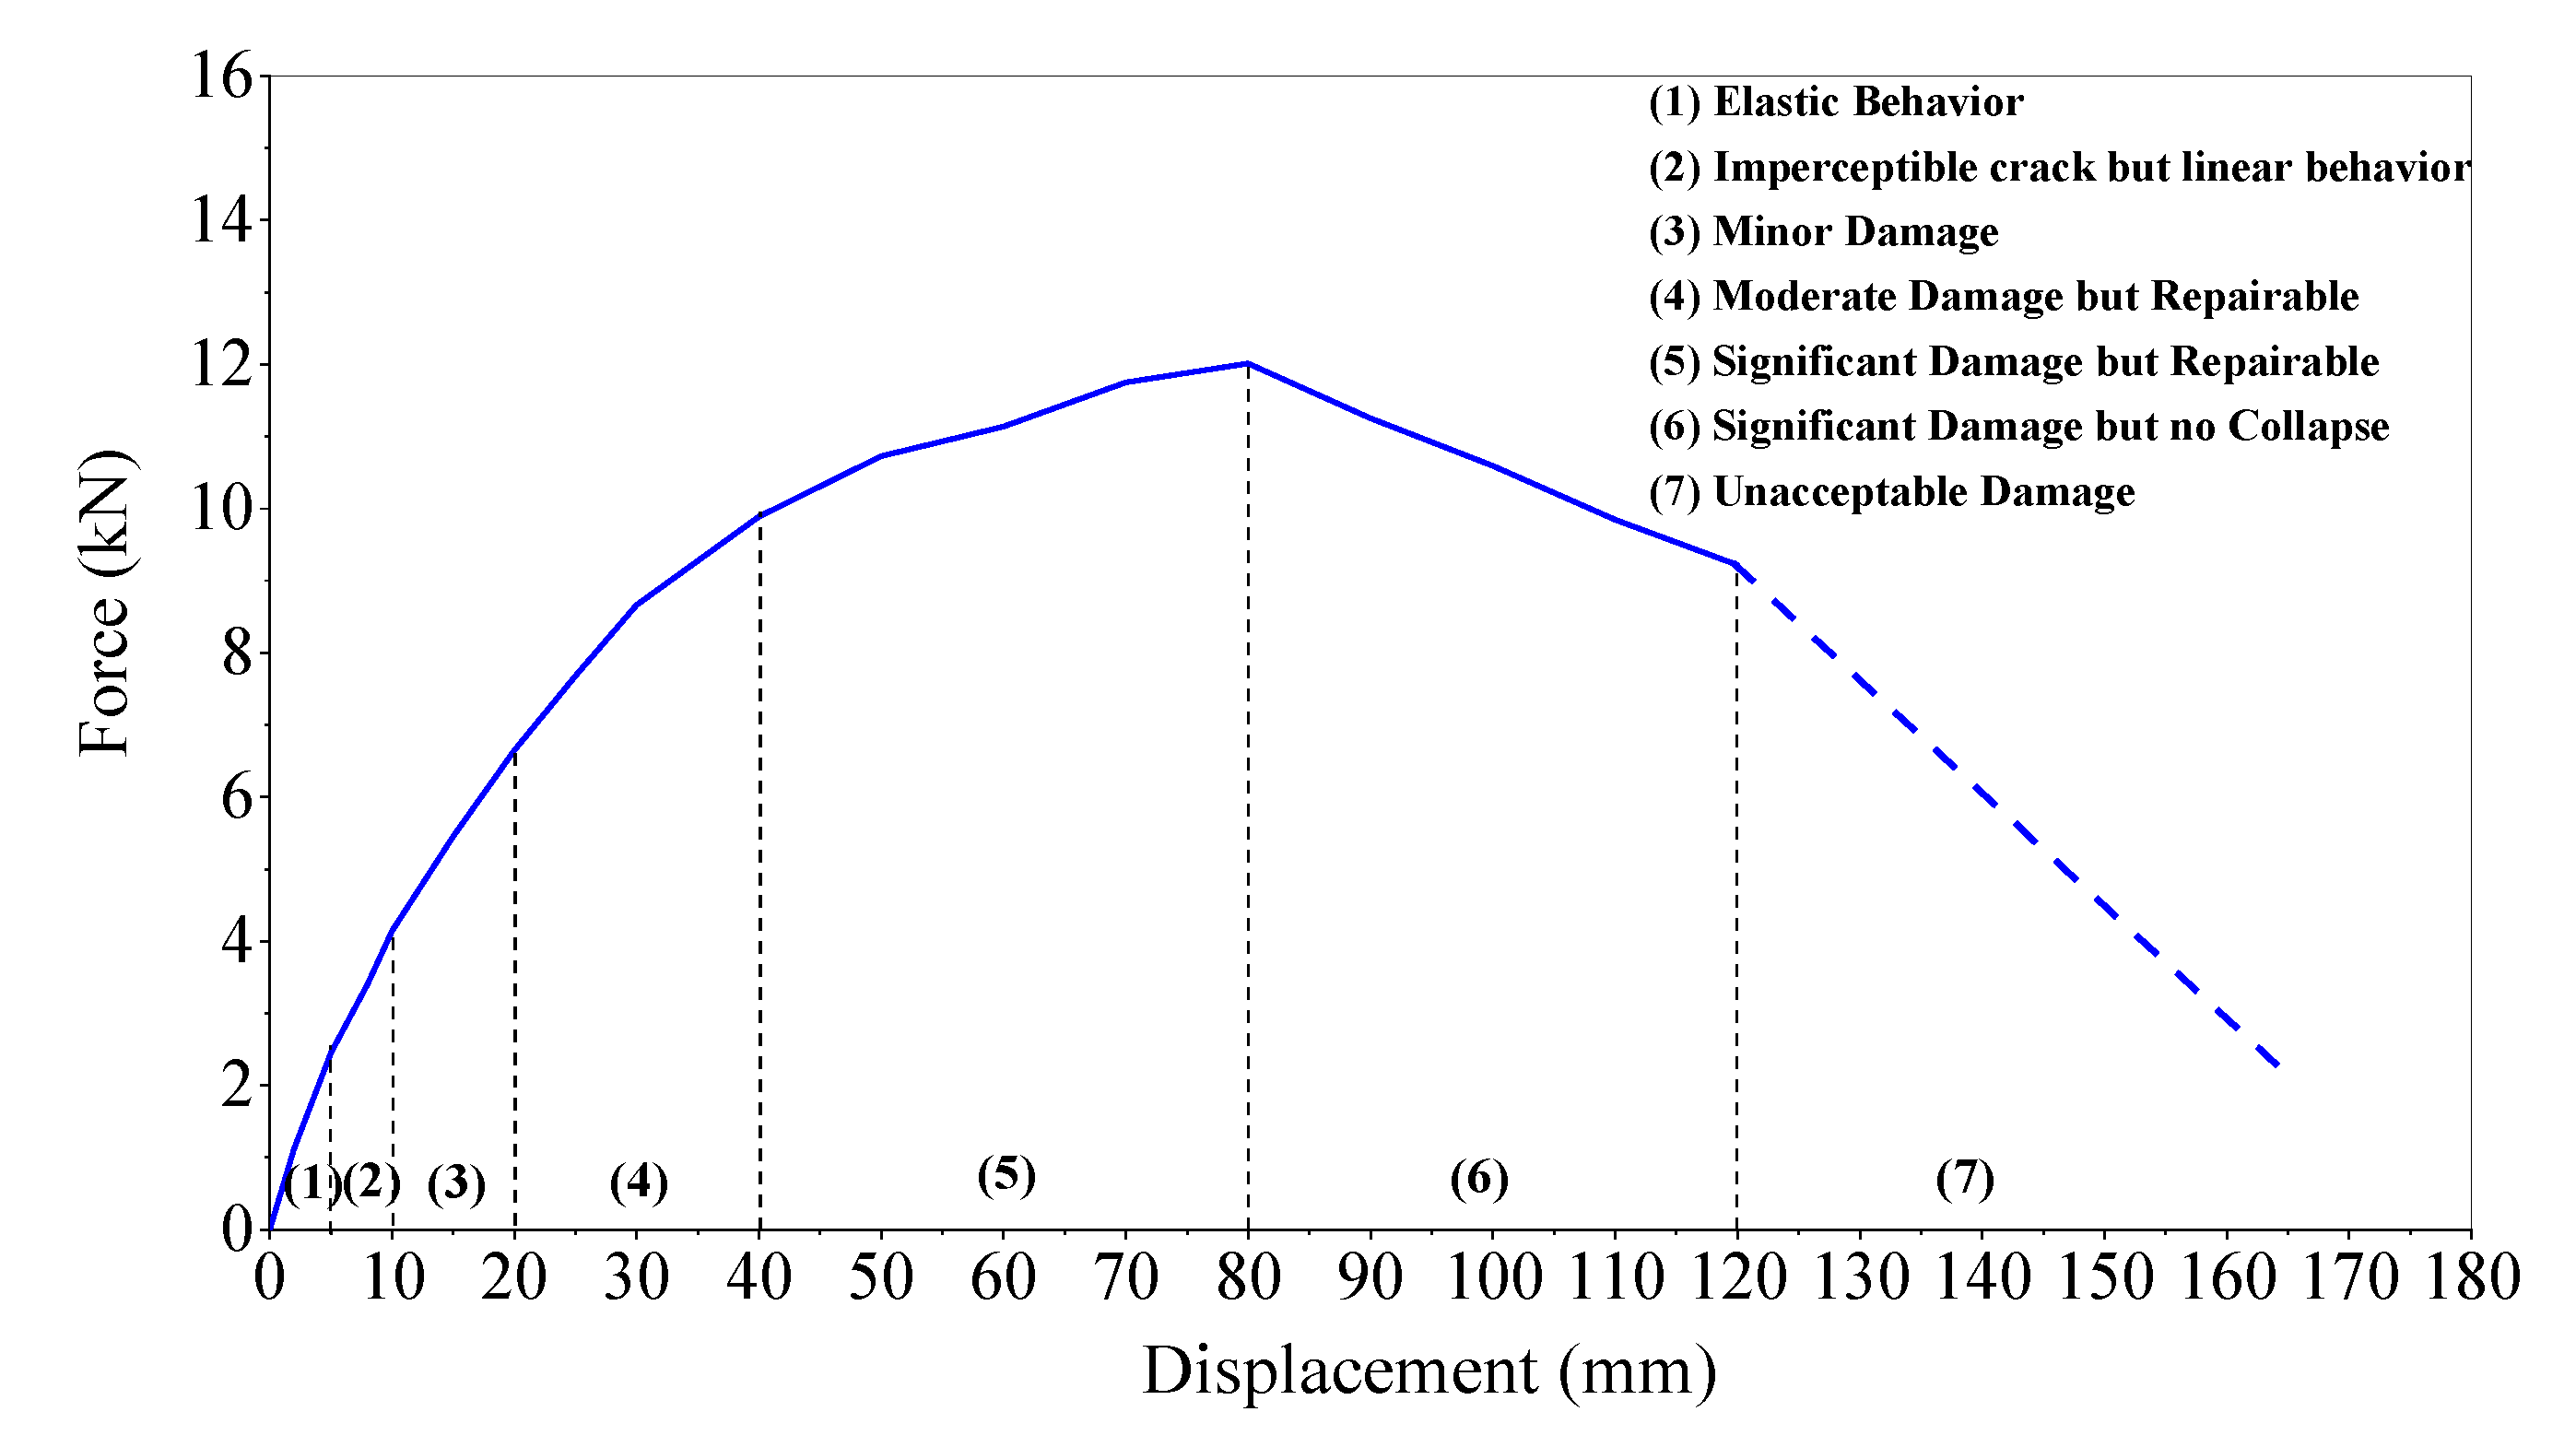
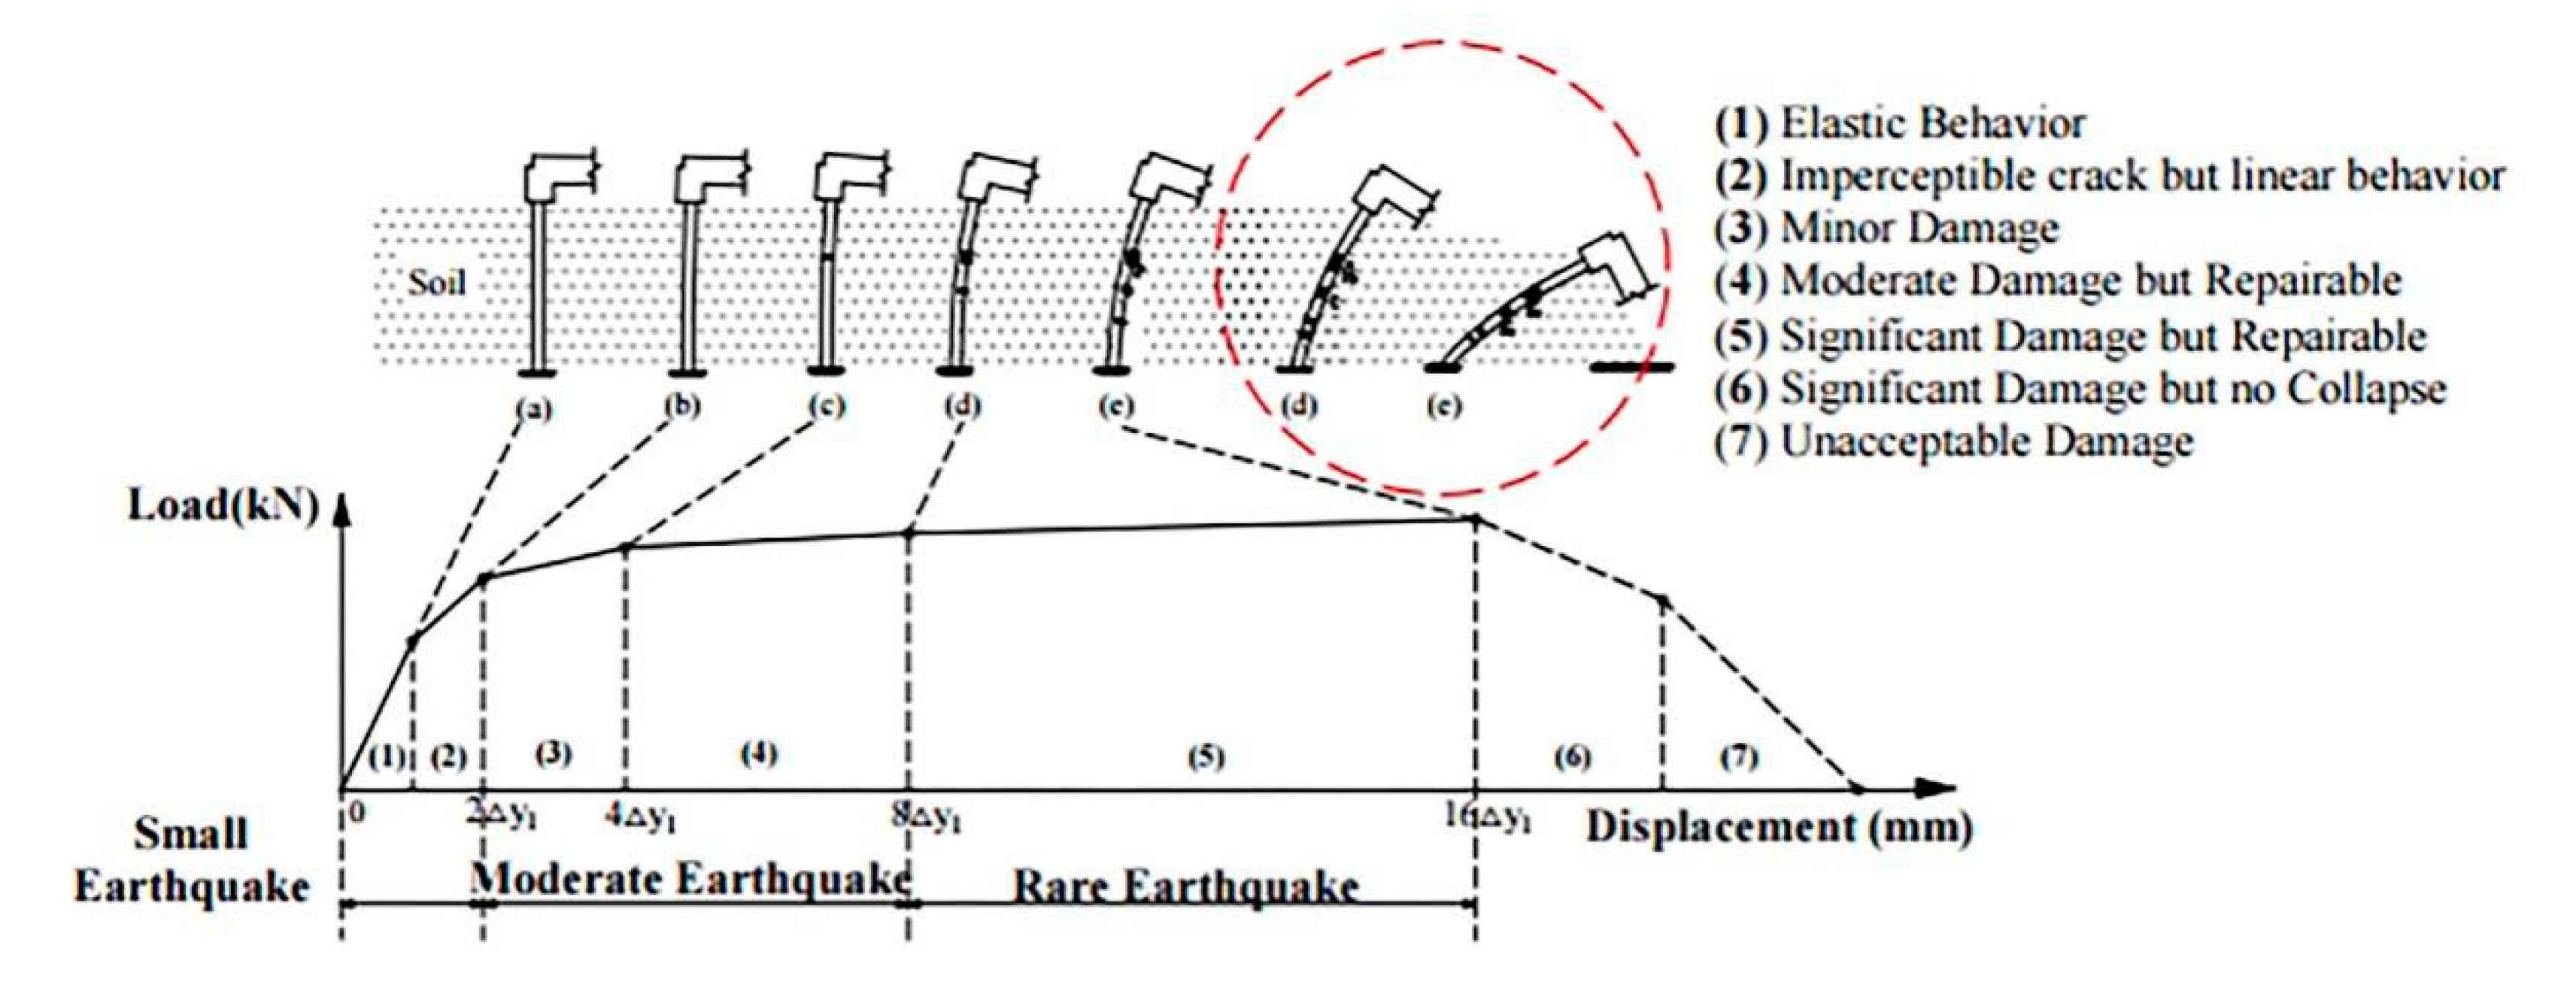
4. Displacement-Based Seismic Design of Pile

Based on the typical failure process of the pile, new displacement-based seismic design criteria were proposed for the pile foundation of IAJBs, as shown in Figure 20. As this figure shows, in small earthquakes the pile foundation behaves linearly within the range of 0~2.0 Δy1 (0~10.0 mm) lateral deformation of the pile head. The pile behaves elastically within the range of 0~1.0 Δy1 (0~5.0 mm), and over 1.0 Δy1 (5.0 mm) invisible cracks may appear in the pile due to the ambient temperature or seismic loadings. However, when the force is stopped, the cracks will close. In moderate earthquakes, the pile may suffer minor or moderate damage within the range of 2.0~8.0 Δy1 (10.0~40.0 mm). Minor damages may occur in the pile at approximately 4 Δy1 (20.0 mm) lateral deformation, which can be repaired. The pile may suffer moderate damage at approximately 8 Δy1 (40.0 mm), which also can be repaired. In the rare earthquakes, the pile may suffer significant damage. The significant damage may occur in the range of 8.0~16.0 Δy1 (40.0~80.0 mm) pile displacement and can be repaired. The displacement from 16 Δy1 to 24.0 Δy1 (80.0 mm to 120.0 mm) may cause significant damage to the pile with no collapse, and displacement over 24.0 Δy1 may cause unacceptable damage in the pile foundation of IAJBs. The displacement-based seismic design criteria of three-stage seismic fortification and five damage level for the piers were proposed by AASHTO [35]. However, the seismic design criteria for the pile foundations are unavailable in AASHTO while it is mentioned that a significant inelastic deformation is permitted for the piles subjected to rare earthquakes. The last two stages of the pile had not taken in the design criteria as the pile cannot be repaired. Thus, new seismic design criteria of the pile, namely, three-stage seismic fortification and five damage levels, were proposed for IAJBs based on AASHTO.
In Figure 20 and AASHTO [35], the yield displacements of the pile and piers, Δy1 and Δy2, are 5 mm and 25.0 mm (≈1.0 in.), respectively, based on the test results. AASHTO [35] shows that in a small earthquake the pier has an elastic behavior within the range of 0~1.0 Δy2 (0~25.0 mm) horizontal deformations at the pier top. In a moderate earthquake, the minor and moderate damages of the pier may appear in the range of 1~4 Δy2 (25.0~100.0 mm) lateral deformation. The pier may suffer minor damage at approximately 2 Δy2 (50.0 mm) of lateral deformation, which can be repaired. The moderate damage to the pier is more severe at approximately 4 Δy2 (100.0 mm) displacement and can be repaired or the pier can be replaced. In a rare earthquake, significant damage may cause in the pier displacement lesser than 6 Δy2 (150.0 mm), but without collapse. Unacceptable damage to the pier with the possibility of collapse may occur if pile displacement exceeds 6 Δy2.
By comparing Figure 20 and AASHTO [35] it can be seen that the design criteria of the pile have two stages more than the pier in a small earthquake. It can be also seen that the descent stages of the pier include significant damage and collapse, while there is no descent stage for the pile foundation. This because the pile supporting the abutment usually bears a lower vertical dead load as compared to the pier, where there is little chance of collapse for the pile and insignificant P-Δ effect.

5. Conclusions

A low cycle pseudo-static test on different types of piles for IAJBs was carried out to investigate their different mechanical behaviors in terms of damage mode, horizontal deformation and bearing capacity, strain and bending moment distribution. Based on the analyses of the experimental results, the seismic design criteria of three-stage seismic fortification and five damage levels for the concrete piles of IAJBs were put forward and the following conclusions are drawn.
(1)
With the increase of reinforcement ratio, buried pile depth and prestressing level, the pile damage depth shifted to a deeper depth of the pile and also showed a better pile–soil interaction. Moreover, the rectangular pile had a larger soil–pile interaction than the circular pile. The H-shaped steel pile showed a better elastic-plastic deformation capacity, ductility and energy dissipation capacity as compared to the concrete pile.
(2)
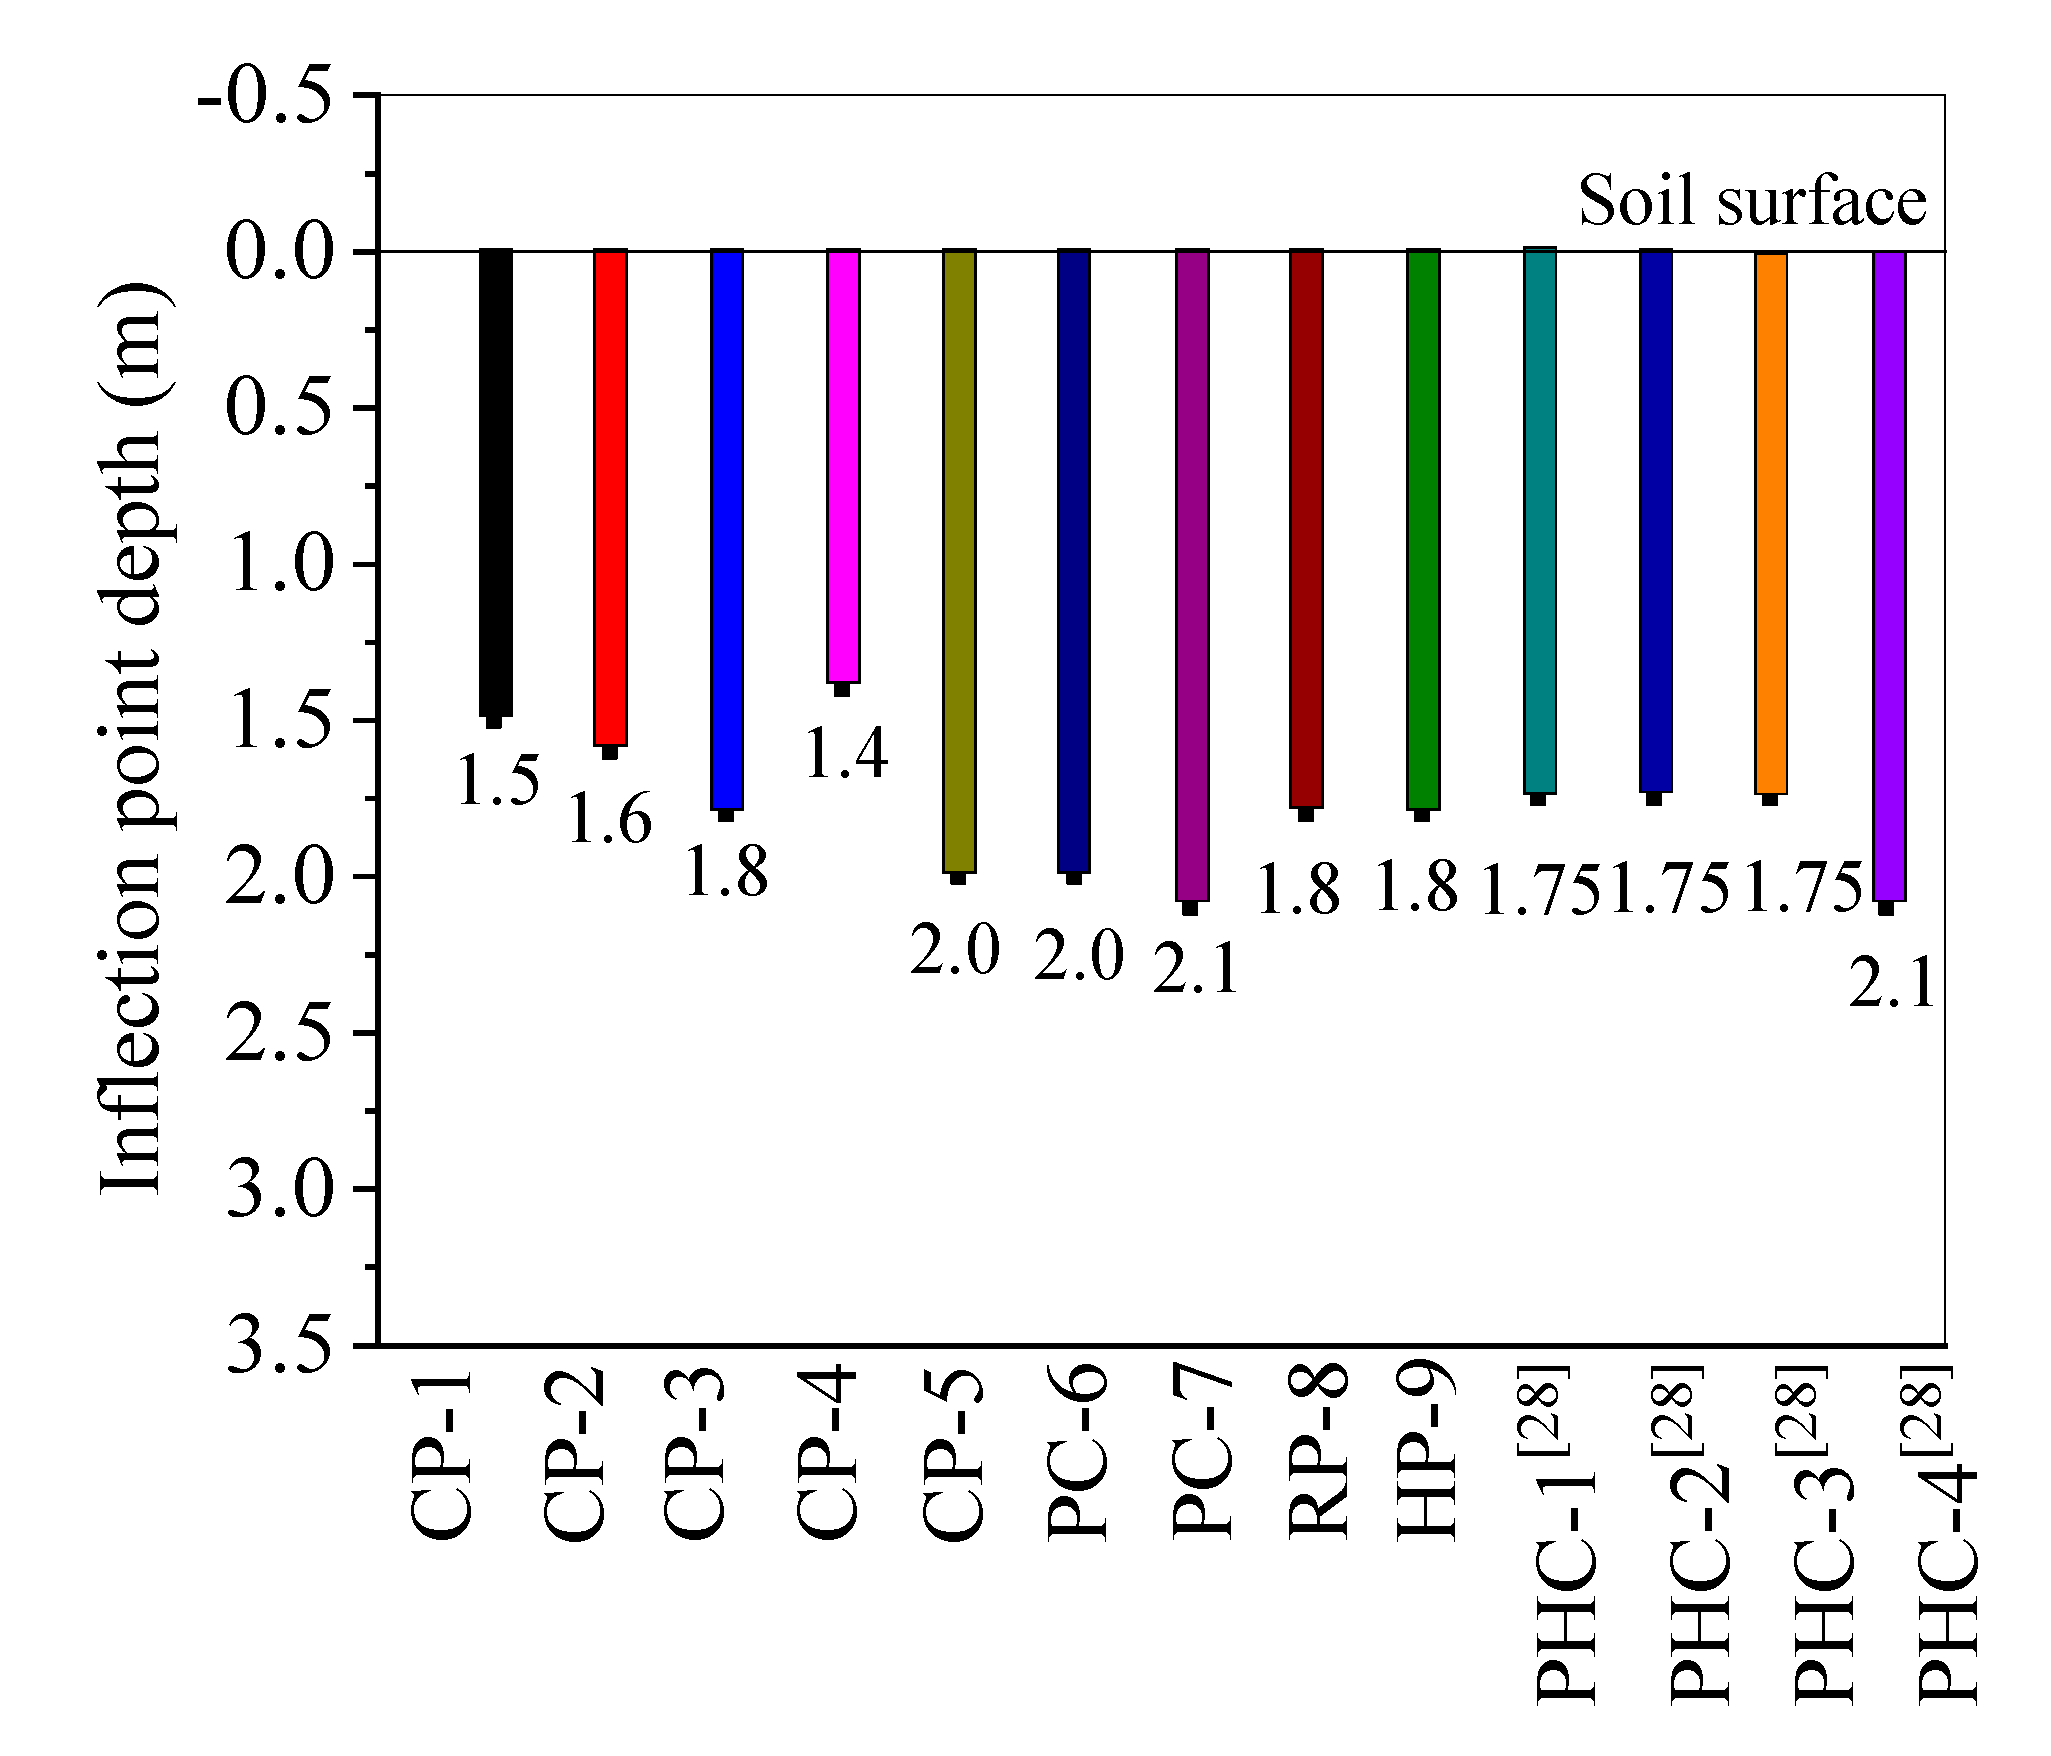
The inflection point of pile deformations shifted deeper with the increase of reinforcement ratio, buried pile depth and prestressing level, which increased the effective length and horizontal deformation capacity of the pile. The deformation inflection point of the PHC pipe piles was at a deeper buried depth as compared to the reinforced concrete piles.
(3)
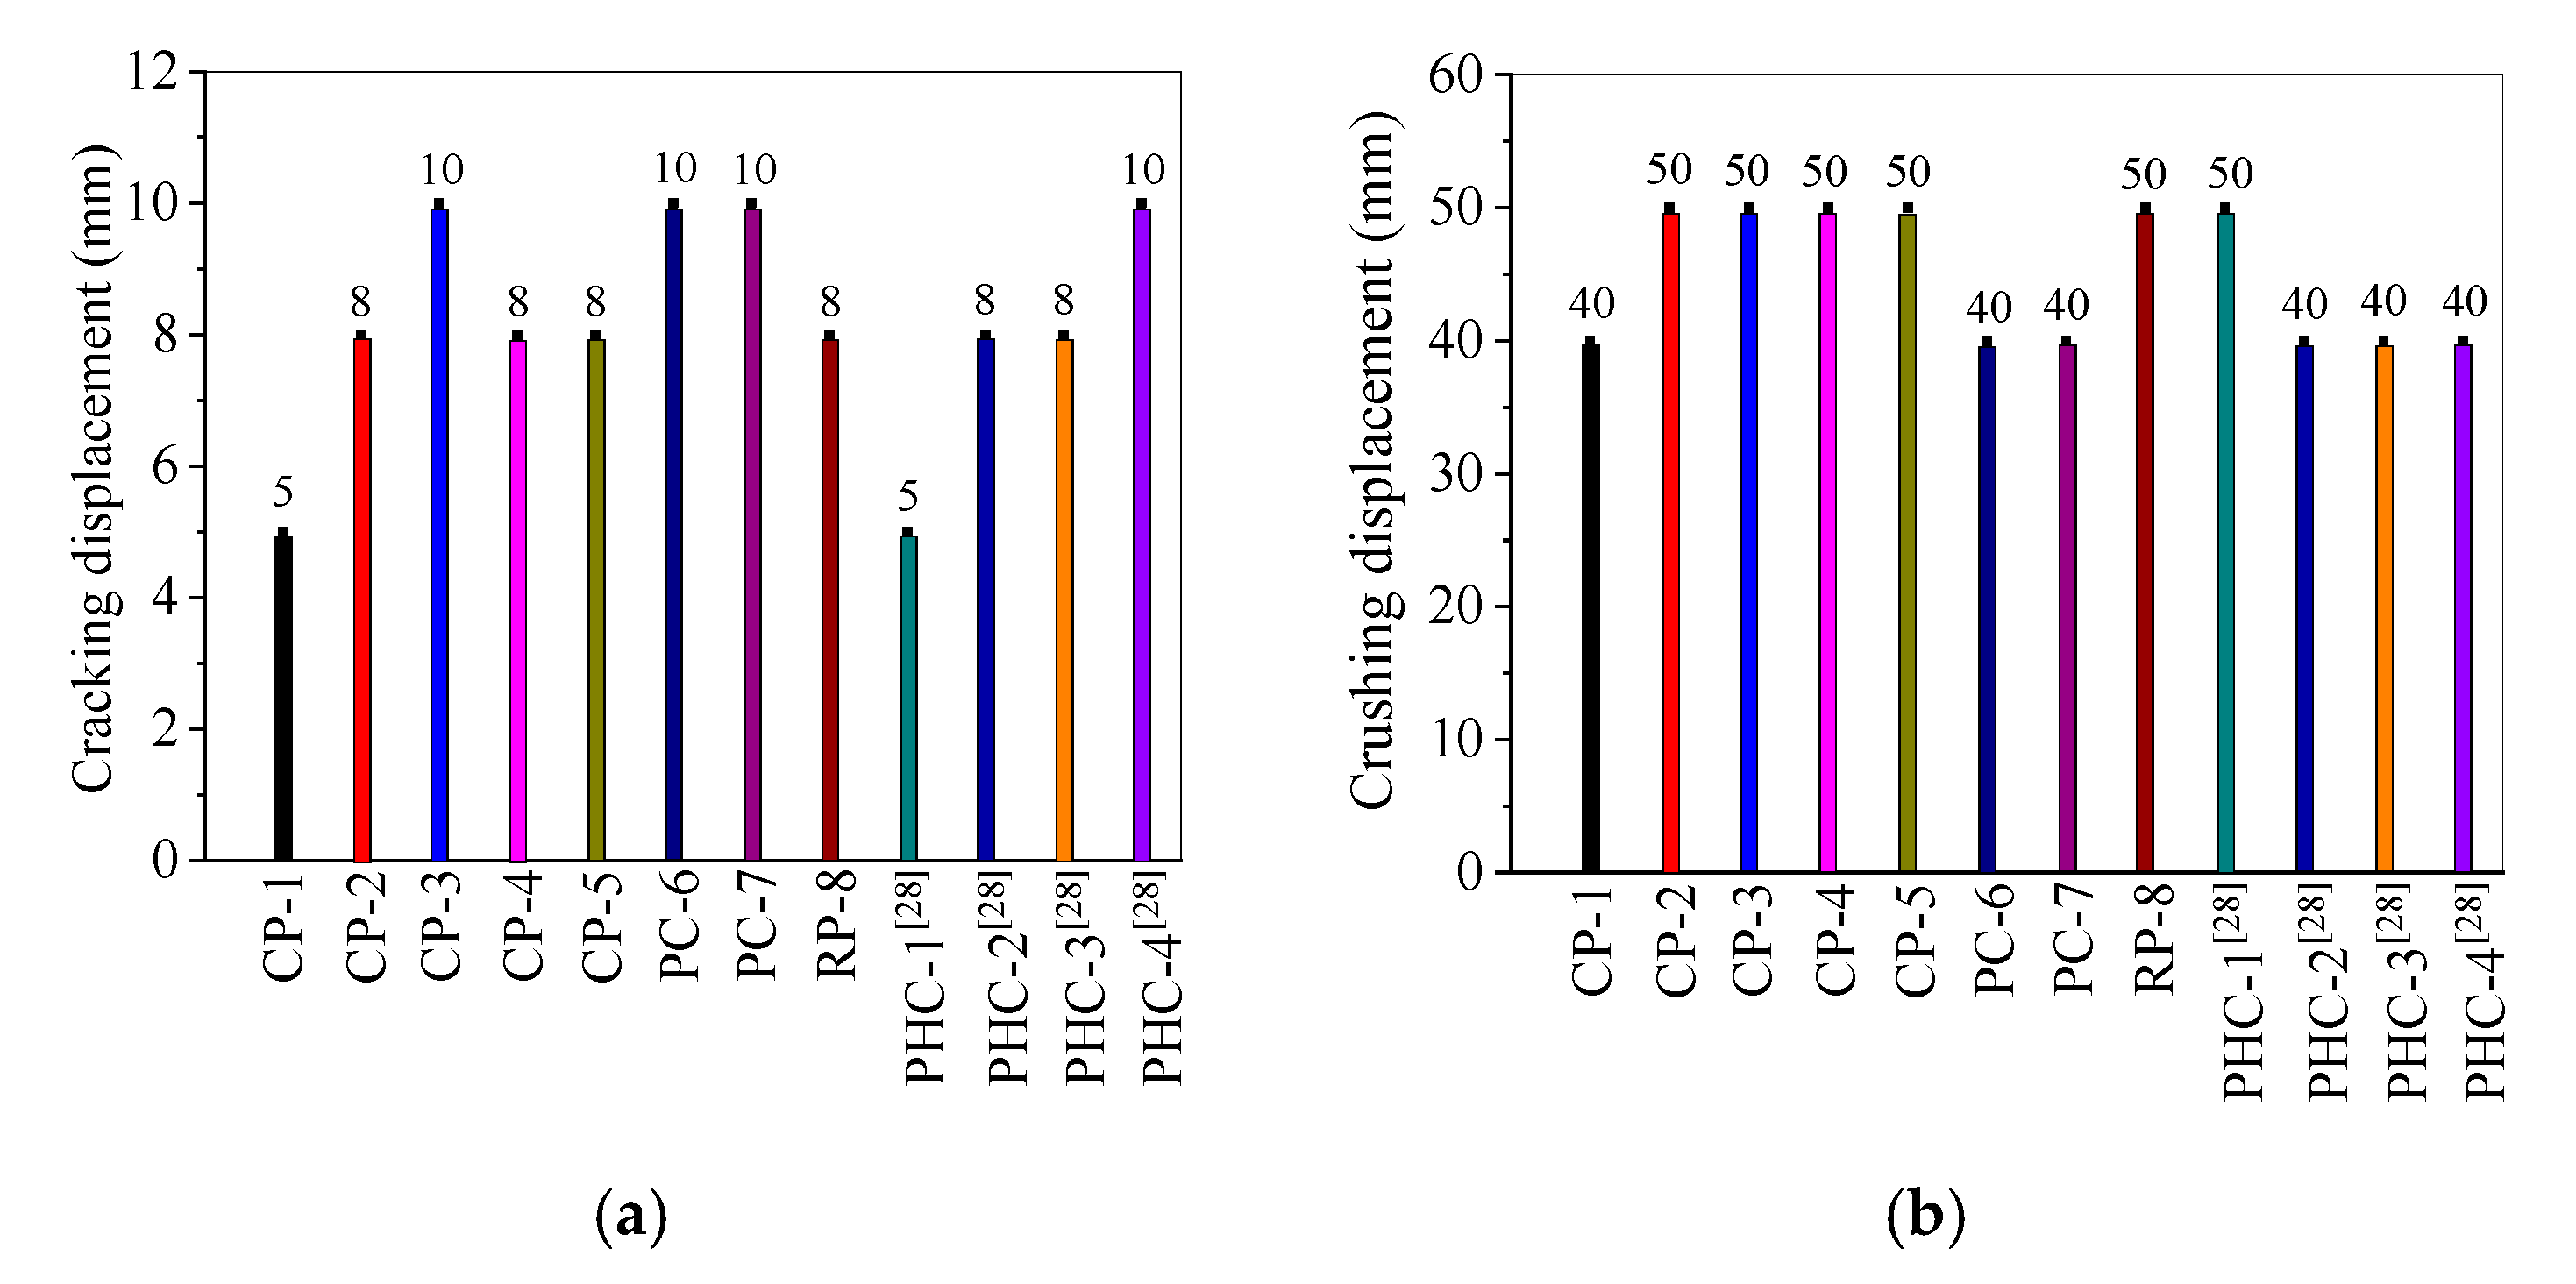
The crack resistance of concrete piles was improved with the increase of reinforcement ratio and prestressing level, which is advantageous for the crack resistance design of the reinforced concrete, prestressed and PHC pipe pile foundations in IAJBs. The effect of the larger reinforcement ratio and prestressing level on the concrete crushing was insignificant.
(4)
The hysteresis area of the H-shaped steel pile was larger than the concrete pile which demonstrated a greater energy dissipation capacity. Moreover, the pile foundation with larger buried depth, prestressing level and cross-section had a better energy dissipation capacity.
(5)
The pile with larger bearing ratio can sustain more bearing capacity whereas the surrounding soil may be subject to larger loads.
(6)
The seismic design criteria of three-stage seismic fortification and five damage levels of the concrete piles can be used as a design reference for IAJBs. Currently, considering that the pile foundations are susceptible to earthquake damage, studies on the restoration and reinforcement of pile foundations do not go into sufficient detail following earthquake events.

Author Contributions

All authors substantially contributed to this work. Y.S. designed and fabricated the pile model. X.L. and Y.S. designed the experiment. A.J. and Y.S. performed the experiments and analysis. Y.S. wrote the paper. F.H., A.J. and B.C. revised and finalized the paper. All authors helped with the writing of the paper. All authors have read and agreed to the published version of the manuscript.

Funding

This research was funded by the National Natural Science Foundation of China with Grant Numbers 51578161, and by the Fuzhou Technology Bureau with Grant Number 2018-G-63.

Acknowledgments

This project was supported by National Natural Science Foundation of China with Grant Numbers 51578161, and by the Fuzhou Technology Bureau with Grant Number 2018-G-63. The writers also thank the Sustainable and Innovative Bridge Engineering Research Center of Fujian Province University.

Conflicts of Interest

The authors declare no conflict of interest.

References

  1. Erhan, S.; Diclell, M. Effect of dynamic soil–bridge interaction modeling assumptions on the calculated seismic response of integral bridges. Soil Dyn. Earthq. Eng. 2014, 66, 42–55. [Google Scholar] [CrossRef]
  2. Peric, D.; Miletic, M.; Shah, B.R.; Esmaeily, A.; Wang, H. Thermally Induced Soil Structure Interaction in the Existing Integral Bridge. Eng. Struct. 2016, 106, 484–494. [Google Scholar] [CrossRef]
  3. Cheng, J.F.; Luo, X.F.; Zhuang, Y.Z.; Xu, L.; Luo, X.Y. Experimental Study on Dynamic Response of Characteristics of RPC and RC Micro Piles in SAJBs. Appl. Sci. 2019, 9, 2644. [Google Scholar] [CrossRef] [Green Version]
  4. Chen, B.C.; Zhuang, Y.Z.; Huang, F.Y.; Briseghella, B. Jointless Bridges, 2nd ed.; China Communication Press: Beijing, China, 2019. [Google Scholar]
  5. Su, D.; Huang, J.J.; Yan, W.M. Parametric Investigation on the Responses of Laterally Loaded Piles in Overconsolidated Clay Using Nondimensional Solutions Addressing Nonlinear Soil-Pile Interaction. Comput. Geotech. 2018, 96, 203–214. [Google Scholar] [CrossRef]
  6. Arsoy, S.; Duncan, J.M.; Barker, R.M. Performance of Piles Supporting Integral Bridges. J. Transp. Res. Board 2002, 1808, 162–167. [Google Scholar] [CrossRef]
  7. Huang, F.Y.; Shan, Y.L.; Chen, G.D.; Lin, Y.W.; Tabatabai, H.; Briseghella, B. Experiment on Interaction of Abutment, Steel H-pile and Soil in Integral Abutment Jonitless Bridges (IAJBs) under Low-Cycle Pseudo-Static Displacement Loads. Appl. Sci. 2020, 10, 1358. [Google Scholar] [CrossRef] [Green Version]
  8. Kalaycı, E.; Civjan, S.A.; Breña, S.F.; Allen, C.A. Load Testing and Modeling of Two Integral Abutment Bridges in Vermont, US. Struct. Eng. Int. 2011, 21, 181–188. [Google Scholar] [CrossRef]
  9. Civjan, S.A.; Bonczar, C.; Brena, S.F.; DeJong, J.; Crovo, D. Integral Abutment Bridge Behavior: Parametric Analysis of a Massachusetts Bridge. J. Bridge Eng. 2007, 12, 64–71. [Google Scholar] [CrossRef]
  10. Sherafati, A.; Azizinamini, A. Flexible Pile Head in Jointless Bridges: Experimental Investigation. J. Bridge Eng. 2014, 20, 04014071-1–04014071-12. [Google Scholar] [CrossRef]
  11. Lafave, J.M.; Fahnestock, L.A.; Jarrett, M.; Wright, B.; Riddle, J.; Svatora, J. Numerical Simulations and Field Monitoring of Integral Abutment Bridges. Struct. Congress 2015, 561–572. [Google Scholar] [CrossRef]
  12. Xiao, Y.; Chen, L. Behavior of Model Steel H-Pile-to-Pile-Cap Connections. J. Constr. Steel Res. 2013, 80, 53–162. [Google Scholar] [CrossRef]
  13. Karalar, M.; Dicleli, M. Fatigue in Jointless Bridge H-piles under Axial Load and Thermal Movements. J. Constr. Steel Res. 2018, 147, 504–522. [Google Scholar] [CrossRef]
  14. Far, N.E.; Maleki, S.; Barghian, M. Design of Integral Abutment Bridges for Combined Thermal and Seismic Loads. Earthq. Struct. 2015, 9, 415–430. [Google Scholar] [CrossRef]
  15. White, H.; Petursson, H.; Collin, P. Integral Abutment Bridges: The European Way. Pract. Period. Struct. Des. Constr. 2010, 15, 201–208. [Google Scholar] [CrossRef]
  16. Chen, B.C.; Fu, C.; Zhuang, Y.Z.; Briseghella, B. Application Status and Development Strategies of Jointless Bridge in China. J. China Foreign Highw. 2018, 38, 87–95. (In Chinese) [Google Scholar]
  17. Kong, B.; Cai, C.S.; Zhang, Y. Parametric Study of an Integral Abutment Bridge Supported by Prestressed Precast Concrete Piles. Eng. Struct. 2016, 120, 37–48. [Google Scholar] [CrossRef]
  18. Kong, B.; Cai, C.S.; Kong, X. Field Monitoring Study of An Integral Abutment Bridge Supported by Prestressed Precast Concrete Piles on Soft Soils. Eng. Struct. 2015, 104, 18–31. [Google Scholar] [CrossRef]
  19. Gama, D.; Almeida, J.F. Concrete Integral Abutment Bridges with Reinforced Concrete Piles. Struct. Concr. 2014, 15, 292–304. [Google Scholar] [CrossRef]
  20. Kamel, M.R.; Benak, J.V.; Tadros, M.K. Application of Precast, Prestressed Concrete Piles in Integral Abutment Bridges. In Proceedings of the Fourth International Bridge Engineering Conference, San Francisco, CA, USA, 28–30 August 1995; pp. 146–157. [Google Scholar]
  21. Chen, B.C.; Luo, X.Y.; Huang, F.Y.; Dong, R.; Xue, J.Q. Displacement-Based Simplified Calculation for Pile-Soil Interaction under Reciprocating Low-Cycle Pseudo-Static Loads. J. Test. Eval. 2019, 49. [Google Scholar] [CrossRef]
  22. Luo, X.Y.; Huang, F.Y.; Zhuang, Y.Z.; Wu, S.W.; Qian, H.M. Modified Calculations of Lateral Displacement and Soil Pressure of Pile Considering Pile—Soil Interaction under Cyclic Loads. J. Test. Eval. 2019, 49. [Google Scholar] [CrossRef]
  23. Burdette, E.G.; Howard, S.C.; Ingram, E.E.; David, W. Behavior of prestressed concrete piles supporting integral abutment. In Proceedings of the 2004 Structures Congress: Building on the Past, Securing the Future, Nashville, TN, USA, 22–26 May 2004; pp. 213–218. [Google Scholar]
  24. Harries, K.A.; Petrou, M.F. Behavior of Precast, Prestressed Concrete Pile to Cast-in- Place Pile Cap Connections. PCI J. 2001, 46, 82–92. [Google Scholar] [CrossRef]
  25. Burdette, E.G.; Tidwell, J.B.; Ingram, E.E.; Goodpasture, D.W.; Howard, S.C.; Wasserman, E.P.; Deatherage, J.H. Lateral Load Tests on Prestressed Concrete Piles Supporting Integral Abutments. PCI J. 2004, 49, 70–77. [Google Scholar] [CrossRef]
  26. Abendroth, R.E.; Greimann, L.F.; LaViolette, M.D. An Integral Abutment Bridge with Precast Concrete Piles; Iowa State University: Ames, IA, USA, 2007. [Google Scholar]
  27. Hong, J.X.; Peng, D.W. Design of Shangban integral abutment bridge—Engineering application of jointless bridge. Fujian Archit. Constr. 2004, 5, 50–52. (In Chinese) [Google Scholar]
  28. Huang, F.Y.; Wu, S.W.; Luo, X.Y.; Chen, B.C.; Lin, Y.W. Pseudo-static Test on Mechanic Behavior of PHC Piles with Soil-Pile Interaction. Eng. Struct. 2018, 171, 992–1006. [Google Scholar] [CrossRef]
  29. Rollins, K.; Sparks, A.; Peterson, K. Lateral Load Capacity and Passive Resistance of Full-Scale Pile Group and Cap. Transportation Research Record. J. Transp. Res. Board 2000, 1736, 24–32. [Google Scholar] [CrossRef]
  30. Rollins, K.M.; Gerber, T.M.; Lane, J.D.; Ashford, S.A. Lateral Resistance of a Full-Scale Pile Group in Liquefied Sand. J. Geotech. Geoenviron. Eng. 2005, 131, 115–125. [Google Scholar] [CrossRef]
  31. Nimityongskul, N.; Kawamata, Y.; Rayamajhi, D.; Ashford, S.A. Full-Scale Tests on Effects of Slope on Lateral Capacity of Piles Installed in Cohesive Soils. J. Geotech. Geoenviron. Eng. 2018, 144, 04017103. [Google Scholar] [CrossRef]
  32. ASTM D2487–17e1. Standard Practice for Classification of Soils for Engineering Purposes; (Unified Soil Classification System); ASTM International: West Conshohocken, PA, USA, 2017. [Google Scholar]
  33. Zhao, M.H.; Xiao, Y.; Chen, C.F.; He, W. Analysis of Deformation on Soft Subsoil Around Bridge Abutment Considering Soil Creep Property. China J. Highw. Transp. 2006, 19, 56–61. (In Chinese) [Google Scholar]
  34. Lou, M.L.; Wang, W.J.; Zhu, T.; Mang, H.C. Soil lateral boundary effect in shaking table model test of soil-structure system. Earthq. Eng. Eng. Dyn. 2000, 20, 30–36. [Google Scholar]
  35. AASHTO. Guide Specifications for LRFD Seismic Bridge Design, 7th ed.; American Association of State Highway and Transportation Officials: Washington, DC, USA, 2014. [Google Scholar]
Figure 1. Specimens for testing.
Applsci 10 03406 g001
Figure 2. Fabrication of the specimens (unit: mm). (a) Construction of the circular piles. (b) Construction of the rectangular pile. (c) Reinforcement detailing of circular specimens. (d) Reinforcements of circular piles.
Applsci 10 03406 g002
Figure 3. Soil box and test setup layout. (a) Soil box. (b) Top view of specimen and soil box. (c) Elevation view.
Applsci 10 03406 g003
Figure 4. The soil filling process. (a) Installation of a specimen. (b) Placement and details of a specimen. (c) Details of the pile base. (d) Fully filled soil box.
Applsci 10 03406 g004
Figure 5. Sensor layouts of specimens (unit: mm). (a) Strain gauges details. (b) Soil pressure cells details. (c) linear variable displacement transducers (LVDTs) details.
Applsci 10 03406 g005
Figure 6. Sensor layouts of specimens (unit: mm). (a) CP-4. (b) CP-5.
Applsci 10 03406 g006
Figure 7. (a) Overall view of the test setup. (b) Detail of the test setup. (c) Loading protocol of the test.
Applsci 10 03406 g007
Figure 8. Specimens’ failure modes. (a) CP-1 specimen. (b) CP-2 specimen. (c) CP-3 specimen. (d) CP-4 specimen. (e) CP-5 specimen. (f) PC-6 specimen. (g) PC-7 specimen. (h) RP-8 specimen. (i) HP-9 specimen.
Applsci 10 03406 g008
Figure 9. Deformed shapes of all specimens. (a) The effect of different reinforcement ratio. (b) The effect of different buried pile depth. (c) The effect of different prestressing level.
Applsci 10 03406 g009
Figure 10. Inflection point depth of the specimens.
Applsci 10 03406 g010
Figure 11. Strain distribution of CP-2 specimen. (a) Compressive and tensile strain distributions. (b) Tensile strain versus loading history. (c) Compressive strain versus loading history.
Applsci 10 03406 g011
Figure 12. Strain distribution of RP-4 specimen. (a) Compressive and tensile strain distributions. (b) Tensile strain versus loading history. (c) Compressive strain versus loading history.
Applsci 10 03406 g012
Figure 13. Strain distribution of HP-5 specimen. (a) Compressive and tensile strain distributions. (b) Tensile strain versus loading history. (c) Compressive strain versus loading history.
Applsci 10 03406 g013
Figure 14. Cracking and crushing displacements of the concrete specimens. (a) Cracking displacement. (b) Crushing displacement.
Applsci 10 03406 g014
Figure 15. Bending moment of specimens. (a) At 2 mm loading step. (b) At 5 mm loading step. (c) At 8 mm loading step. (d) At 10 mm loading step.
Applsci 10 03406 g015
Figure 16. Maximum moments of the piles at 10 mm loading step.
Applsci 10 03406 g016
Figure 17. Hysteresis and backbone curves. (a) Hysteresis loops of CP-2 specimen. (b) Hysteresis loops of CP-5 specimen. (c) Hysteresis loops of PC-6 specimen. (d) Hysteresis loops of RP-8 specimen. (e) Hysteresis loops of HP-9 specimen. (f) Backbone curves of all specimens.
Applsci 10 03406 g017
Figure 18. (a) Peak and (b) ultimate displacements of the piles obtained from the backbone curves.
Applsci 10 03406 g018
Figure 19. Typical force-displacement curve of a pile with its failure process.
Applsci 10 03406 g019
Figure 20. Seismic design criteria of pile foundation.
Applsci 10 03406 g020
Table 1. Similarity coefficients.
QuantitiesScalesScaled RelationshipsScaled Ratios
Geometrical propertiesLength/LSL[L]SL = 0.31
Modulus/ESE[E]SE = 1.0
Density/ρSρ[ρ]Sρ = 3.23
Stress/σSσ[E]Sσ = SESε = 1.0
Strain/εSε--Sε = 1.0
Deformation/δSL[L]SL = 0.31
Dynamic characteristicsAcceleration/aSa[Eρ−1L−1]Sa1 = 1.0
Acceleration/gSg--Sg = 1.0
Time/TST[E−0.5ρ0.5L]ST = 0.56
Frequency/ωSω[E0.5ρ−0.5L−1]Sω = 1/ST = 1.79
Internal forceBending moment/MSM[EL3]SM = 0.03
Shear force/FSF[EL2]SF = 0.10
Inertia moment/ISI[L4]SI = SL4 = 0.009
SL is geometric similarity ratio; SE is elasticity modulus ratio; Sρ is density similarity ratio; Sσ is stress ratio; Sε is strain ratio; Sa is acceleration ratio; Sg is gravimetric acceleration ratio; ST is time ratio; Sω is frequency ratio; SM is bending moment ratio; SF is shear force ratio; SI is inertia moment ratio.
Table 2. Design parameters of all specimens.
SpecimenSection Type (Abbr.)Material TypeD or W (mm)H (m)rP (kN)EI (kN·m2)
CP-1Circular section (CP)C40 Concrete1553.500.80%0.0920.40
CP-21.60%0.0920.40
CP-33.20%0.0920.40
CP-43.19(−2D)1.60%0.0920.40
CP-53.81(+2D)1.60%0.0920.40
PC-6Circular section (PC)3.501.60%45.0920.40
PC-71.60%90.0920.40
RP-8Rectangular (RP)1.60%0.02187.25
HP-9H section (HP)Q235 steel-0.0777.09
PHC-1 [28]Circular section (PHC)C80 Concrete2.751.50%0.0859.7
PHC-2 [28]1.50%60.75859.7
PHC-3 [28]1.50%121.5859.7
PHC-4 [28]2.50%121.5818.4
I and EI are the moment of inertia and the flexural rigidity of the specimens, respectively.
Table 3. Sand properties.
Water Content ω (%)Density ρ (g/cm3)Porosity Ratio eInternal Friction Angle Φ (°)Compression Modulus (MPa)Average SPT Blow Count
4.61.900.593512.911
Table 4. Comparison of concrete crushing locations for all the specimens.
SpecimenCP-1CP-2CP-3CP-4CP-5PC-6PC-7
Lci3.5 D3.6 D5.4 D3.4 D4.3 D4.4 D4.6 D
Lci/Lc1100%103%154%97%123%126%131%
SpecimenRP-8HP-9PHC-1 [28]PHC-2 [28]PHC-3 [28]PHC-4 [28]
Lci6.2 D--4.5 D4.2 D5.2 D7.7 D
Lci/Lc1177%--129%120%149%220%
Table 5. Bending moments and bearing ratios of specimens at 0.7 m of buried depth.
Specimen5 mm Loading8 mm Loading10 mm Loading15 mm Loading
M (kN·m)M0 (kN·m)v5M (kN·m)M0 (kN·m)v8M (kN·m)M0 (kN·m)v10M (kN·m)M0 (kN·m)v15
CP-11.352.3258%1.822.9362%2.203.6560%2.524.7054%
CP-20.912.3539%1.702.9757%2.413.5169%2.995.4555%
CP-30.752.4930%1.143.2535%2.444.1559%3.325.8856%
CP-40.852.0541%1.53.050%1.73.5548%2.04.445%
CP-51.72.5766%2.34.0157%3.04.5566%3.675.863%
PC-60.861.5356%1.462.4260%1.913.1261%2.834.5063%
PC-70.571.0952%1.352.3657%1.913.3158%3.125.1660%
RP-82.234.3152%4.125.9969%5.216.9675%6.088.9568%
HP-91.403.0845%2.074.6844%2.656.1043%3.928.9843%
PHC-11.532.2568%2.223.2069%2.193.6260%2.914.7362%
PHC-21.642.5764%1.764.5339%2.054.8143%3.086.0451%
PHC-31.923.3767%2.315.1245%2.535.6845%3.196.4849%
PHC-41.101.7563%1.594.6035%1.975.7234%2.565.3448%

