Abstract
The polymer processing industry is paying more attention to biodegradable materials synthesized from renewable sources. One of the most popular of them is polylactide (PLA). Except the material from which a given product is made, particularly important is the process of manufacturing a polymer material, processing, use by the consumer, and finally, recycling it. Neither of these steps is indifferent to the environment. The processing of polymers can often lead to material degradation, which affects the properties of the material and leads to the generation of substantial amounts of post-production waste that cannot be reused by processors. The aim of this work is to evaluate selected properties of PLA subjected to the extrusion process under variable extrusion conditions. This is important due to the large losses of material and energy resulting from the extrusion of biodegradable polymers under poorly selected processing conditions, which, apart from the economic effects, has a negative impact on the environment. The research proved that both the temperature and the structure of the plasticizing system as well as the rotational speed of the screws affect the mechanical properties of the final product. For PLA optimization, this process will directly contribute to the improvement of the PLA processing process, and indirectly help to act for the benefit of the environment by reducing the consumption of energy, raw materials, and the amount of post-production waste. The obtained results allowed for the selection of appropriate parameters depending on the expectations regarding the properties of the final product. The conducted research will help to optimize processing processes and reduce the consumption of raw materials, which in the future will also affect the environment.
1. Introduction
The production which increased polymers and their deposition in landfills without the possibility of processing causes adverse effects on the environment. For several years, there has been growing interest in this aspect also at the political level, where new directives are aimed at limiting the production of synthetic plastics [1]. The current trend is to reduce the production and consumption of copious amounts of plastic. In addition, many activities are based on the recycling of already manufactured polymer materials. Fossil raw materials from which traditional polymers such as polyethylene (PE), polyethylene terephthalate (PET), polypropylene (PP) or polystyrene (PS) are made, may soon be depleted [2,3]. Subsequently, products made of polymer materials are often deposited in landfills and in the oceans [4]. This is due to the difficult decomposition of polymeric materials having a very stable structure [5,6].
Thus, new approaches aimed to produce a product with less waste and more environmentally friendly. For this purpose, biodegradable materials are obtained that are more environmentally friendly. Some of them are obtained from plants such as corn, sugarcane, and sugar beet, which are starchy materials [7,8]. These types of biodegradable materials are environmentally friendly due to the source from which they are produced, but also due to decomposition under the influence of microorganisms, humidity, temperature, and ambient pH. Moreover, bioplastics on the market have properties comparable to conventionally used petroleum-based plastics, which is why they have become exceedingly popular [3,9,10].
An example of such a biopolymer is polylactide (PLA), which can be obtained from starch-rich renewable raw materials such as corn or sugar cane [3,11]. Its main chain is formed by lactic acid monomers [12]. Despite the high price compared to conventional materials, it is currently one of the most popular and cheapest among biodegradable plastics. PLA can be processed on diverse types of processing equipment, such as extruder and injection molding machines [1,13,14].
Properties of PLA depend on the molecular weight and degree of crystallinity of this polymer. Characteristic features include thermoplasticity, high hardness, and thermal properties [15]. Apart from favorable properties, it is characterized by high stiffness and brittleness, and is a hydrophobic material [16]. The disadvantages are also low flexibility and poor barrier properties, which means that the use of this material on the packaging market is limited [17]. Like many conventional materials, PLA needs to be dried prior to processing to prevent the damaging effects of water molecules as much as possible. The presence of water molecules accelerates the degradation of the material by engaging between the chains of the polymer material, which leads to a reduction in the glass transition temperature and deterioration of mechanical properties [18]. The degradation process is accompanied by a change in molar masses. The degradation that occurs leads to a random main chain disruption reaction, followed by a rapid reduction of the molar mass [19,20]. Another effect of the presence of water molecules is the cleavage of hydrolytic bonds. This action reduces the molecular weight of the material and causes the formation of cracks [21,22,23].
PLA is used in many industries. At first, it was used in the medical sector, among others, to produce implants, prostheses, and resorbable sutures, for tissue reconstruction or as a carrier for drugs. Numerous medical applications are possible due to its biocompatibility with tissues [16,24,25]. Currently, PLA has been used, among others, as an insulation, construction, and packaging material, to 3D printing, constituting an environmentally friendly alternative instead of PET or PE or PS [26,27].
PLA as a biopolymer biodegrades within several months. The degradation product is carbon dioxide, methane, water, and lactic acid, which is metabolically harmless to living organisms [28,29]. In addition, studies were conducted showing the improvement of soil properties after PLA decomposition [3,30]. Additionally, researchers have shown a positive effect of the presence of PLA deposited in the soil on plants intended for biomass production, such as rapeseed, giant miscanthus or basket willow [31].
Replacing conventional plastics using petrochemical raw materials with PLA leads to net savings in non-renewable energy consumption of 70–220 GJ/(ha/year) and a reduction of net greenhouse gas emissions by 3–17 Mg CO2 eq/(ha/year) [32]. It is about 60% less greenhouse gases produced, and 50% less renewable energy used in relation to conventional materials [33].
As a result of the processing of plastics in poorly selected processing conditions, undesirable degradation of the polymer may occur [21,34]. It is necessary to explain the influence of both the process temperature and the design of the plasticizing system and the rotational speed of the screw, which determine the time stay of PLA in the plasticizing system. The evaluation of the listed parameters of the extrusion process in relation to unmodified PLA is a valuable source of information for processors and allows to prevent the formation of post-production waste [35]. Industrial waste of homogeneous conventional plastics can be recycled easily, but with biodegradable plastics, it is often impossible [36].
In this work, we are checking the conditions of PLA extrusion, such as the structure of the plasticizing system, extrusion temperature and screw rotation speed, on the physical and thermal properties of the target material. The obtained results will make it possible to learn about the changes resulting from the operation of individual processing parameters and will allow for the reduction of raw material and energy losses during processing in the future. The obtained results are of particular importance to researchers and processors of polymer materials.
2. Materials and Methods
2.1. Materials
The material used for the tests was PLA LX175 granules (Total Corbion, Gorinchem, The Netherlands) with a density of 1.24 g/cm3 and a melt flow rate (MFR) of 6.0 g/10 min (210 °C/2.16 kg). Prior to the extruding, unprocessed PLA granulate was dried at a temperature of 80 °C for 6 h.
2.2. Extrusion
The extrusion process was conducted using a twin-screw extruder (Bühler BTSK 20/40D, Uzwil, Switzerland) with a screw diameter of 20 mm and a screw length of 790 mm. The following variables were used: (i) screw configuration; (ii) rotational speed of the plasticizing system, and (iii) temperature.
The extrusion process was conducted using a screw: (i) with a less demanding configuration containing two kneading and mixing zones (Figure 1a) or (ii) with a more demanding configuration with four kneading and mixing zones (Figure 1b). The configurations below are identified as configuration 1 and configuration 2, respectively.

Figure 1.
Scheme of the plasticizing system: (a) configuration 1 (two kneading and mixing zones); (b) configuration 2 (four kneading and mixing zones). The kneading and mixing zones are marked.
Three different temperatures of the plasticizing system were used: 210 °C, 230 °C or 250 °C (Table 1).

Table 1.
Summary of parameters of extrusion processes. Abbreviations: configuration 1—screw with two kneading and mixing zones; configuration 2—screw with four kneading and mixing zones.
The rotational speed of the plasticizing system was: 200 min−1, 400 min−1 or 600 min−1 (Table 1).
2.3. Melt Flow Rate, MFR
The melt flow rate (MFR) test was performed according to standard ISO:1133-1 [37] using a load plastometer (LMI 4003 Dynisco, Franklin, MA, USA). The analyses were conducted at a temperature of 210 °C under a piston load of 2.16 kg.
2.4. Gel Chromatography, GPC
The samples were prepared by dissolving in 1.5 mL of Tetrahydrofuran (THF) and then sonicated in an ultrasonic bath (Polsonic Sonic 05, Warszawa, Poland) for 60 min at 40 °C. The samples were left for 24 h at room temperature. The homogeneous solution was then filtered through 0.45 µm filters and subjected to GPC analysis.
Weight average molecular weight (Mw) measurements were made using a 1260 Infinity instrument (Agilent, Manchester, UK) equipped with a 10 µm Linear (2) 300 mm × 7.8 mm column. The samples were dissolved in tetrahydrofuran (THF). Measurement conditions: analysis time 15 min, eluent flow (THF) 1 mL/min, column temperature 35 °C, and detector temperature (RI) 35 °C. The calibration curve was made using polystyrene standards with molecular weights from 1000 to 3.5 million. The Polydispersity Index (PDI) was calculated. It is the ratio of the average molecular weight (Mw) and the number average molecular weight (Mn).
2.5. Differential Scanning Calorimetry, DSC
Differential scanning calorimeter (DSC) was performed with a calorimeter DSC1 (Mettler Toledo, Switzerland) calibrated with pure indium and zinc standards. The standard ISO 11357 (Parts 1–3) [38,39,40] was followed. Each sample weighing from 4.5 mg to 5.5 mg was placed in an aluminum crucible, and heated from 0 °C to 300 °C under a nitrogen atmosphere with a flow of 50 mL/min. The heating and cooling rate was 10 °C/min. Two heating scans were applied, after the first sample was cooled to 0 °C and re-heated from 0 °C to 300 °C. Before cooling and the second scan, the sample was kept at constant temperature for 3 min (before cooling at 300 °C, before heating at 0 °C). The inflection point of each glass transition was taken as the glass transition temperature (Tg). The crystallization and melting enthalpy were assessed from the integrated peaks. The following designations were adopted: Tm—melting temperature (°C), ΔHm—melting enthalpy (J/g), Tg—glass transition temperature (°C), Tcc—cold crystallization temperature (°C), ΔHcc—cold crystallization enthalpy (J/g), Tc—crystallization temperature (°C), and ΔHc—crystallization enthalpy (J/g).
3. Results
3.1. Melt Flow Rate, MFR
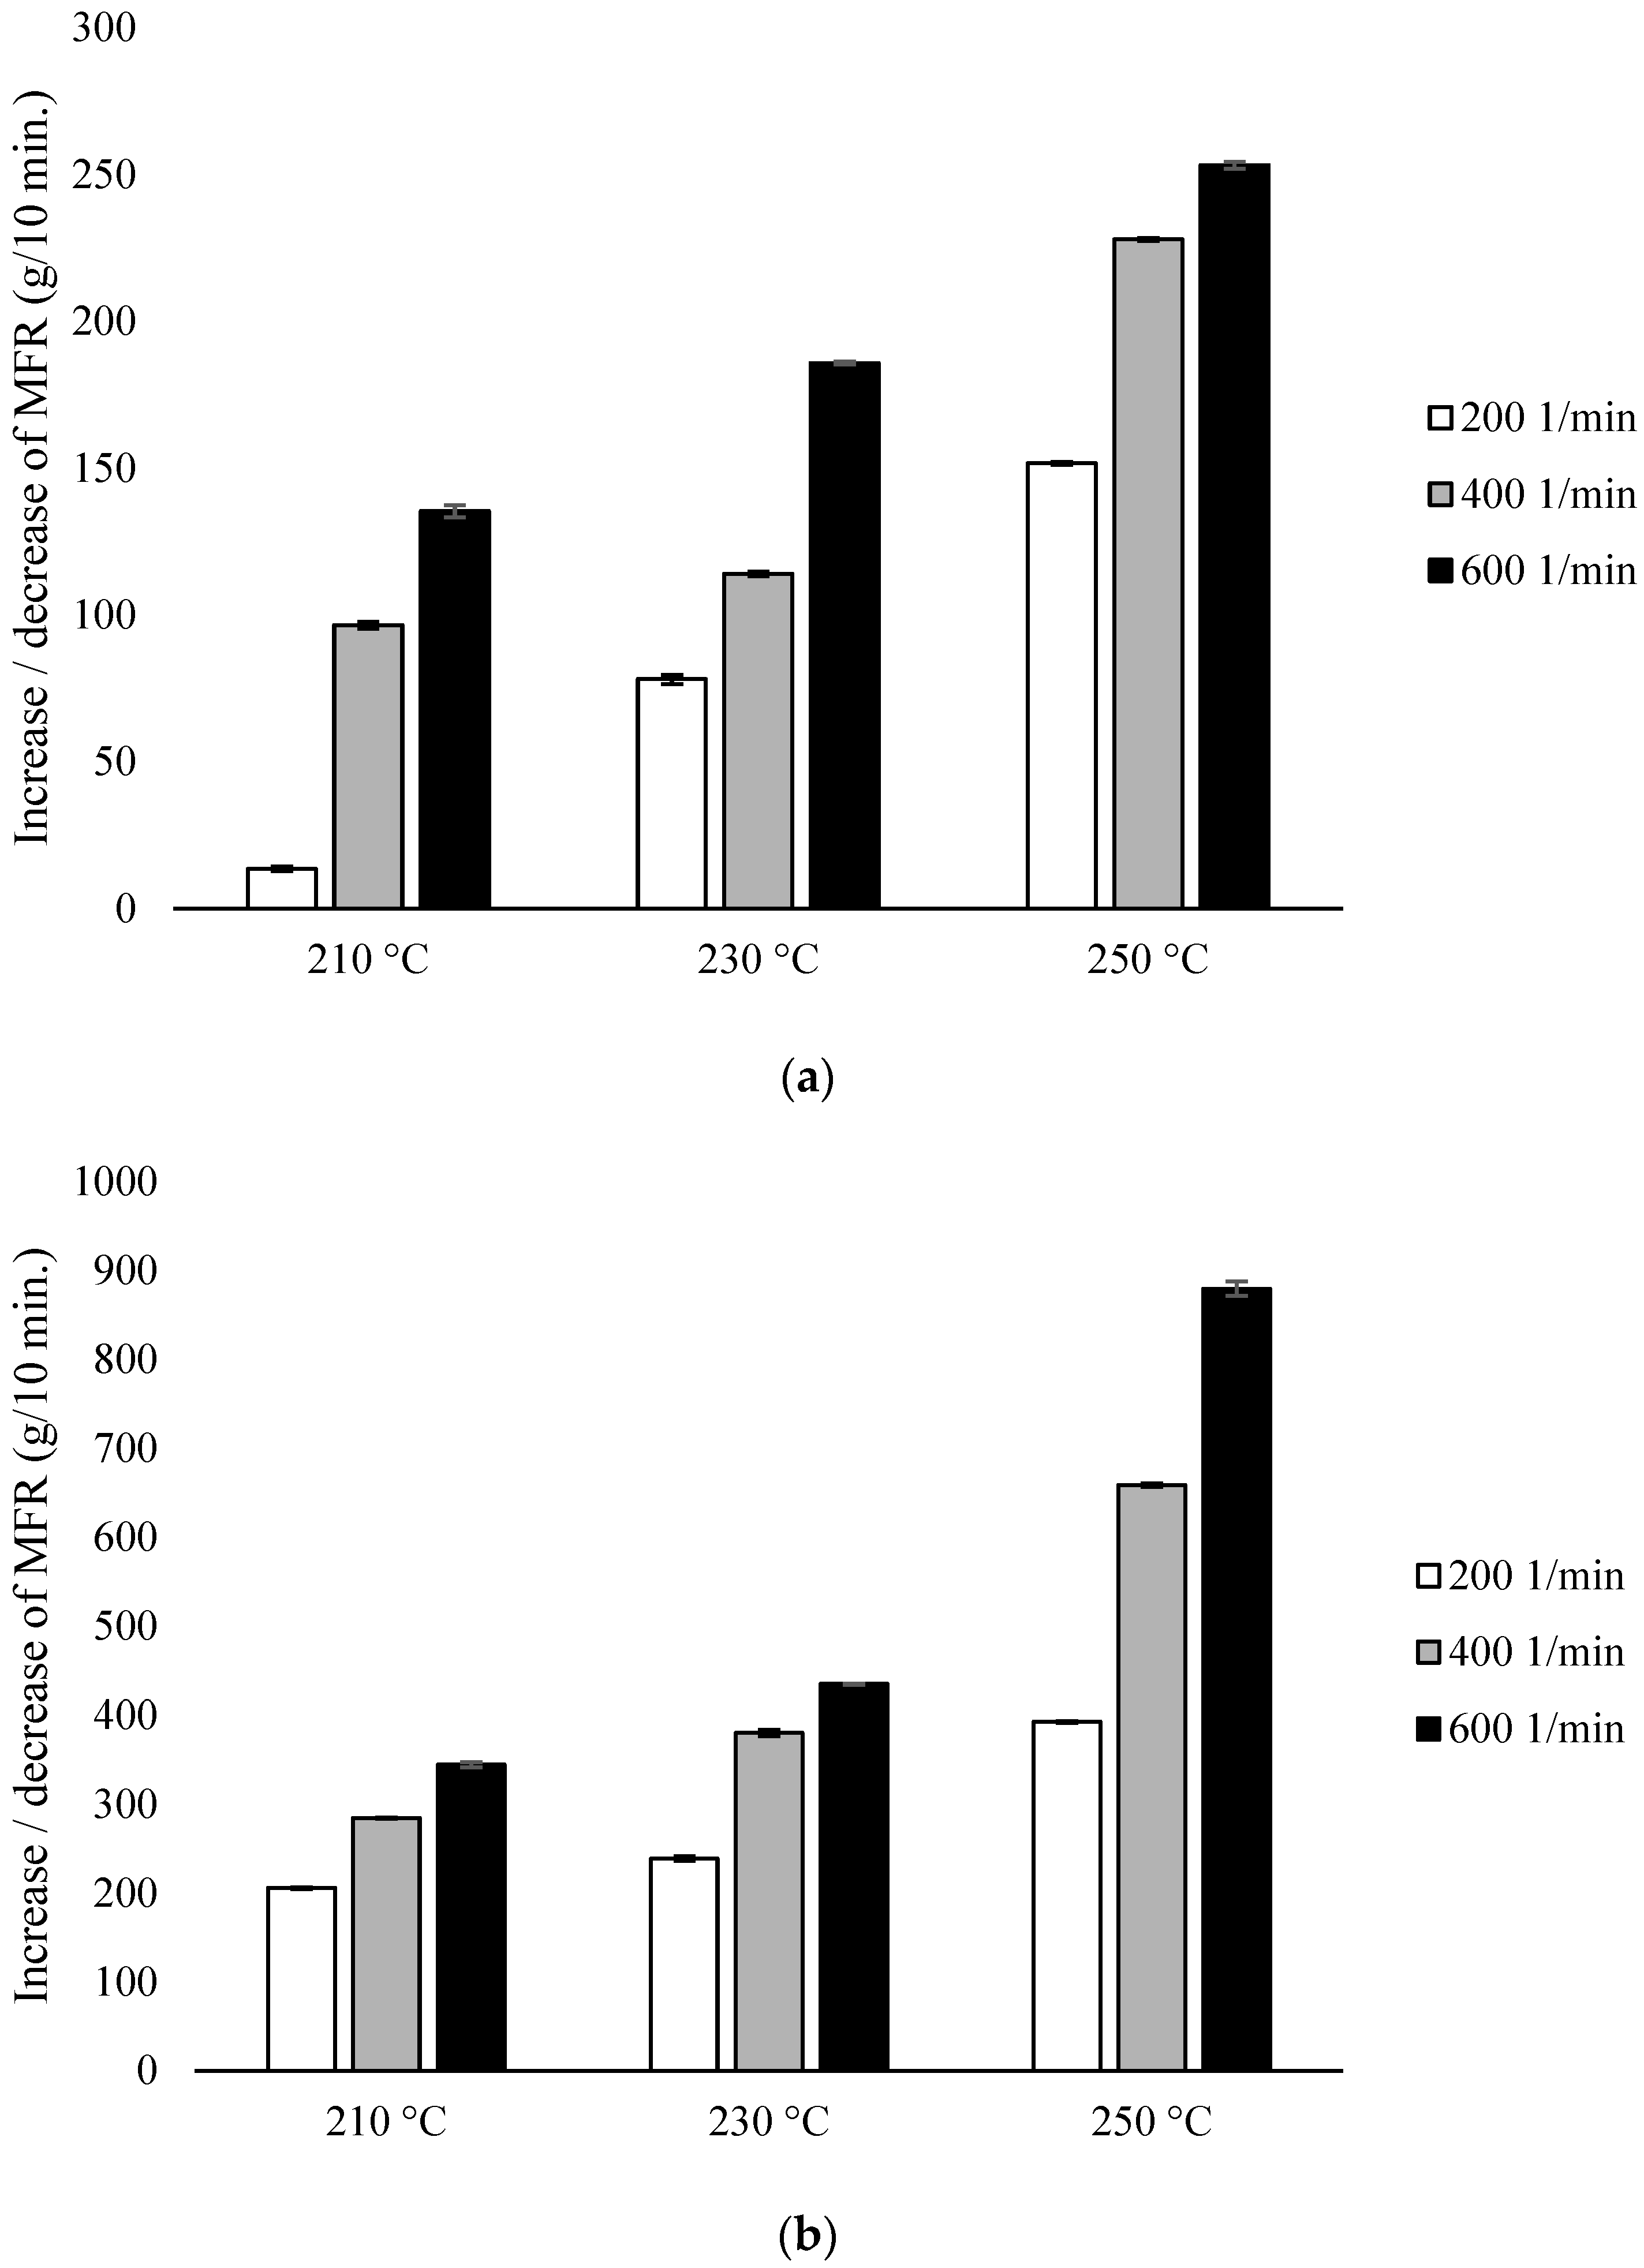
The MFR measurement showed an increase in the parameter value with an increase in the extrusion temperature and the rotational speed of the screw, as well as higher parameter values which were obtained for configuration 2 (range from 36.6 ± 0.11 g/10 min to 117.4 ± 0.96 g/10 min), compared to configuration 1 (range from 13.6 ± 0.09 g/10 min to 42.3 ± 0.15 g/10 min). The results were compared with unprocessed PLA for which the MFR was 11.98 g/10 min (Figure 2).
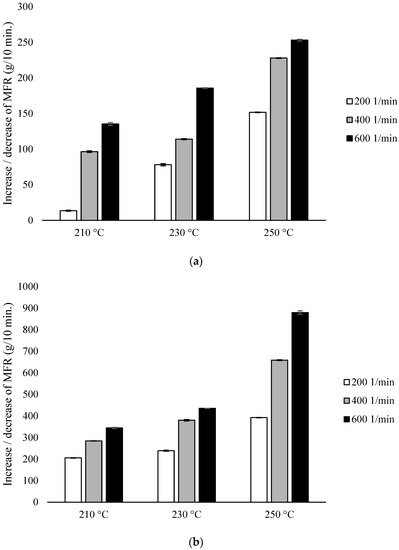
Figure 2.
Melt Flow Rate (MFR), difference % with non-extruded PLA: (a) configuration 1; (b) configuration 2. Abbreviations: as in Table 1.
With the participation of configuration 1, the lowest MFR value (increase by about 14% in relation to PLA not subjected to the extrusion process) was obtained after extrusion at the lowest temperature (210 °C) at the lowest of the applied rotational speeds (200 min−1). The highest MFR value (increase by over 250% in relation to PLA not subjected to the extrusion process) was obtained after extrusion at the highest temperature (250 °C) at the highest of the applied rotational speeds (600 min−1) (Figure 2a). For each of the temperatures, an increase in the MFR value was observed proportional to the increase in the rotational speed of the screw. The MFR value at individual rotational speeds of the screw increased with the temperature (Figure 2).
In the presence of configuration 2, greater differences from unprocessed PLA were noted. The lowest MFR value (over 200% increase in relation to PLA not subjected to the extrusion process) was obtained after extrusion at the lowest temperature (210 °C) at the lowest of the rotational speeds used (200 min−1). The highest MFR value (increase by over 800% in relation to PLA not subjected to the extrusion process) was obtained after extrusion at the highest temperature (250 °C) at the highest applied rotational speed (600 min−1) (Figure 2b).
3.2. Gel Chromatography, GPC
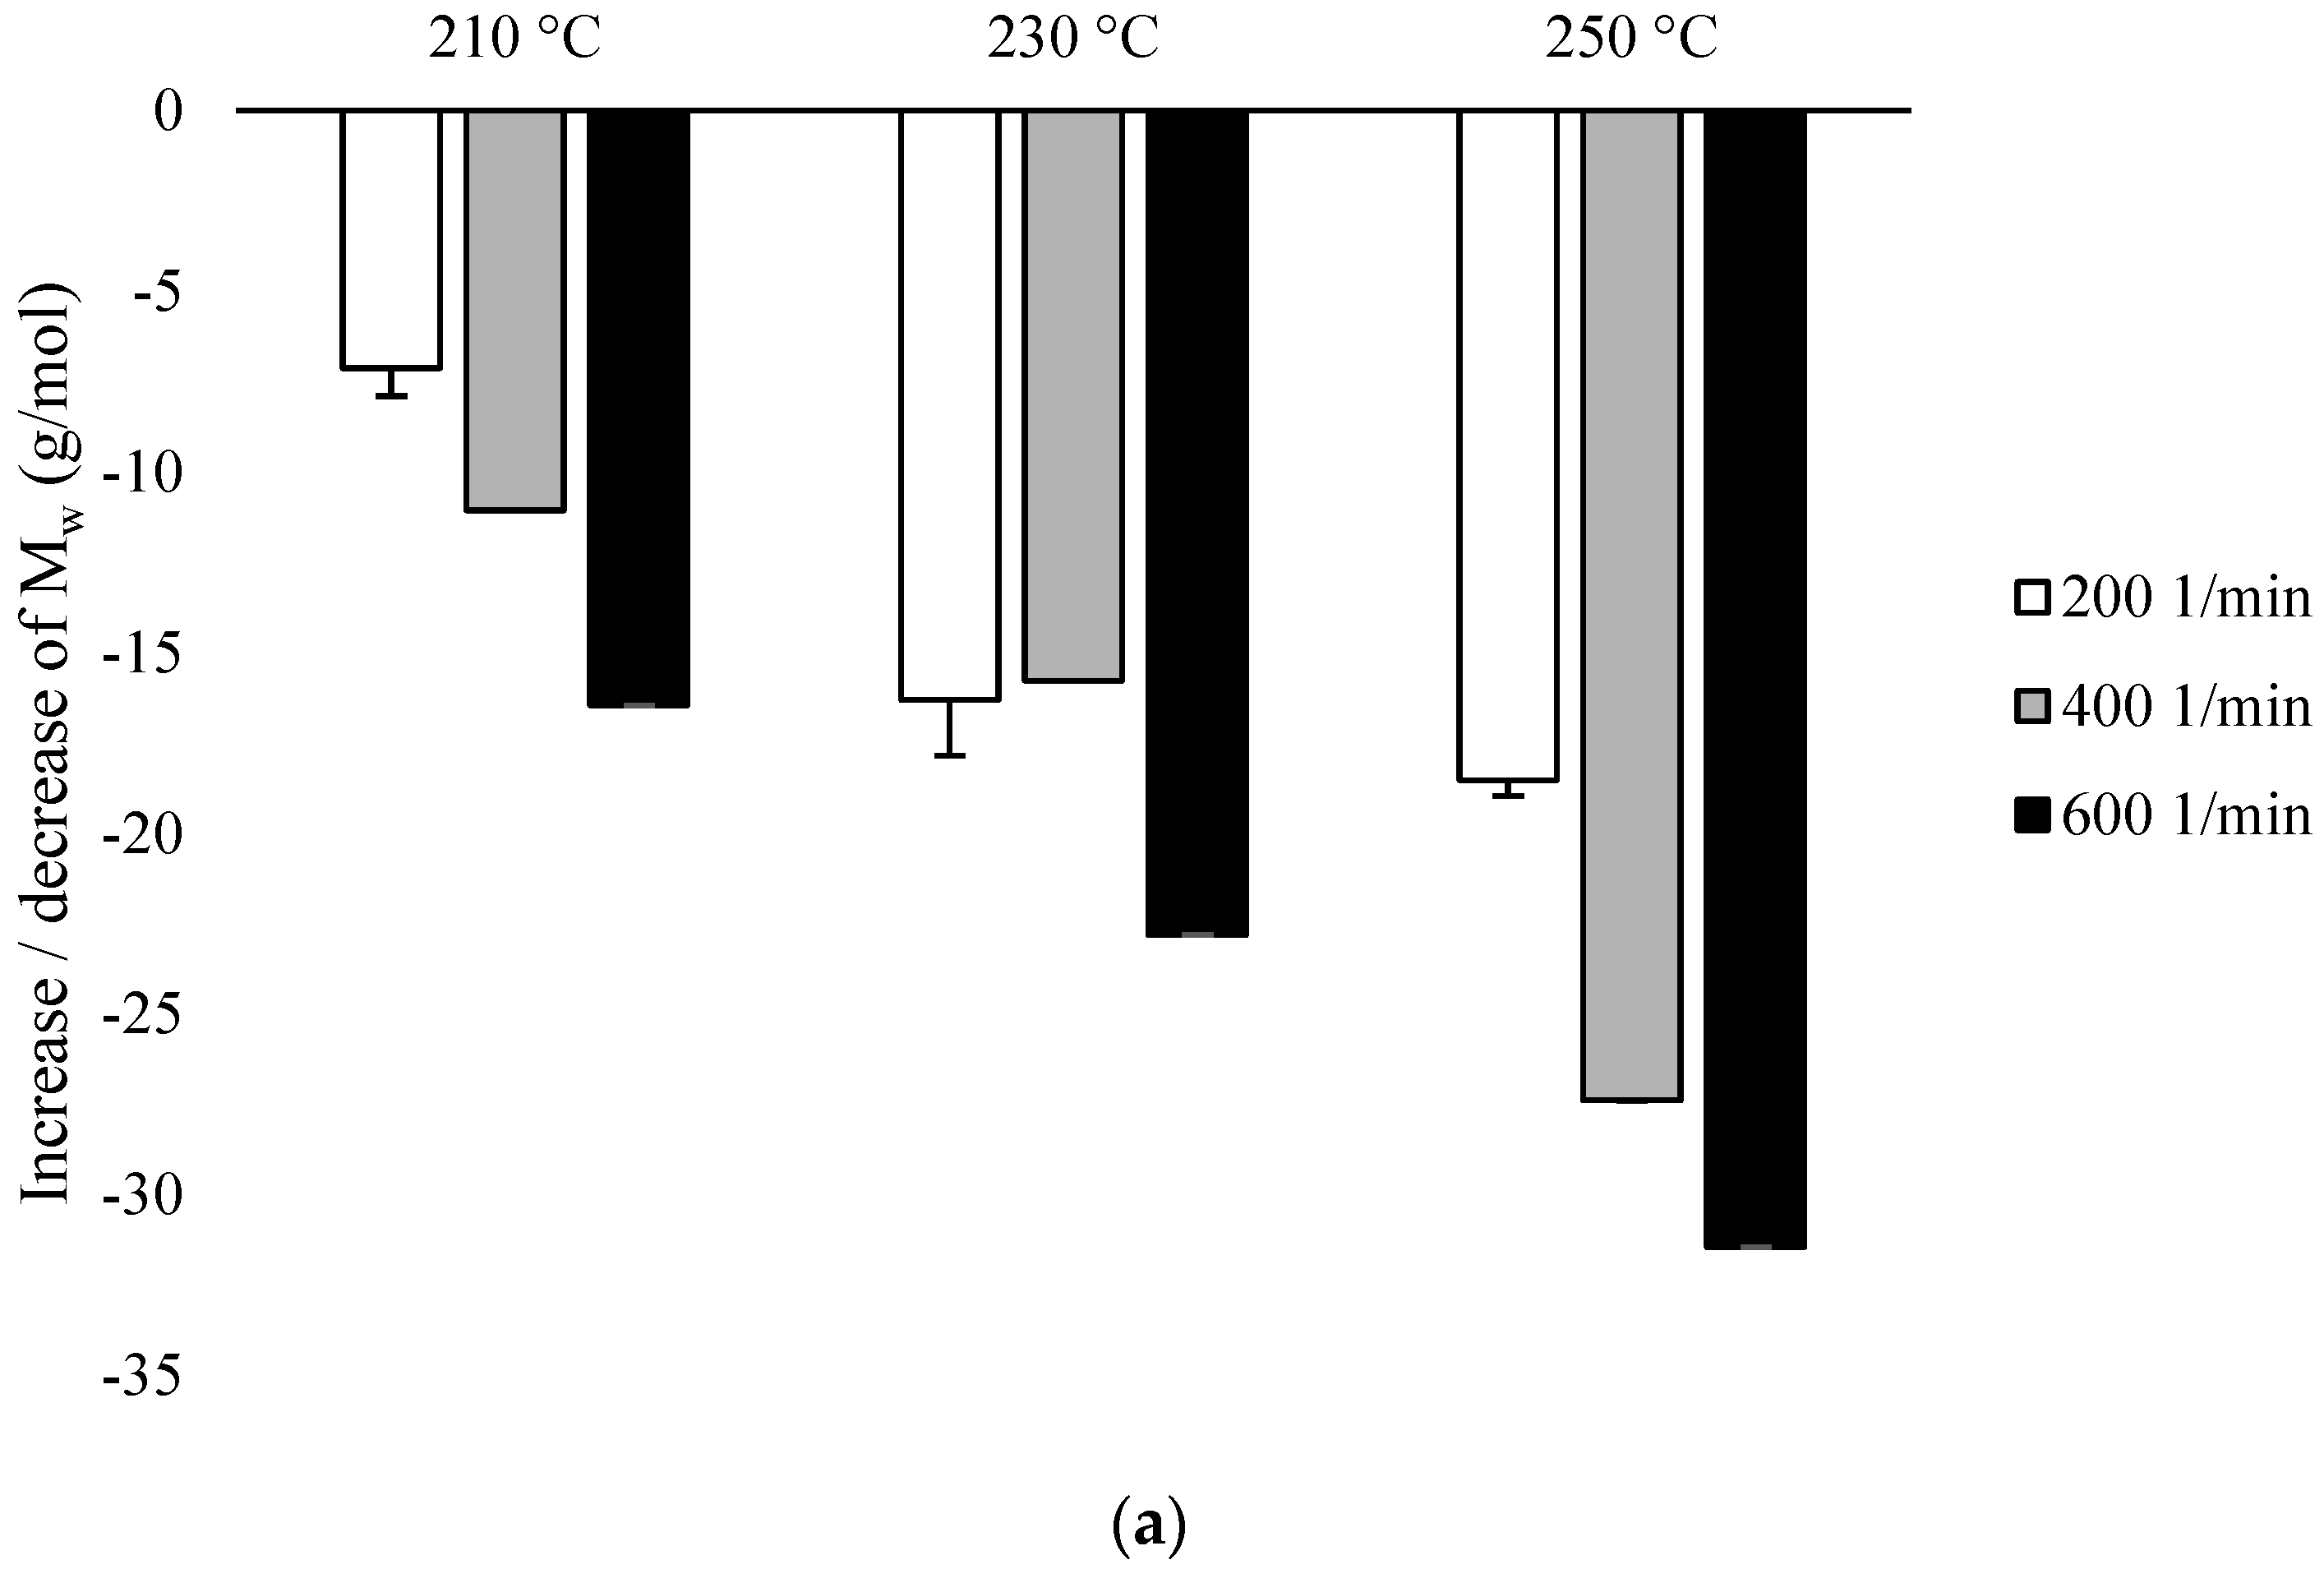
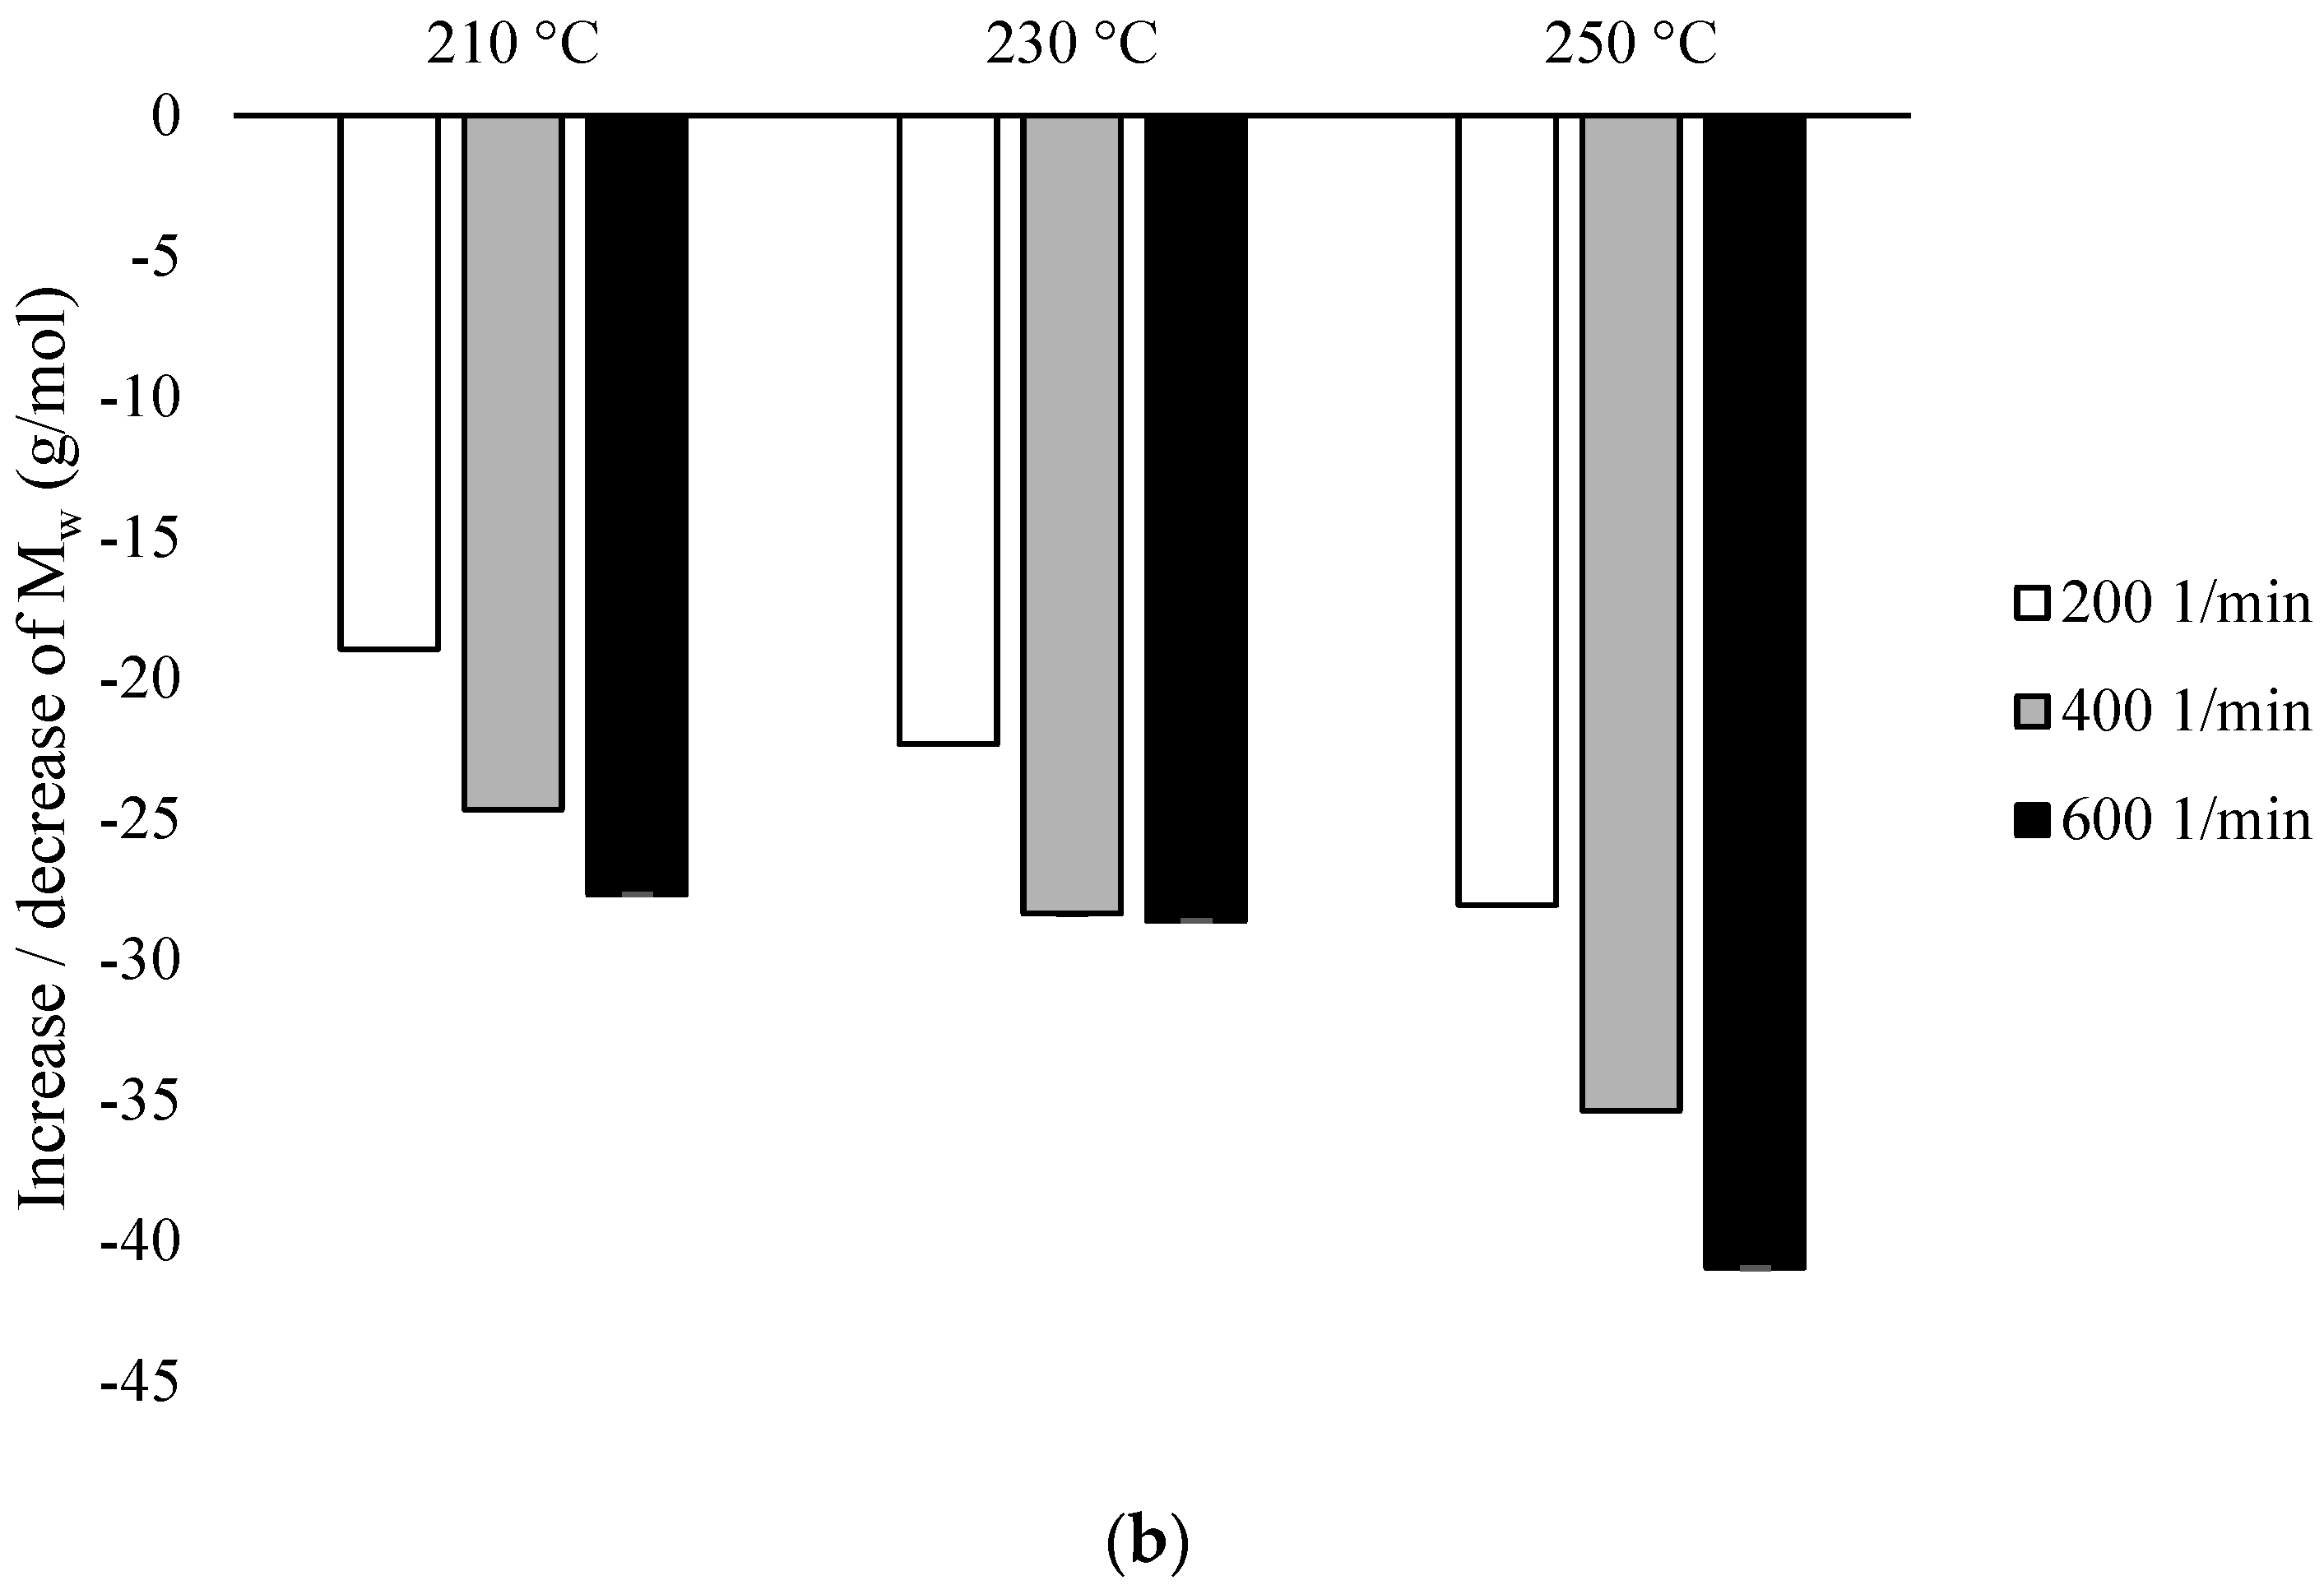
Based on the conducted research, the values of Mw and PDI for individual variants were analyzed, while for unprocessed PLA, these values were 183,099 and 2.254, respectively. For both types of configurations in all variants, a decrease in Mw was observed in the range from 108,101 (for PLA extruded in the presence of configuration 2, at 250 °C at 600 min−1 speed) to 170,035 (for PLA extruded in the presence of configuration 1, at 210 °C at speed 200 min−1) (Figure 3).
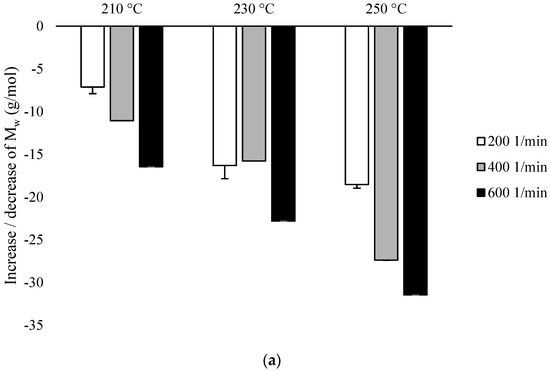
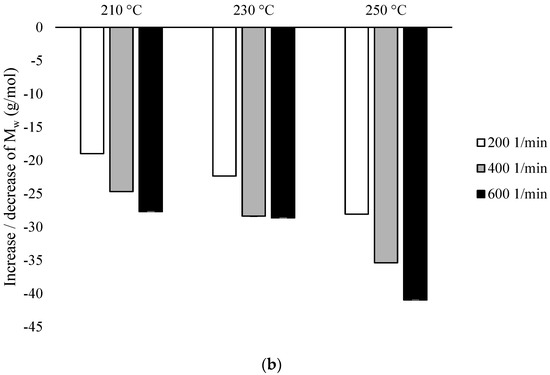
Figure 3.
Weight average molecular weight (Mw), differences % with non-extruded PLA: (a) configuration 1; (b) configuration of 2. Abbreviations: as in Table 1.
In the presence of configuration 1, the smallest decrease in Mw relative to the non-extruded PLA (about 7%) was obtained after extrusion at the lowest temperature (210 °C) at the lowest rotational speed used (200 min−1). Decrease in Mw value (about 31%) was obtained after extrusion at the highest temperature (250 °C) at the highest of the rotational speeds used (600 min−1). Despite the decrease in Mw inversely proportional to the increase in temperature and rotational speed of the screw, there were no major differences found between Mw for PLA extruded at 210 °C at the rotational speed of 600 min−1, PLA extruded at 230 °C at rotational speeds of 200 min−1 and 400 min−1, and also for PLA extruded at 250 °C at rotational speeds of 200 min−1. In this case, the increase in the screw speed to 600 min−1 compared to the temperature had a greater impact on the decrease of this parameter (Figure 3a).
In the presence of configuration 2, highest Mw (decrease approx. 19% to non-extruded PLA) was obtained after extrusion at the lowest temperature (210 °C) at the lowest rotational speed used (200 min−1). The lowest Mw value (decrease at about 41% to non-extruded PLA) was obtained after extrusion at the highest temperature (250 °C) at the highest of the rotational speeds used (600 min−1). These values are lower than in the presence of configuration 1, while at the rotational speeds of 200 min−1 and 400 min−1, the increase in temperature influenced the decrease in the Mw value, while at the rotational speed of 600 min−1, no differences were found between Mw for the extruded PLA at 210 °C and 230 °C. The values for these variants were comparable with PLA extruded at 230 °C at a rotational speed of 400 min−1 (Figure 3b).
The particular importance of the screw rotational speed was found for the temperatures of 210 °C and 250 °C, although it can be generally assumed that Mw is inversely proportional to the increase in the rotational speed of the screw and the processing temperature (Figure 3).
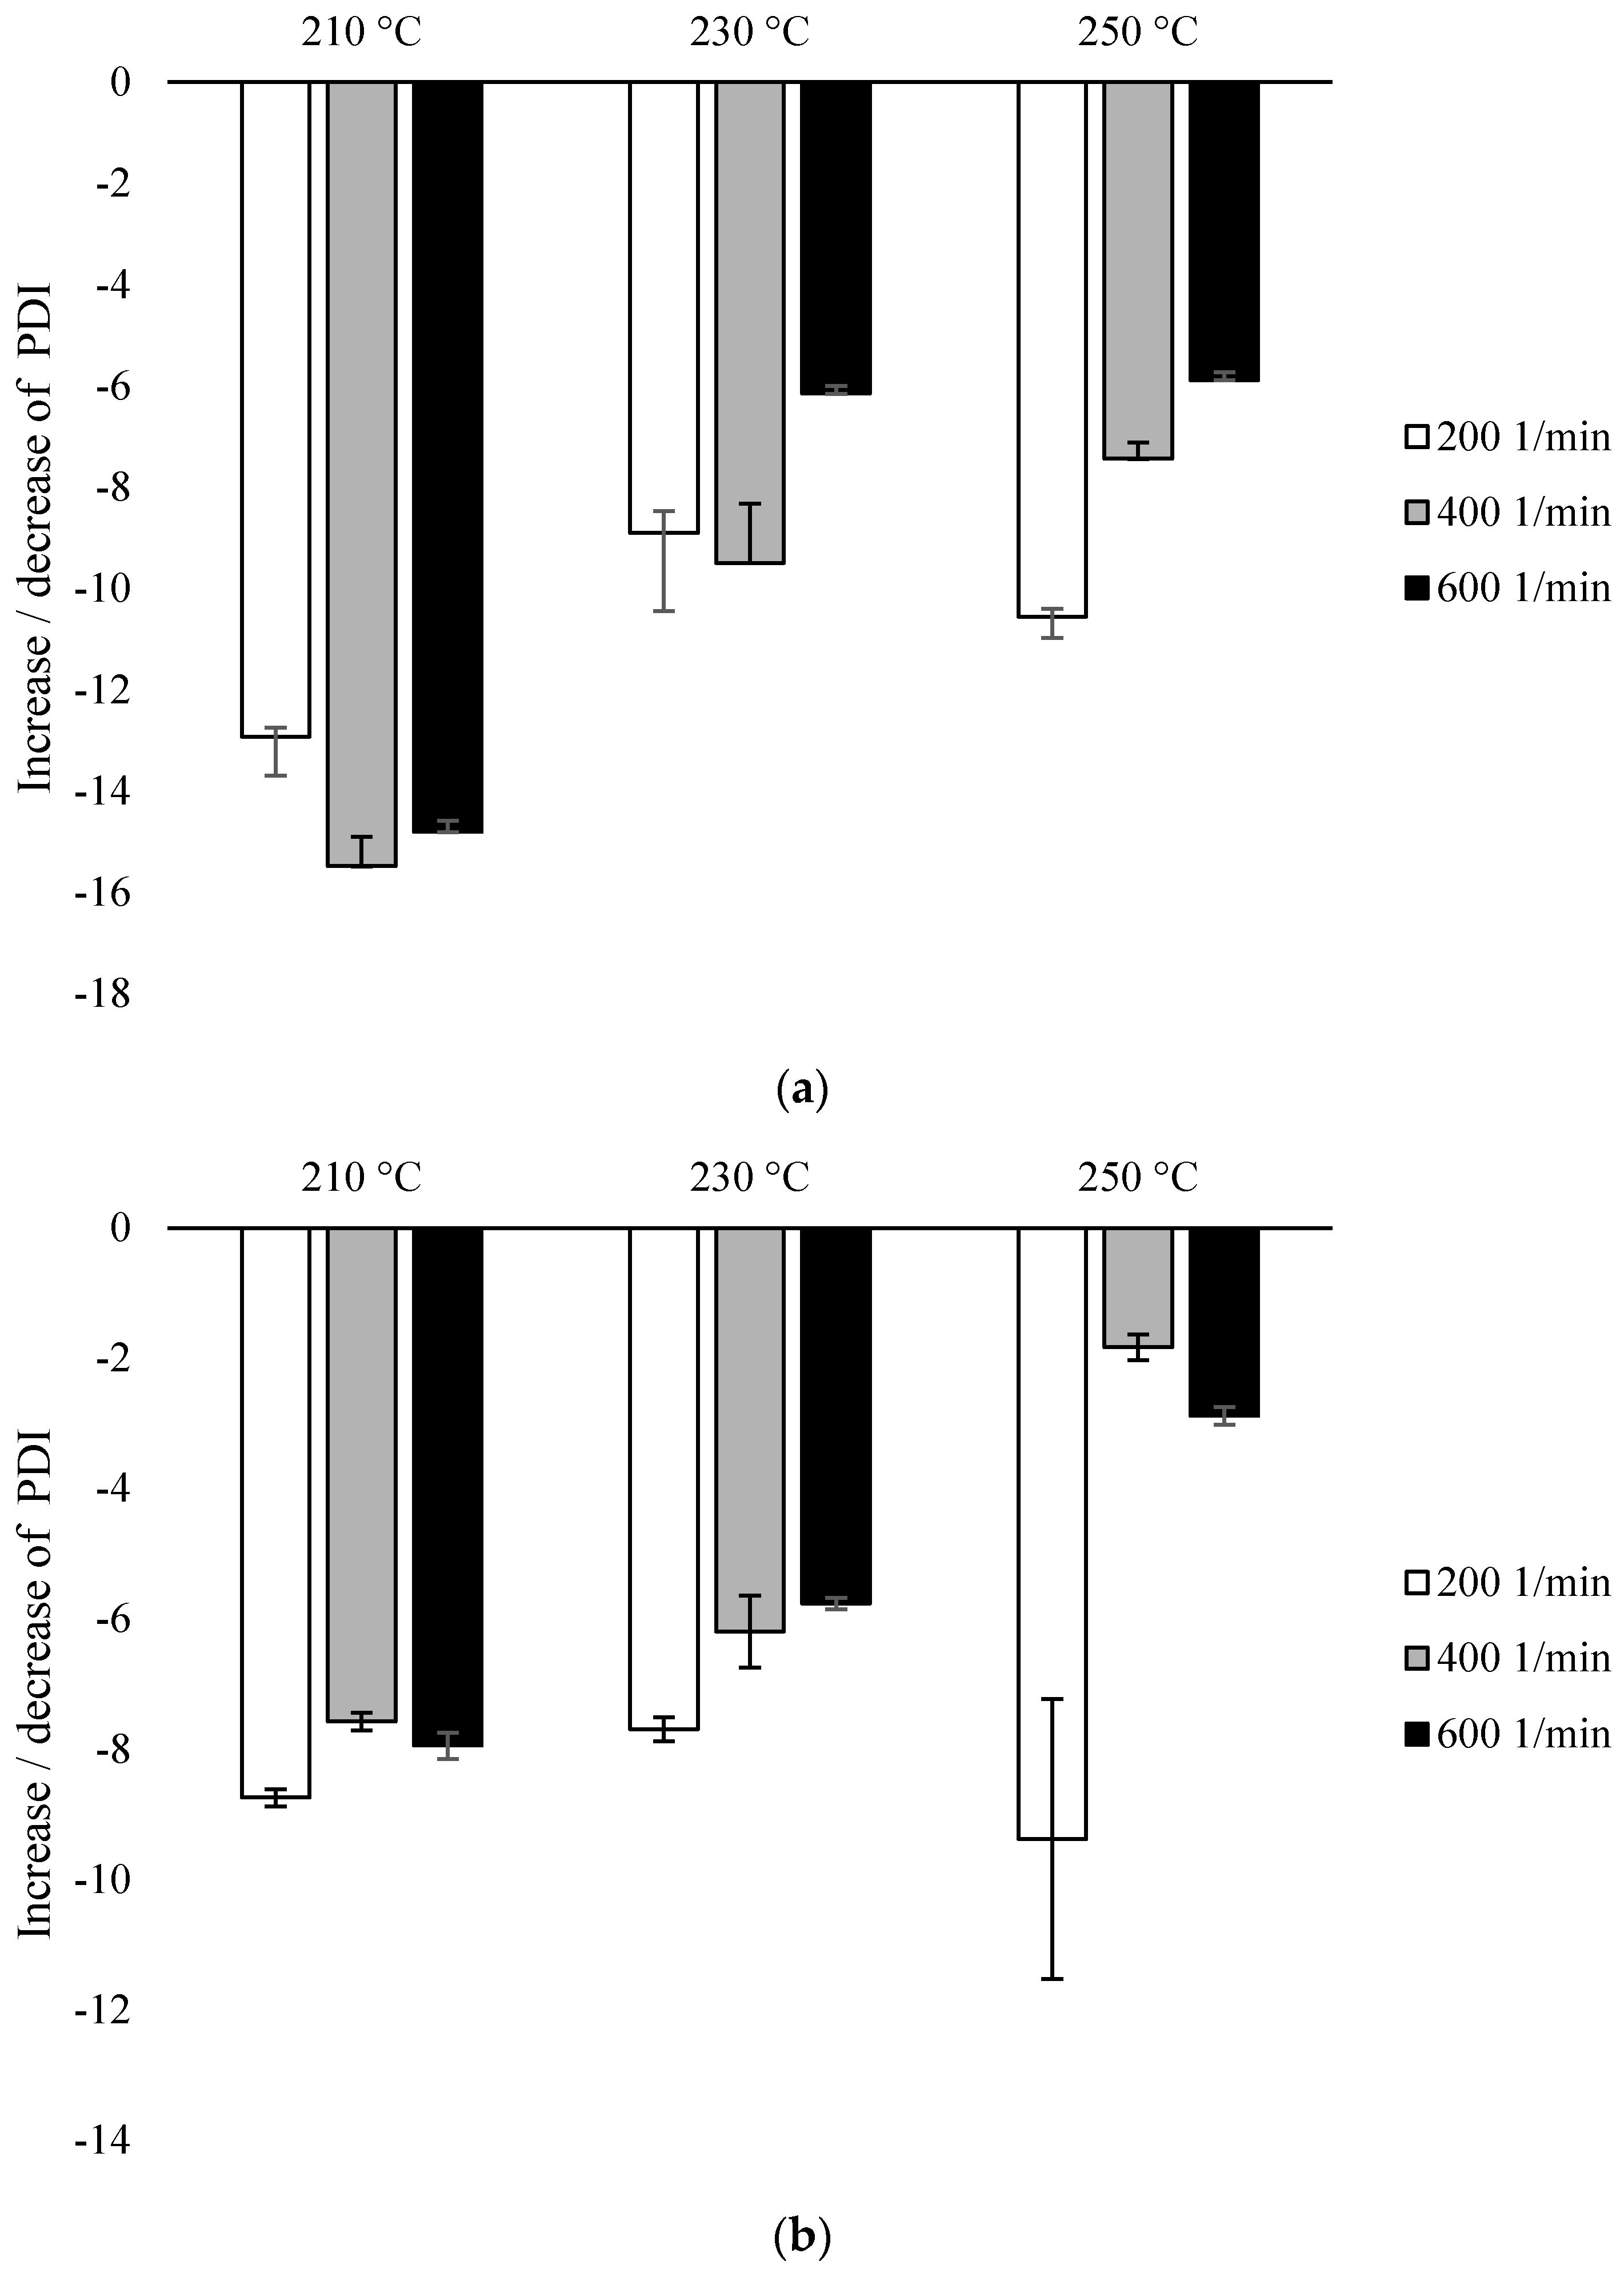
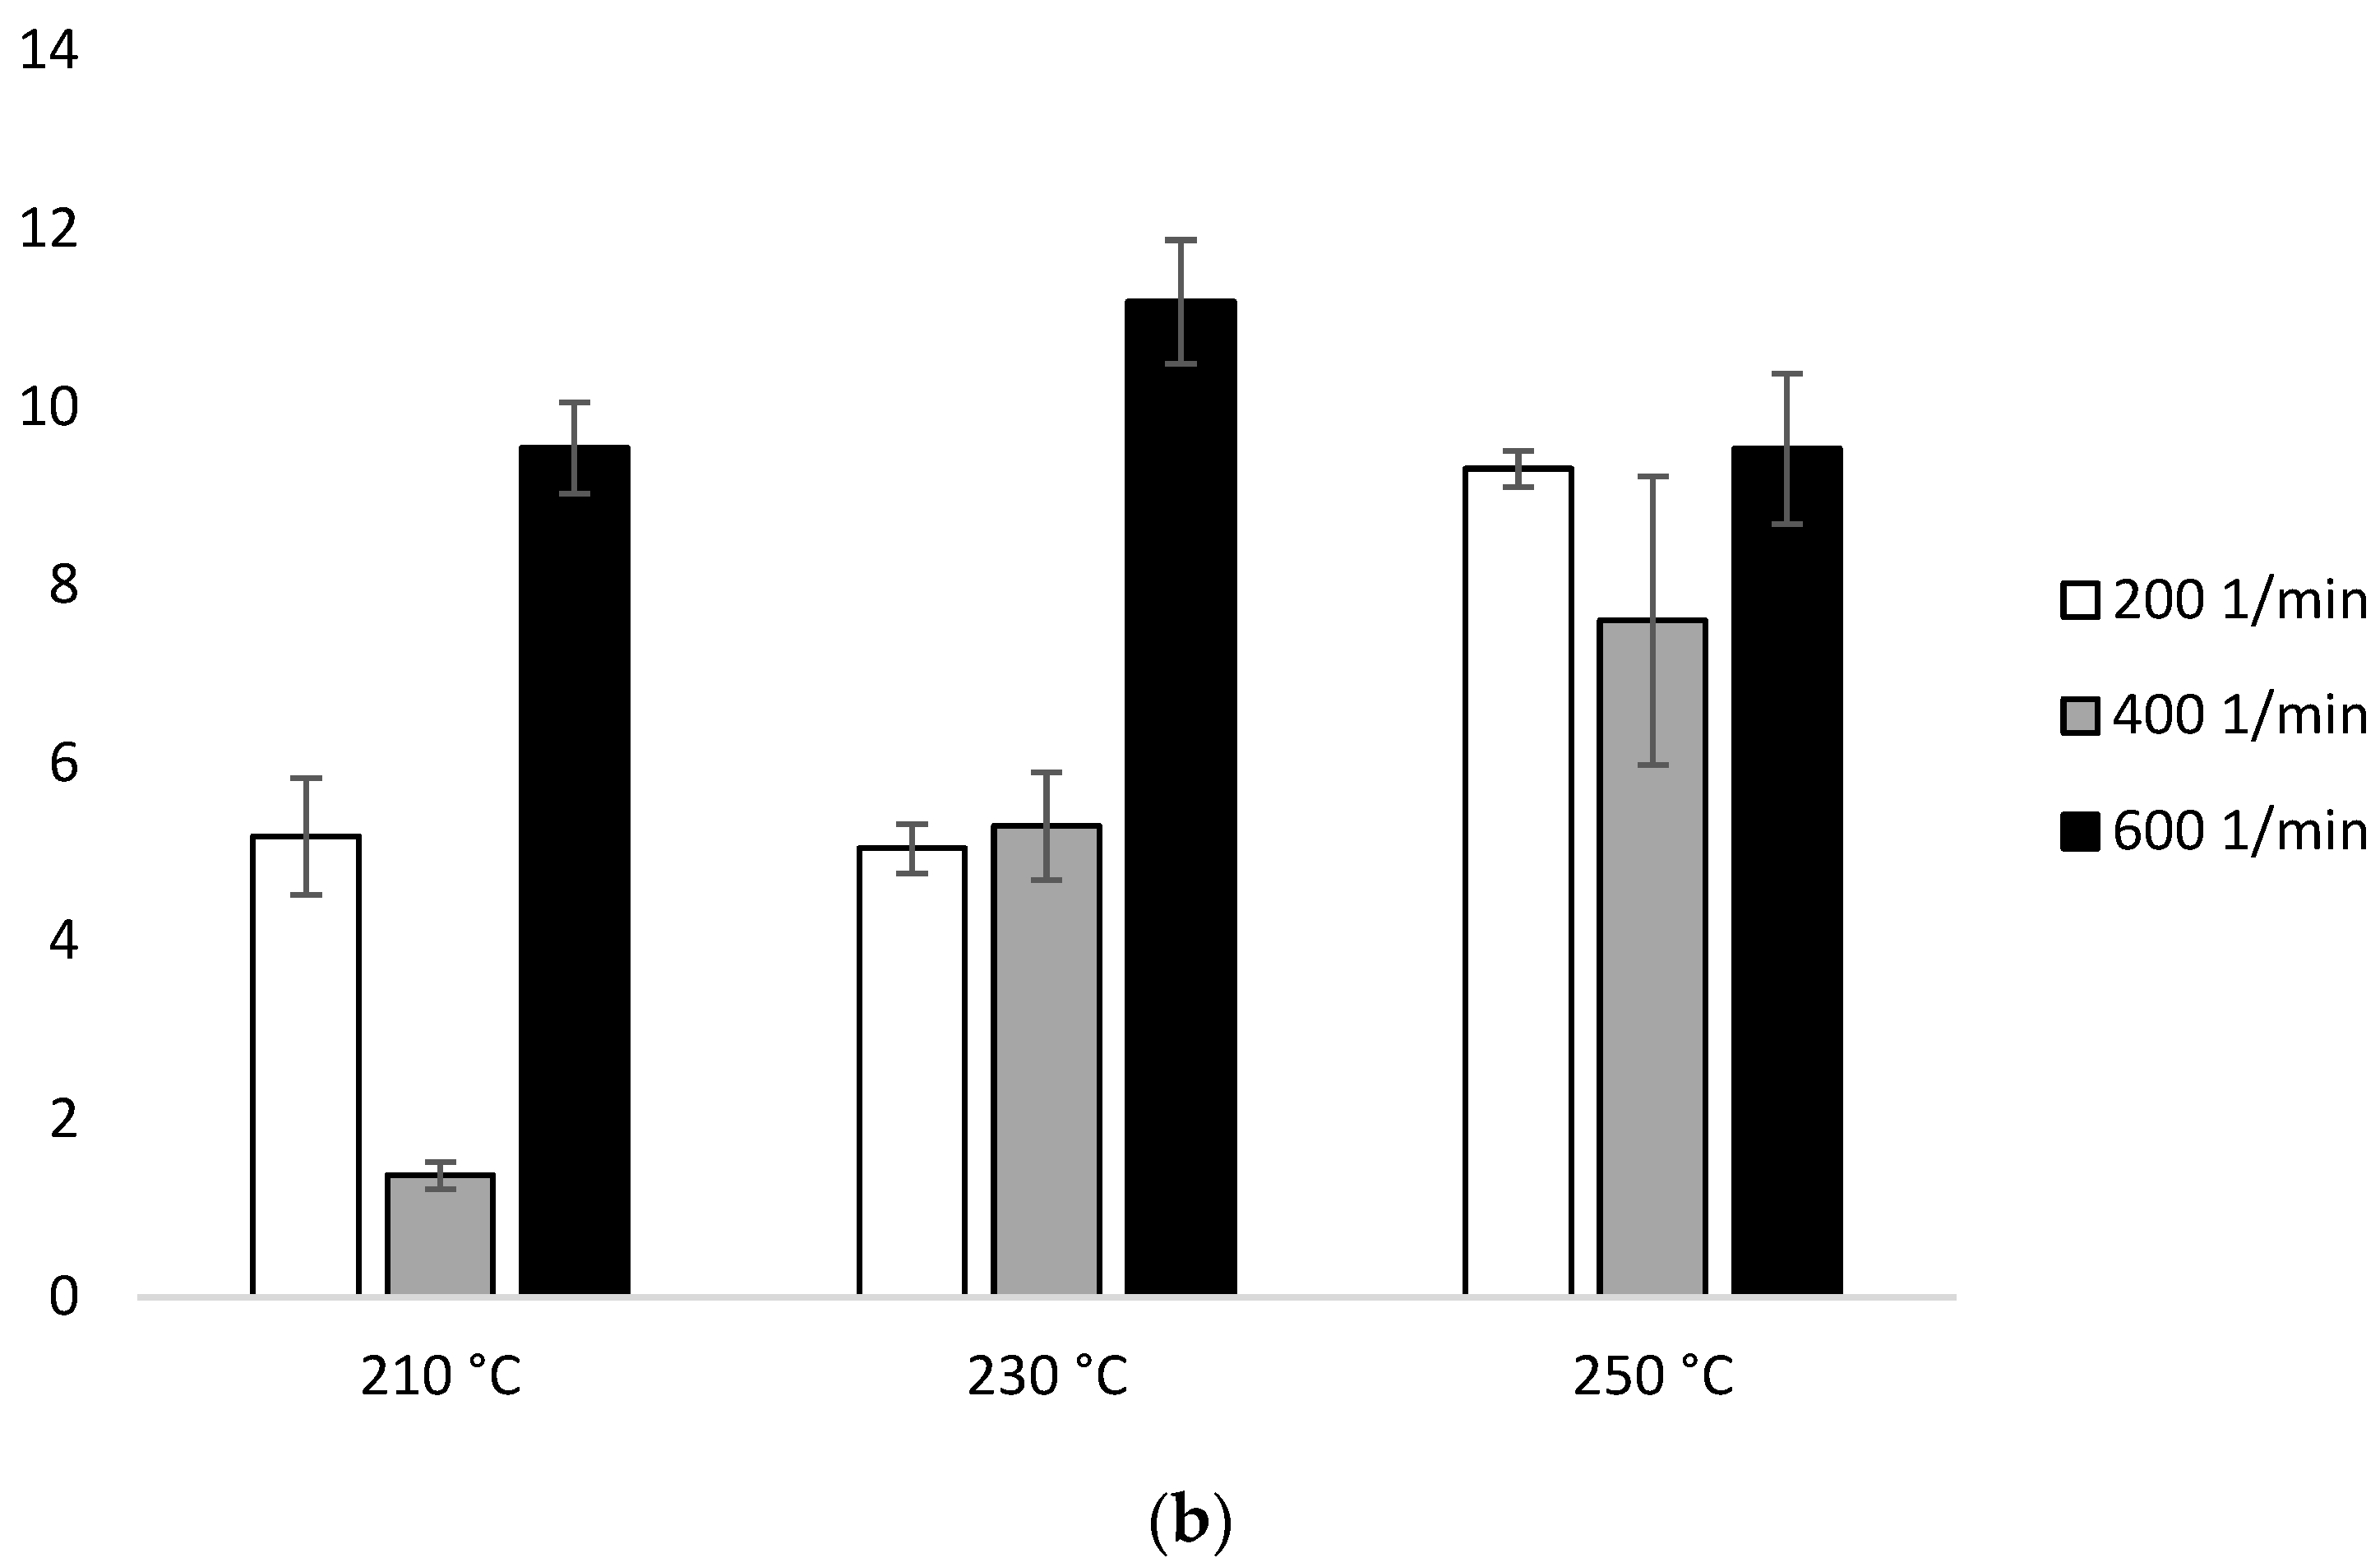
Based on the same analysis, PDI values were calculated for each variant (Figure 4). For each of the variants, the obtained values were lower (ranging from 1.905 ± 0.013 to 2.212 ± 0.005) than for the control sample (2.254 ± 0.009). As the requirements of the extrusion process increased, an increase in the PDI value was observed, and this tendency was more influenced by the temperature than the rotational speed of the screw (Figure 4).
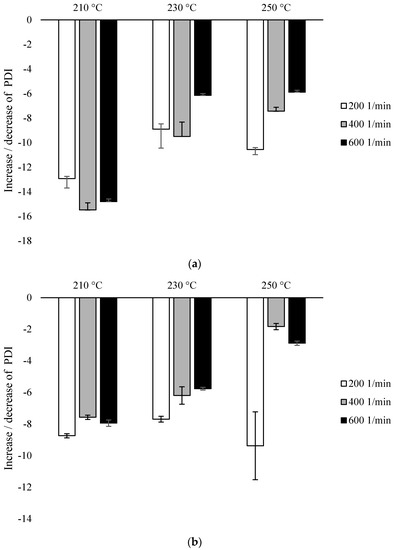
Figure 4.
Polydispersity Index (PDI), % difference with untreated PLA: (a) configuration 1; (b) configuration of 2. Abbreviations: as in Table 1.
For configuration 1, the lowest PDI values were recorded for samples extruded at the lowest temperature (210 °C), while for samples extruded at a rotational speed of 200 min−1, PDI was 13% lower than for non-extruded PLA. At the temperature of 210 °C, a slightly greater decrease in the parameter was noted with the increase in the speed of rotation, but the difference between the values for 400 min−1 and 600 min−1 was similar. At 230 °C, for samples processed at the rotational speed of 200 min−1 and 400 min−1, PDI was reduced by about 9%, while for the speed of 600 min−1 by about 6%. The further increase in temperature did not affect the values mentioned. At the processing temperature of 250 °C, similar PDI values were shown for the individual screw speed values as at the temperature of 230 °C (Figure 4a).
For configuration 2, the smallest decrease in PDI was observed for samples extruded at the highest temperature (250 °C), while the parameter at the screw speed of 200 min−1 decreased by about 9%, while at higher speeds by about 2–3%. There were no differences between PDI for samples extruded at different temperatures at low screw revolutions (200 min−1); for these variants, this value in each case dropped by about 8–9%. Additionally, at the lowest temperature (210 °C), no differences in PDI values were observed with the increase of the rotational speed of the screw above 400 min−1. For the rotational speed of the screw of 200 min−1, there was no effect of the processing temperature on the PDI value. On the other hand, an increase in the screw rotational speed from 400 min−1 to 600 min−1 at a temperature of 210 °C did not cause a decrease in PDI. At 230 °C, a decrease in the PDI value was observed inversely proportional to the increase in the rotational speed of the screw. The lowest value was obtained with the screw rotational speed of 200 min−1. At other speeds, the differences were not so noticeable. The highest values of PDI were recorded at the temperature of 250 °C at the rotational speed of 400 min−1 and 600 min−1, as opposed to 200 min−1, where this value was much lower (Figure 4b).
3.3. Differential Scanning Calorimetry, DSC
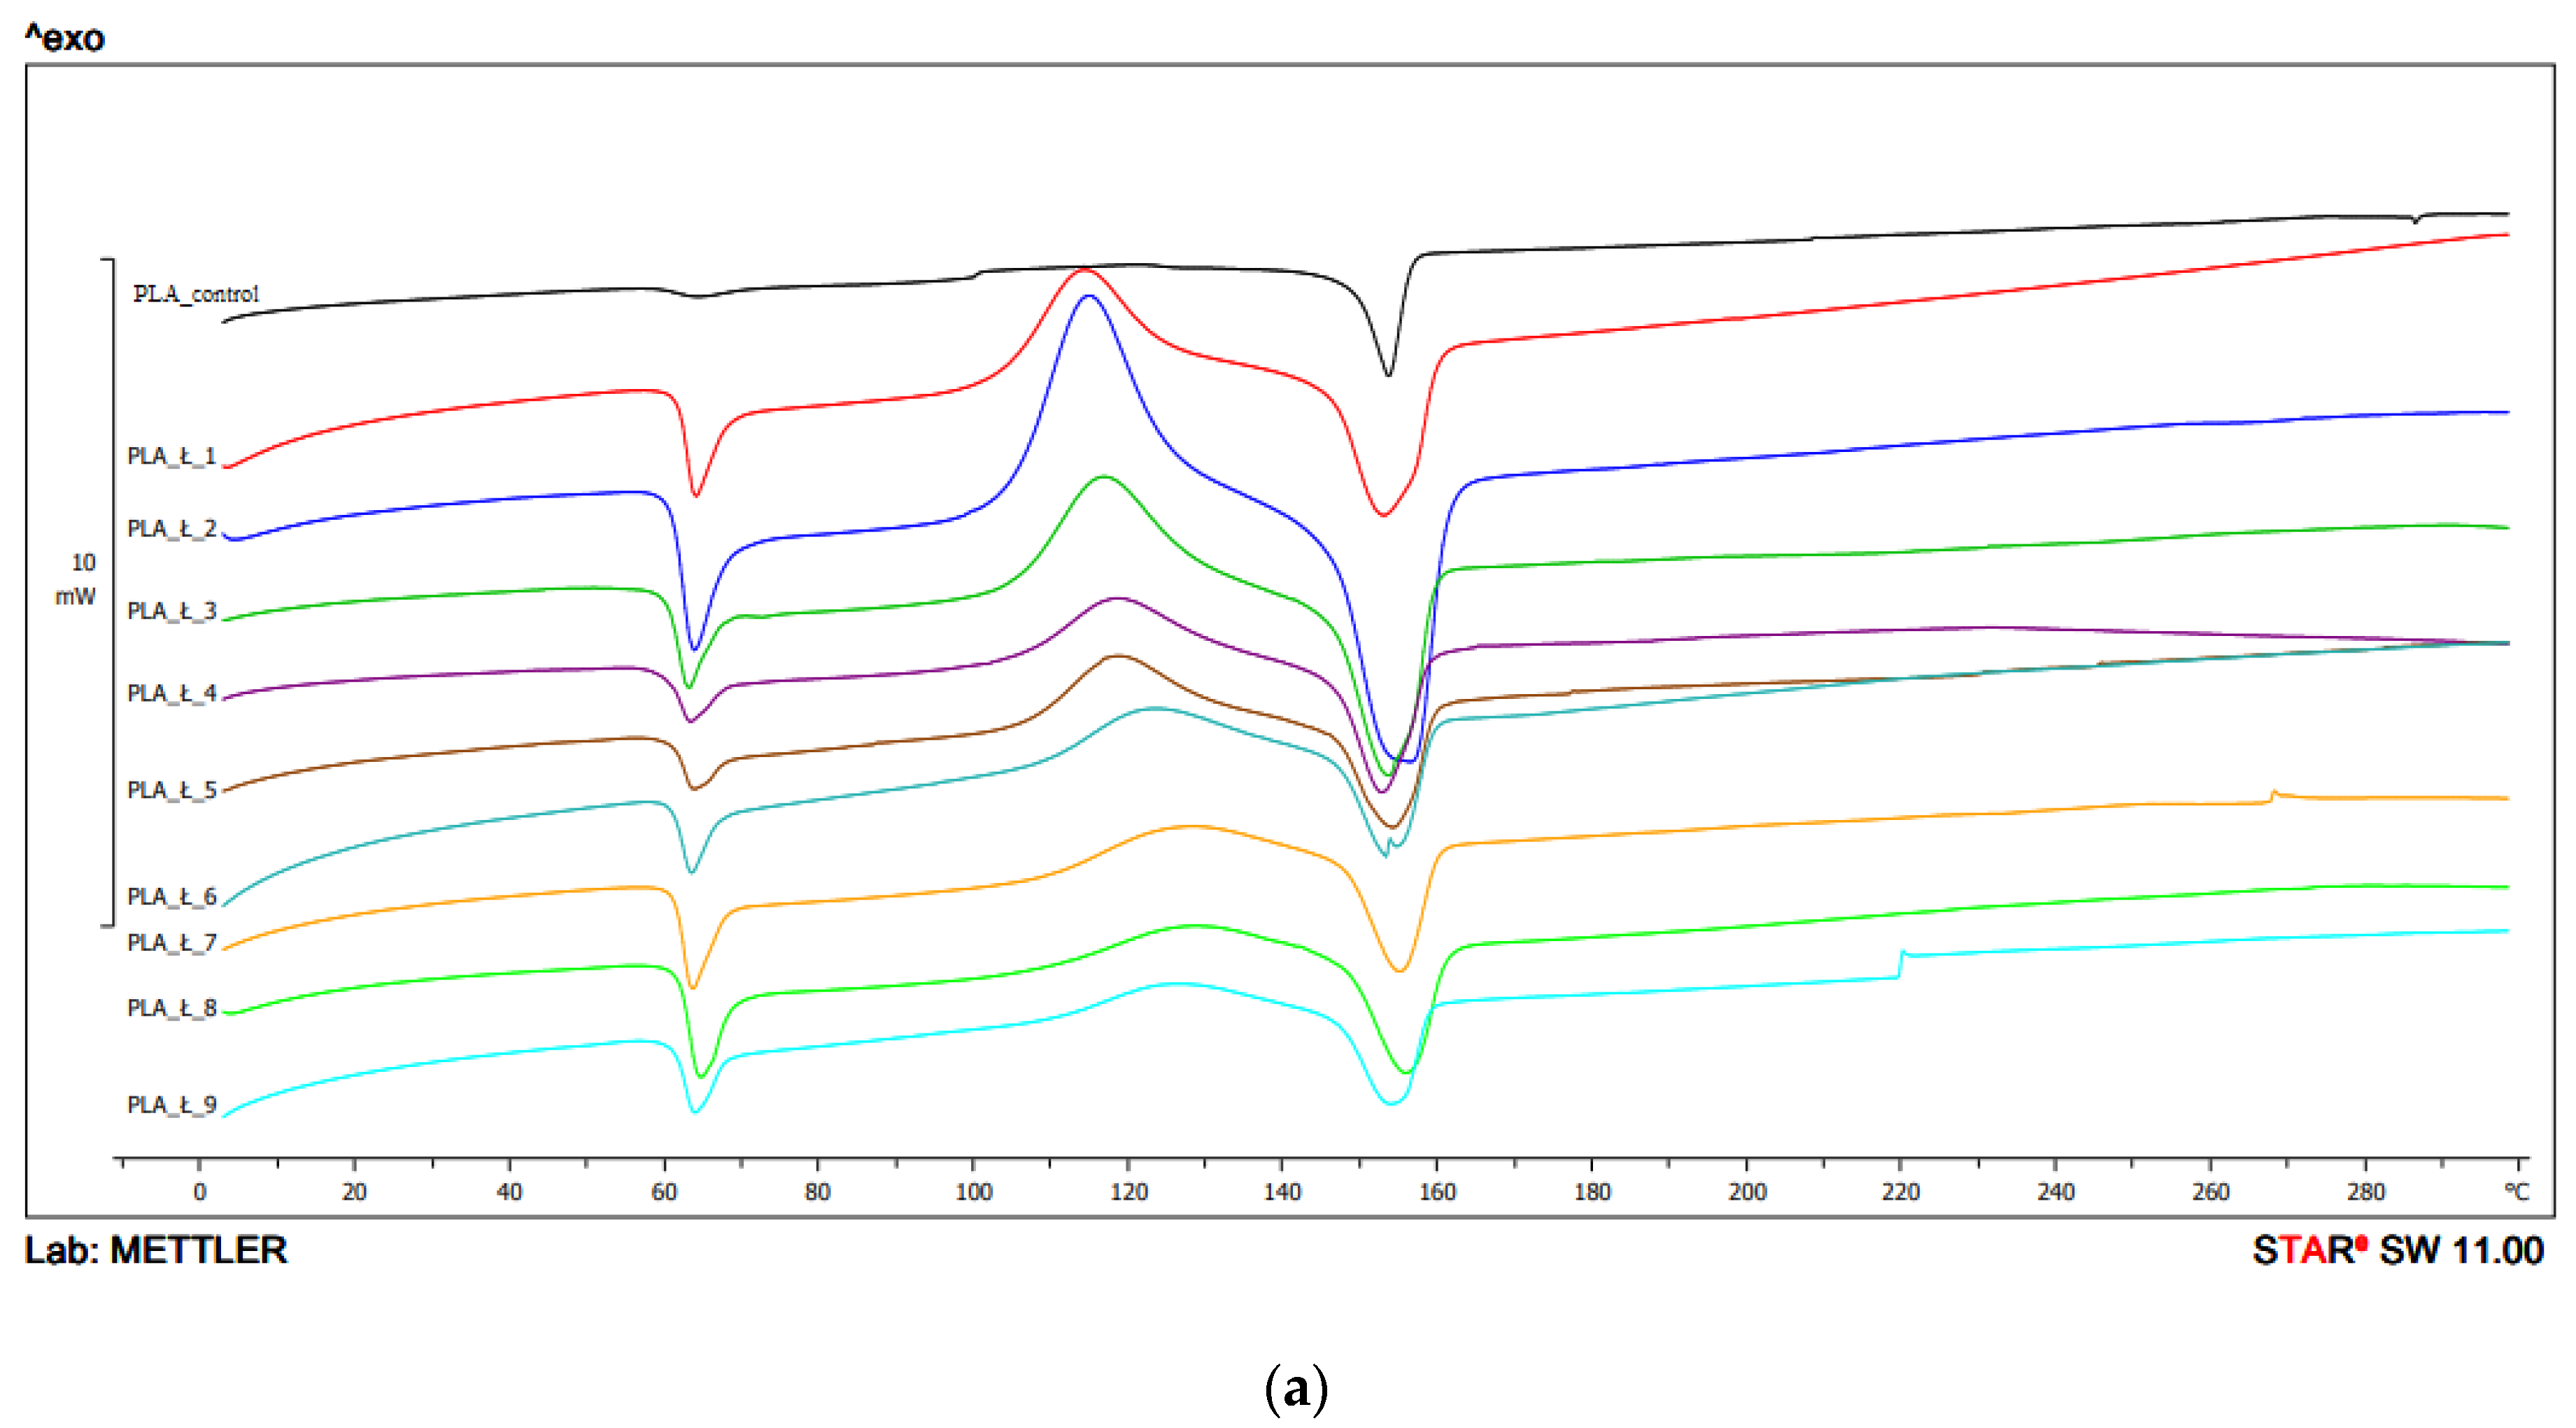
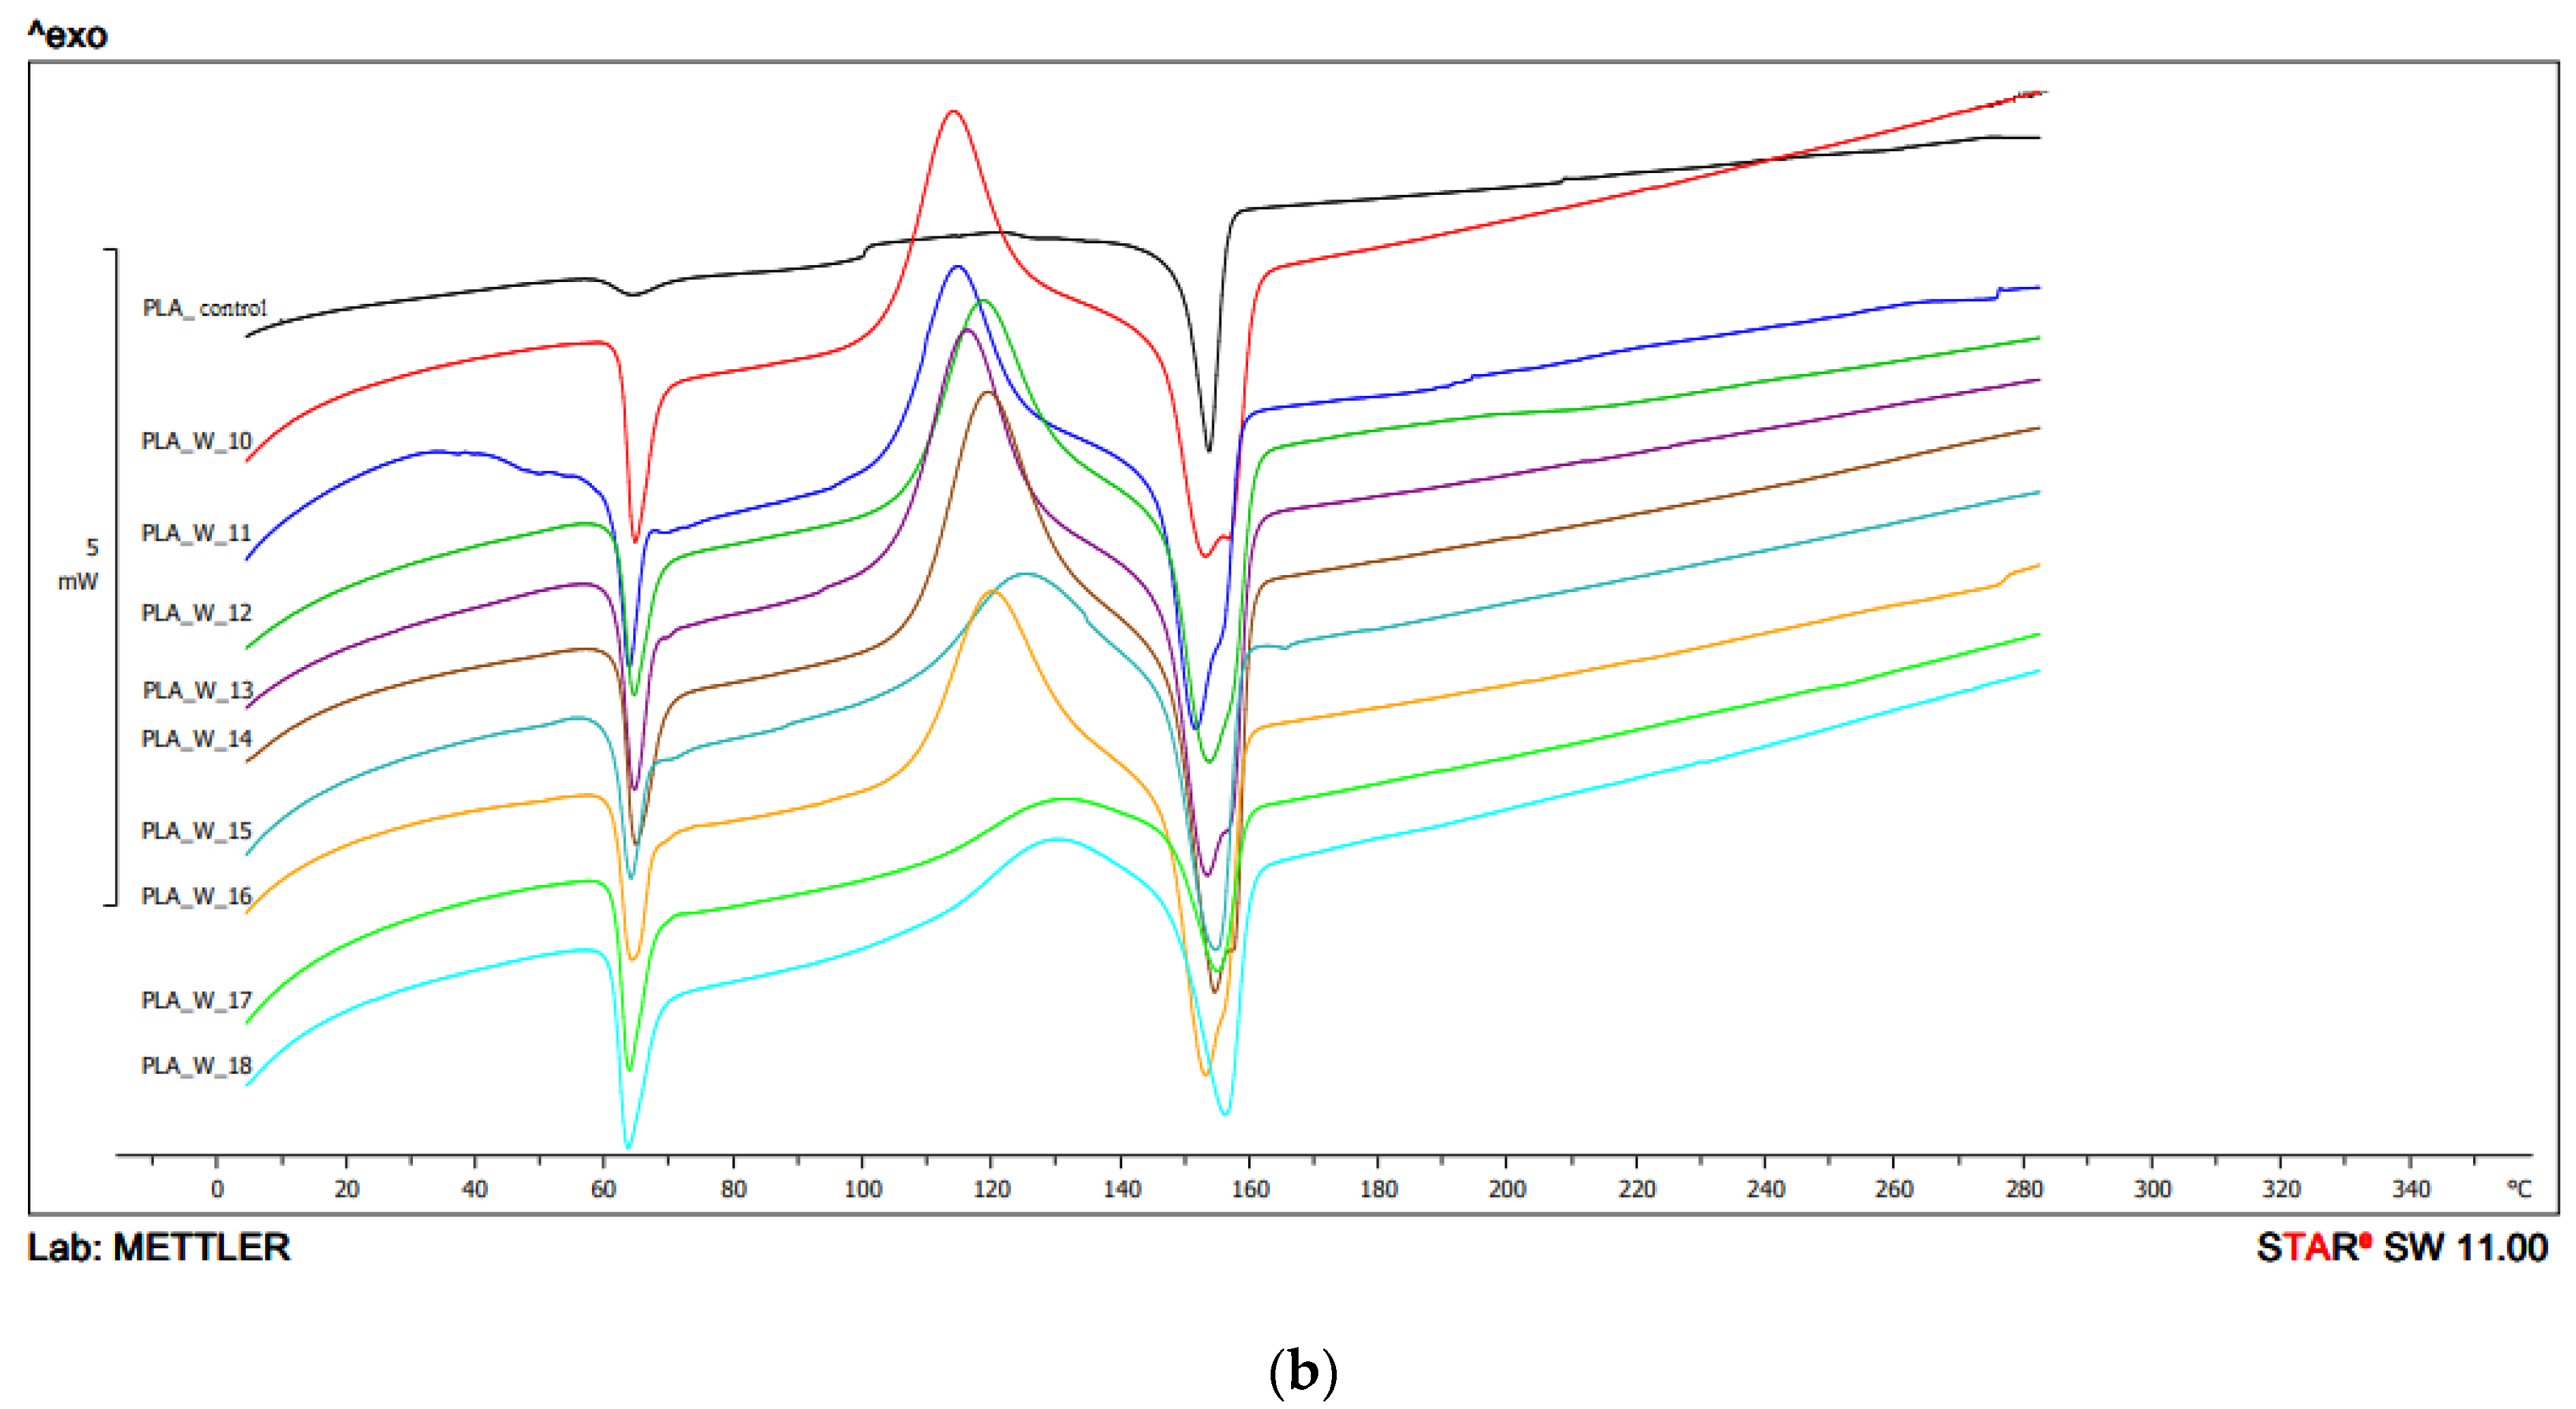
In the first heating, the Tg value for PLA obtained with the use of the 1 screw configuration ranged from 59.7 °C to 61.7 °C, with the lowest value recorded for the parameters 200 °C/200 min−1, and the highest for 250 °C/400 min−1. For unprocessed PLA, the value was 61 °C, and the peak intensity was lower than for the other samples. The highest peak intensity was observed for the sample processed at 210 °C and the screw speed of 400 min−1 (Figure 5, Table 2a).
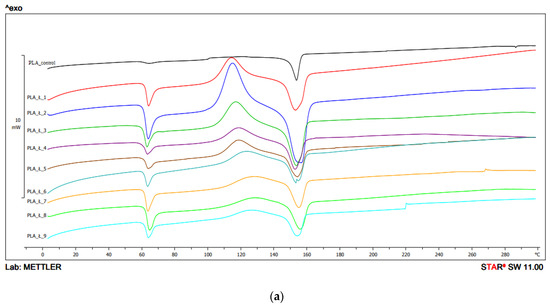
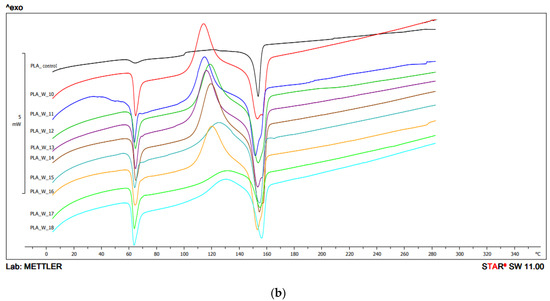
Figure 5.
DSC thermograms heating analysis 1: (a) configuration 1; (b) configuration 2. Abbreviations: PLA 1—configuration 1, 210 °C/200 min−1; PLA 2—configuration 1, 210 °C/400 min−1; PLA 3—configuration 1, 210 °C/600 min−1; PLA 4—configuration 1, 230 °C/200 min−1; PLA 5—configuration 1, 230 °C/400 min−1; PLA 6—configuration 1, 230 °C/600 min−1; PLA 7—configuration 1, 250 °C/200 min−1; PLA 8—configuration 1, 250 °C/400 min−1; PLA 9—configuration 1, 250 °C/600 min−1; PLA 10—configuration 2, 210 °C/200 min−1; PLA 11—configuration 2, 210 °C/400 min−1; PLA 12—configuration 2, 210 °C/600 min−1; PLA 13—configuration 2, 230 °C/200 min−1; PLA 14—configuration 2, 230 °C/400 min−1; PLA 15—configuration 2, 230 °C/600 min−1; PLA 16—configuration 2, 250 °C/200 min−1; PLA 17—configuration 2, 250 °C/400 min−1; PLA 18—configuration 2, 250 °C/600 min−1.

Table 2.
Summary of DSC parameters: (a) configuration 1; (b) configuration 2. Abbreviations: as in Table 1.
For configuration 1, the Tcc ranged from 114.2 °C to 127.5 °C. The lowest Tcc was obtained for the sample processed at 210 °C with screw rotation speed of 200 min−1. The highest value was observed for the sample extruded at 250 °C, with the speed of 400 min−1. Peak intensities decreased with increasing temperature. No Tcc was recorded for unprocessed PLA (Figure 5, Table 2a).
In the first heating, the thermogram of PLA obtained using configuration 1 showed an endothermic peak corresponding to the melting of the polymer in the temperature range 152.7 °C to 156.3 °C. The highest Tm was observed for PLA processed at 210 °C/200 min−1 and the highest for 250 °C/400 min−1. The peak intensities for all samples were comparable. For PLA processed at 230 °C and with the screw speed rotation of 600 min−1, a double peak was observed indicating probably the presence of two kinds of crystallites of different size and irregular/disordered structure. For PLA not subjected to extrusion, the Tm was 153.6 °C (Figure 5, Table 2a).
For configuration 2, the Tg was in the range of 57.8 °C–62.0 °C in the first heat. The highest glass transition temperature was demonstrated by PLA obtained at a temperature of 210 °C and at the lowest rotation speed of the screw (200 min−1), and the highest was obtained for a sample obtained at a temperature of 210 °C and a screw speed of 400 min−1 (Figure 5, Table 2b).
In the first heating, in the case of configuration 2, the lowest Tcc value was obtained for the sample extruded at the lowest extrusion temperature (210 °C) and the lowest screw speed (200 min−1), and the highest Tcc value for the highest extrusion temperature (250 °C) and 400 min−1 screw rotation speed (Figure 5, Table 2b).
In the first heating in the case of configuration 2, the Tm values were in the range of 151.6 °C–156.1 °C, the lowest value was obtained for PLA extruded at the lowest temperature (210 °C) and at the speed screw rotation of 400 min−1, and the highest for the sample extruded at the highest temperature (250 °C), and the highest at the screw speed rotation of (600 min−1). For some samples, bimodal thermal changes were recorded (two endothermic peaks) (Figure 5, Table 2b).
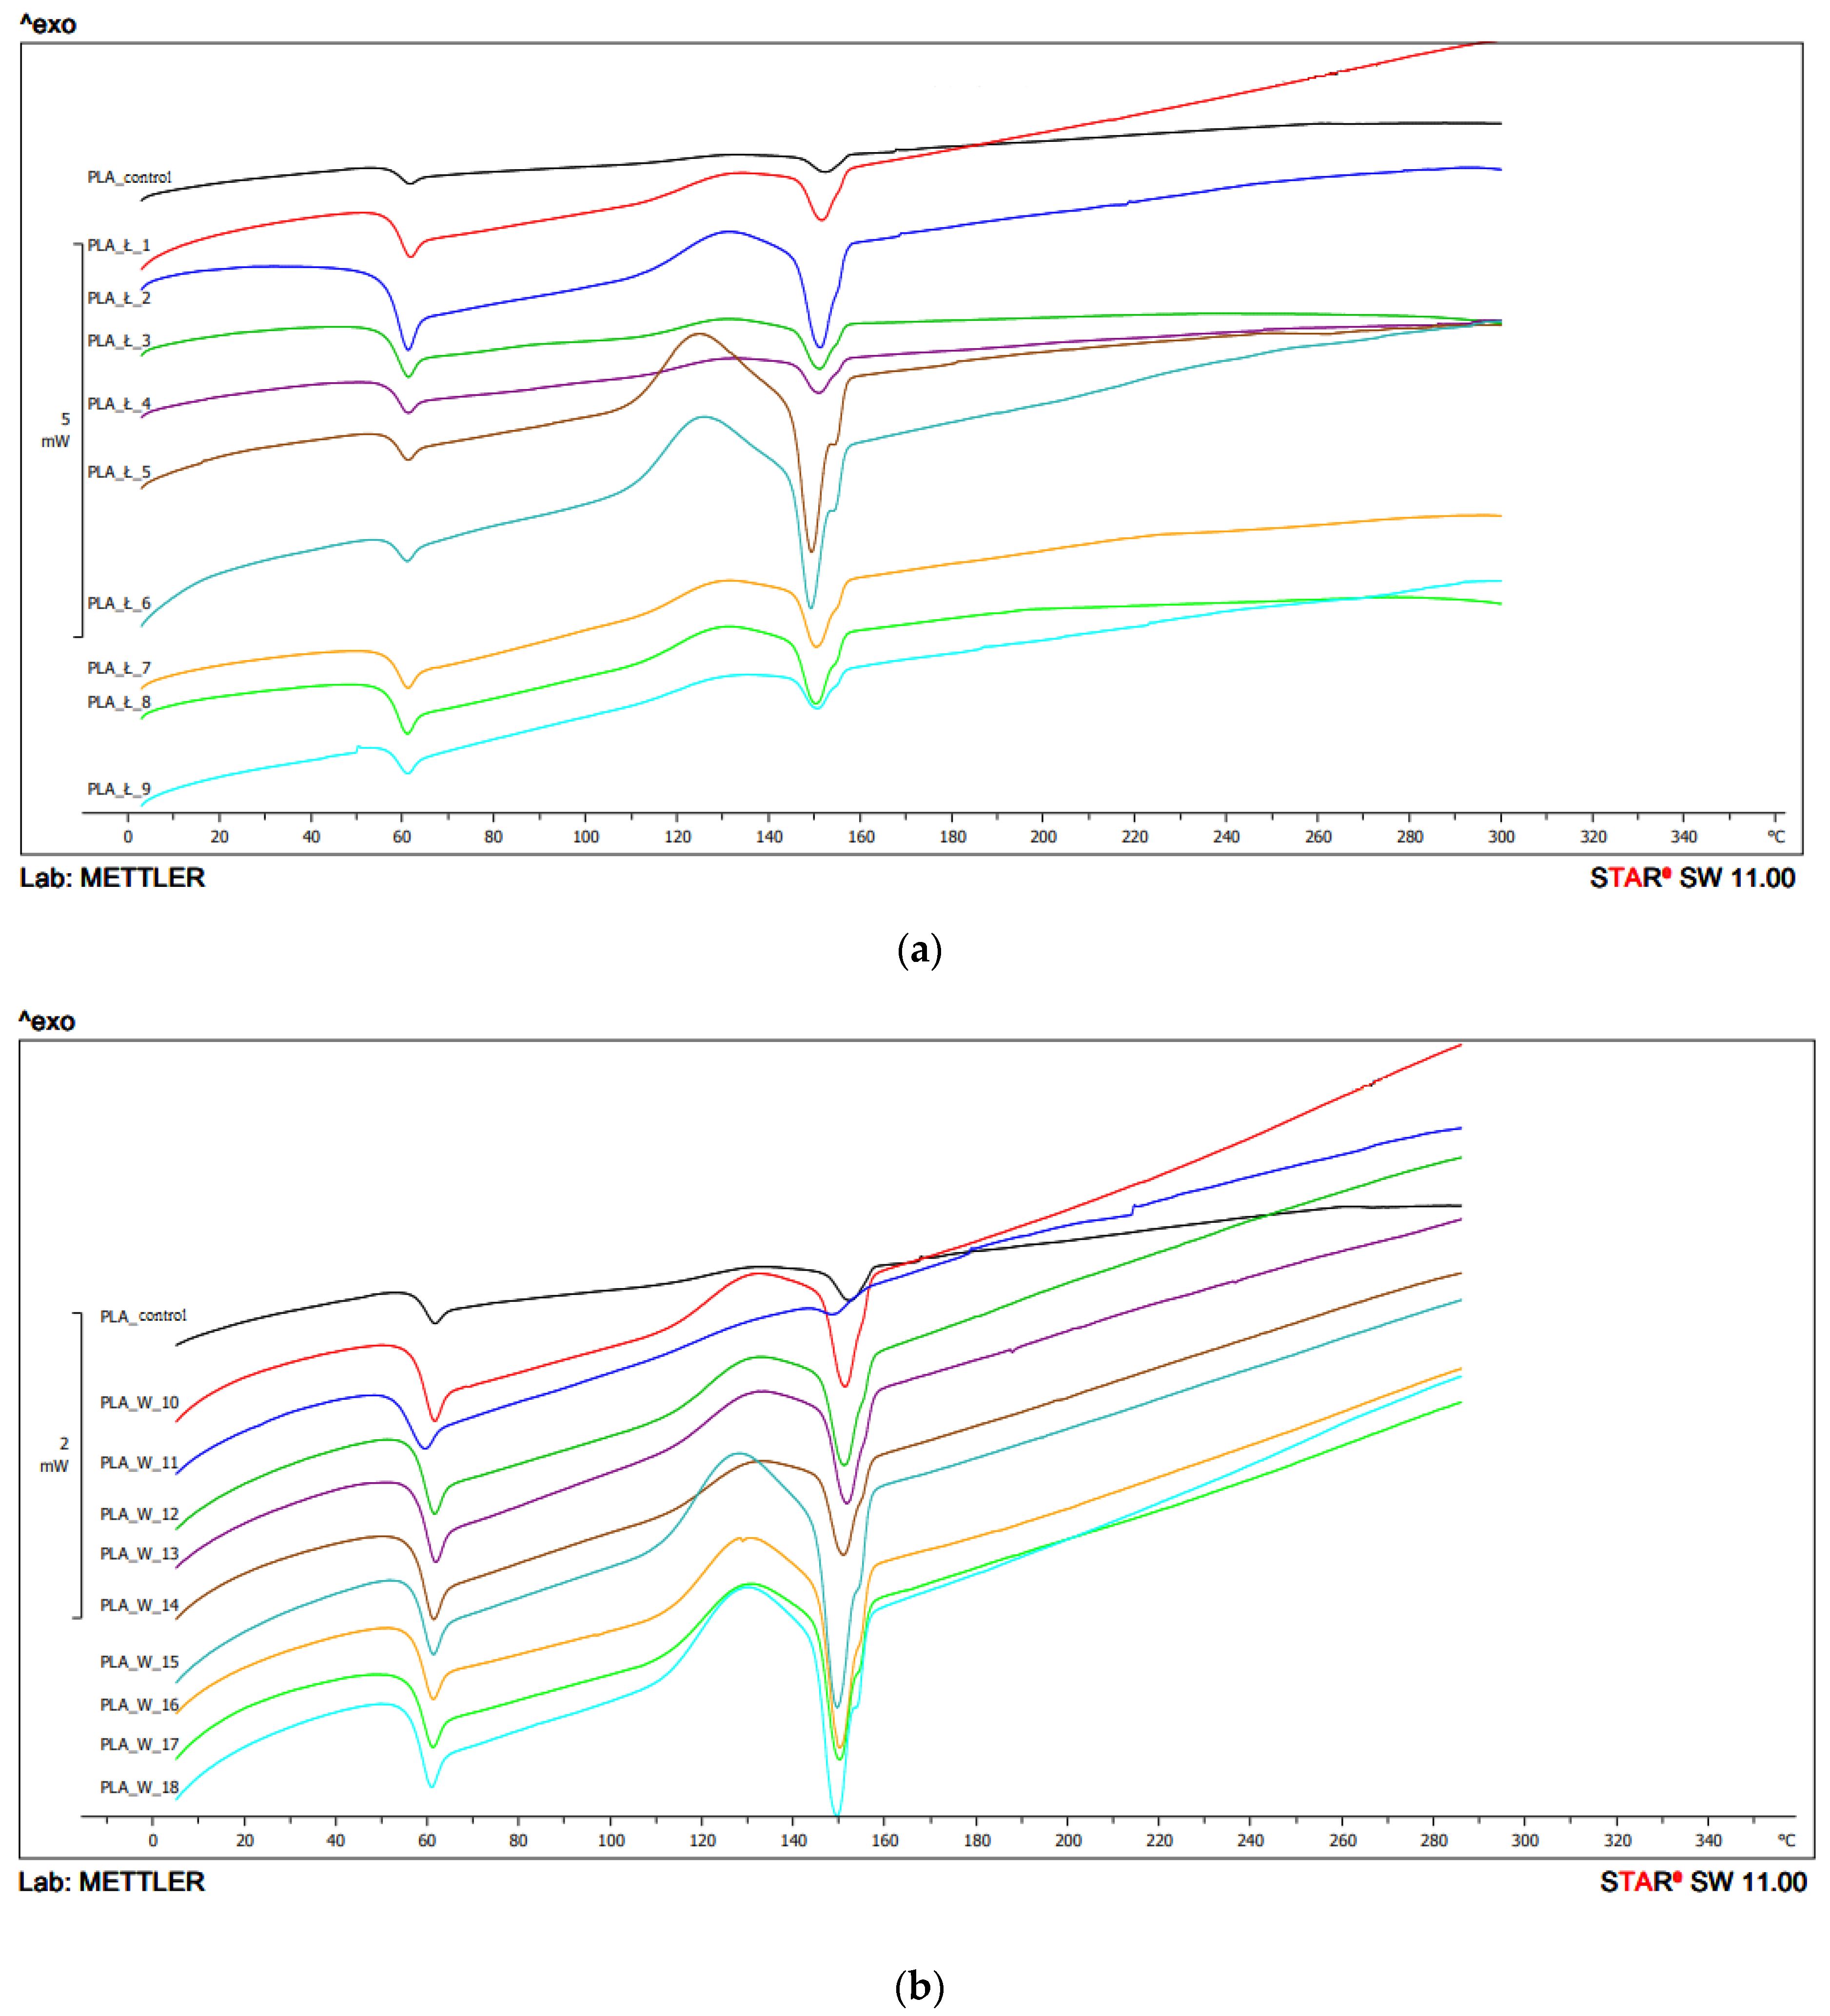
In the second heating, for configuration 1, the Tg value was in the range 57.1 °C–58.1 °C. The lowest value was obtained for the sample extruded at the highest temperature (250 °C) and at 400 min−1 screw speed rotation. The highest value was obtained for the sample with the lowest extrusion parameters (temperature 210 °C, screw speed rotation 200 min−1). The obtained peaks were characterized by a low peak intensity (Figure 6, Table 2a).
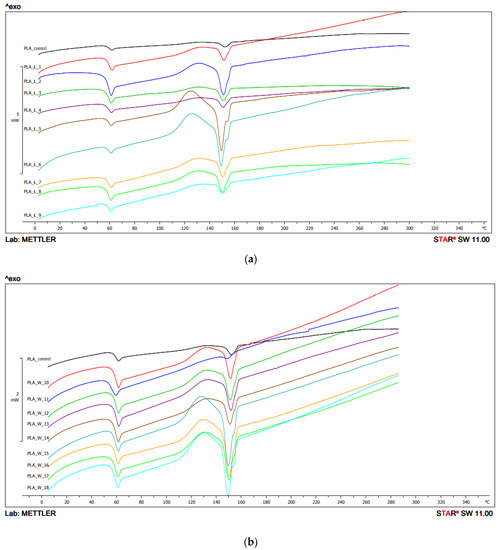
Figure 6.
DSC thermograms’ heating analysis 2: (a) configuration 1; (b) configuration of 2. Abbreviations: as in Figure 5.
For configuration 1 on the second heating, Tcc was recorded for some samples. Tcc was not observed for the samples extruded at the temperature of 210 °C and the screw speed rotation of 200 min−1 and 400 min−1, and for samples extruded at the temperature of 250 °C and the screw speed rotation of 600 min−1. The lowest Tcc value was obtained for the sample extruded at the temperature of 230 °C and 400 min−1 screw speed rotation (124.4 °C), and the highest for the sample extruded at the temperature of 250 °C and the screw speed rotation 200 min−1 (129.0 °C) (Figure 6).
Tm from the second heating for samples obtained with configuration 1 ranged from 149.2 °C (PLA extruded at 230 °C, 600 min−1 screw revolutions) to 157.2 °C (PLA with the highest processing conditions—250 °C, 600 min−1) (Figure 6, Table 2a).
The lowest Tg value in the second heating for configuration 2 was 54.3 °C (extrusion temperature 210 °C, screw speed 400 min−1) and the highest was 58.2 °C (extrusion temperature 230 °C, screw speed 200 min−1). For unprocessed PLA, the Tg was 58.2 °C. The peak intensities were similar and comparable with the peak intensities of raw PLA (Figure 6, Table 2b).
The lowest Tcc value was observed for the sample extruded at the temperature of 230 °C with the screw speed rotation 600 min−1 (127 °C), the highest for the sample extruded under the lowest conditions—temperature 210 °C, screw speed rotation 200 min−1 (129.4 °C). Tcc was not observed for the samples 210 °C/400 min−1 and 600 min−1; 230 °C/400 min−1 and for unprocessed PLA (Figure 6, Table 2b).
On the second heating, the Tm value for the samples obtained using configuration 2 ranged from 149.4 °C to 157.1 °C. The lowest value was obtained for PLA extruded at 210 °C with 400 min−1 screw speed rotation, and the highest for 210 °C, 600 min−1 screw speed rotation. The Tm of the unprocessed PLA was 152.5 °C (Figure 6, Table 2b).
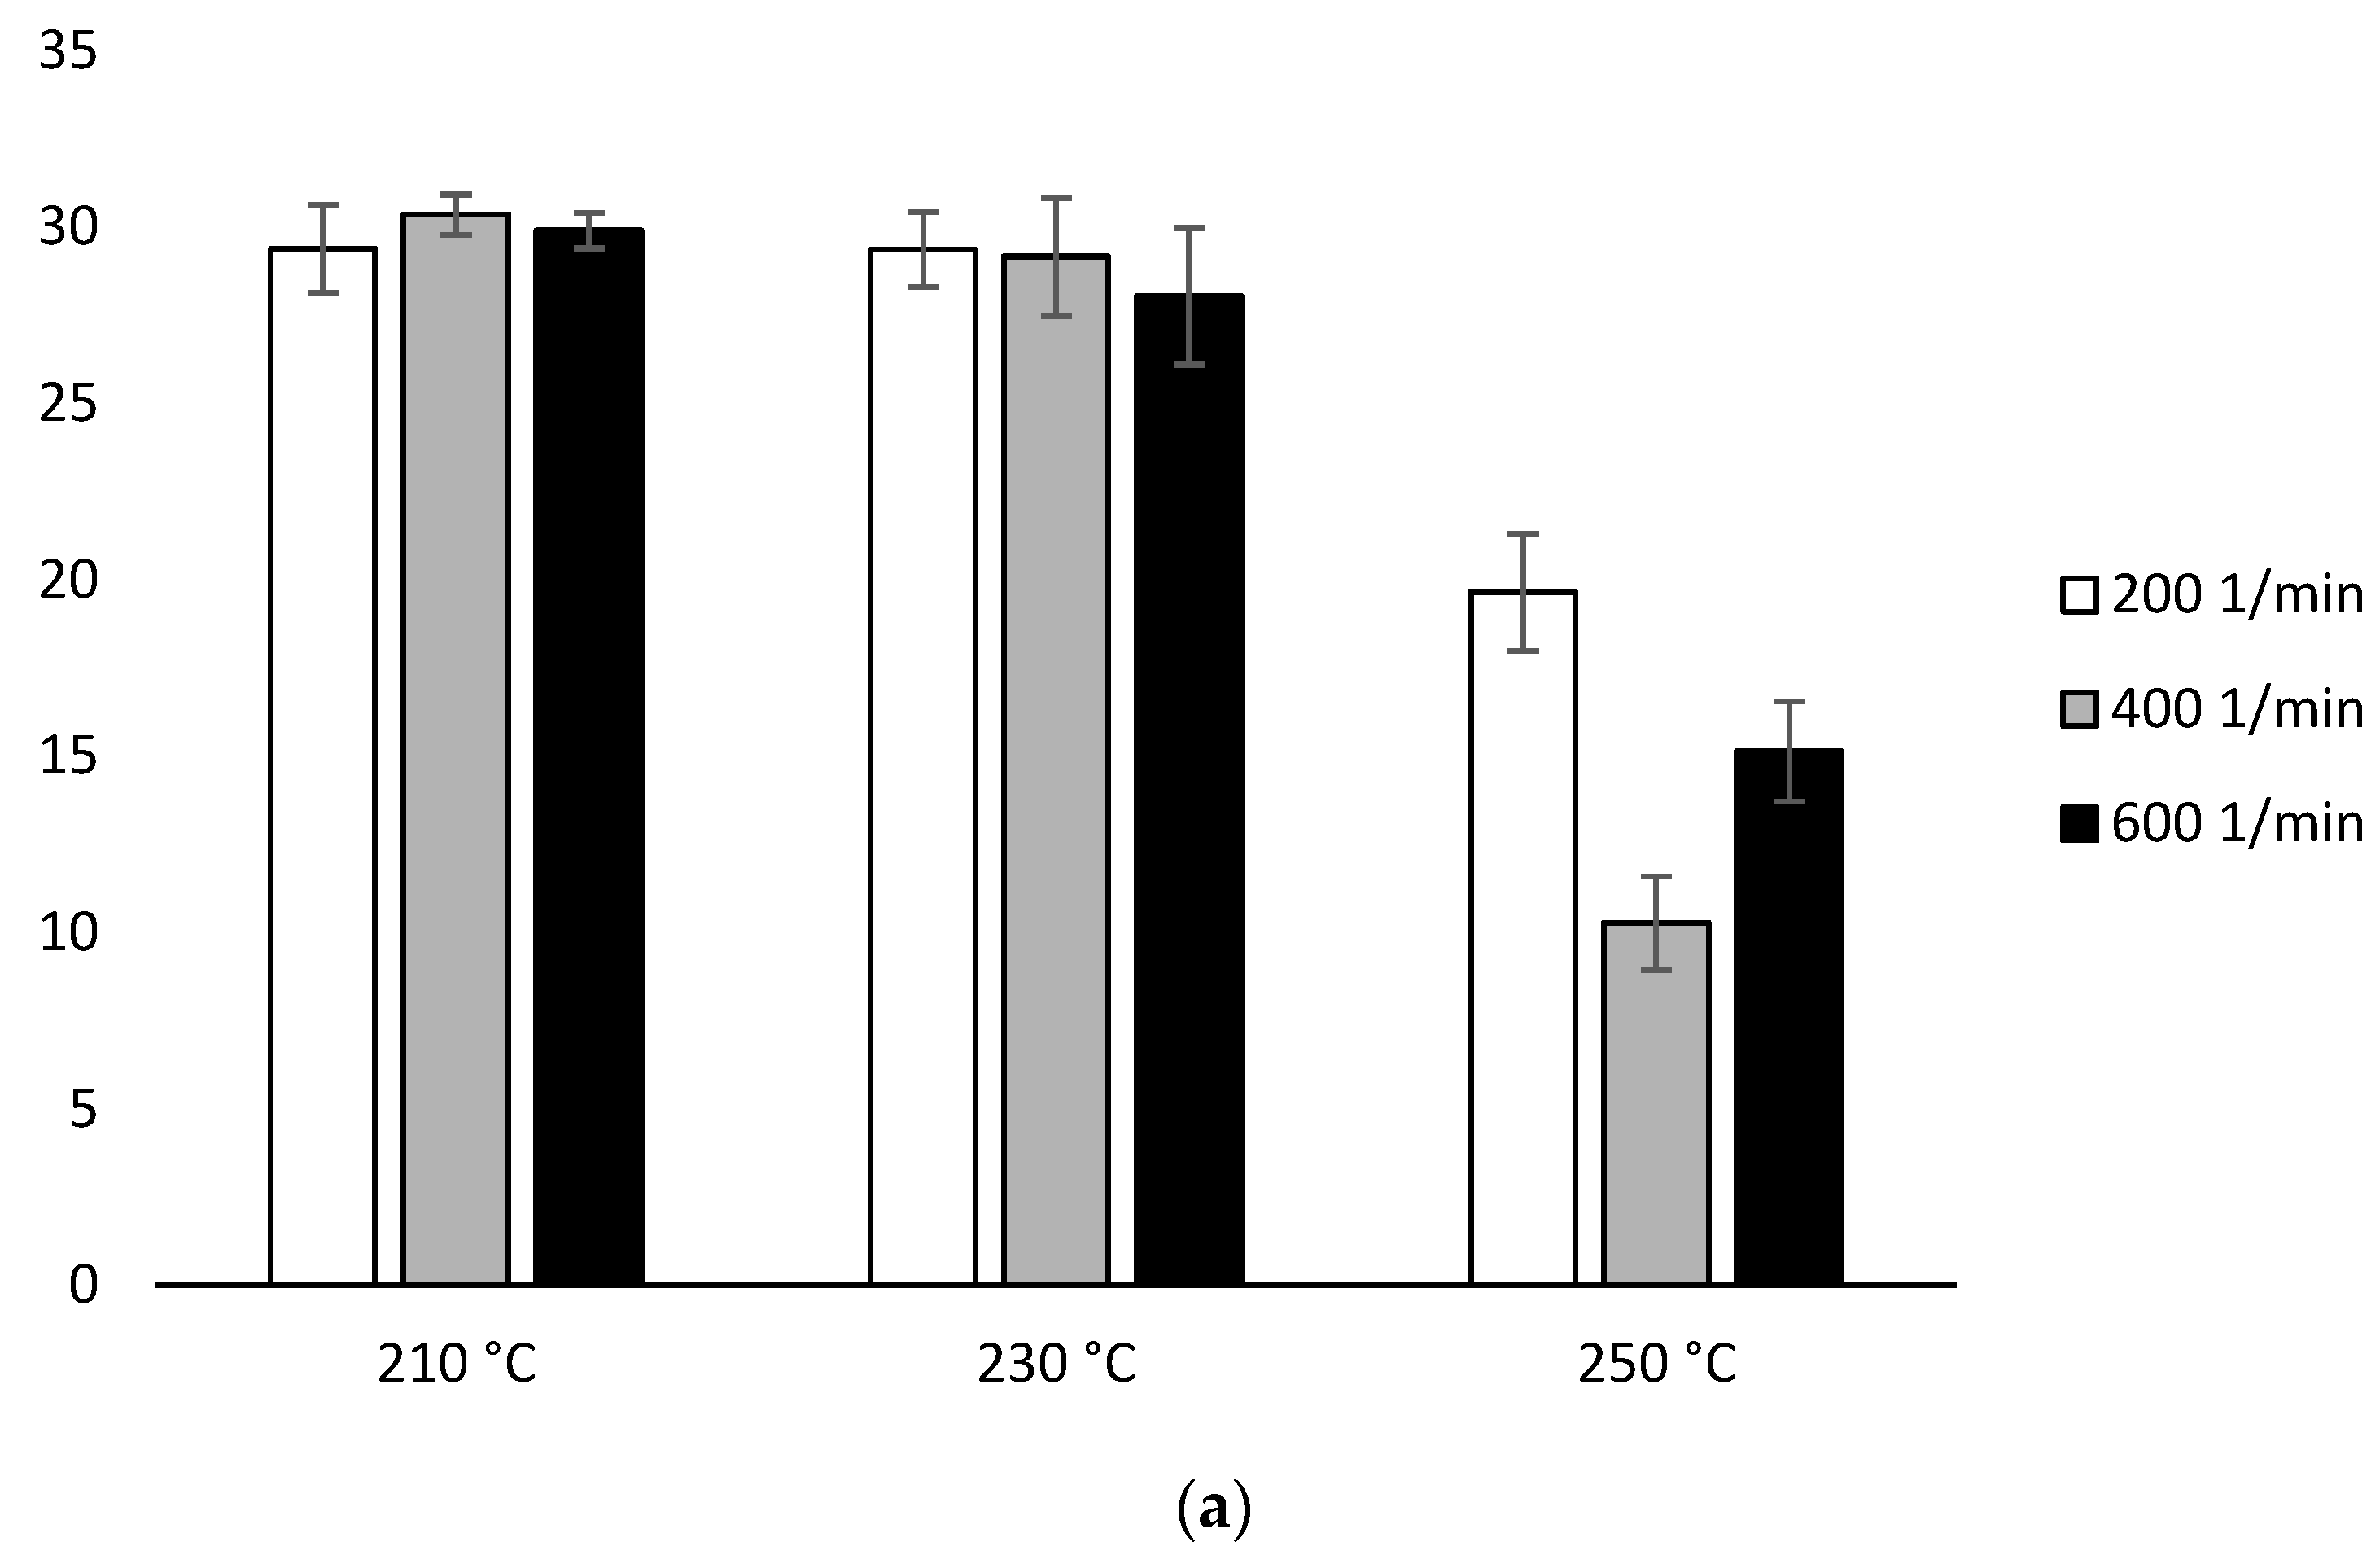
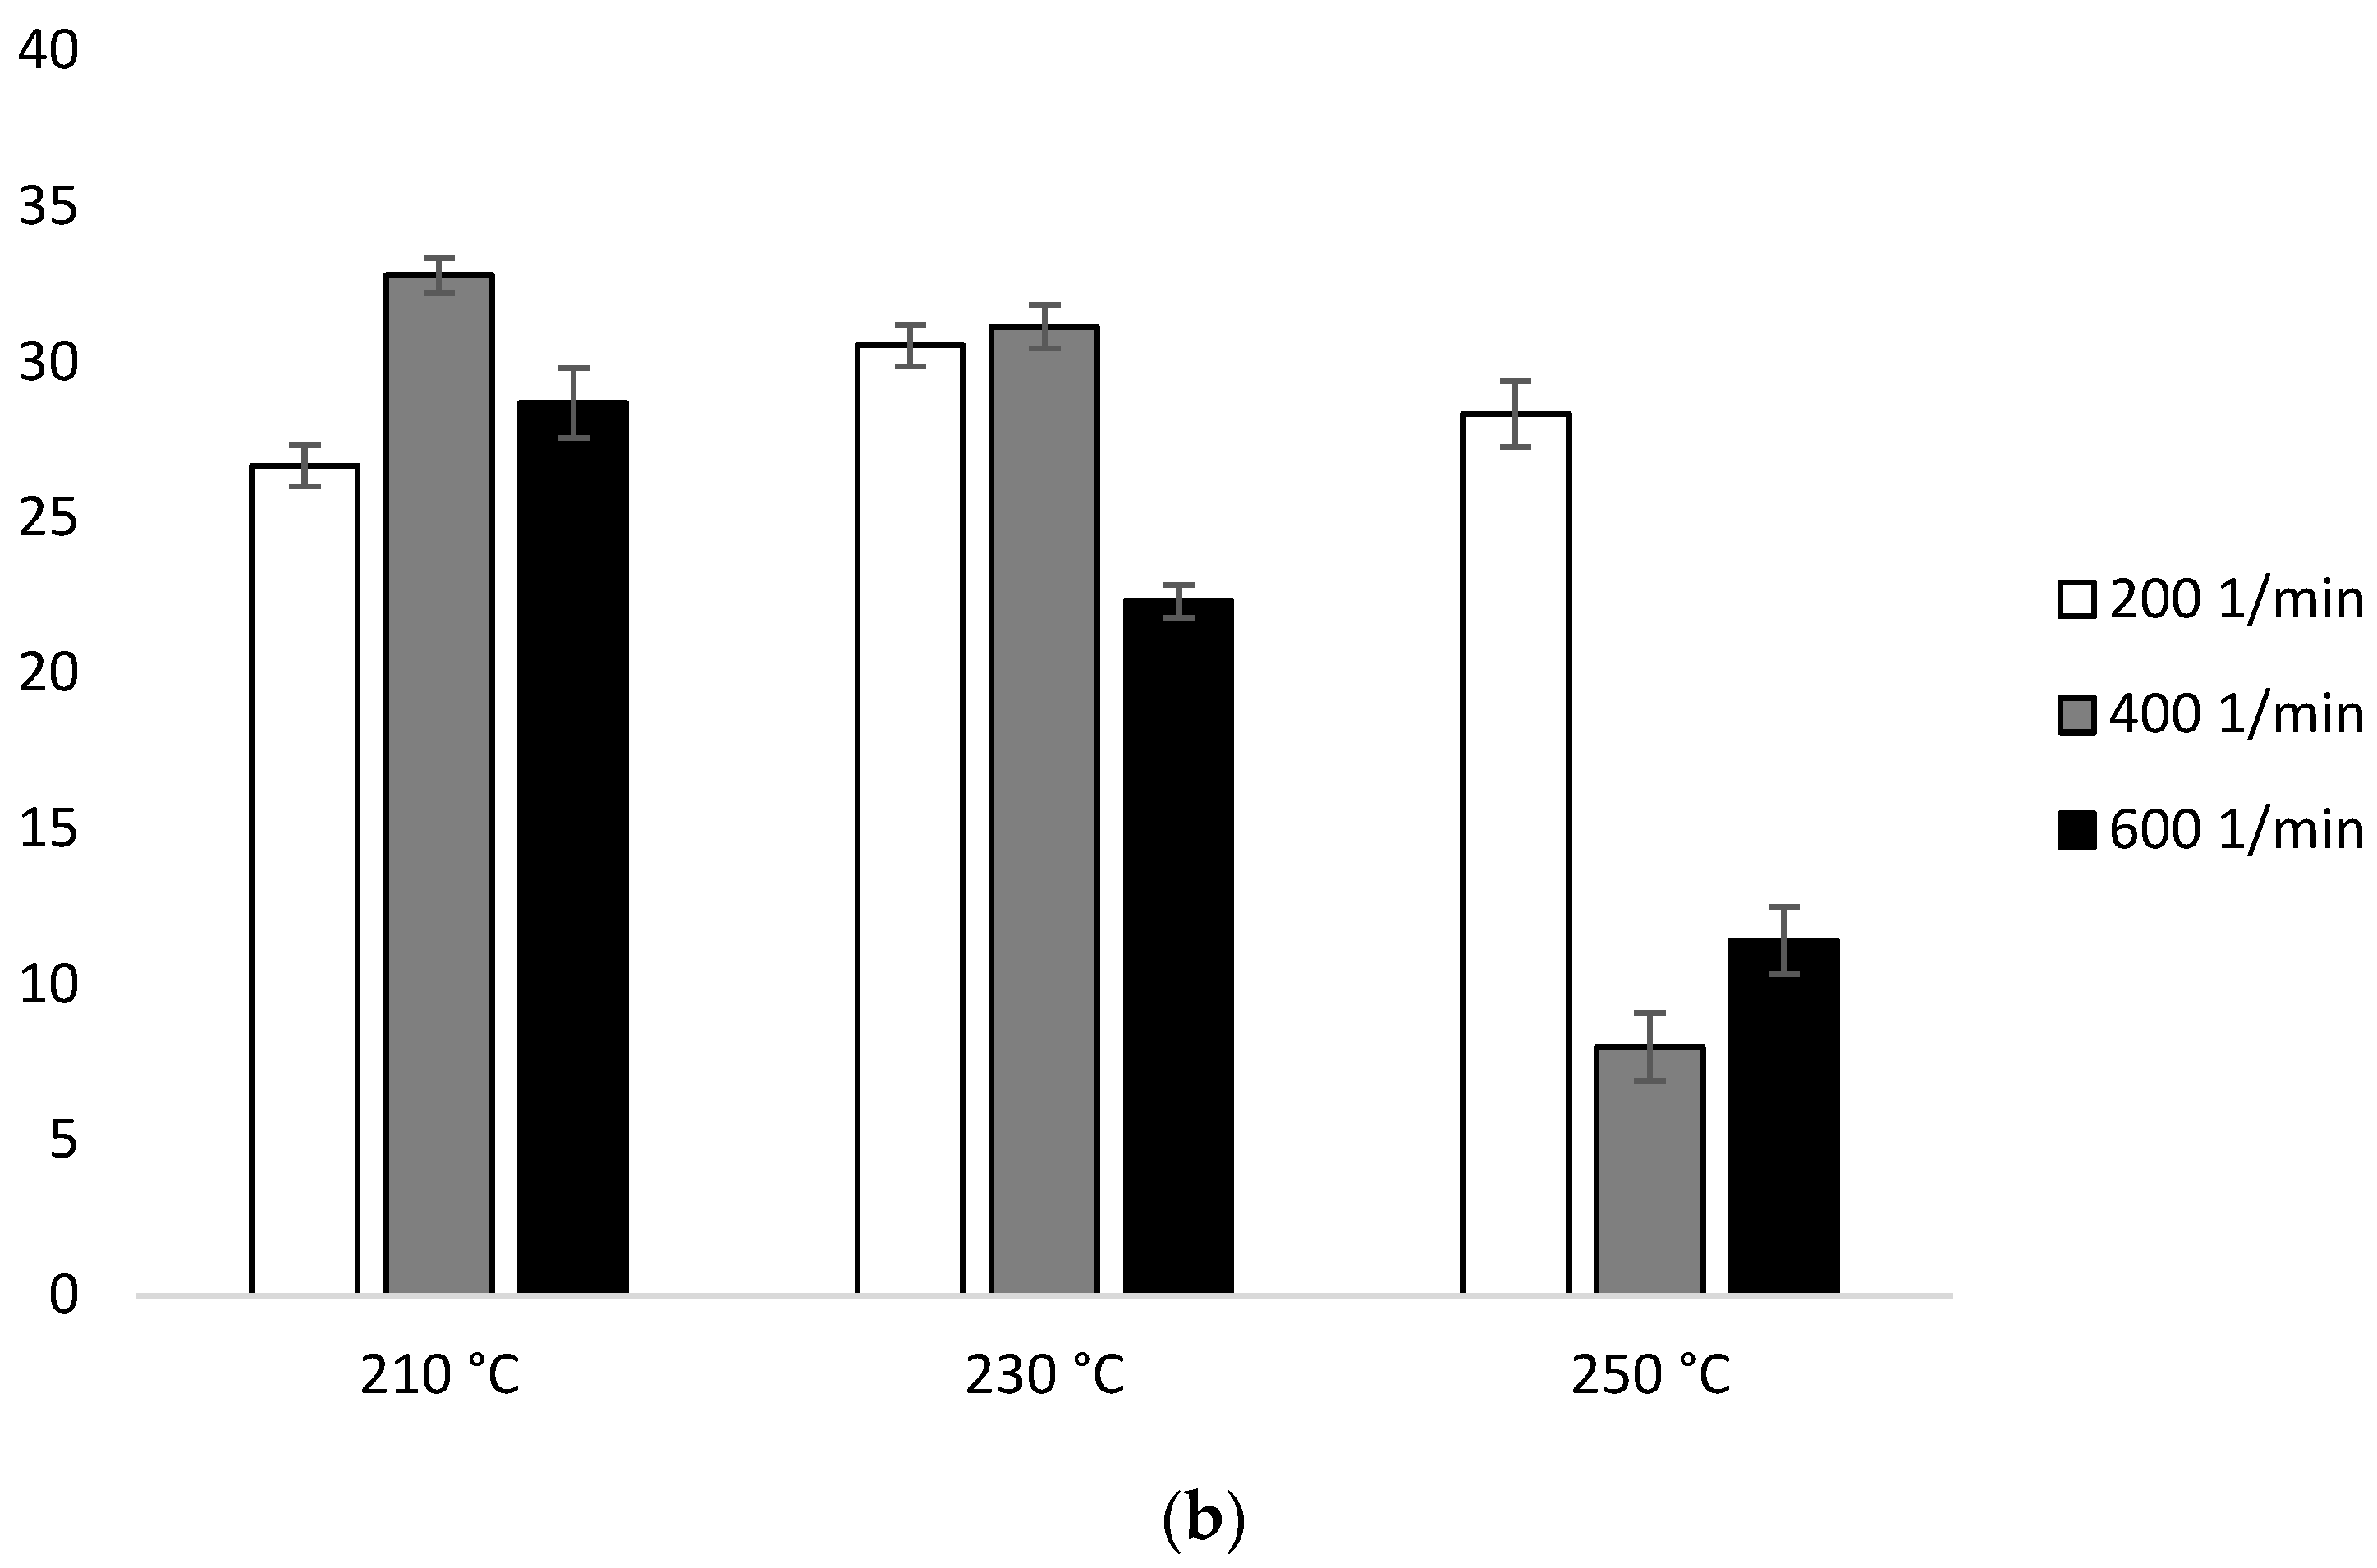
The determined values of ΔHcc (heating 1) for the samples extruded at 210 °C and 230 °C using configuration 1 were in the range of 28.06 J/g–30.24 J/g. A decrease in ΔHcc was observed for the samples extruded at 250 °C. The lowest ΔHcc equal to 9.57 J/g was obtained for sample received under conditions 250 °C/400 min−1. Similar behavior was observed for the samples obtained using configuration 2. The samples extruded at 210 °C and 230 °C showed a similar ΔHcc value. The lowest value equal to 22.67 J/g was obtained for the sample extruded at the temperature of 230 °C with the screw speed of 600 min−1, and the highest 33.14 J/g for the sample 210 °C/400 min−1. On the other hand, for samples extruded at 250 °C, the values decreased, but only for those extruded at a screw rotation speed of 400 min−1 (8.67 J/g) and 600 min−1 (10.74 J/g) (Figure 7, Table 2).
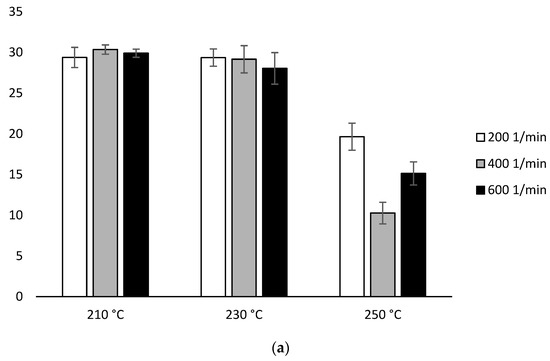
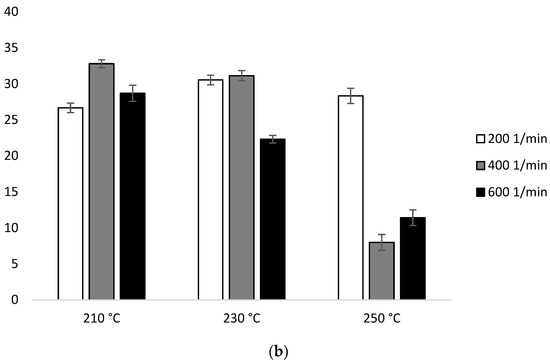
Figure 7.
Enthalpy of cold crystallization (ΔHcc) of heating 1: (a) configuration 1; (b) configuration of 2. Abbreviations: as in Table 1.
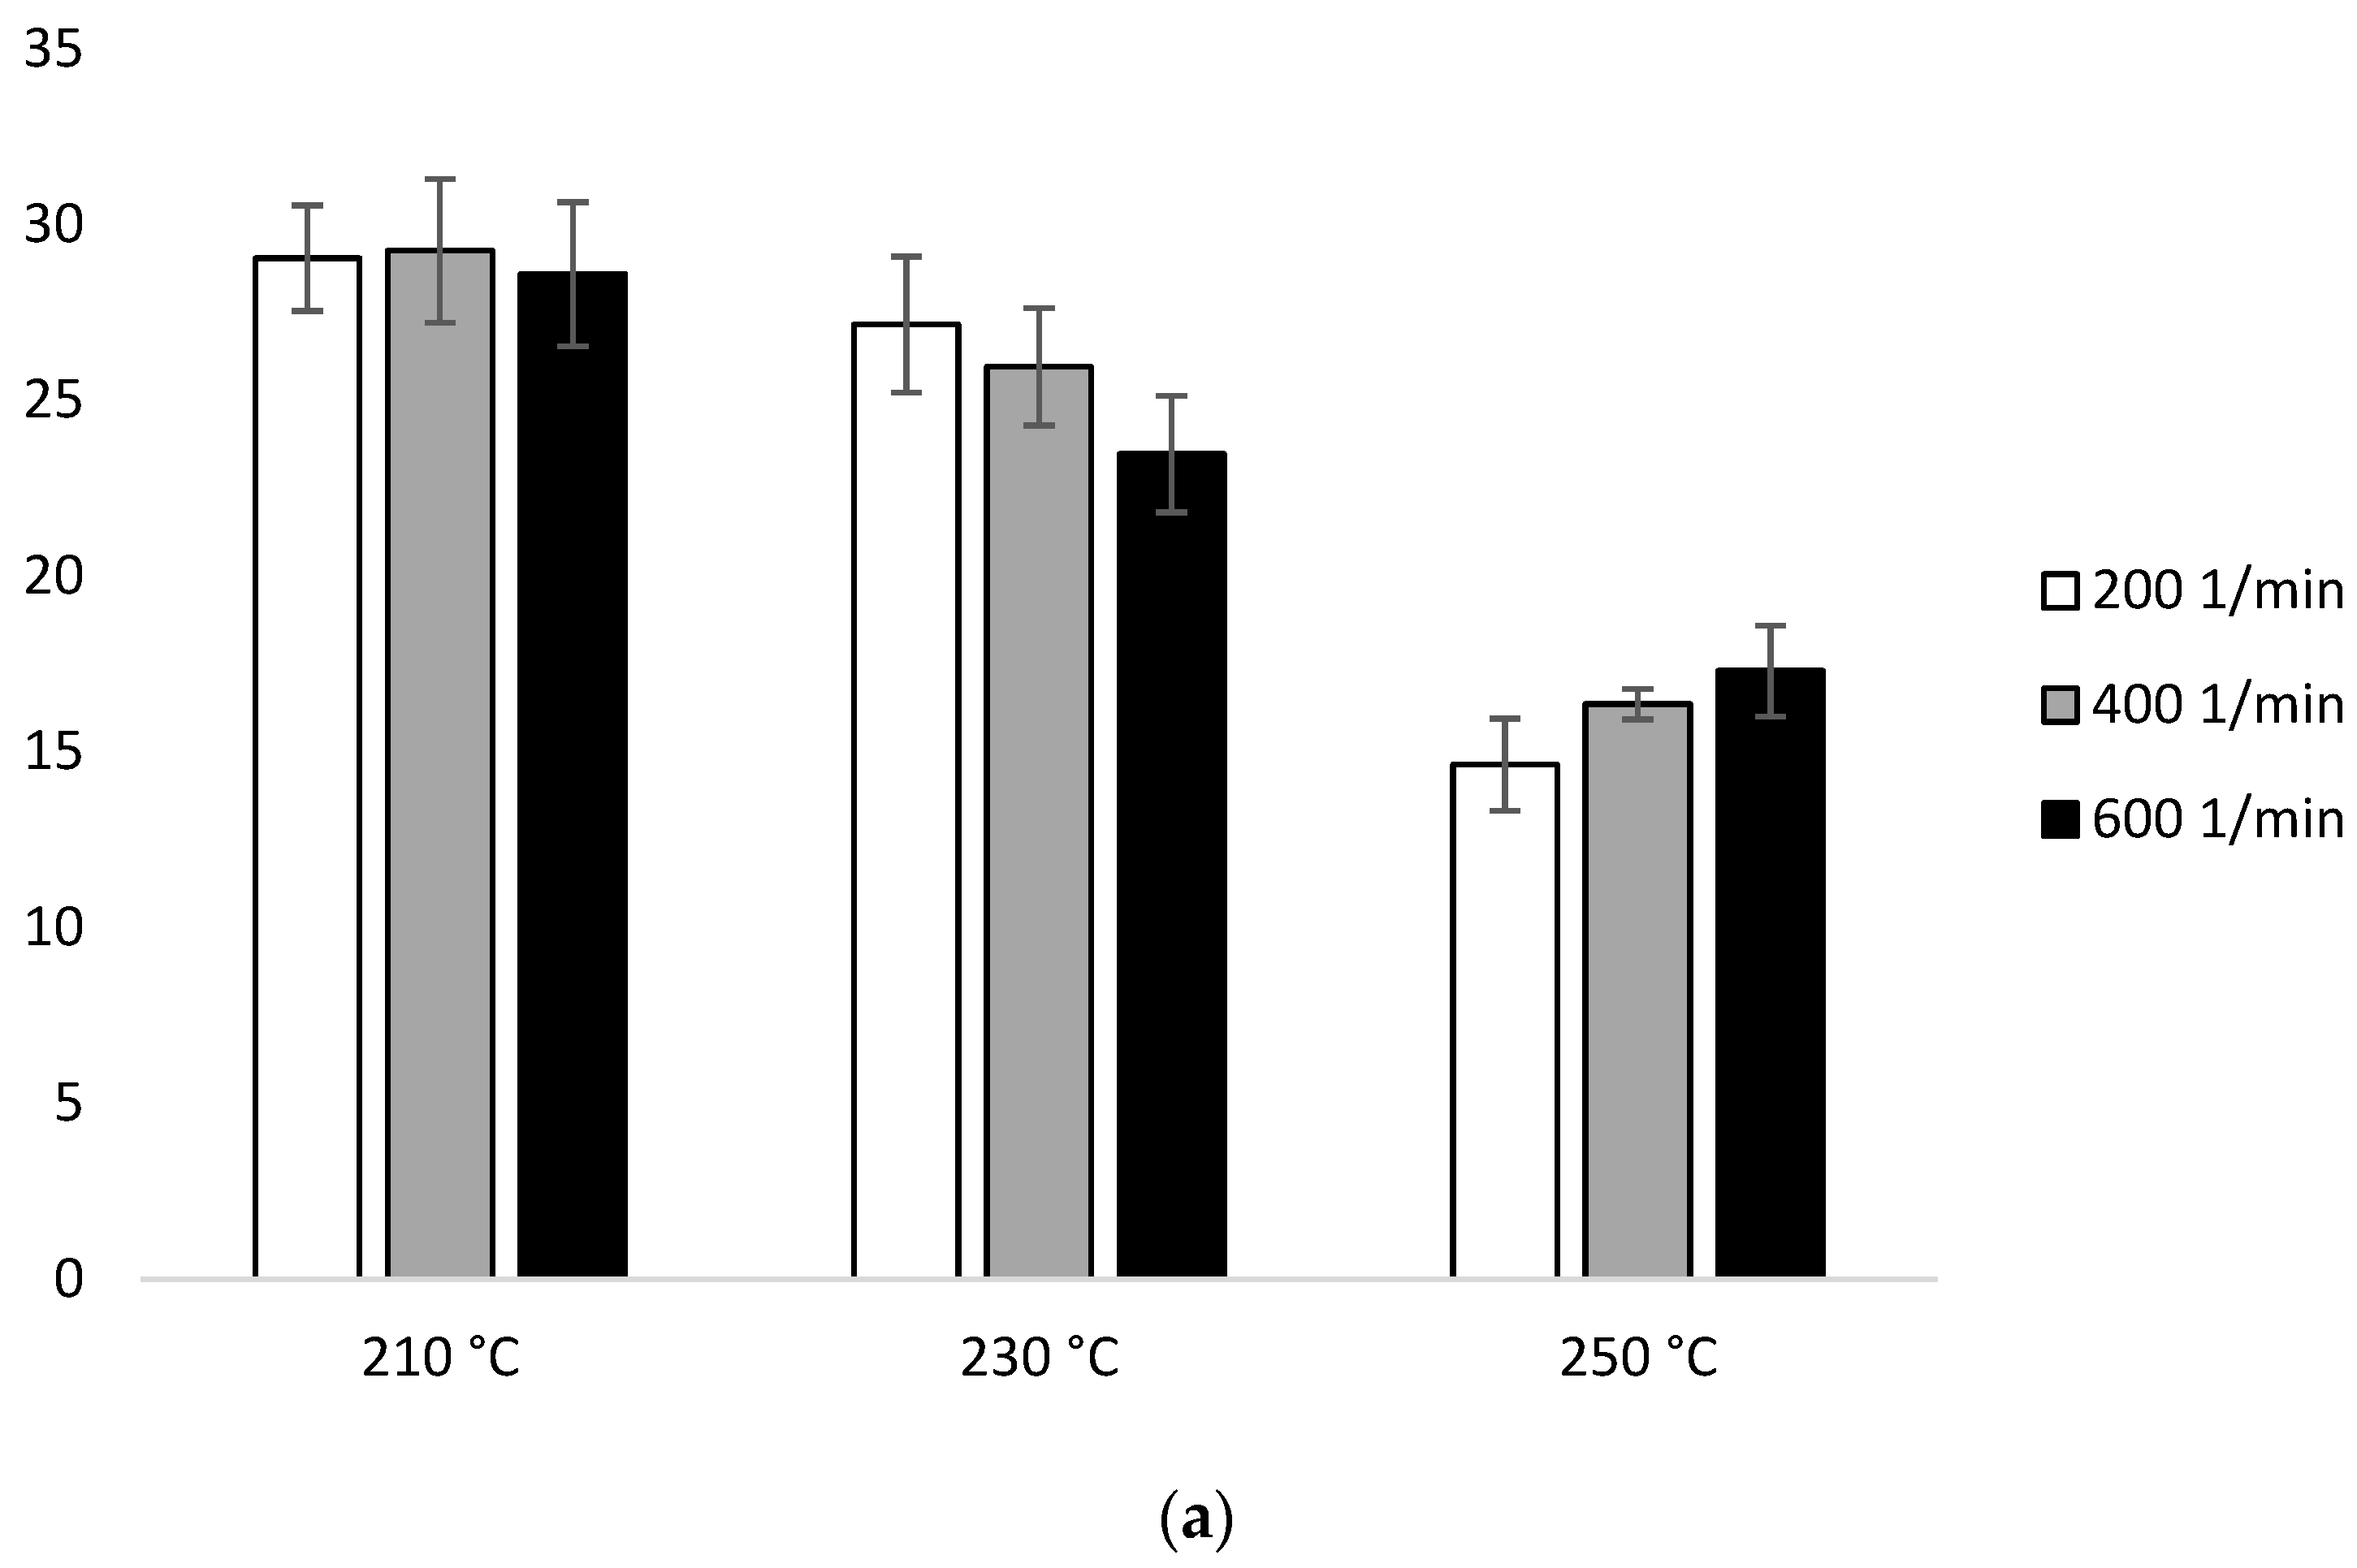
Figure 1 in the first heating ΔHm for the samples extruded at 210 °C was similar (29.04 J/g–28.58 J/g). At 230 °C, ΔHm decreased with the increase of the screw speed (27.15 J/g for 200 min−1, 25.95 J/g for 400 min−1, 23.46 J/g for 600 min−1). Similar trends have been noticed at 250 °C (14.63 J/g for 200 min−1, 16.35 J/g for 400 min−1, 17.29 J/g for 600 min−1). The lowest ΔHm was obtained for the samples extruded at the highest temperature (250 °C) (Figure 8b, Table 2a).
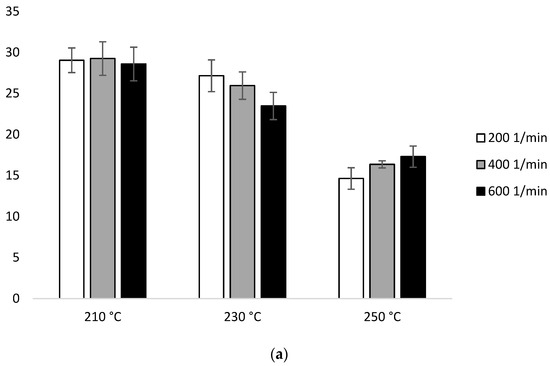
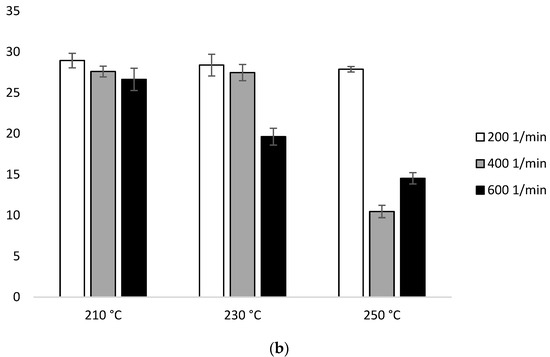
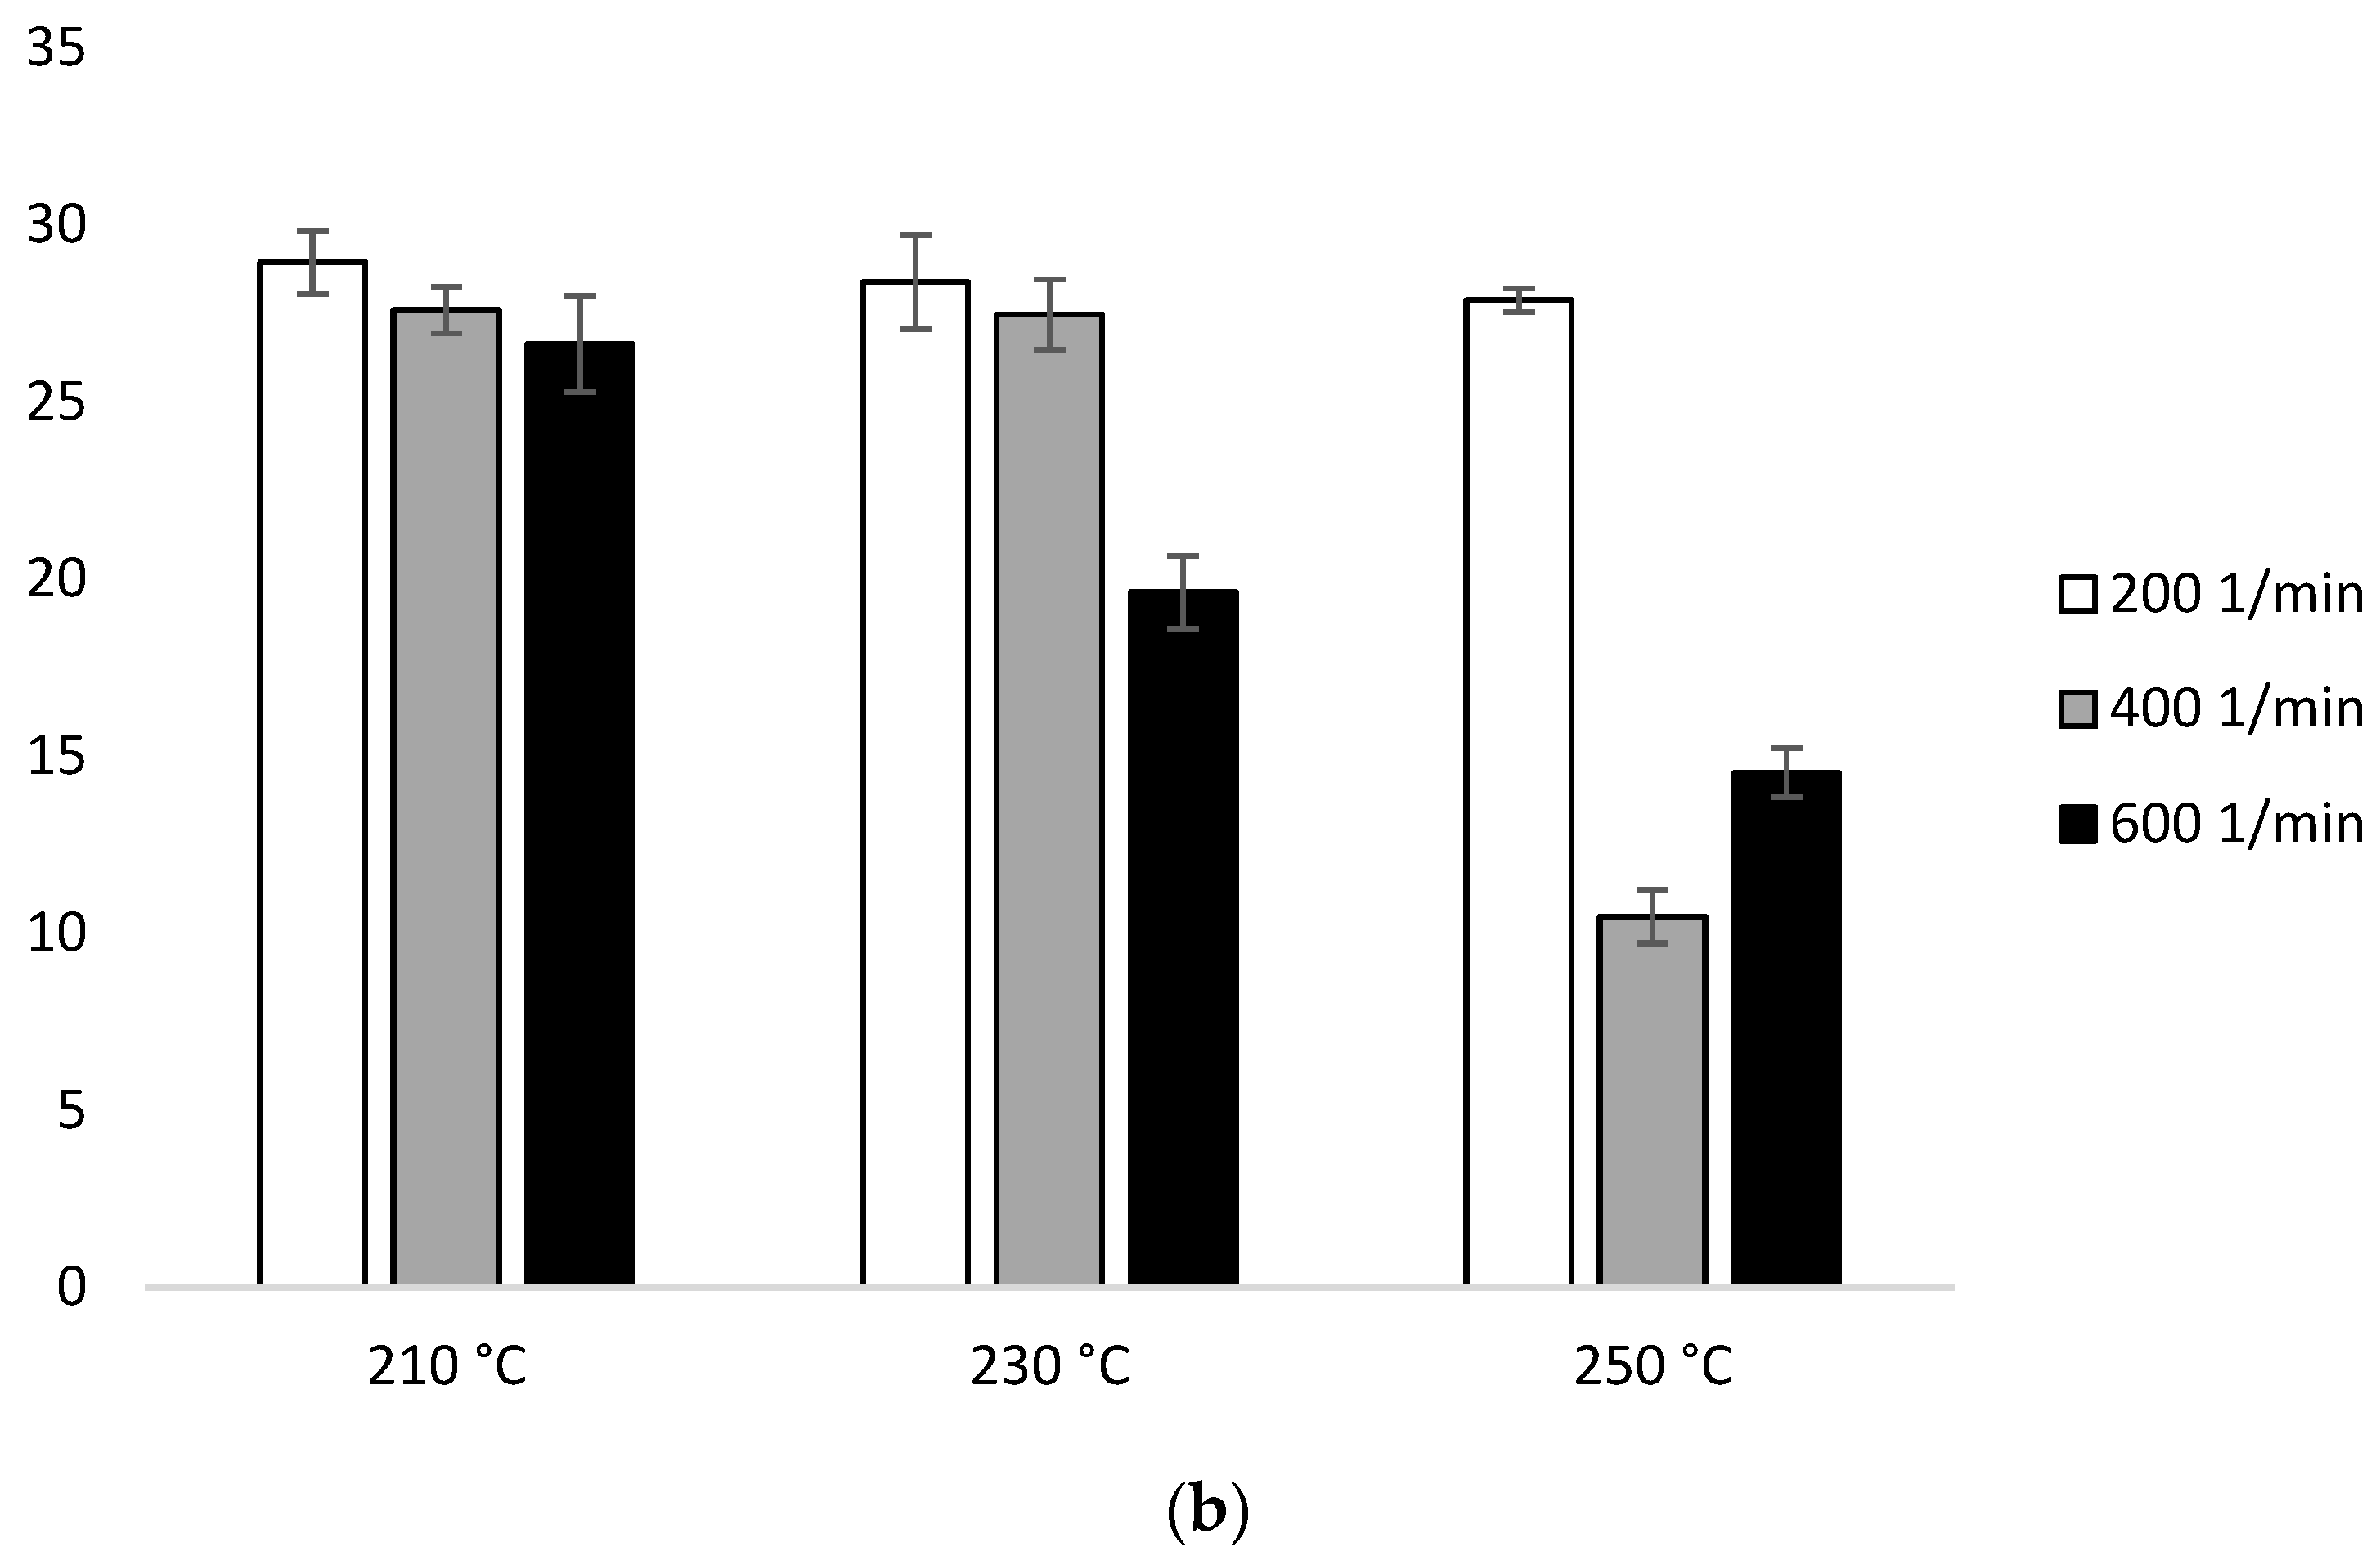
Figure 8.
Enthalpy of melting (ΔHm) of heating 2: (a) configuration 1; (b) configuration of 2. Abbreviations: as in Table 1.
Based on configuration 2 in the first heating, ΔHm does not have great dependence on temperature. At 210 °C, there is a visible decrease with the increase of the screw speed (28.95 J/g for 200 min−1, 27.60 J/g for 400 min−1, 26.63 J/g for 600 min−1). The highest ΔHm was observed for the lowest screw rotation (28.95 J/g for 210 °C, 28.38 J/g for 230 °C, 27.88 J/g for 250 °C). The lowest ΔHm value was recorded for the sample extruded at 250 °C at the speed of 400 min−1 (10.47 J/g) (Figure 8b, Table 2b).
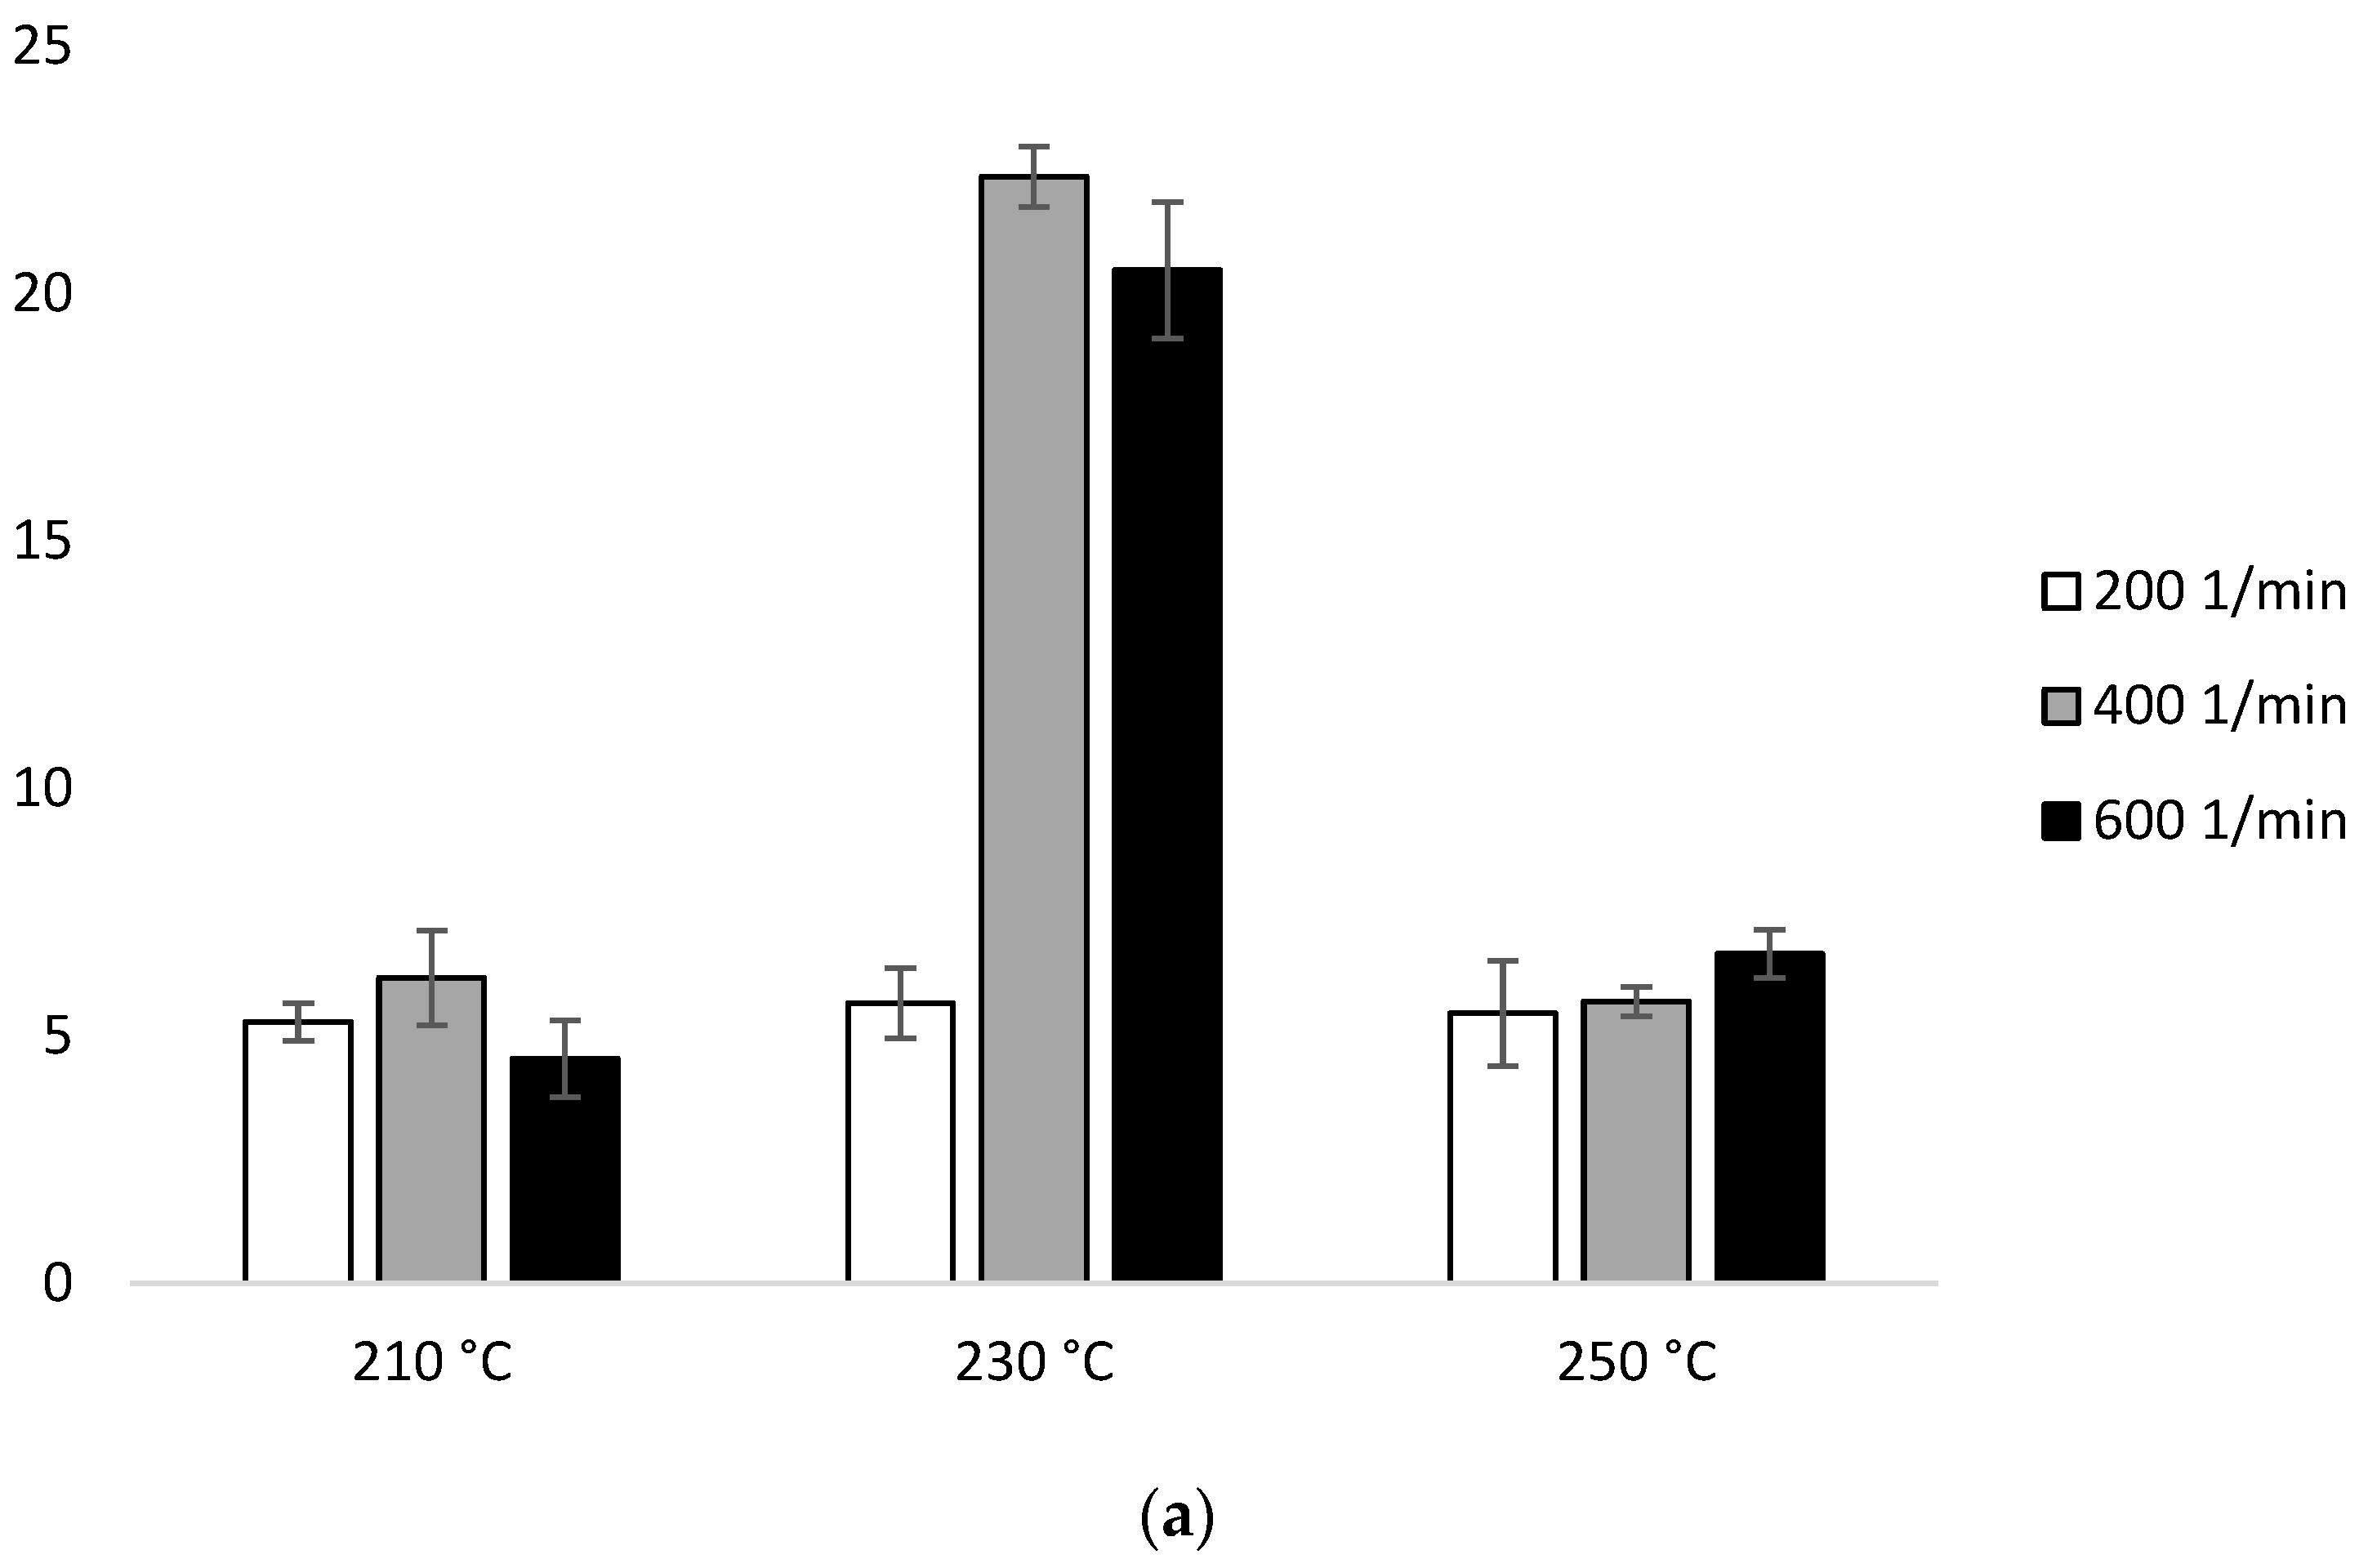
In the second heating scan, configuration 1, the ΔHm values are in the range of 4.54 J/g (210 °C/600 min−1)–6.66 J/g (250 °C/600 min−1). The exception are two samples extruded at 230 °C, which resulted in ΔHm 22.36 J/g (400 min−1) and 20.46 J/g (600 min−1) (Figure 9a, Table 2a).
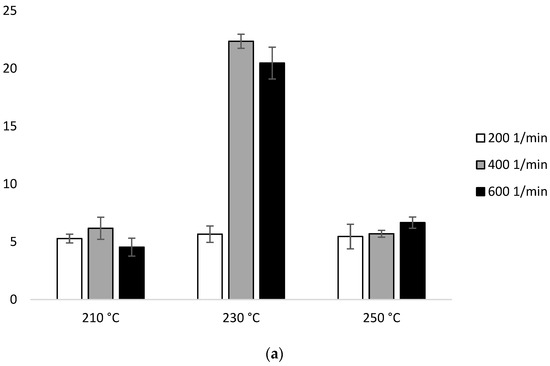
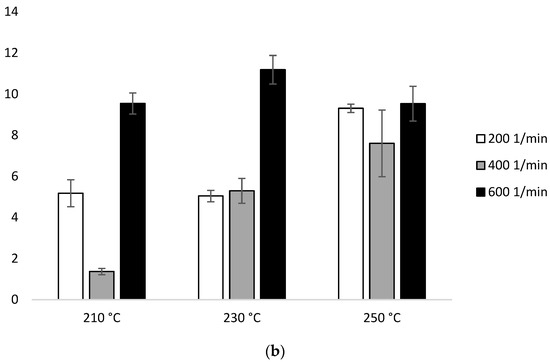
Figure 9.
Enthalpy of melting (ΔHm) of heating 2: (a) configuration 1; (b) configuration 2. Abbreviations: as in Table 1.
In configuration 2, in the second heating, the lowest ∆Hm value was 1.37J/g (210 °C at 400 min−1). On the other hand, the highest value of the measured parameter 11.18 J/g was recorded for 230 °C/600 min−1. A discrepancy between ΔHm and the extrusion temperature or screw speed rotation was found (Figure 9b, Table 2b).
4. Discussion
The developing globalization and consumerism contributed to the introduction of legal regulations on plastic products in the European Union [41]. The used PLA type meets the requirements of the European Commission 10/2011 on plastic materials and products for use in contact with food [42]. On the other hand, because of the SARS-CoV-2 coronavirus pandemic, the production of disposable products which, made of conventional polymer materials, have harmful consequences for the environment, has increased globally [43,44]. Moreover, the production of many products from polymer materials in a brief time, due to the high demand, means that they are often made of a material of lower quality [45]. Since PLA is a biodegradable plastic and is produced from renewable energy sources, its production is forecast to increase by 50% by 2022 compared to 2017 [46]. This is a positive development, although PLA is a material whose properties deteriorate easily during processing, which is pointed out by researchers and producers [47,48,49,50].
To reduce the production of industrial waste generated during processing because of poorly selected parameters of processing processes, it is important to check to what extent individual parameters of the extrusion process affect the degradation of the material. It is important both from the ecological aspect of global importance and from the economic aspect for the producer himself.
During extrusion, the operating mechanisms cause several types of degradation to occur at once, which results in changes in the properties of polymer materials [51,52]. An increase in MFR and a decrease in molecular weight indicate a decrease in the length of the polymer chain because of its breaking into smaller fragments [53,54,55]. Thanks to the MFR assessment, it is possible to assess the level of degradation of the polymer material easily and quickly during processing. The use of DSC is also a practical method, but it does not provide that much information [56,57]. On the other hand, GPC is a sensitive to changes method that allows for detailed analysis of changes at the molecular level, however, from the ecological point of view, compared to other analyses, it is a more harmful method for the environment due to the use of chemicals to conduct research [58,59].
As it was found out, based on the conducted research, the configuration of the screw selected for processing is of fundamental importance. At the same temperature and screw speed, the difference in the values for the parameters evaluated was as high as 550% (for MFR measurements at 250 °C and 600 min−1 screw revolutions). Other parameters are important for the screw configuration used. The increase in temperature by 40 °C for the configuration with two kneading-mixing zones increased the MFR by over 200%, and for the four kneading-mixing zones by 600%. The increase in MFR is associated with a decrease in the viscosity of the polymer material due to mechanical degradation. This is related to the vibration energy of polymer bonds, which increases with temperature, and therefore bonds are more prone to breakage. Additionally, an increase in the extrusion temperature causes oxygen molecules to become more mobile, which favors oxidative degradation [50]. The degradation process was also noticeable when changing the rotational speed of the screw. As it increased, the mass melt flow rate also increased. Signori et al. [20] correlated the increase in rheological parameters with an increase in the degree of crystallinity, and further with the degradation of the material and defragmentation of the polymer chain. Cuadri et al. [60], similarly to our research, found PLA degradation after processing at temperatures above 200 °C. In turn, Taubner et al. [50], investigating different varieties of PLA found that each of them undergoes degradation processes because of processing in the temperature range up to 200 °C, and these changes become more important as temperature rises.
Considering the influence of the processing conditions on the properties of polymeric materials, changes in the MFR value are equivalent to the changes in the Mw value. However, in the degradation process, we observe a decrease in Mw. Our research confirmed this relationship, and the decrease in this parameter was inversely proportional to the increase in temperature and rotational speed of the screw. However, at higher processing temperatures, no differences were found in the results at the screw speed above 200 min−1. This fact can be explained by the shorter residence time of the material in the device at higher revolutions of the screw [61]. Taubner and Shishoo [56] also investigated the effect of twin screw extrusion process parameters at 210 °C and 240 °C at a screw speed of 20 rpm. and 120 rpm. on the properties of PLA. Researchers have shown that the longer residence time of the polymer in the plasticizing system has a much greater impact on changes in its molecular weight than the temperature itself, which confirms our hypothesis. In this analysis, such sizable percentage changes between the values for different screw configurations were not obtained, although the tendency was maintained—the more kneading-mixing zones, the easier it was for uncontrolled material degradation, and the lowest Mw value was obtained for PLA, whose processing conditions were the most demanding. Yu and Wilkes [62] linked similar relationships influencing Mw with the formation of a larger number of polymer chains with a lower molecular weight. This is the same as the results of Kopinke et al. [63], who found that exposure of PLA to elevated temperature under oxidative conditions breaks the chain of alkoxy radicals, resulting in the formation of new free radicals, followed by further breakage of polymer chains.
More detailed conclusions about the structure of a given polymer that can be drawn from GPC studies are provided by PDI analysis. Based on this analysis, it is possible to deduce what chain length the polymer consists of. The obtained results indicated that for PLA processed under the most demanding conditions, the PDI value was close to the original (not extruded) PLA. In the remaining cases, lower values were observed. When using configuration 1, there is a clear increase in PDI with increasing extrusion temperature. The PDI range using this configuration was measured from 1.90 to 2.12. According to Jailani et al. [64,65,66,67], PDI is a measure of molecular weight distribution. However, in the case of the application of configuration 2, such changes were not observed anymore. These samples, in turn, ranged from 2.06 to 2.21, with the value of 2.10 in most cases. This proves that structure 2 produces a broad molecular weight distribution. According to Kim et al., PLA [68] with a higher molecular weight have a more star structure.
The crystallization of PLA depends on the molecular weight and processing conditions [69,70]. Considering the variable processing conditions introduced by us, the observed changes in Tg, Tcc, and Tm were small. No direct correlation of the examined processing parameters with the obtained values was found. As a result of the processes conducted in the main chain, it could have been broken into smaller fragments. The cleavage of the chain can take place anywhere, resulting in the formation of monomers, oligomers, and many chemical compounds. The resulting short chain can join the main chain and form a more spherical molecule due to the attached side chains. Such structural defects do not affect thermal stability [71,72]. The cold crystallization peak is associated with the reorganization of amorphous into crystalline domains, caused by the increased mobility of macromolecules and flexibility of the processed polymer [73]. In our studies for PLA processed using configuration 1 at 230 °C at 600 min−1, and using configuration 210 °C/200 min−1 and 230 °C/400 min−1, a double endothermic peak corresponding to Tm was observed. Ahmed et al. [74] explained that during heating, bimodal thermal changes occur, which are manifested by two endothermic peaks. The two melting peaks are associated with the presence of two types of crystallites of distinct size and disorder. The occurrence of a double melting peak can be attributed to the melting of imperfect crystals and the other to the melting of the remaining crystal fraction [75]. Another explanation for this is the melt-recrystallization mechanism [76].
5. Conclusions
The results of rheological measurements, molecular weight, and thermal properties showed that during extrusion in the presence of a screw with a greater number of kneading-mixing zones, at high temperatures (up to 250 °C), and at a high rotational speed of the screws (600 min−1), PLA LX175 is degraded thermomechanically, which results in a reduced viscosity assessed on the basis of MFR measurements, a reduction in molecular weight, and no thermal changes. The most harmful element influencing a deterioration of the properties of the material is a wrongly selected screw configuration, compared to the temperature and rotation of the screw. Increasing the temperature by an additional 20 °C in the range from 210 °C to 250 °C also causes changes, which are sometimes compensated by increasing the rotation of the screw, as it shortens the residence time of the material in the device. The least harmful to the final properties of PLA LX175 turned out to be extrusion in the presence of a screw with two kneading-mixing zones, at 210 °C and 200 min−1 speed, for which the highest MFR (13.6 g/10 min) and the lowest Mw (170.039 g/mol) were recorded, PDI value equal to 1.96 and Tg 61.3 °C (1st heat) and 58.1 °C (2nd heat), Tcc 114.2 °C (1st heat) and Tcc for 2nd heat not recorded, and Tm 152.9 °C (1st heat) and 151.7 °C (second heat). Moreover, the tests proved that MFR is a fast, cheap, affordable, and uncomplicated method that allows for the initial verification of properties that have been confirmed by other analyses. In summary, the parameters influencing the time that the material remains in the extruder are important for the quality of the final material: the more complicated the screw configuration, the longer the material is exposed to elevated temperature. On the other hand, the higher the temperature, the faster it is thermodegradable. Additionally, the higher the rotational speed of the screw, the more difficult the conditions inside the device. Sometimes, a slight increase in the value of a given parameter affects the physical or thermal properties of the final material. In this study, it was proved that PLA LX175 subjected to higher extrusion throughput, and hence shorter residence times of the material in the device, is more resistant to elevated temperatures. The obtained results provide valuable information on PLA LX175 and its behavior during processing with the extrusion method.
It is important to optimize the processing of polymers to reduce the consumption of a large number of polymers, and that the obtained product is of superior quality, and can be biodegradable or recyclable after use. When selecting processing raw materials, one should also pay attention to what they are obtained from and whether they are biodegradable or recyclable. Conscious processing of macromolecular plastics is an essential element of everyday life and care for our environment. In the longer term, it seems necessary to research other materials as well as the influence of processing conditions on physical and mechanical parameters, such as strength properties, which will allow for further optimization of processing processes.
Author Contributions
Conceptualization, D.K., K.J. and A.S.; Data curation, K.J. and A.R.-K.; Formal analysis, K.J. and A.R.-K.; Investigation, D.K. and K.J.; Methodology, D.K. and A.R.-K.; Project administration, D.K.; Supervision, A.S. and T.L.; Writing—original draft, D.K., K.J. and A.R.-K. All authors have read and agreed to the published version of the manuscript.
Funding
This research received no external funding.
Institutional Review Board Statement
Not applicable.
Informed Consent Statement
Not applicable.
Data Availability Statement
The data presented in this study are available on request from the corresponding author.
Conflicts of Interest
The authors declare no conflict of interest.
References
- Balla, E.; Daniilidis, V.; Karlioti, G.; Kalamas, T.; Stefanidou, M.; Bikiaris, N.D.; Vlachopoulos, A.; Koumentakou, I.; Bikiaris, D.N. Poly (lactic Acid): A versatile biobased polymer for the future with multifunctional properties—From monomer synthesis, polymerization techniques and molecular weight increase to PLA applications. Polymers 2021, 13, 1822. [Google Scholar] [CrossRef] [PubMed]
- Shah, A.A.; Hasan, F.; Hameed, A.; Ahmed, S. Biological degradation of plastics: A comprehensive review. Biotechnol. Adv. 2008, 26, 246–265. [Google Scholar] [CrossRef] [PubMed]
- Zhu, Y.; Romain, C.; Williams, C.K. Sustainable polymers from renewable resources. Nature 2016, 540, 354–362. [Google Scholar] [CrossRef] [PubMed]
- Borrelle, S.B.; Ringma, J.; Law, K.L.; Monnahan, C.C.; Lebreton, L.; McGivern, A.; Murphy, E.; Jambeck, J.; Leonard, G.H.; Hilleary, M.A.; et al. Predicted growth in plastic waste exceeds efforts to mitigate plastic pollution. Science 2020, 369, 1515–1518. [Google Scholar] [CrossRef]
- Lin, Y.; Kouznetsova, T.B.; Chang, C.C.; Craig, S.L. Enhanced polymer mechanical degradation through mechanochemically unveiled lactonization. Nat. Commun. 2020, 11, 1–9. [Google Scholar] [CrossRef]
- McKeown, P.; Jones, M.D. The chemical recycling of PLA: A review. Sustain. Chem. 2020, 1, 1–22. [Google Scholar] [CrossRef]
- Marichelvam, M.K.; Jawaid, M.; Asim, M. Corn and rice starch-based bio-plastics as alternative packaging materials. Fibers 2019, 7, 32. [Google Scholar] [CrossRef]
- Omer, R.A.; Hughes, A.; Hama, J.R.; Wang, W.; Tai, H. Hydrogels from dextran and soybean oil by UV photo-polymerization. J. Appl. Polym. Sci. 2015, 132, 6. [Google Scholar] [CrossRef]
- Siwek, P.; Libik, A.; Twardowska-Shmidt, K.; Ciechańska, D.; Gryza, I. Zastosowanie biopolimerów w rolnictwie. Polimery 2010, 55, 806–811. [Google Scholar] [CrossRef]
- Li, T.; Sun, H.; Wu, B.; Han, H.; Li, D.; Wang, J.K.; Zhang, J.; Huang, J.; Sun, D. High-performance polylactic acid composites reinforced by artificially cultured diatom frustules. Mater. Des. 2020, 195, 109003. [Google Scholar] [CrossRef]
- Omer, R.A.; Hama, J.R.; Rashid, R.S.M. The effect of dextran molecular weight on the biodegradable hydrogel with oil, synthesized by the michael addition reaction. Adv. Polym. Technol. 2017, 36, 120–127. [Google Scholar] [CrossRef]
- Lim, J.Y.; Yuntawattana, N.; Beer, P.D.; Williams, C.K. Isoselective lactide ring opening olymerization using [2] rotaxane catalysts. Angew. Chem. 2019, 131, 6068–6072. [Google Scholar] [CrossRef]
- Chen, Y.; Geever, L.M.; Killion, J.A.; Lyons, J.G.; Higginbotham, C.L.; Devine, D.M. Review of multifarious applications of poly (lactic acid). Polym.-Plast. Technol. Eng. 2016, 55, 1057–1075. [Google Scholar] [CrossRef]
- Naser, A.Z.; Deiab, I.; Darras, B.M. Poly (lactic acid) (PLA) and polyhydroxyalkanoates (PHAs), green alternatives to petroleum-based plastics: A review. RSC Adv. 2021, 11, 17151–17196. [Google Scholar] [CrossRef]
- Sheikh, K.; Shahrajabian, H. Experimental Study on Mechanical, Thermal and Antibacterial Properties of Hybrid Nanocomposites of PLA/CNF/Ag. Int. J. Eng. 2021, 34, 500–507. [Google Scholar]
- DeStefano, V.; Khan, S.; Tabada, A. Applications of PLA in modern medicine. Eng. Regen. 2020, 1, 76–87. [Google Scholar] [CrossRef]
- Kakroodi, A.R.; Kazemi, Y.; Nofar, M.; Park, C.B. Tailoring poly (lactic acid) for packaging applications via the production of fully bio-based in situ microfibrillar composite films. Chem. Eng. J. 2017, 308, 772–782. [Google Scholar] [CrossRef]
- White, J.R. Polymer ageing: Physics, chemistry or engineering? Time to reflect. Comptes Rendus Chim. 2006, 9, 1396–1408. [Google Scholar] [CrossRef]
- Musioł, M.; Sikorska, W.; Adamus, G.; Janeczek, H.; Kowalczuk, M.; Rydz, J. (Bio) degradable polymers as a potential material for food packaging: Studies on the (bio) degradation process of PLA/ (R, S)-PHB rigid foils under industrial composting conditions. Eur. Food Res. Technol. 2016, 242, 815–823. [Google Scholar] [CrossRef]
- Signori, F.; Coltelli, M.B.; Bronco, S. Thermal degradation of poly (lactic acid) (PLA) and poly (butylene adipate-co-terephthalate) (PBAT) and their blends upon melt processing. Polym. Degrad. Stab. 2009, 94, 74–82. [Google Scholar] [CrossRef]
- Celestine, A.D.N.; Agrawal, V.; Runnels, B. Experimental and numerical investigation into mechanical degradation of polymers. Compos. Part B Eng. 2020, 201, 108369. [Google Scholar] [CrossRef]
- Zaldivar, R.J.; Mclouth, T.D.; Ferrelli, G.L.; Patel, D.N.; Hopkins, A.R.; Witkin, D. Effect of initial filament moisture content on the microstructure and mechanical performance of ULTEM® 9085 3D printed parts. Addit. Manuf. 2018, 24, 457–466. [Google Scholar] [CrossRef]
- Ogunsona, E.O.; Misra, M.; Mohanty, A.K. Accelerated hydrothermal aging of biocarbon reinforced nylon biocomposites. Polym. Degrad. Stab. 2017, 139, 76–88. [Google Scholar] [CrossRef]
- Gupta, B.; Revagade, N.; Hilborn, J. Poly (lactic acid) fiber: An overview. Prog. Polim. Sci. 2007, 32, 455–482. [Google Scholar] [CrossRef]
- Tyler, B.; Gullotti, D.; Mangraviti, A.; Utsuki, T.; Brem, H. Polylactic acid (PLA) controlled delivery carriers for biomedical applications. Adv. Drug Deliv. Rev. 2016, 107, 163–175. [Google Scholar] [CrossRef]
- Arrieta, M.P.; Parres, F.; López, J.; Jiménez, A. Development of a novel pyrolysis-gas chromatography/mass spectrometry method for the analysis of poly (lactic acid) thermal degradation products. J. Anal. Appl. Pyrolysis 2013, 101, 150–155. [Google Scholar] [CrossRef]
- Ataeefard, M. Study of PLA printability with flexography ink: Comparison with common packaging polymer. Prog. Color Colorants Coat. 2019, 12, 101–105. [Google Scholar]
- Sinclair, R.G. The case for polylactic acid as a commodity packaging plastic. J. Macromol. Sci. Part A Pure Appl. Chem. 1996, 33, 585–597. [Google Scholar] [CrossRef]
- Rajeshkumar, G.; Seshadri, S.A.; Devnani, G.L.; Sanjay, M.R.; Siengchin, S.; Maran, J.P.; Al-Dhabi, N.A.; Karuppiah, P.; Mariadhas, V.A.; Sivarajasekar, N.; et al. Environment friendly, renewable and sustainable poly lactic acid (PLA) based natural fiber reinforced composites–A comprehensive review. J. Clean. Prod. 2021, 310, 127483. [Google Scholar] [CrossRef]
- Karamanlioglu, M.; Alkan, Ü. Influence of Degradation of PLA with High Degree of Crystallinity on Fungal Community Structure in Compost. Compos. Sci. Util. 2020, 28, 169–178. [Google Scholar] [CrossRef]
- Janczak, K.; Hrynkiewicz, K.; Znajewska, Z.; Dąbrowska, G. Use of rhizosphere microorganisms in the biodegradation of PLA and PET polymers in compost soil. Int. Biodeterior. Biodegrad. 2018, 130, 65–75. [Google Scholar] [CrossRef]
- Dornburg, V.; Faaij, A.; Patel, M.; Turkenburg, W.C. Economics and GHG emission reduction of a PLA bio-refinery system—Combining bottom-up analysis with price elasticity effects. Resour. Conserv. Recycl. 2006, 46, 377–409. [Google Scholar] [CrossRef]
- Rezvani Ghomi, E.; Khosravi, F.; Saedi Ardahaei, A.; Dai, Y.; Neisiany, R.E.; Foroughi, F.; Ramakrishna, S. The life cycle assessment for polylactic acid (PLA) to make it a low-carbon material. Polymers 2021, 13, 1854. [Google Scholar] [CrossRef] [PubMed]
- Karan, H.; Funk, C.; Grabert, M.; Oey, M.; Hankamer, B. Green bioplastics as part of a circular bioeconomy. Trends Plant Sci. 2019, 24, 237–249. [Google Scholar] [CrossRef] [PubMed]
- Mysiukiewicz, O.; Barczewski, M.; Skórczewska, K.; Matykiewicz, D. Correlation between processing parameters and degradation of different polylactide grades during twin-screw extrusion. Polymers 2020, 12, 1333. [Google Scholar] [CrossRef] [PubMed]
- Mroziński, A. Problemy recyklingu tworzyw polimerowych. Inżynieria I Apar. Chem. 2010, 49, 89–90. [Google Scholar]
- ISO: 1133-1:2011; Plasti—Determination of the Melt Mass-Flow Rate (MFR) and Melt Volume-Flow Rate (MVR) of Hermoplastic—Part 1: Standard Method. ISO: Geneva, Switzerland, 2011.
- ISO 11357-1:2016; Plastics—Differential Scanning Calorimetry (DSC)—Part 1: General Principles. ISO: Geneva, Switzerland, 2016.
- ISO 11357-2:2016; Plasti—Differential Scanning Calorimetry (DS)—Part 2: Determination of Glass Transition Temperature and Glass Transition Step Height. ISO: Geneva, Switzerland, 2016.
- ISO 11357-3:2016; Plastics—Differential Scanning Calorimetry (DSC)—Part 3: Determination of Temperature and Enthalpy of Melting and Crystallization. ISO: Geneva, Switzerland, 2016.
- Krawczyk-Walach, M.; Gzyra-Jagieła, K.; Milczarek, A.; Jóźwik-Pruska, J. Characterization of Potential Pollutants from Poly (lactic acid) after the Degradation Process in Soil under Simulated Environmental Conditions. AppliedChem 2021, 1, 156–172. [Google Scholar] [CrossRef]
- Besems, J.; de Mangelaere, L.; Mast, S.; Spits, I. Business Plan; Southern Philippines Argi-Business and Marine and Aquatic School of Technology: Malita, Philippines, 2020. [Google Scholar]
- Leal Filho, W.; Salvia, A.L.; Minhas, A.; Paço, A.; Dias-Ferreira, C. The COVID-19 pandemic and single-use plastic waste in households: A preliminary study. Sci. Total Environ. 2021, 793, 148571. [Google Scholar] [CrossRef]
- Celis, J.E.; Espejo, W.; Paredes-Osses, E.; Contreras, S.A.; Chiang, G.; Bahamonde, P. Plastic residues produced with confirmatory testing for COVID-19: Classification, quantification, fate, and impacts on human health. Sci. Total Environ. 2021, 760, 144167. [Google Scholar] [CrossRef]
- Kakadellis, S.; Harris, Z.M. Don’t scrap the waste: The need for broader system boundaries in bioplastic food packaging life-cycle assessment–A critical review. J. Clean. Prod. 2020, 274, 122831. [Google Scholar] [CrossRef]
- Mangin, R.; Vahabi, H.; Sonnier, R.; Chivas-Joly, C.; Lopez-Cuesta, J.M.; Cochez, M. Improving the resistance to hydrothermal ageing of flame-retarded PLA by incorporating miscible PMMA. Polym. Degrad. Stab. 2018, 155, 52–66. [Google Scholar] [CrossRef]
- Żenkiewicz, M.; Richert, J.; Rytlewski, P.; Moraczewski, K.; Stepczyńska, M.; Karasiewicz, T. Characterisation of multi-extruded poly (lactic acid). Polym. Test. 2009, 28, 412–418. [Google Scholar] [CrossRef]
- Meng, Q.; Heuzey, M.C.; Carreau, P.J. Control of thermal degradation of polylactide/clay nanocomposites during melt processing by chain extension reaction. Polym. Degrad. Stab. 2012, 97, 2010–2020. [Google Scholar] [CrossRef]
- Shojaeiarani, J.; Bajwa, D.S.; Rehovsky, C.; Bajwa, S.G.; Vahidi, G. Deterioration in the physico-mechanical and thermal properties of biopolymers due to reprocessing. Polymers 2019, 11, 58. [Google Scholar] [CrossRef] [PubMed]
- Taubner, V.; Shishoo, R. Influence of processing parameters on the degradation of poly (L-lactide) during extrusion. J. Appl. Polym. Sci. 2001, 79, 2128–2135. [Google Scholar] [CrossRef]
- Simmons, H.; Kontopoulou, M. Hydrolytic degradation of branched PLA produced by reactive extrusion. Polym. Degrad. Stab. 2018, 158, 228–237. [Google Scholar] [CrossRef]
- Al-Itry, R.; Lamnawar, K.; Maazouz, A. Improvement of thermal stability, rheological and mechanical properties of PLA, PBAT and their blends by reactive extrusion with functionalized epoxy. Polym. Degrad. Stab. 2012, 97, 1898–1914. [Google Scholar] [CrossRef]
- Guo, X.; Lin, Z.; Wang, Y.; He, Z.; Wang, M.; Jin, G. In-line monitoring the degradation of polypropylene under multiple extrusions based on Raman spectroscopy. Polymers 2019, 11, 1698. [Google Scholar] [CrossRef]
- Spicker, C.; Rudolph, N.; Kühnert, I.; Aumnate, C. The use of rheological behavior to monitor the processing and service life properties of recycled polypropylene. Food Packag. Shelf Life 2019, 19, 174–183. [Google Scholar] [CrossRef]
- Kwiatkowski, K.; Kwiatkowska, M. Ocena degradacji elastomerów estrowych na podstawie wskaźnika szybkości płynięcia MFR. Inżynieria Mater. 2012, 33, 497–500. [Google Scholar]
- Frick, A.; Rochman, A. Characterization of TPU-elastomers by thermal analysis (DSC). Polym. Test. 2004, 23, 413–417. [Google Scholar] [CrossRef]
- Drzeżdżon, J.; Jacewicz, D.; Sielicka, A.; Chmurzyński, L. Characterization of polymers based on differential scanning calorimetry based techniques. TrAC Trends Anal. Chem. 2019, 110, 51–56. [Google Scholar] [CrossRef]
- Głowińska, E.; Trzebiatowska, P.J.; Datta, J.; Namieśnik, J. Zastosowanie chromatografii żelowej (chromatografii wykluczania) w badaniach polimerów. Anal. Nauka Prakt. 2019, 1, 24–29. [Google Scholar]
- Willett, J.L.; O’connor, K.M.; Wool, R.P. The role of chain scission in fracture of amorphous polymers. J. Polym. Sci. Part B Polym. Phys. 1986, 24, 2583–2589. [Google Scholar] [CrossRef]
- Cuadri, A.A.; Martín-Alfonso, J.E. Thermal, thermo-oxidative and thermomechanical degradation of PLA: A comparative study based on rheological, chemical and thermal properties. Polym. Degrad. Stab. 2018, 150, 37–45. [Google Scholar] [CrossRef]
- Gamon, G.; Evon, P.; Rigal, L. Wpływ wytłaczania dwuślimakowego na morfologię włókien naturalnych i właściwości materiałów w biokompozytach na bazie poli(kwasu mlekowego). Uprawy Prod. Przemysłowe 2013, 46, 173–185. [Google Scholar]
- Yu, T.H.; Wilkes, G.L. Orientation determination and morphological study of high density polyethylene (HDPE) extruded tubular films: Effect of processing variables and molecular weight distribution. Polymer 1996, 37, 4675–4687. [Google Scholar] [CrossRef]
- Kopinke, F.D.; Remmler, M.; Mackenzie, K.; Möder, M.; Wachsen, O. Thermal decomposition of biodegradable polyesters—II. Poly (lactic acid). Polym. Degrad. Stab. 1996, 53, 329–342. [Google Scholar] [CrossRef]
- Jailani, N.; Ibrahim, A.N.H.; Rahim, A.; Hassan, N.A.; Yusoff, N.I.M. Chemical and physical properties of poly (lactic) acid modified bitumen. Ain Shams Eng. J. 2021, 12, 2631–2642. [Google Scholar] [CrossRef]
- Fukuda, T. Fundamental kinetic aspects of living radical polymerization and the use of gel permeation chromatography to shed light on them. J. Polym. Sci. Part A Polym. Chem. 2004, 42, 4743–4755. [Google Scholar] [CrossRef]
- Rogošić, M.; Mencer, H.J.; Gomzi, Z. Polydispersity index and molecular weight distributions of polymers. Eur. Polym. J. 1996, 32, 1337–1344. [Google Scholar] [CrossRef]
- Cooke, D.M.; Shi, A.C. Effects of polydispersity on phase behavior of diblock copolymers. Macromolecules 2006, 39, 6661–6671. [Google Scholar] [CrossRef]
- Korhonen, H.; Helminen, A.; Seppälä, J.V. Synthesis of polylactides in the presence of co-initiators with different numbers of hydroxyl groups. Polymer 2001, 42, 7541–7549. [Google Scholar] [CrossRef]
- Le Marec, P.E.; Ferry, L.; Quantin, J.C.; Bénézet, J.C.; Bonfils, F.; Guilbert, S.; Bergeret, A. Influence of melt processing conditions on poly(lactic acid) degradation: Molar mass distribution and crystallization. Polym. Degrad. Stab. 2014, 110, 353–363. [Google Scholar] [CrossRef]
- Pantani, R.; De Santis, F.; Sorrentino, A.; De Maio, F.; Titomanlio, G. Crystallization kinetics of virgin and processed poly(lactic acid). Polym. Degrad. Stab. 2010, 95, 1148–1159. [Google Scholar] [CrossRef]
- Karalus, W.; Dąbrowski, J.R.; Auguścik, M.; Ryszkowska, J. Właściwości tribologiczne biodegradowalnych poliuretanów o różnej budowie i zawartości segmentów sztywnych. Polimery 2016, 61, 509–518. [Google Scholar] [CrossRef]
- Kosmalska, D.; Kaczmarek, H.; Malinowski, R.; Bajer, K. Postępy w badaniach degradacji termicznej materiałów polimerowych. Cz. II. Wpływ różnych czynników na degradację termiczną materiałów polimerowych podczas ich przetwórstwa. Polimery 2019, 64, 239–314. [Google Scholar] [CrossRef]
- Kaczor, D.; Fiedurek, K.; Bajer, K.; Raszkowska-Kaczor, A.; Domek, G.; Macko, M.; Szroeder, P. Impact of the Graphite Fillers on the Thermal Processing of Graphite/Poly (lactic acid) Composites. Materials 2021, 14, 5346. [Google Scholar] [CrossRef]
- Ahmed, J.; Mulla, M.Z.; Vahora, A.; Bher, A.; Auras, R. Folie kompozytowe z nanopłytek polilaktydowych i grafenowych: Wpływ wysokiego ciśnienia na topografię, właściwości barierowe, termiczne i mechaniczne. Polim. Kompozycje. 2021, 42, 2898–2909. [Google Scholar]
- Wang, Y.; Gómez Ribelles, J.L.; Salmerón Sánchez, M.; Mano, J.F. Morphological contributions to glass transition in poly (L-lactic acid). Macromolecules 2005, 38, 4712–4718. [Google Scholar] [CrossRef]
- Shieh, Y.T.; Liu, G.L. Temperature-modulated differential scanning calorimetry studies on the origin of double melting peaks in isothermally melt-crystallized poly (L-lactic acid). J. Polym. Sci. Part B Polym. Phys. 2007, 45, 466–474. [Google Scholar] [CrossRef]
Publisher’s Note: MDPI stays neutral with regard to jurisdictional claims in published maps and institutional affiliations. |
© 2022 by the authors. Licensee MDPI, Basel, Switzerland. This article is an open access article distributed under the terms and conditions of the Creative Commons Attribution (CC BY) license (https://creativecommons.org/licenses/by/4.0/).


