Article

Microfluidically-Assisted Isolation and Characterization of Achromobacter spanius from Soils for Microbial Degradation of Synthetic Polymers and Organic Solvents

1
Institute for Chemistry and Biotechnique, Department of Physical Chemistry and Microreaction Technology, Technische Universität Ilmenau, 98693 Ilmenau, Germany
2
Group for Probability Theory and Mathematical Statistics, Institute of Mathematics, Technische Universität Ilmenau, 98693 Ilmenau, Germany
*
Author to whom correspondence should be addressed.
Environments 2022, 9(12), 147; https://doi.org/10.3390/environments9120147
Submission received: 28 September 2022 / Revised: 10 November 2022 / Accepted: 15 November 2022 / Published: 22 November 2022
(This article belongs to the Special Issue Soil Remediation)

Abstract

:
A micro segmented-flow approach was utilized for the isolation soil bacteria that can degrade synthetic polymers as polyethylene glycols (PEG) and polyacrylamide (PAM). We had been able to obtain many strains; among them, five Achromobacter spanius strains from soil samples of specific sampling sites that were connected with ancient human impacts. In addition to the characterization of community responses and isolating single strains, this microfluidic approach allowed for investigation of the susceptibility of Achromobacter spanius strains against three synthetic polymers, including PEG, PAM, and Polyvinylpyrrolidone (PVP) and two organic solvents known as 1,4-dioxane and diglyme. The small stepwise variation of effector concentrations in 500 nL droplets provides a detailed reflection of the concentration-dependent response of bacterial growth and endogenous autofluorescence activity. As a result, all five strains can use PEG600 as carbon source. Furthermore, all strains showed similar dose-response characteristics in 1,4-dioxane and diglyme. However, significantly different PAM- and PVP-tolerances were found for these strains. Samples from the surface soil of prehistorical rampart areas supplied a strain capable of degradation of PEG, PVP, and PAM. This study demonstrates on the one hand, the potential of microsegment flow for miniaturized dose-response screening studies and its ability to detect novel strains, and on the other hand, two of five isolated Achromobacter spanius strains may be useful in providing optimal growth conditions in bioremediation and biodegradation processes.

1. Introduction

Polymers have become an important part of human society due to their lightness, durability, inertness, and low cost [1]. They are used in many fields, from industry to medicine and agriculture to our daily lives [2]. At the same time, non/slow biodegradation of polymers has caused them to accumulate in water and soil, posing a serious threat to the environment [3,4,5]. The microbial degradation of hydrocarbons, polymers, and other synthetic substances is highly important for reducing artificial contaminants in water and soil. In addition, the ability of metabolizing of such substances is of interest for waste treatment, recycling, and extension of strategies for material reuse. In addition to other microorganisms, bacteria of the genus Achromobacter have come into the focus of interest for degradation of environmental endangering technical substances. Thus, Achromobacter was found usable for the remediation of industrial soils contaminated by polycyclic aromatic compounds [6]. A strain of A. xylosoxidans showed the ability to grow on polyethylene [7]. Achromobacter strains can also metabolize halogenated solvents as dichloroethylene, which was successful in the cultivation in presence of benzene [8]. Achromobacter strains have also been applied to degrade complex mixtures of vegetable oil and PVC [9] and of synthetic copolymers [10]. The ability of Achromobacter strains for metabolization of synthetic polymers as well as oil are also promising for bioproduction. A strain of this genus has also been used, for example, for the biosynthesis of glycolipids [11].
The exposition of bacterial strains against poisonous substances and their degradation is mostly dependent on the applied concentrations. Therefore, the knowledge about the concentration-dependent response of bacteria to substances for degradation is of interest. It has been shown in the past that a droplet-based microfluidic approach is particularly suited for the evaluation of quantitative effects of different substances on the growth of bacteria and other microorganisms [12,13]. In particular, the micro-segmented flow technique was applied for the investigation of the toxicity of metal nanoparticles [14], heavy metal ions [15], phenolic uncouplers [16], and antibiotics [17].
This microfluidic technique is also suited for empirically evaluating unknown microbial communities. It allows for identifying response classes dependent on the concentration of chemical stress factors [18], and can reflect differences in the stochastic pattern of microbial responses. In a recent study, it was used to compare heavy metal tolerance of different strains of Rhodococcus erythropolis isolated from soil samples of various historical places, with ancient mining places and archaeological excavation sites among them [19]. In particular, places with ancient human activities are promising in searching for unique compositions of soil microbial communities and interesting new microbial strains. On the one hand, human impacts such as settlement, cattle breeding, handcraft, mining, and metallurgy are accompanied by a displacement of ground and surface material, as well as the mixing of natural soils by waste and byproducts and relicts of everyday life. This leads to a change in the local ecological conditions for the development of soil microbial communities. On the other hand, special changes in chemical situations can have a strong impact on physiological stress factors—for example by changing pH, humidity, heavy metal ions, and other accumulated or artificially produced toxic substances. These changes in stress conditions can lead to the development and selection of strains with special metabolic and tolerance features [20,21]. Therefore, the micro-segmented flow strategy is applied to isolate and investigate the behavior of Achromobacter strains against selected synthetic polymers and organic solvents.

2. Materials and Methods

2.1. Soil Sample Preparation

2.1.1. Soil Samples Description

Five soil samples from Thuringia have been selected for the experiments (Table 1). Three soil samples (P3, Q16 and Q45) were collected from ancient copper mining areas in Thuringia. One sample is from a prehistorical rampart (B46), and one sample is from buried wet soil of a medieval suburb area of the city of Jena and has been collected during an archaeological excavation (HB46).
These five soil samples were air-dried under sterile conditions in the laboratory. One gram of soil was then mixed with 15 mL AM media and vortexed thoroughly. This was followed by centrifugation at 200× g for 20 min and filtration of the supernatant through a filter paper to remove excess soil particles and retain bacterial spores and vegetative bacteria. Finally, cycloheximide was added to give a final concentration of 75 mg/L to prevent the growth of soil-derived fungi in droplets.

2.1.2. Next Gen Sequencing of Soil Samples

All soil samples have been investigated by NGS (Illumina) and the protocol was as follows. Total DNA was first isolated from 250 mg of soil sample using the Power Soil Isolation Kit (MO BIO, Carlsbad, CA, USA), and then the DNA was purified according to the supplier’s instructions. Next, 1 µL of DNA-containing eluate from the Power Soil DNA extraction was used for PCR. Modified variants of the Oligonucleotides S-D-Arch-0519-A-S-15 (A519F: 5′-CAGCMGCCGCGGTAA-3′) and S-D-Bact-0785-a-A-21 (Bact_805R: 5′-GACTACHVGGGTATCTAATCC-3′) were obtained from Eurofins Genomics (Ebersberg, Germany) in a concentration of 100 pmol/µL. These primer variants were in each case supplemented at the 5′ end of their sequences with Illumina adaptor overhangs as described in Illumina’s 16S sample preparation guide. Thus, the sequence of the final forward adaptor primer A519F-Ad had the sequence 5′-TCGTCGGCAGCGTCAGATGTGTATAAGAGACAGCAGCMGCCGCGGTAA-3′ and the reverse adaptor primer Bact_805R-Ad had the sequence 5′-GTCTCGTGGGCTCGGAGATGTGTATAAGAGACAGGACTACHVGGGTATCTAATC.
PCR amplification of the desired 16S rRNA fragments was performed in an Edvocycler (Edvotek, Washington, DC, USA) in the following steps: 94 °C for 5 min, 30 cycles of denaturation at 94 °C for 30 s; annealing at 50 °C for 30 s; extension at 72 °C for 30 s; and a final extension at 72 °C for 5 min. The total volume of each reaction mixture was 50 µL and contained 1 µL of template solution, 2 mM MgCl2, 200 µM PCR nucleotide mix, 1.25 units GoTaq G2 Flexi DNA Polymerase, nuclease free water (all reagents from Promega, Madison, MI, USA), and 1 µmol/L of each primer. The amplified DNA fragment (353 bp) was confirmed with gel electrophoresis for its presence. It was then possible to purify them using AMPure XP Beads (Beckman Coulter, Brea, CA, USA) according to the manufacturer’s instructions. Finally, the prepared 16S rRNA fragments of these soil samples were sent to Microsynth AG for carrying out next generation sequencing on an Illumina HiSeq system.
The analysis of sequences was all through an automatic software pipeline of SILVAngs data analysis service (https://www.arb-silva.de/ngs/, accessed on July 2020). First the received complete data files from Microsynth AG had to be converted from fastq file format to fasta file format. Therefore, the fastq-to-fasta converter software “phred33 conversion” from MR DNA Lab (www.mrdnalab.com/, accessed on July 2020) was used. Then the preset parameters of the setup page and the SILVAngs database release version 128 were analyzed for all data sets. Finally, a complete table the number of reads for all detected operational taxonomical units (OTUs) was available.

2.2. Chemicals and Medium

For the isolation process, modified AM minimal medium were utilized (0.2 g/L asparagine, 0.5 g/L K2HPO4, 0.2 g/L MgSO4·7H2O, 0.01 g/L FeSO4·7H2O and 4 g/L glucose). For the screening experiment, AM medium without glucose was used (Table 2). To obtain pure cultures of bacterial strains, AM agar (same medium content and 20 g/L agar) was used.
For the experiment, the following chemicals were used: polyethylene glycol 600 (PEG) (Merck), Polyvinylpyrrolidone 40 kDa (PVP) (Sigma-Aldrich, Taufkirchen, Germany), polyacrylamide 10 kDa (PAM) (Sigma-Aldrich), 1,4-dioxane (Grüssing, Filsum, Germany); diglyme (Merck, Darmstadt, Germany), Cycloheximide was obtained from BioChemica (Düsseldorf, Germany). Perfluoromethyldecalin (PP9) from F2 Chemicals Ltd. (Preston, UK) was used as carrier media. An overview of the concentration range of all tested effectors for 1D screening experiments is shown in Table 2.

2.3. Microfluidic Cultivation Procedure

The selection process chain and the isolation procedures have been described in detail in our earlier work [19]. The soil slurry obtained was used as the initial inoculum for the microfluid experiment. Therefore, the principle of stochastically confined reduced communities was applied to generate sequences with the addition of PEG or PAM of about 500 droplets (Figure 1).
A 6-port manifold was used to generate microfluidic segments [22]. To investigate the dose-response relationships of the effectors, a LabVIEW control program was used to generate a highly resolved concentration gradient. This was achieved by increasing the amount of effector (flow rate from 0–32 µL/min) was compensated by decreasing the amount of incubation medium (flow rate from 32–0 µL/min). The flow rate of the soil slurry inoculum or cell suspension was then maintained at 32 µL/min, while the carrier liquid was transported with a constant flow rate of 136 µL/min, resulting in a total flow rate of 200 µL/min. These generated segments were transported at a constant flow rate via a transparent FEP tube and through a detection unit containing a flow-through photometer and a flow-through fluorimeter. Here, a photometer with a peak wavelength of 470 nm was used to simultaneously measure scattering and monitor the quality of the generated sequence. A 405 nm laser diode (Changchun New Industries Optoelectronics, Changchun, China) combined with a combination of a shortpass (405 nm) and longpass filters (425 nm) (Laser Components, Olching, Germany) was used to monitor the autofluorescence of bacteria. Counting of emitted photons was performed by a photomultiplier module (Hamamatsu, Japan). From this, we were able to monitor the segment volume, the segment distance between two neighbor segments and the segment number, as well as to calculate error correction in case of segment-loss or -fusion due to the long cultivation time or re-measurement processes. Finally, PTFE tube coils with a length of 4.2 m (0.5 mm ID, 1.0 mm OD) were used to storage and incubate the segment sequences.
After 35-day cultivation time inside droplets under 21 °C, the droplet sequence was transported to AM-Agar plate. After that, the reduced communities at higher concentration of effector were applied on agar plates using the streak plate method in order to isolate single bacterial strains. Finally, these isolates were characterized by highly resolved dose-response screenings against various water-soluble polymers and organic solvents using the microfluid technique.
For highly resolved dose-response screening experiments, about 400 individual droplets were generated per coil. These droplets were then grouped into 32 concentration ranges, ranging from no effector to 100% of effector concentration (corresponding to a concentration resolution of 3.1%). The mean and standard deviation were calculated for these 32 concentration ranges, corresponding to 10 ± 3 droplets in each concentration range (Figure S2). This redundancy was applied in order to validate the reliability of the measurements and to control for stochastic effects that can derive from small reaction volumes and cell numbers. Statistics and reproducibility of our dose-response screening data was described in our previous work [23].

2.4. Single Strain Isolation and Identification

The obtained single bacterial isolates were characterized by Sanger sequencing. The detailed protocol is shown below. First, the isolates were subjected to DNA extraction. Inoculation loop were used to transfer one or two single colonies into a 0.2 mL PCR tube containing 50 µL of nuclease-free water (Promega, Madison, MI, USA). The tubes were then heated in an Edvocycler (Edvotek, Washington, DC, USA) at 95 °C for 5 min. After heat lysis, the samples were centrifuged at 10,000× g for 2 min and 2 µL of the supernatant was used for PCR. PCR amplification of the extracted fragments was then performed in an Edvocycler (Edvotek, Washington, DC, USA) according to the following steps: 95 °C for 2 min, 30 cycles of denaturation at 94 °C for 30 s; annealing at 52 °C for 30 s; extension at 72 °C for 90 s; and a final extension at 72 °C for 7 min. The total volume of each reaction was 50 µL, and they contained 2 µL of template solution, 2 mM MgCl2, 250 µM PCR nucleotide mix, 1.25 units GoTaq G2 Flexi DNA Polymerase, nuclease-free water (all reagents from Promega, Madison, USA), and 0.5 µmol/L of each primer. Primers Bakt_27f (5′- AGAGTTTGATCMTGGCTCAG-3′) and Bakt_1492r (5′-TACGGYTACCTTGTTACGACTT-3′) were obtained from Eurofins Genomics (Ebersberg, Germany) in a concentration of 100 pmol/µL. The PCR products were then purified using the QIAquick PCR Purification Kit (Qiagen, Hilden, Germany) according to the manufacturer’s protocol. Finally, after confirming the presence of 16S rRNA fragments (~1500 bp) by gel electrophoresis, the samples were sent to Eurofins Scientific (Köln, Germany) for a second step PCR was performed with the primers Bakt_27f and Bakt_1492r, respectively, and on an ABI 3730xl DNA analyzer system.
The ab1-files of the sequencing were processed using SeqTrace version 0.9.0. software, which is a graphical tool for processing DNA sequencing chromatograms generates consensus sequences in fasta-file format [24]. We set the parameters in the program to choose 32 as the minimal confidence score, the Bayesian consensus algorithm used to generate the consensus sequence. The trimming of the sequences was defined until 9 out of 10 bases were called correctly. Then, the ends of the sequence were set to be automatically trimmed. Finally, a consensus fasta-file was generated and uploaded to BLAST’s Identify service, 16S rRNA sequences could be matched in the database. According to the literature, a minimum of 97% similarity is required to achieve genus identification, while a minimum of 99% similarity is required to achieve species identification [25].

3. Results

3.1. Characterization of Soil Samples

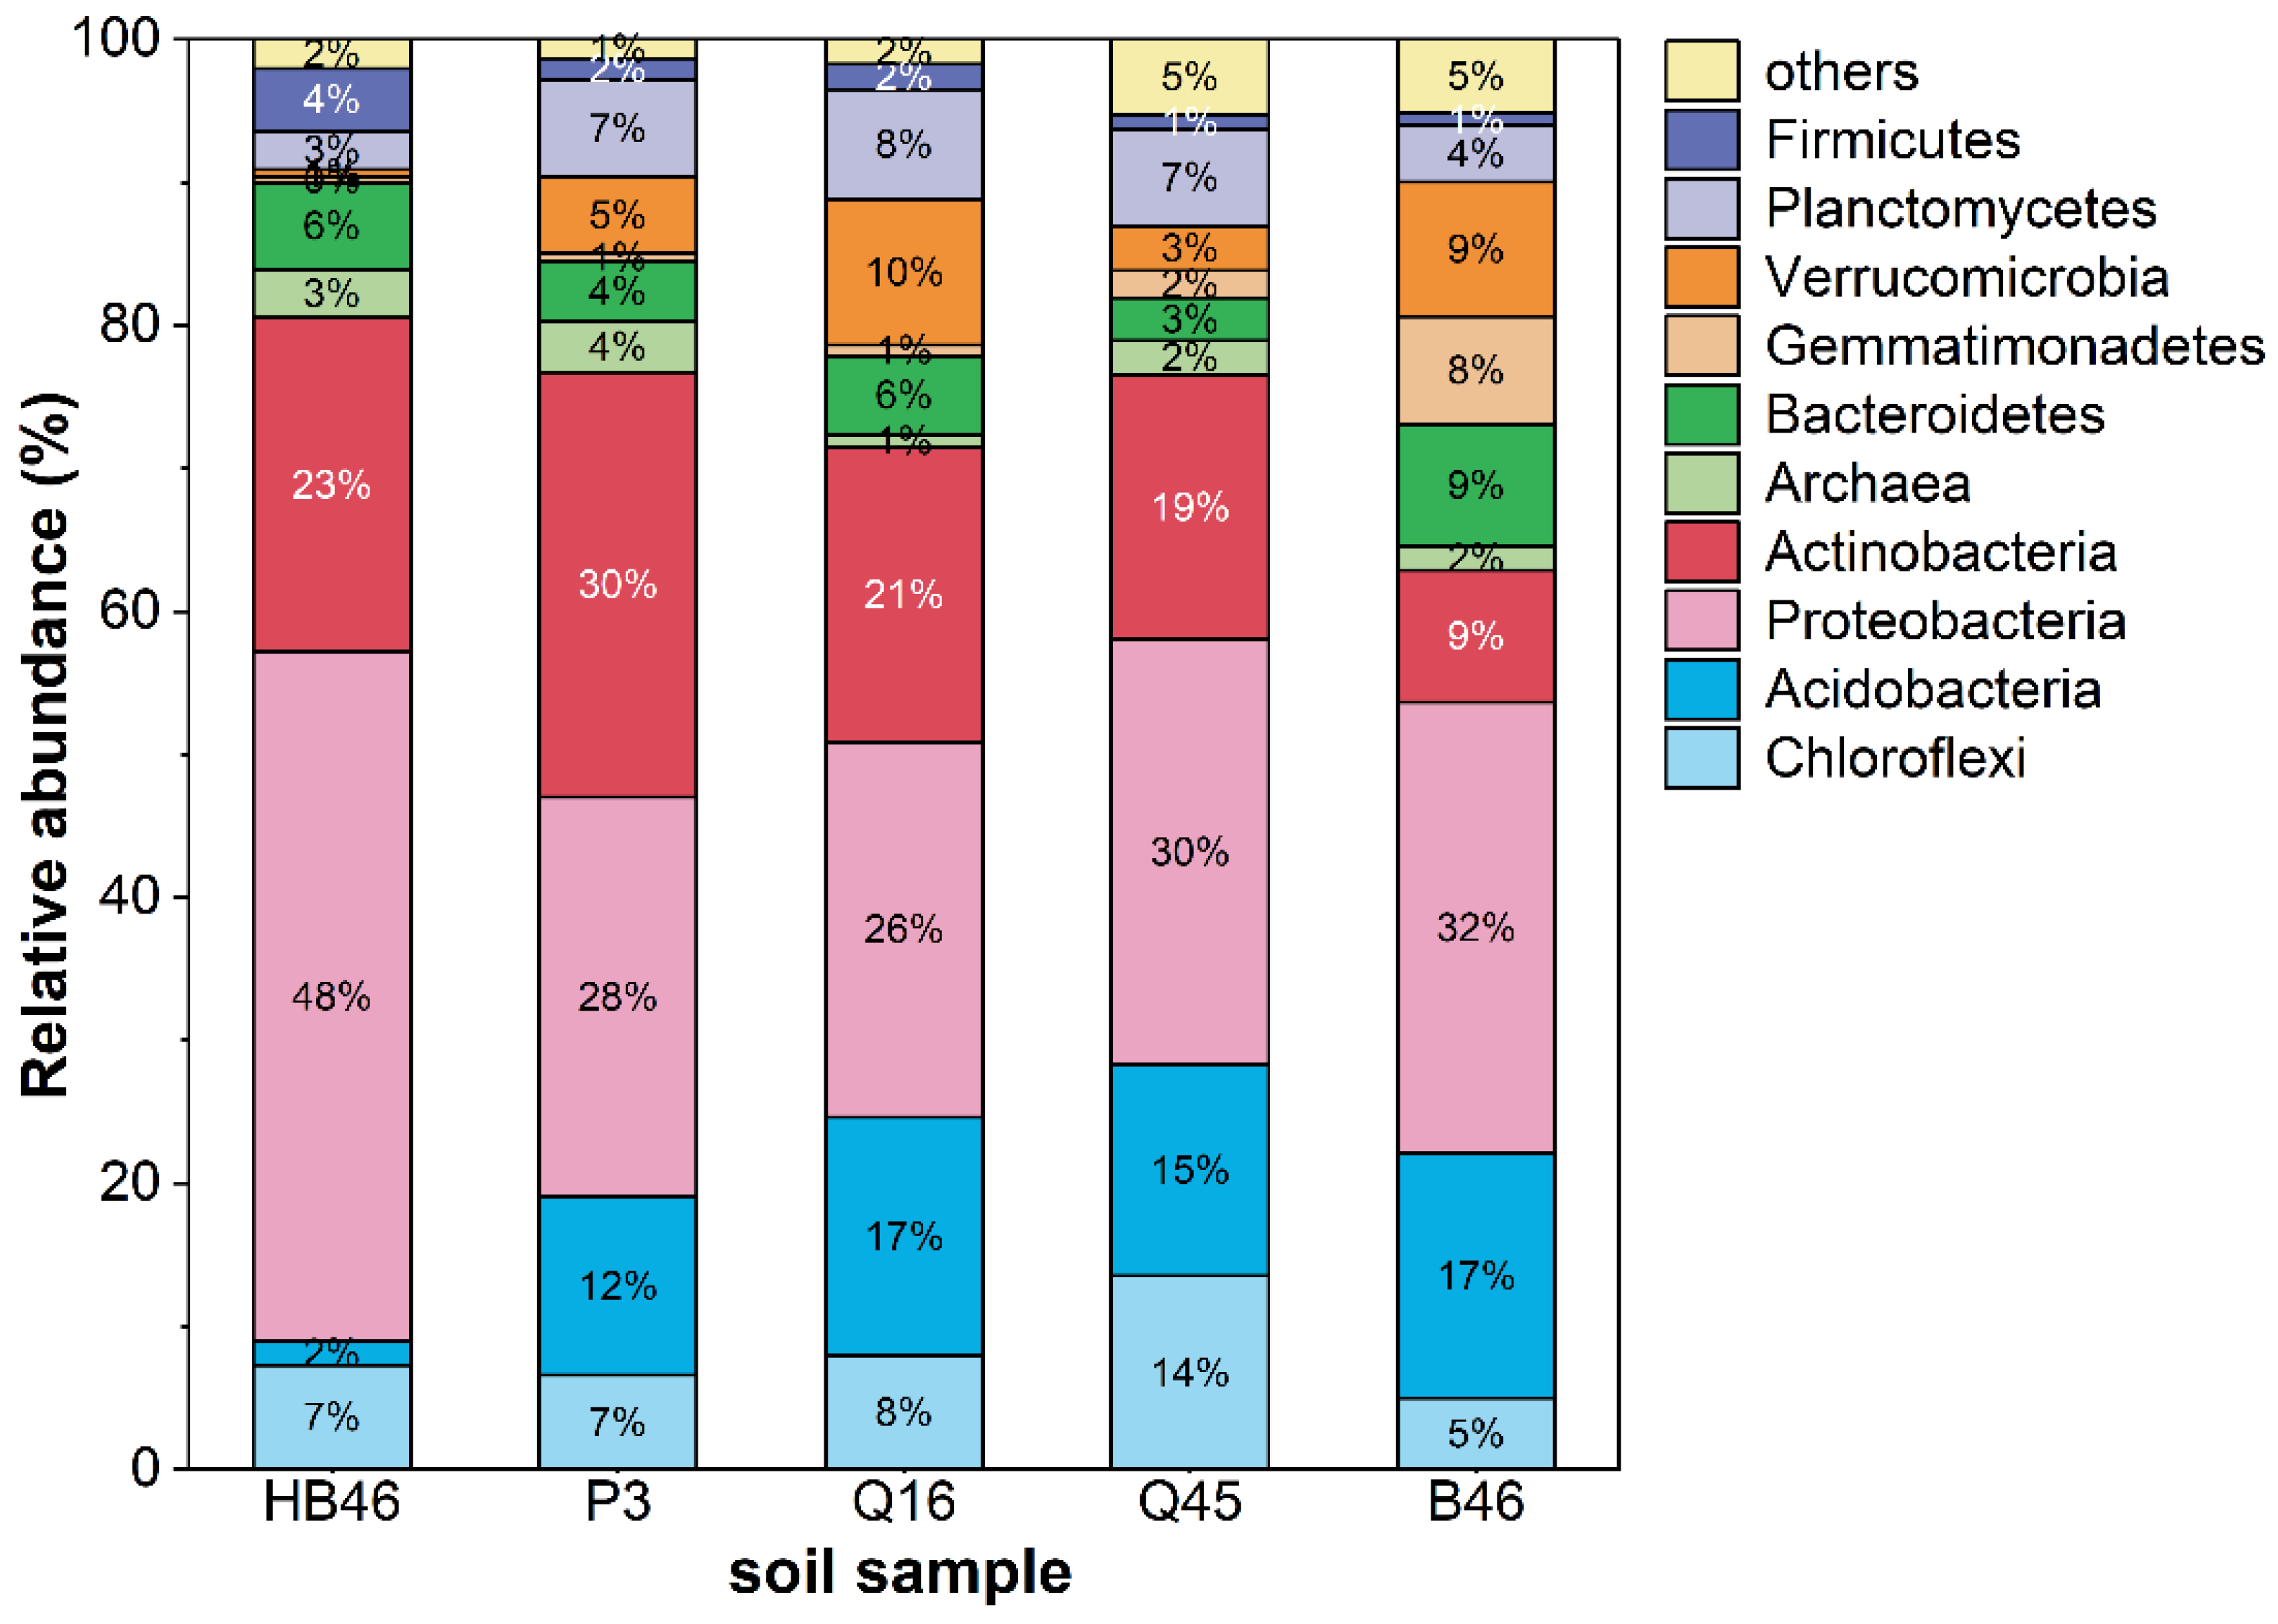
In our study, four soil samples have been characterized roughly by their pH and the EC of a soil suspension (Table 3). It can be seen that soil samples Q45, Q16, B46, and P3 were all weakly alkaline, with Q45 having a high conductivity. This means that the Q45 soil suspension contains a high number of total ions, which can directly influence the conductivity. We could not measure the pH and conductivity of the sample hBP46 from archaeological excavation due to the small available amount of the sample. NGS analysis of all soil samples showed that the soil sample from archaeological excavation (HB46) not only has the highest number of reads, but also has a 2–3-fold higher number of reads with the type of the genus compared to all other soil samples.
In addition, to analyze the diversity of soil bacterial communities, 16S rRNA data from five samples of soil bacterial communities were compared based on operational taxonomic units (OTUs). They were also compiled together by phylum (Figure 2). In addition to a certain presence of Archeae, the highly abundant phyla were Firmicutes, Planctomycetes, Verrucomicrobia, Gemmatimonadetes, Bacteriodetes, Actinobacteria, Proteobacteria, Acidobacteria, and Chloroflexi. Among them, the most prominent were Actinobacteria, Proteobacteria, Acidobacteria, and Chloroflexi. More specifically, the abundance of Proteobacteria in sample hBP46 was much higher, while the Acidobacteria was much lower than in the other samples. In general, the abundances of the most prominent phyla give a relatively homogeneous picture for all investigated soil samples.
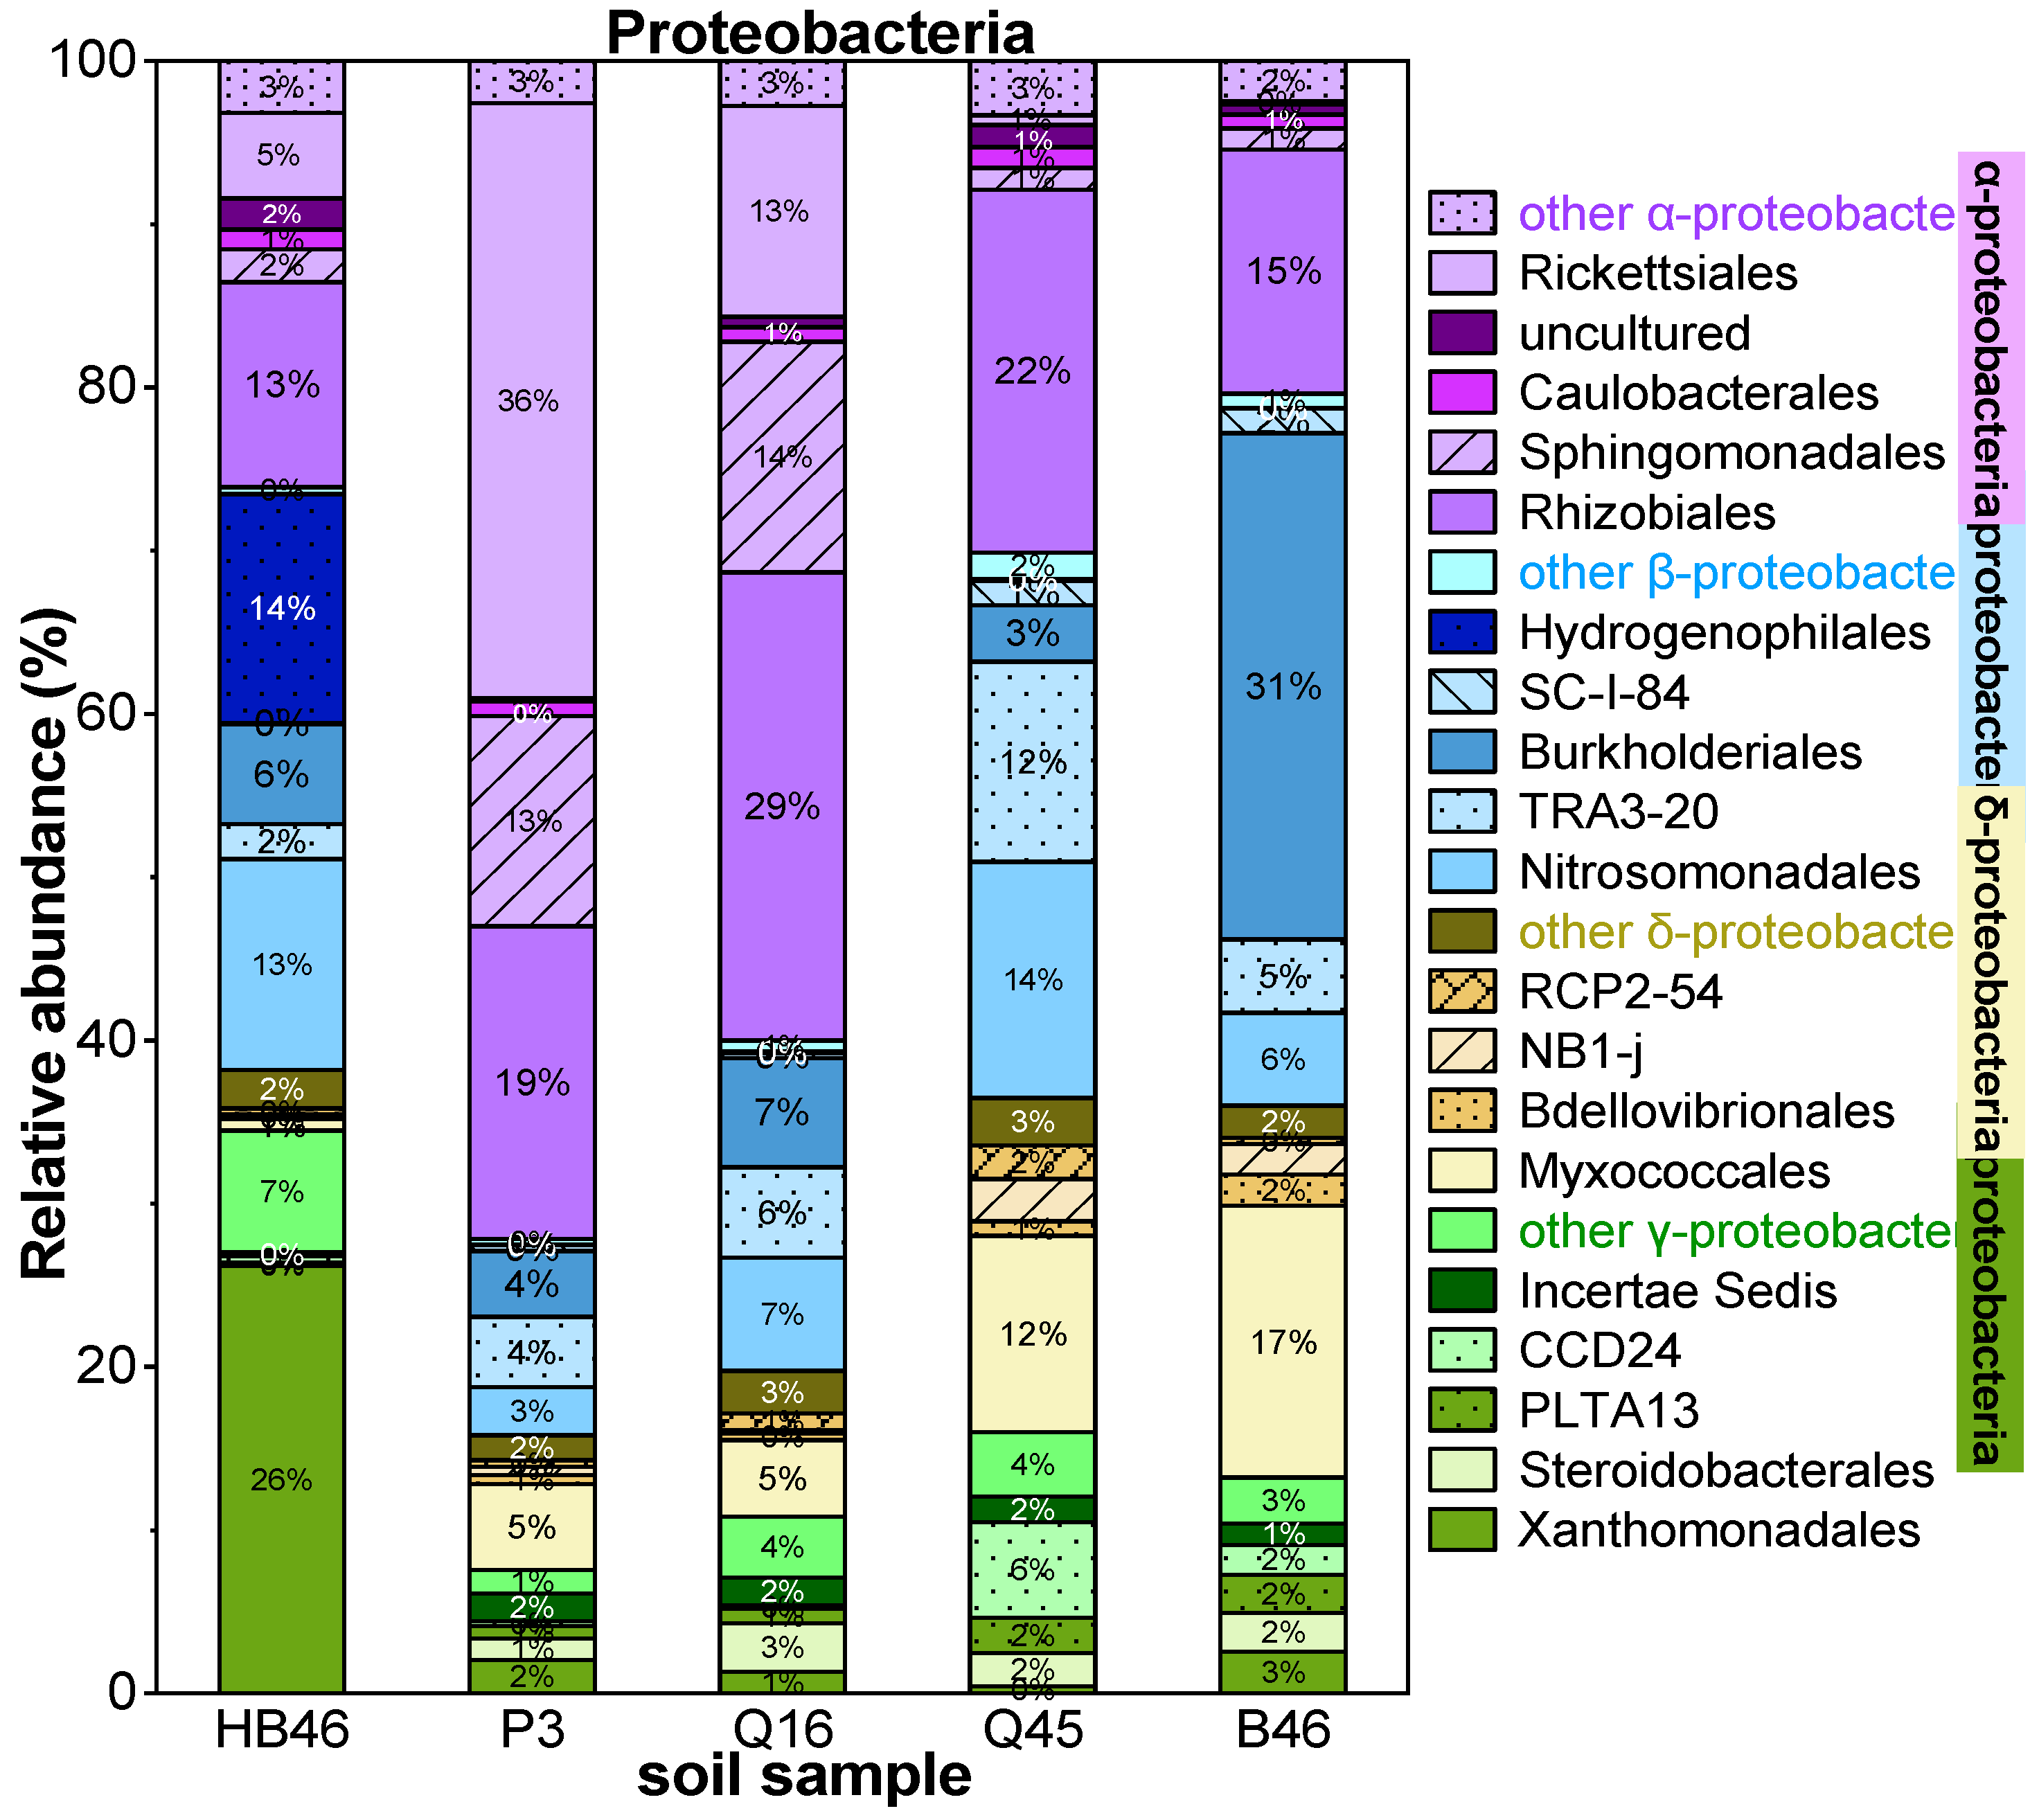
Proteobacteria are the main phylum in all soil bacterial communities, and they belong to four main classes based on OTU, namely alpha-, beta- delta-, and gamma-proteobacteria (Figure 3). Within these four classes, alpha- and beta-proteobacteria were more abundant than delta- and gamma-proteobacteria. When the relative abundance of soil bacterial communities was compared in order between families and classes, it was clear that the order distribution varies considerably within each soil sample. Furthermore, the high abundance order within each soil sample differed, with 26% xanthomonadales in hBP46, 36% Richettsiales in P3, 29% and 22% Rhizobiales in Q16 and Q45, and 31% Burkholderiales in B46.

3.2. Dose-Response Functions of Stochastic Distributed Soil Microbial Community in Dependence of PEG and PAM

The bacterial soil community was empirically characterized by their response to two investigated synthetic polymer PEG600 and PAM, under a modified AM medium. The response of the whole community is well reflected by the optical density and the endogenous fluorescence intensity measurements after 35 days of droplet incubation.
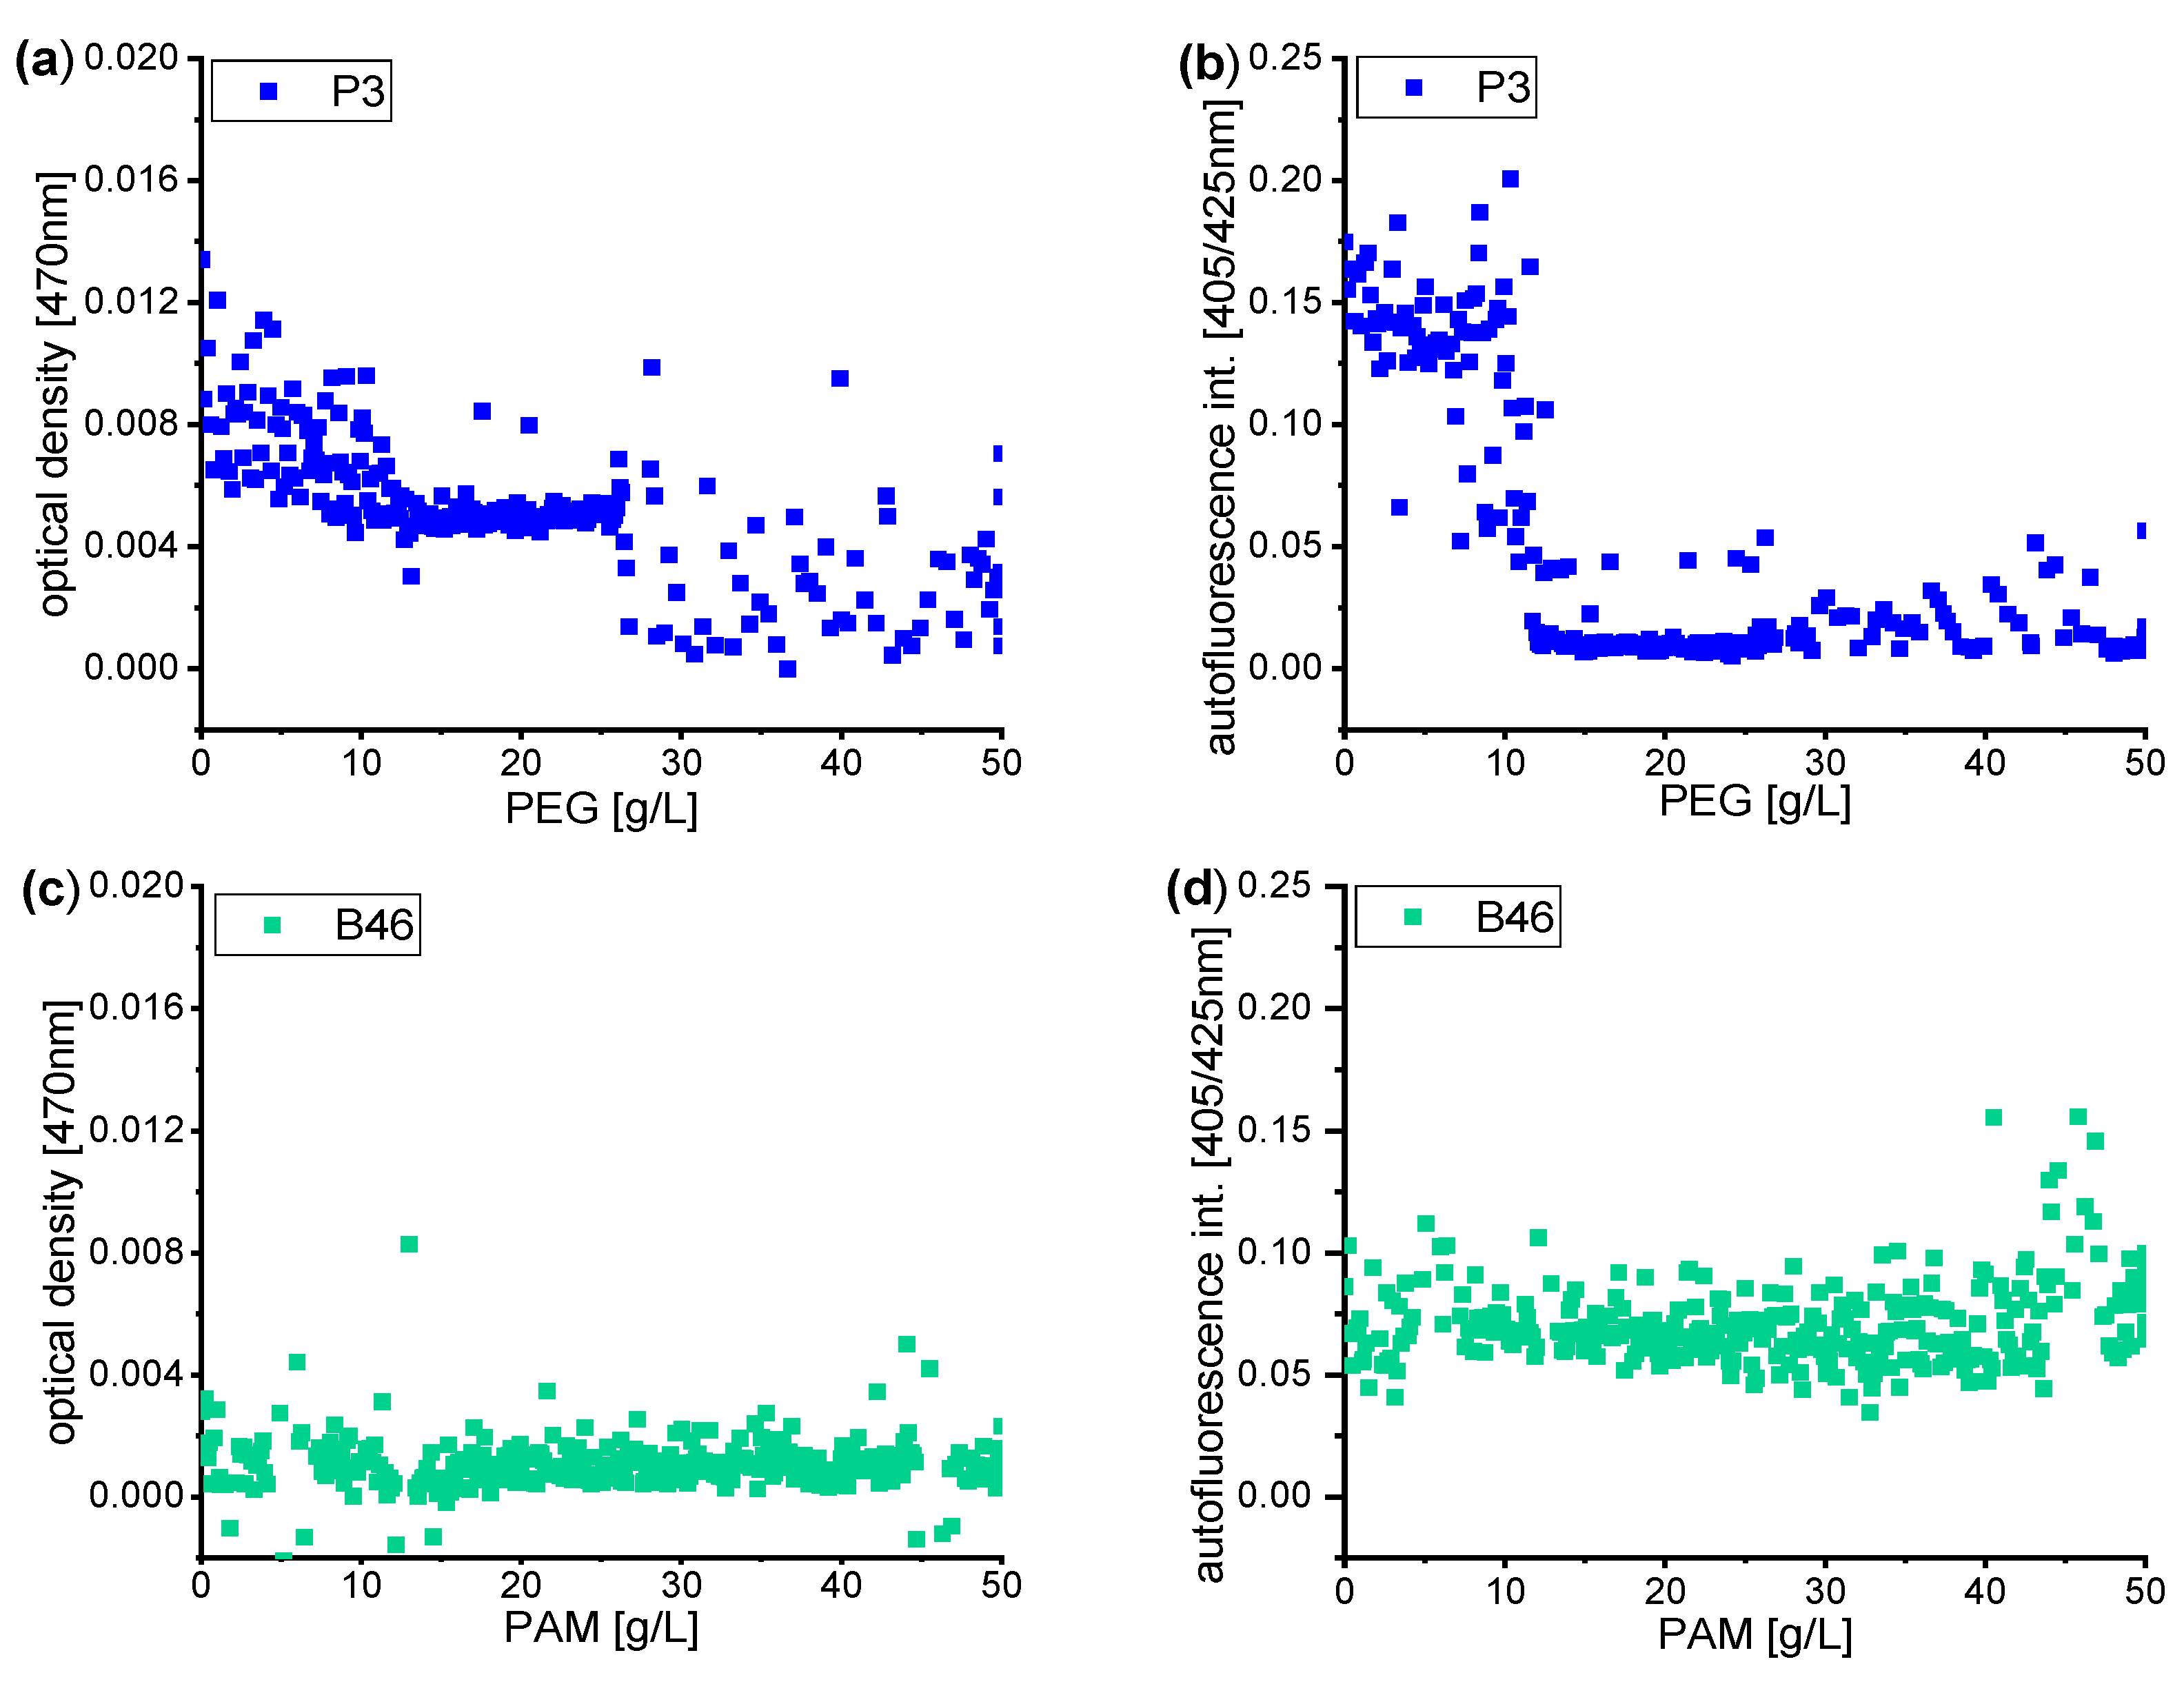
Two examples with soils P3 and B46 are shown in Figure 4. In the case of P3, a concentration-dependent response class against PEG was observed. Below a concentration of about 10 g/L PEG, all segments show the growth of the microbial community. Above 12 g/L PEG concentration, a subdivision of segments in two response groups was found in the PEG concentration range between 12–27 and 27–50 g/L. In the range 12–27 g/L, most segments were marked by an optical density of 0.004. However, the most of segments were marked by strong suppression of bacterial autofluorescence (0.01), except a few segments populated and showed a moderate increase in the autofluorescence. In the range of 27–50 g/L of PEG, a much higher distribution both in photo- and fluorometric signals can be found (Figure 4a,b). In the case of soil sample B46 against PAM, a completely different response behavior was shown (Figure 4c,d). In general, all segments show weak growth. Only a few segments show slightly higher autofluorescence at about 46 g/L PAM. After the measurement and analysis, the growing segments at a higher effector concentration range were transferred to agar-filled wells with specific effector concentrations. Afterwards, second and third cultivation steps were applied to isolate pure cultures on agar media. The obtained cultures were identified by the analysis of 16S rRNA.
Using the isolation strategy described above, a total of 30 isolates were found among the phyla Actinobacteria, Firmicutes and Proteobacteria. Strains such as Advenella, Achrombacter, Arthrobacter, Leifsonia, Microbacterium, Aminobacter, Paenibacillus, Pseudomonas, and Rhodococcus were isolated. Schematic representations of all isolated strains under the stress factor or under the soil samples are shown in Supplementary Figure S1.
Among them five PEG- or PAM-metabolizing Achromobacter. spanius strains were isolated from the reduced communities of all soil samples. TX057 and TX060 were isolated from soil samples collected from pre-industrial mining sites (P3, Q16) cultivated in AM medium with 41–46 g/L PEG. Another three strains TX065, TX074 and TX078 were found in AM medium with 28–46 g/L PAM from three different sites. An overview of the identified strains with their isolation pathway is summarized in Table 4.
In the next step, we compared these five A. spanius strains by their highly resolved dose-response patterns against three synthetic polymers PEG, PVP, PAM and two organic solvents 1,4-dioxane and diglyme.

3.3. Highly-Resolved Microfluid Dose-Response Functions for Synthetic Polymer PEG, PVP and PAM

All these strains can be compared by their highly resolved dose-response patterns obtainable with concentration-dependent droplet cultivation. For the single effector screening, the growth of the culture was observed 21 days after the start of incubation (21 °C) by measuring the optical density at 407 nm and endogenous autofluorescence intensity at 405 nm (emission at 425 nm). The number of inoculum cell density was set at an absorbance at 600 nm of 0.1.
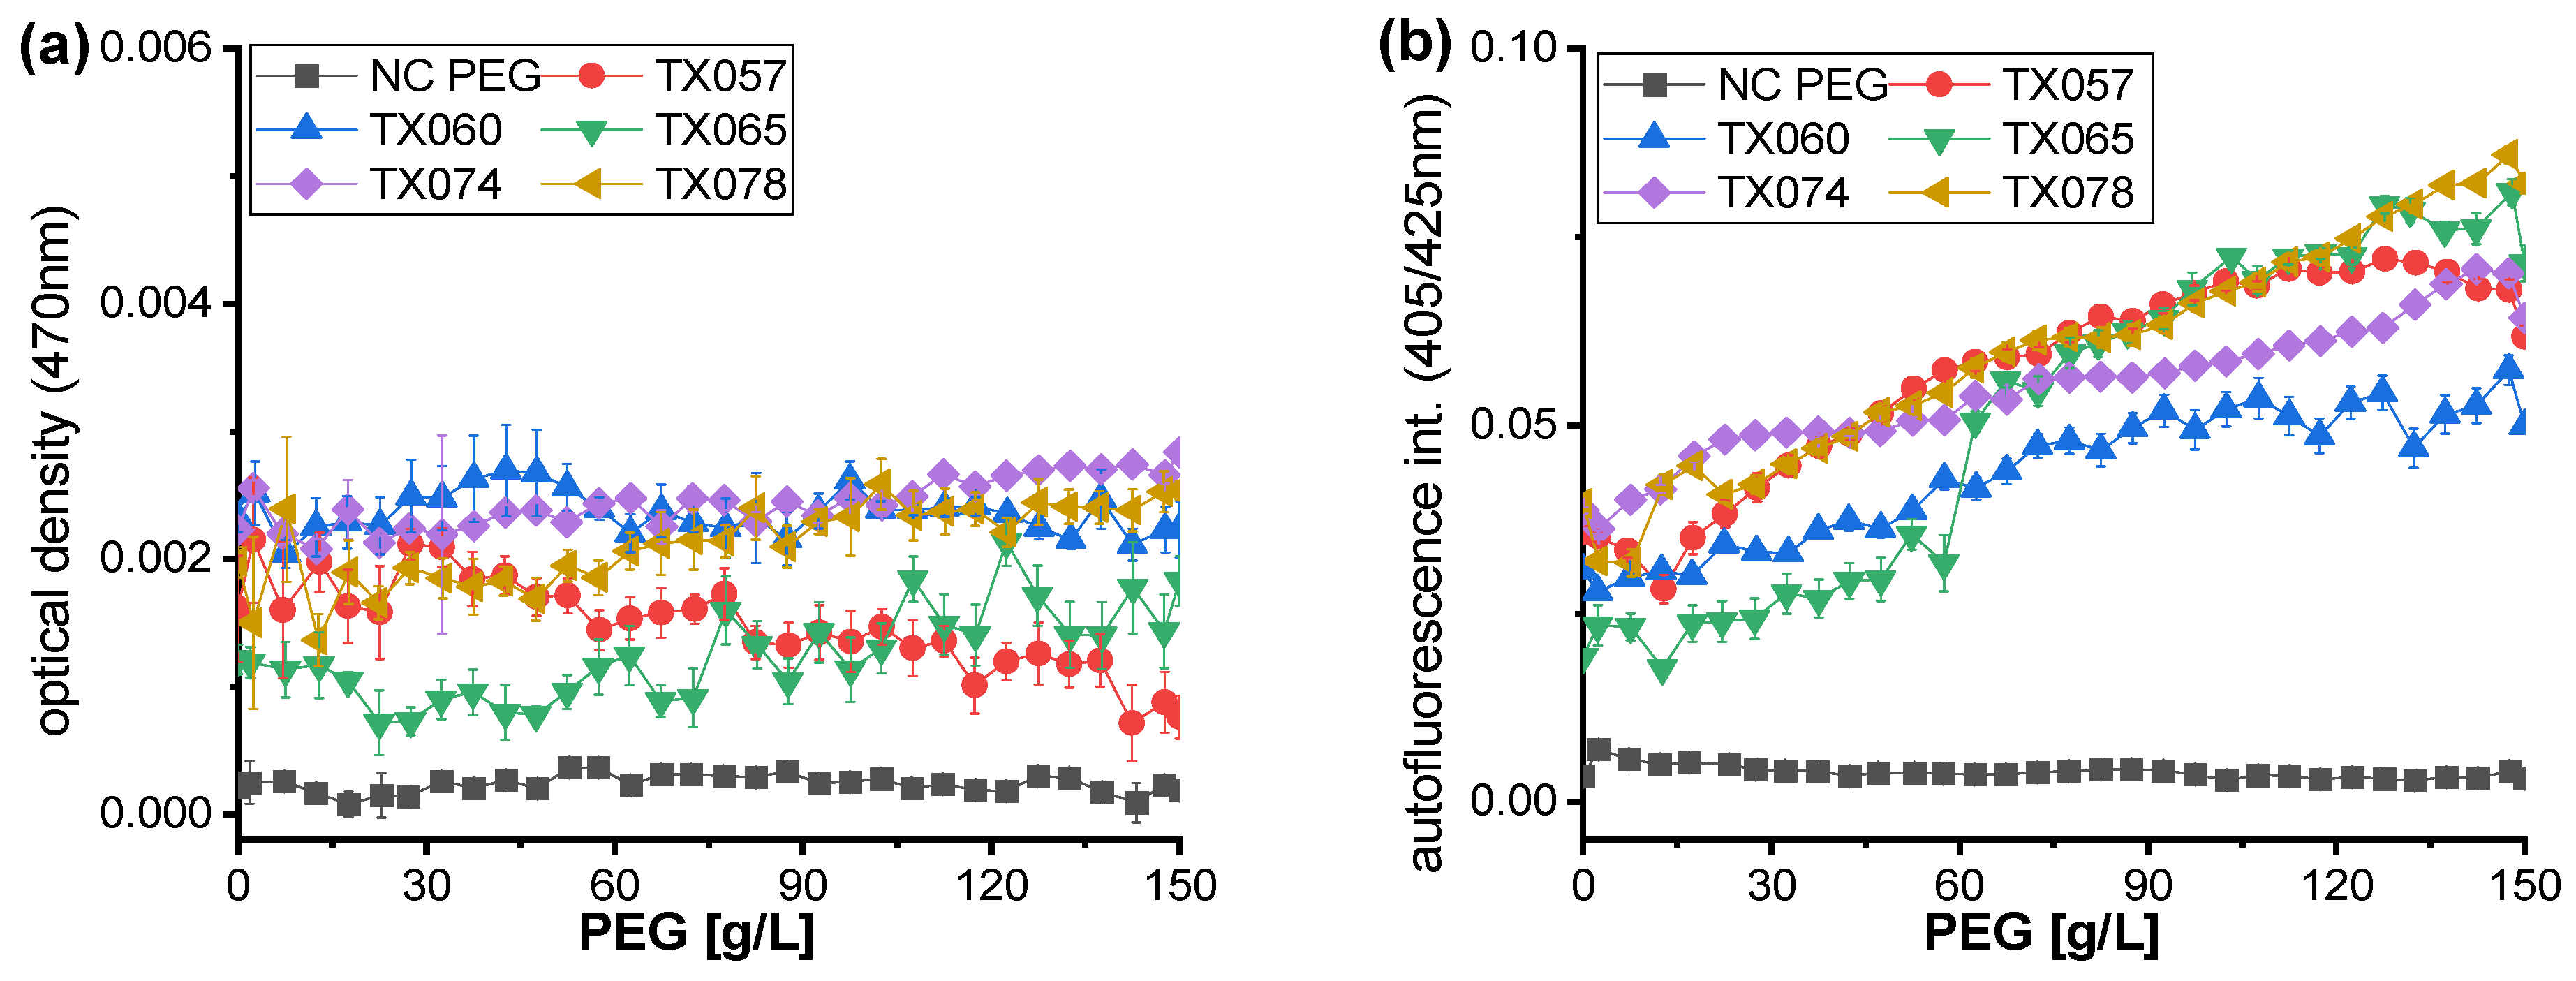
These five isolated strains of Achromobacter spanius TX057, TX060, TX065, TX074, and TX078 were subjected to microfluidic dose-response screening against PEG with a molecular weight of 600 Da and showed that it could be metabolized as the carbon source in the AM medium. PEGs find use in pharmaceuticals, cosmetics, antifreeze for automobile radiators, and special lubricants for the textile industry. The most extensive use of PEGs is in the manufacture of non-ionic surfactants and PEGs of various molecular weights are linked with phenyl or other aromatic moieties to produce surface-active agents [26]. There are many reports of PEGs being metabolized by bacteria as a carbon source, for example, a pure culture strain of Sphingomonads was isolated that could metabolize PEG at 4000 Da and 20,000 Da [27]. In 2000, a Gram-positive actinomycete Pseudonocardia sp. was isolated that could grow in the presence of PEG 4000 and 8000 [28]. In Figure 5 the black line (square) shows the signal of negative control without any influence of cells. After 21 days of incubation, the dose-response curves of these five isolates measured with micro flow-through photometry show weak growth of all droplets and no changes in the optical density with increased PEG concentration. However, the endogenous autofluorescence clearly shows the dose-response effect. The higher the PEG concentration, the higher the fluorescence intensity. A similar trend was observed for all these five strains. The data indicate no significant difference in the degradation of PEG between these isolates. The autofluorescence intensity increased with increasing PEG concentration, suggesting that the five isolates can degrade concentrations up to 150 g/L of 600 Da PEG (Figure 5b).
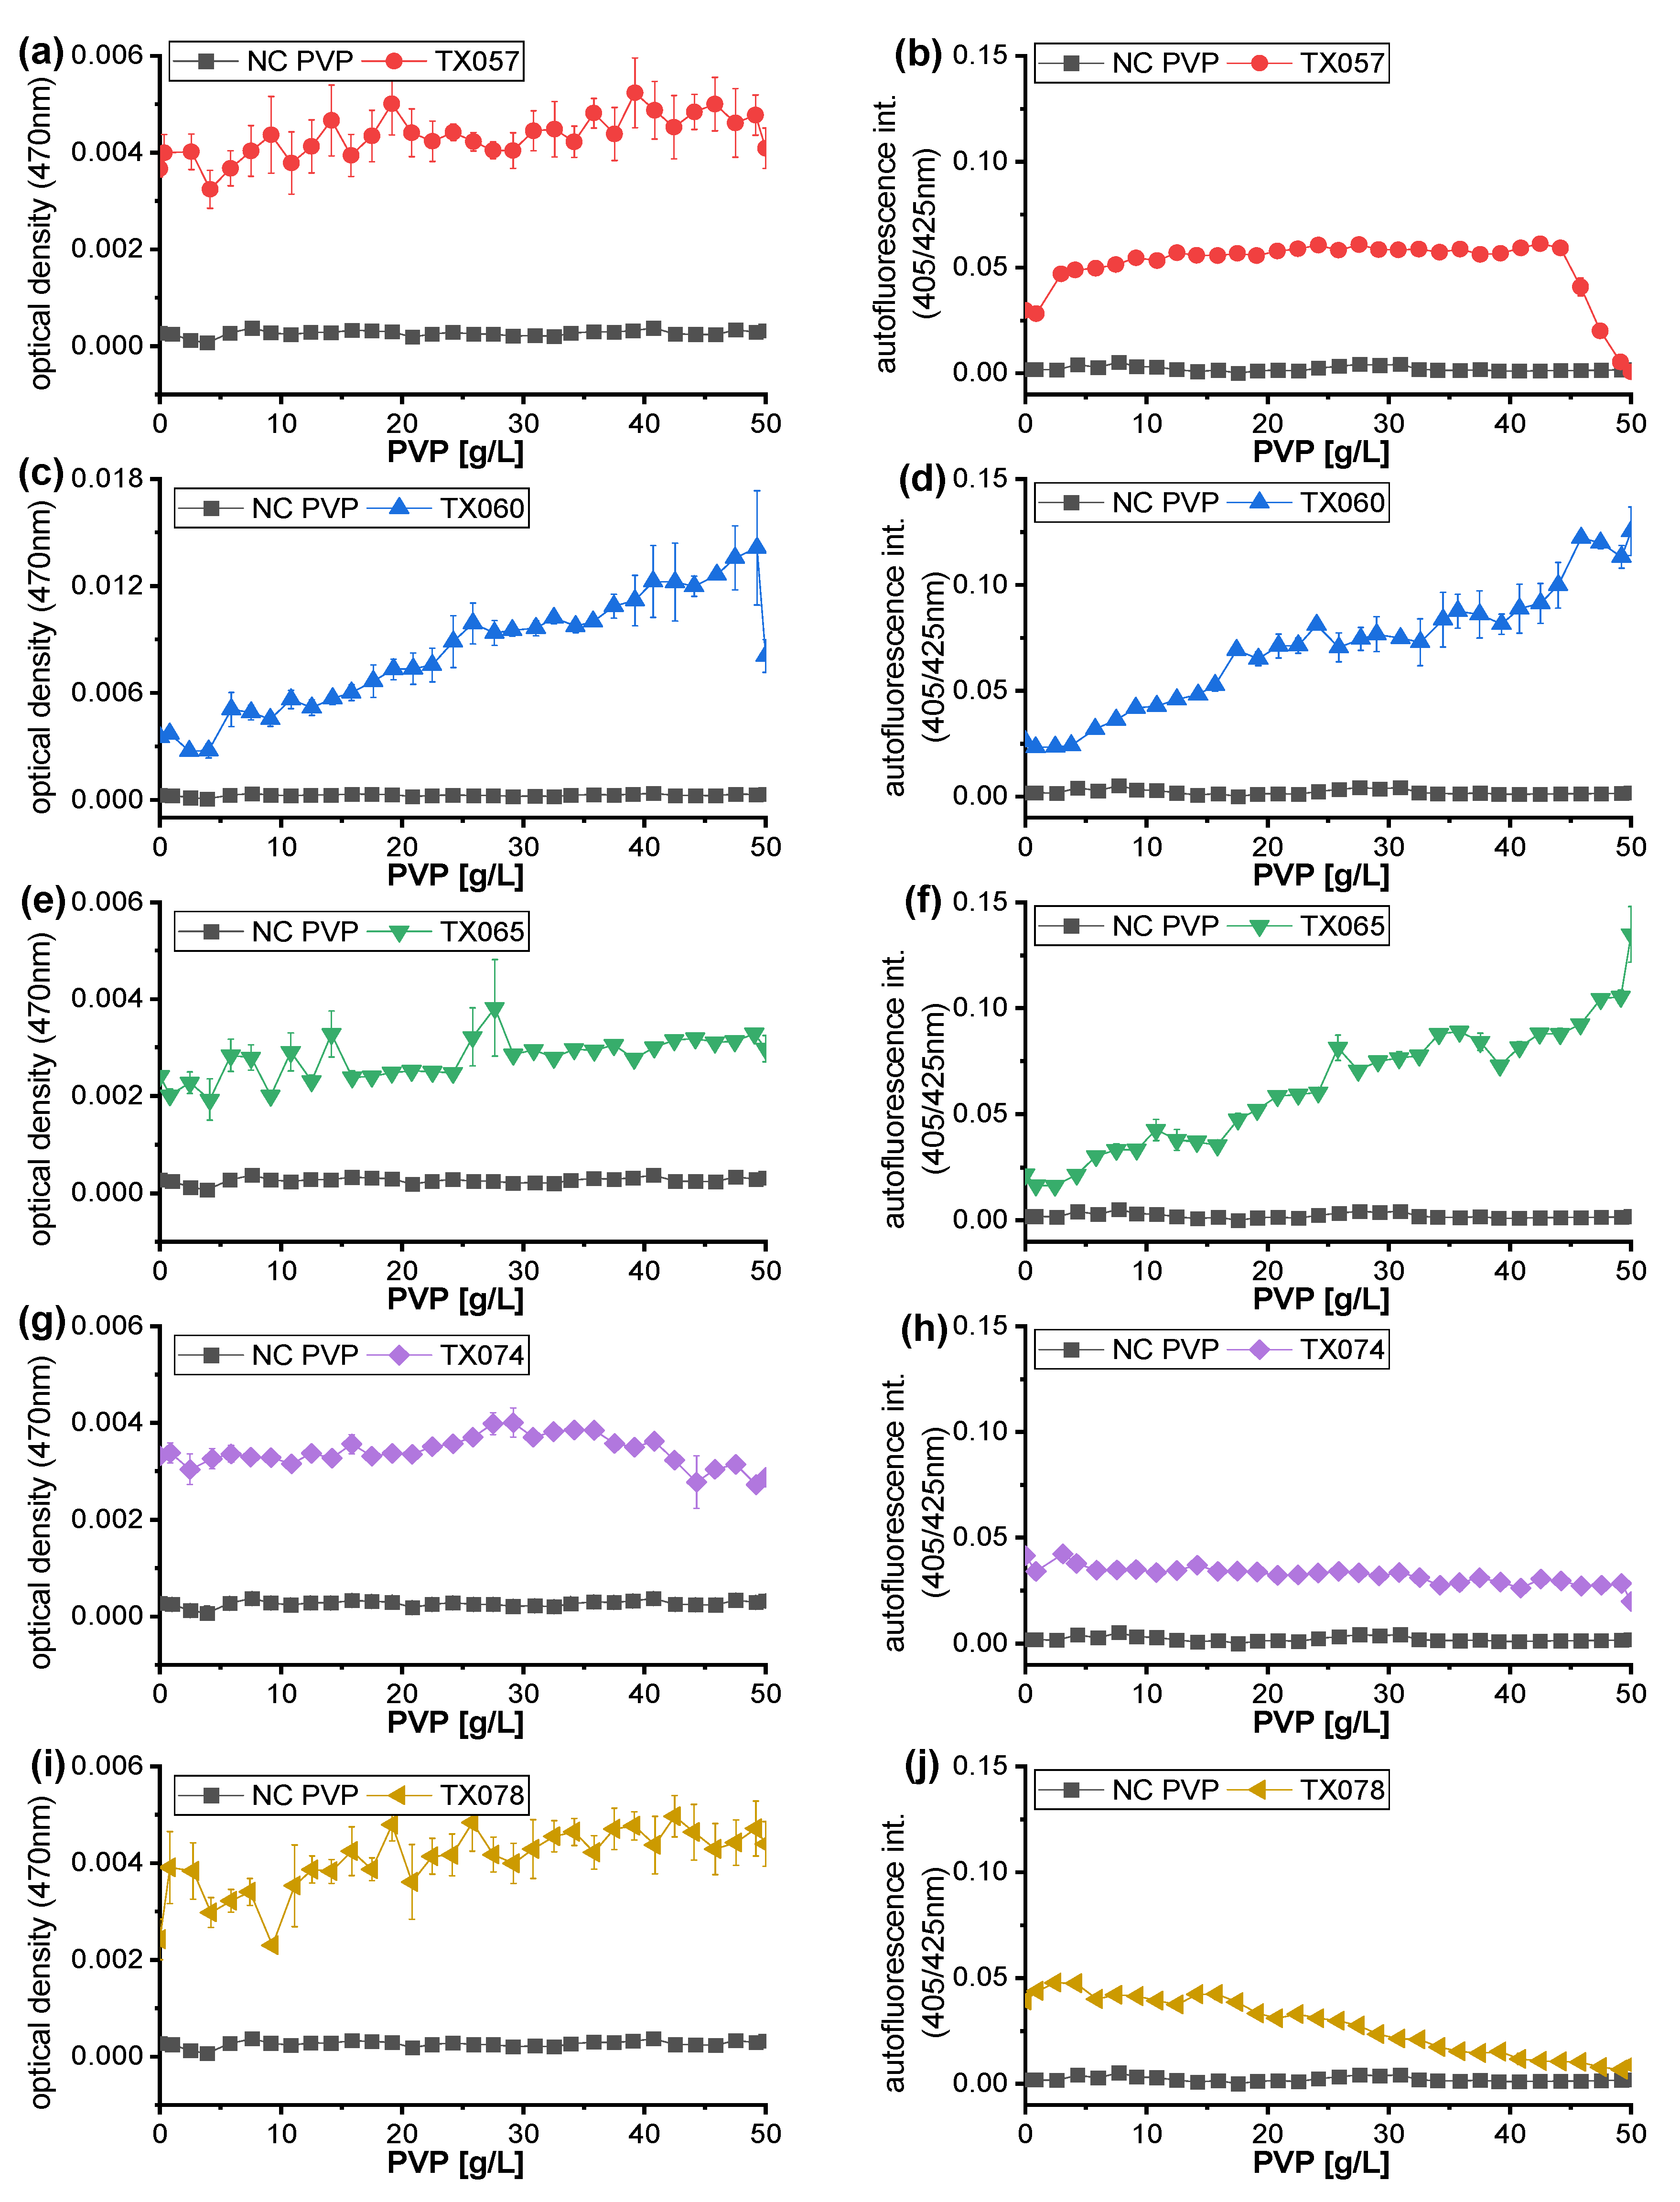
Polyvinylpyrrolidone (PVP) is one of the hydrophilic biocompatible polymers. It has been used in separation processes to increase the hydrophilic character of mixed polymeric materials due to their water solubility and has also been used in various biomedical applications [29,30]. However, because of this, it is used in large quantities and is discharged into sewage systems and then into the aquatic environment and soil, leading to pollution of marine and freshwater environments. PVP is known to be biodegradable in the presence of co-culture [31] or in the presence of other polymers such as PVA [32]. Here, five isolates isolated under PEG and PAM pressure were subjected to microfluidic dose-response experiments against 40 kDa PVP. In the following, the biodegradability of PVP was investigated on isolated five A. spanius strains. The raw data of the dose-response curves of Figure 6 were fitted with linear regression and the estimated values, including confidence intervals and p-values were calculated and listed in the supplementary material (see Figures S3 and S4).
The dose-response curves of isolate TX057 show weak growth in all segments and no dependence on the PVP concentration. The isolate TX074 (Figure 6g,h) and TX078 (Figure 6i,j) show the similar dose-response function as TX057. However, the autofluorescence intensity of TX078 decreases continuously with increasing PVP. A total inhibition is at 50 g/L PVP.
TX060 shows a significant increase in optical density and autofluorescence intensity with increasing PVP concentration (Figure 6c,d). Interestingly, in the case of TX065 the value of the optical density is low and remains constant with increasing PVP concentration, whereas the autofluorescence intensity increases continuously (Figure 6e,f). This may be due to the fact that the biomass of TX065 barely changed with increasing PVP concentration, but fluorescent secondary metabolites or intermediates were produced. Overall, the data shows that the isolates TX065 and TX060 have the potential to metabolize PVP.
The third synthetic polymer we investigated is polyacrylamide (PAM). PAM is used extensively in water treatment, the paper industry, oil extraction, and mining [33]. It can be biodegraded and metabolized by bacteria as the sole carbon source, which was confirmed by assaying intracellular and extracellular amidase activity [34]. Yu et al. reported that PAM can be used as a carbon and nitrogen source by a strain of Pseudomonas aeruginosa isolated from wastewater sludge and this strain was able to utilize PAM at a molecular weight of 1.0 g/L between 17.000 kDa and 22.000 kDa [35].
The biodegradability of 10k Da PAM was microfluidically investigated on five isolated A. spanius strains. The dose-response curves of isolate TX057 show moderate growth in all segments up to about 50 g/L PAM. However, fluorescence intensity increases continuously from 0–32 g/L PAM concentration. The autofluorescence decreases slowly by increasing PAM between 32–75 g/L (Figure 7a,b). In the case of TX060, the optical density continuously decreases with increasing PAM concentration, while the autofluorescence intensity is kept constant up to 70 g/L PAM (Figure 7c,d). The dose-response curves of isolates TX074 and TX078 show a weak growth in all segments, and no dependence on the PAM concentration in both the microphotometric and fluorometric signals (Figure 7h–j). The dose-response curves of isolate TX065 show a moderate growth between 0–50 g/L PAM, and after 50 g/L the optical density decreases. However, the autofluorescence intensity of TX065 increases continuously with increased PAM concentration (Figure 7e,f). The same effect was also observed in the case of TX065 against PVP. This may be due to the fact that the biomass of TX065 barely changed with increasing PAM concentration, but fluorescent secondary metabolites or intermediates were produced. It seems that TX065 has the potential for degradation of PAM.

3.4. Highly Resolved Dose-Response Functions for Organic Solvents 1,4-Dioxane and Diglyme

1,4-dioxane is a cyclic ether that can be produced by dehydration of ethylene glycol, the monomer of PEG. It is a suspected carcinogen that has been detected in groundwater around landfill sites [36]. Diglyme is a dimethyl ether derivative of diethylene glycol. Both are important as solvent in the synthetic chemical industry. Since the potential of these new A. spanius strains to degrade PEG600 has been demonstrated (Figure 5), it is interesting to know if biodegradation is possible with these strains against 1,4-dioxane and diglyme.
A concentration-dependent dose-response to 1,4-dioxane was carried out for each of the five A. spanius isolates. A sharp transition between growth and growth inhibition was found after an incubation of 21 d in segments with all strains. There was no growth at concentration up to 10% of 1,4-dioxane, as no increase in optical density was observed and no autofluorescence signal was observed (Figure 8a,b).
In the case of diglyme, according to the optical density and the autofluorescence signal, TX060 (blue), TX057 (red) and TX078 (yellow) show similar behavior. Total inhibition of up to 10% of diglyme was estimated. TX065 (green) and TX074 (purple) show a step-wise dose-response against diglyme. Three different types of growth response with respect to different diglyme concentration ranges were found in the highly resolved dose-response functions. Normal growth occurred at up to 7% diglyme and a total inhibition of growth was observed above 17% for TX065 and TX074. Moderate growth was found between 7–17% of diglyme (Figure 8b,d).

4. Discussion

Using droplet-based microfluidic approach, five Achromobacter spanius strains were isolated from five soil samples. The Achromobacter spanius belongs to Burkholderiales, an order with similar relative abundance in hBP46, P3, Q16, and Q45 and more prominent in B46. Burkholderiales was reported to act as a degrader of poly (3-hydroxybutyrate-co-3-hydroxyhexanoic acid) (PHBH) in biofilms [37]. In addition, bacteria from the order Burkholderiales were shown to have hydrolytic enzymes that degrade polyethylene terephthalate (PET) [38]. Earlier studies have reported the ability of Achromobacter towards degradation of plastic-based polymers. Dey et al. have shown the Achromobacter sp. biodegradation of low-density polyethylene (LDPE) due to series of chemical changes starting from oxidation followed by dehydrogenation led to the breaking down of LDPE into smaller molecules [39]. Kowalczyk et al. successfully investigated the of high-density polyethylene (HDPE) biodegradation ability of Achromobacter xylosoxidans, isolated from landfill soil [7]. Achromobacter sp. has shown its potential for biodegradation of polyvinylchloride (PVC) [9]. In general, the genus Achromobacter is well known for its ability to degrade organic substances, particularly hydrocarbons. Therefore, it was found, for example, frequently in oil-contaminated soils and is able to metabolize oil [40]. In addition, Achromobacter strains had also found to be active in denitrification [41], degradation of TNT [42] and desulfurization [43]. However, efficient biodegradation of contaminants requires a co-cultivation with other bacterial types, mostly [44,45].
The quantitative data obtained by microfluidic dose/response screenings reflect the different metabolism of water-soluble polymers by Achromobacter spanius. The five isolates differ considerably in their metabolic properties and growth behavior and in terms of tolerance to synthetic polymer PEG, PVP, and PAM concentrations and organic solvents diglyme and 1,4-dioxan. It is remarkable that the strains found here, i.e., TX60 and TX65, are able to degrade PVP, obviously, without any co-cultivation under the conditions in the microfluidic droplets. Further studies should be focus on introducing these strains in co-culture consortia for highly efficient conversion and remediation processes. The micro-segmented flow approach is very promising for searching for optimized parameter sets in future conversion processes.
A rough classification of the chemical nature of the soil can be provided by measuring both pH and electrical conductivity (EC). The optimum pH range for most soil microorganisms is between 5–8. Soil pH can be an important determinant of the relative predominance and activity of different microbial groups related to microbially mediated processes such as nutrient cycle, decomposition of natural and synthetic organic matter, and microbial transformation of atmospherically important trace gases such as CH4. It was reported that the degradation and efficacy of certain agricultural chemicals could be significantly influenced by soil pH. The EC of a solution is related to the total cations or anions in the solution. EC has generally been associated with determining soil salinity. However, EC can also serve as a measure of soluble nutrients—both cations and anions [46]. All soil samples investigated here originate from places with a background of ancient human impact. The formerly human activities data back over centuries and are suspected to be connected with the release of toxic components and organic materials as well as hydrocarbons to the soil. It was reported that long-term contact of Achromobacter species with diesel oil caused changes in their hexadecane monooxygenase activity and biodegradation ability [47]. Therefore, it could be expected that different strains of the same species—in this case, Achromobacter spanius—could be marked by different metabolic and tolerance features. Such differences could be detected by the microfluidically supported investigations reported here. Among the others, strains from a historical copper mining site (sample Q16) and a prehistorical rampart (sample B46) have been identified to be particularly promising in metabolizing the investigated polymers.

5. Conclusions

In conclusion, our study confirmed that the technique of droplet-based microfluidics is well suited for dose-dependent empirical characterization of soil bacterial communities in the presence of synthetic polymers and solvents andfor investigating the response of single strains toward water-soluble polymer and organic solvents. It is particularly important for obtaining highly resolved quantitative data on concentration dependence of microbial growth and activity reflected by bacterial autofluorescence. Thus, it covers an important aspect of the phenotypic characterization of microorganisms.
In result, the microfluidic technique allows isolation and distiction strains of A. spanius from five different sampling places by their individual concentration-dependent response to the applied substrates. One of these strains (TX065) was found to degrade the synthetic polymers PVP, PAM and PEG. It is a very promising candidate for future biodegradation and bioremediation approaches. In addition, the results support the strategy to use soil samples from places with ancient human impacts to search for new bacterial strains with interesting tolerance and metabolic features.

Supplementary Materials

The following supporting information can be downloaded at: https://www.mdpi.com/article/10.3390/environments9120147/s1, Figure S1: Schematic representation of all 30 isolated strains. Figure S2: A representative example of how the microdroplet raw data is visualized and treated. Figure S3: Dose-response raw data measured by microphotometry of isolated Achromobacter spanius strains against PVP. Figure S4: Dose-response raw data measured by microfluorimetry of isolated Achromobacter spanius strains against PVP.

Author Contributions

Laboratory measurements and data analysis T.X. and J.C.; Conceptualization, writing—original draft preparation, J.C., T.X. and J.M.K.; Bioinformatics software, P.M.G.; statistics, S.H.; writing—review and editing, J.C., J.M.K., S.H. and P.M.G. All authors have read and agreed to the published version of the manuscript.

Funding

This research received no external funding.

Data Availability Statement

The data used to support the findings of this study are available from the corresponding author upon request.

Acknowledgments

We thank Tim Schüler for providing the soil sample HB46. We thank Frances Möller, Nancy Beetz and Steffen Schneider for Lab assistance. We thank Linda Ehrhardt for the fruitful discussion. Jialan Cao gratefully acknowledges financial support by a habilitation scholarship from state of Thuringia and a research funding from Technische Universität Ilmenau.

Conflicts of Interest

The authors declare no conflict of interest.

References

  1. Danso, D.; Chow, J.; Streit, W.R. Plastics: Environmental and Biotechnological Perspectives on Microbial Degradation. Appl. Environ. Microbiol. 2019, 85, e01095-19. [Google Scholar] [CrossRef] [PubMed] [Green Version]
  2. Yuan, J.; Ma, J.; Sun, Y.; Zhou, T.; Zhao, Y.; Yu, F. Microbial degradation and other environmental aspects of microplastics/plastics. Sci. Total Environ. 2020, 715, 136968. [Google Scholar] [CrossRef] [PubMed]
  3. Albertsson, A.C.; Karlsson, S. The influence of biotic and abiotic environments on the degradation of polyethylene. Prog. Polym. Sci. 1990, 15, 177–192. [Google Scholar] [CrossRef]
  4. Teuten, E.L.; Saquing, J.M.; Knappe, D.R.U.; Barlaz, M.A.; Jonsson, S.; Björn, A.; Rowland, S.J.; Thompson, R.C.; Galloway, T.S.; Yamashita, R.; et al. Transport and release of chemicals from plastics to the environment and to wildlife. Philos. Trans. R. Soc. B Biol. Sci. 2009, 364, 2027–2045. [Google Scholar] [CrossRef] [Green Version]
  5. Luqman, A.; Nugrahapraja, H.; Wahyuono, R.A.; Islami, I.; Haekal, M.H.; Fardiansyah, Y.; Putri, B.Q.; Amalludin, F.I.; Rofiqa, E.A.; Götz, F.; et al. Microplastic Contamination in Human Stools, Foods, and Drinking Water Associated with Indonesian Coastal Population. Environments 2021, 8, 138. [Google Scholar] [CrossRef]
  6. CUTRIGHT, T.J.; LEE, S. Remediation of PAH-Contaminated Soil Using Achromobacter sp. Energy Sources 1994, 16, 279–287. [Google Scholar] [CrossRef]
  7. Kowalczyk, A.; Chyc, M.; Ryszka, P.; Latowski, D. Achromobacter xylosoxidans as a new microorganism strain colonizing high-density polyethylene as a key step to its biodegradation. Environ. Sci. Pollut. Res. Int. 2016, 23, 11349–11356. [Google Scholar] [CrossRef] [Green Version]
  8. Wang, S.; Yang, Q.; Zhang, L.; Wang, Y. Kinetics of the aerobic co-metabolism of 1,1-dichloroethylene by Achromobacter sp.: A novel benzene-grown culture. Biotechnol. Lett. 2014, 36, 1271–1278. [Google Scholar] [CrossRef]
  9. Das, G.; Bordoloi, N.K.; Rai, S.K.; Mukherjee, A.K.; Karak, N. Biodegradable and biocompatible epoxidized vegetable oil modified thermostable poly(vinyl chloride): Thermal and performance characteristics post biodegradation with Pseudomonas aeruginosa and Achromobacter sp. J. Hazard. Mater. 2012, 209, 434–442. [Google Scholar] [CrossRef]
  10. Ghaffarian, V.; Mousavi, S.M.; Bahreini, M.; Shoaei Parchin, N. Biodegradation of cellulose acetate/poly(butylene succinate) membrane. Int. J. Environ. Sci. Technol. 2017, 14, 1197–1208. [Google Scholar] [CrossRef]
  11. Haloi, S.; Medhi, T. Optimization and characterization of a glycolipid produced by Achromobacter sp. to use in petroleum industries. J. Basic Microbiol. 2019, 59, 238–248. [Google Scholar] [CrossRef] [PubMed]
  12. Cao, J.; Chande, C.; Köhler, J.M. Microtoxicology by microfluidic instrumentation: A review. Lab Chip 2022, 22, 2600–2623. [Google Scholar] [CrossRef] [PubMed]
  13. Hu, B.; Xu, P.; Ma, L.; Chen, D.; Wang, J.; Dai, X.; Huang, L.; Du, W. One cell at a time: Droplet-based microbial cultivation, screening and sequencing. Mar. Life Sci. Technol. 2021, 3, 169–188. [Google Scholar] [CrossRef]
  14. Cao, J.; Kürsten, D.; Schneider, S.; Knauer, A.; Günther, P.M.; Köhler, J.M. Uncovering toxicological complexity by multi-dimensional screenings in microsegmented flow: Modulation of antibiotic interference by nanoparticles. Lab Chip 2012, 12, 474–484. [Google Scholar] [CrossRef]
  15. Cao, J.; Kürsten, D.; Krause, K.; Kothe, E.; Martin, K.; Roth, M.; Köhler, J.M. Application of micro-segmented flow for two-dimensional characterization of the combinatorial effect of zinc and copper ions on metal-tolerant Streptomyces strains. Appl. Microbiol. Biotechnol. 2013, 97, 8923–8930. [Google Scholar] [CrossRef]
  16. Funfak, A.; Hartung, R.; Cao, J.; Martin, K.; Wiesmüller, K.-H.; Wolfbeis, O.S.; Köhler, J.M. Highly resolved dose–response functions for drug-modulated bacteria cultivation obtained by fluorometric and photometric flow-through sensing in microsegmented flow. Sens. Actuators B Chem. 2009, 142, 66–72. [Google Scholar] [CrossRef]
  17. Li, H.; Zhang, P.; Hsieh, K.; Wang, T.-H. Combinatorial nanodroplet platform for screening antibiotic combinations. Lab Chip 2022, 22, 621–631. [Google Scholar] [CrossRef]
  18. Cao, J.; Hafermann, L.; Köhler, J.M. Stochastically reduced communities-Microfluidic compartments as model and investigation tool for soil microorganism growth in structured spaces. Eng. Life Sci. 2017, 17, 792–800. [Google Scholar] [CrossRef] [Green Version]
  19. Cao, J.; Chande, C.; Kalensee, F.; Schüler, T.; Köhler, M. Microfluidically supported characterization of responses of Rhodococcus erythropolis strains isolated from different soils on Cu-, Ni-, and Co-stress. Braz. J. Microbiol. 2021, 52, 1405–1415. [Google Scholar] [CrossRef]
  20. Cao, J.; Kalensee, F.; Günther, P.M.; Köhler, J.M. Microsegmented flow-assisted miniaturized culturing for isolation and characterization of heavy metal-tolerant bacteria. Int. J. Environ. Sci. Technol. 2020, 17, 1–16. [Google Scholar] [CrossRef]
  21. Schumann, P.; Kalensee, F.; Cao, J.; Criscuolo, A.; Clermont, D.; Köhler, J.M.; Meier-Kolthoff, J.P.; Neumann-Schaal, M.; Tindall, B.J.; Pukall, R. Reclassification of Haloactinobacterium glacieicola as Occultella glacieicola gen. nov., comb. nov., of Haloactinobacterium album as Ruania alba comb. nov, with an emended description of the genus Ruania, recognition that the genus names Haloactinobacterium and Ruania are heterotypic synonyms and description of Occultella aeris sp. nov., a halotolerant isolate from surface soil sampled at an ancient copper smelter. Int. J. Syst. Evol. Microbiol. 2021, 71, 004769. [Google Scholar] [CrossRef]
  22. Cao, J.; Richter, F.; Kastl, M.; Erdmann, J.; Burgold, C.; Dittrich, D.; Schneider, S.; Köhler, J.M.; Groß, G.A. Droplet-Based Screening for the Investigation of Microbial Nonlinear Dose-Response Characteristics System, Background and Examples. Micromachines 2020, 11, 577. [Google Scholar] [CrossRef] [PubMed]
  23. Cao, J.; Russo, D.A.; Xie, T.; Groß, G.A.; Zedler, J.A.Z. A droplet-based microfluidic platform enables high-throughput combinatorial optimization of cyanobacterial cultivation. Sci. Rep. 2022, 12, 15536. [Google Scholar] [CrossRef] [PubMed]
  24. Stucky, B.J. SeqTrace: A graphical tool for rapidly processing DNA sequencing chromatograms. J. Biomol. Tech. 2012, 23, 90–93. [Google Scholar] [CrossRef] [Green Version]
  25. Drancourt, M.; Berger, P.; Raoult, D. Systematic 16S rRNA gene sequencing of atypical clinical isolates identified 27 new bacterial species associated with humans. J. Clin. Microbiol. 2004, 42, 2197–2202. [Google Scholar] [CrossRef] [Green Version]
  26. Kawai, F. Biodegradation of Polyethers (Polyethylene Glycol, Polypropylene Glycol, Polytetramethylene glycol, and Others). In Biopolymers Online; Matsumura, S., Steinbüchel, A., Eds.; Wiley: Hoboken, NJ, USA, 2005; ISBN 978-3-52-730290-1. [Google Scholar]
  27. Kawai, F.; Takeuchi, M. Taxonomical position of newly isolated polyethylene glycol-utilizing bacteria. J. Ferment. Bioeng. 1996, 82, 492–494. [Google Scholar] [CrossRef]
  28. Kohlweyer, U.; Thiemer, B.; Schräder, T.; Andreesen, J.R. Tetrahydrofuran degradation by a newly isolated culture of Pseudonocardia sp. strain K1. FEMS Microbiol. Lett. 2000, 186, 301–306. [Google Scholar] [CrossRef]
  29. Lopes, C.M.; Felisberti, M.I. Mechanical behaviour and biocompatibility of poly(1-vinyl-2-pyrrolidinone)–gelatin IPN hydrogels. Biomaterials 2003, 24, 1279–1284. [Google Scholar] [CrossRef]
  30. Mark, H.F.; Bikales, N.M.; Overberger, C.G.; Menges, G. Encyclopedia of Polymer Science and Engineering; Wiley-Interscience: New York, NY, USA, 1986; Volume 4, ISBN 978-0-47-188099-8. [Google Scholar]
  31. Julinová, M.; Kupec, J.; Houser, J.; Slavík, R.; Marusincová, H.; Cervenáková, L.; Klívar, S. Removal of polyvinylpyrrolidone from wastewater using different methods. Water Environ. Res. 2012, 84, 2123–2132. [Google Scholar] [CrossRef]
  32. Kawai, F.; Hu, X. Biochemistry of microbial polyvinyl alcohol degradation. Appl. Microbiol. Biotechnol. 2009, 84, 227–237. [Google Scholar] [CrossRef]
  33. Caulfield, M.J.; Qiao, G.G.; Solomon, D.H. Some aspects of the properties and degradation of polyacrylamides. Chem. Rev. 2002, 102, 3067–3084. [Google Scholar] [CrossRef] [PubMed]
  34. Kay-Shoemake, J.L.; Watwood, M.E.; Sojka, R.E.; Lentz, R.D. Polyacrylamide as a substrate for microbial amidase in culture and soil. Soil Biol. Biochem. 1998, 30, 1647–1654. [Google Scholar] [CrossRef]
  35. Yu, F.; Fu, R.; Xie, Y.; Chen, W. Isolation and characterization of polyacrylamide-degrading bacteria from dewatered sludge. Int. J. Environ. Res. Public Health 2015, 12, 4214–4230. [Google Scholar] [CrossRef] [PubMed]
  36. Yasuhara, A.; Shiraishi, H.; Nishikawa, M.; Yamamoto, T.; Nakasugi, O.; Okumura, T.; Kenmotsu, K.; Fukui, H.; Nagase, M.; Kawagoshi, Y. Organic components in leachates from hazardous waste disposal sites. Waste Manag. Res. 1999, 17, 186–197. [Google Scholar] [CrossRef]
  37. Morohoshi, T.; Oi, T.; Aiso, H.; Suzuki, T.; Okura, T.; Sato, S. Biofilm Formation and Degradation of Commercially Available Biodegradable Plastic Films by Bacterial Consortiums in Freshwater Environments. Microbes Environ. 2018, 33, 332–335. [Google Scholar] [CrossRef] [Green Version]
  38. Sagong, H.-Y.; Kim, S.; Lee, D.; Hong, H.; Lee, S.H.; Seo, H.; Kim, K.-J. Structural and functional characterization of an auxiliary domain-containing PET hydrolase from Burkholderiales bacterium. J. Hazard. Mater. 2022, 429, 128267. [Google Scholar] [CrossRef]
  39. Dey, A.S.; Bose, H.; Mohapatra, B.; Sar, P. Biodegradation of Unpretreated Low-Density Polyethylene (LDPE) by Stenotrophomonas sp. and Achromobacter sp., Isolated From Waste Dumpsite and Drilling Fluid. Front. Microbiol. 2020, 11, 603210. [Google Scholar] [CrossRef]
  40. Adelowo, O.O.; Alagbe, S.O.; Ayandele, A.A. Time-Dependent Stability of Used Engine Oil Degradation by Cultures of Pseudomonas fragi and Achromobacter aerogens. Afr. J. Biotechnol. 2006, 5, 2476–2479. [Google Scholar]
  41. Sałek, K.; Zgoła-Grześkowiak, A.; Kaczorek, E. Modification of surface and enzymatic properties of Achromobacter denitrificans and Stenotrophomonas maltophilia in association with diesel oil biodegradation enhanced with alkyl polyglucosides. Colloids Surf. B Biointerfaces 2013, 111, 36–42. [Google Scholar] [CrossRef]
  42. Gumuscu, B.; Tekinay, T. Effective biodegradation of 2,4,6-trinitrotoluene using a novel bacterial strain isolated from TNT-contaminated soil. Int. Biodeterior. Biodegrad. 2013, 85, 35–41. [Google Scholar] [CrossRef]
  43. Bordoloi, N.K.; Rai, S.K.; Chaudhuri, M.K.; Mukherjee, A.K. Deep-desulfurization of dibenzothiophene and its derivatives present in diesel oil by a newly isolated bacterium Achromobacter sp. to reduce the environmental pollution from fossil fuel combustion. Fuel Process. Technol. 2014, 119, 236–244. [Google Scholar] [CrossRef]
  44. Pawelczyk, S.; Abraham, W.-R.; Harms, H.; Müller, S. Community-based degradation of 4-chorosalicylate tracked on the single cell level. J. Microbiol. Methods 2008, 75, 117–126. [Google Scholar] [CrossRef] [PubMed]
  45. Ruiz, O.N.; Brown, L.M.; Radwan, O.; Bowen, L.L.; Gunasekera, T.S.; Mueller, S.S.; West, Z.J.; Striebich, R.C. Metagenomic characterization reveals complex association of soil hydrocarbon-degrading bacteria. Int. Biodeterior. Biodegrad. 2021, 157, 105161. [Google Scholar] [CrossRef]
  46. Smith, J.L.; Doran, J.W. Measurement and Use of pH and Electrical Conductivity for Soil Quality Analysis. In Methods for Assessing Soil Quality; Doran, J.W., Jones, A.J., Eds.; Soil Science Society of America: Madison, WI, USA, 1997; pp. 169–185. ISBN 978-0-89-118944-2. [Google Scholar]
  47. Kaczorek, E.; Sałek, K.; Guzik, U.; Dudzińska-Bajorek, B.; Olszanowski, A. The impact of long-term contact of Achromobacter sp. 4(2010) with diesel oil–Changes in biodegradation, surface properties and hexadecane monooxygenase activity. Int. Biodeterior. Biodegrad. 2013, 78, 7–16. [Google Scholar] [CrossRef]
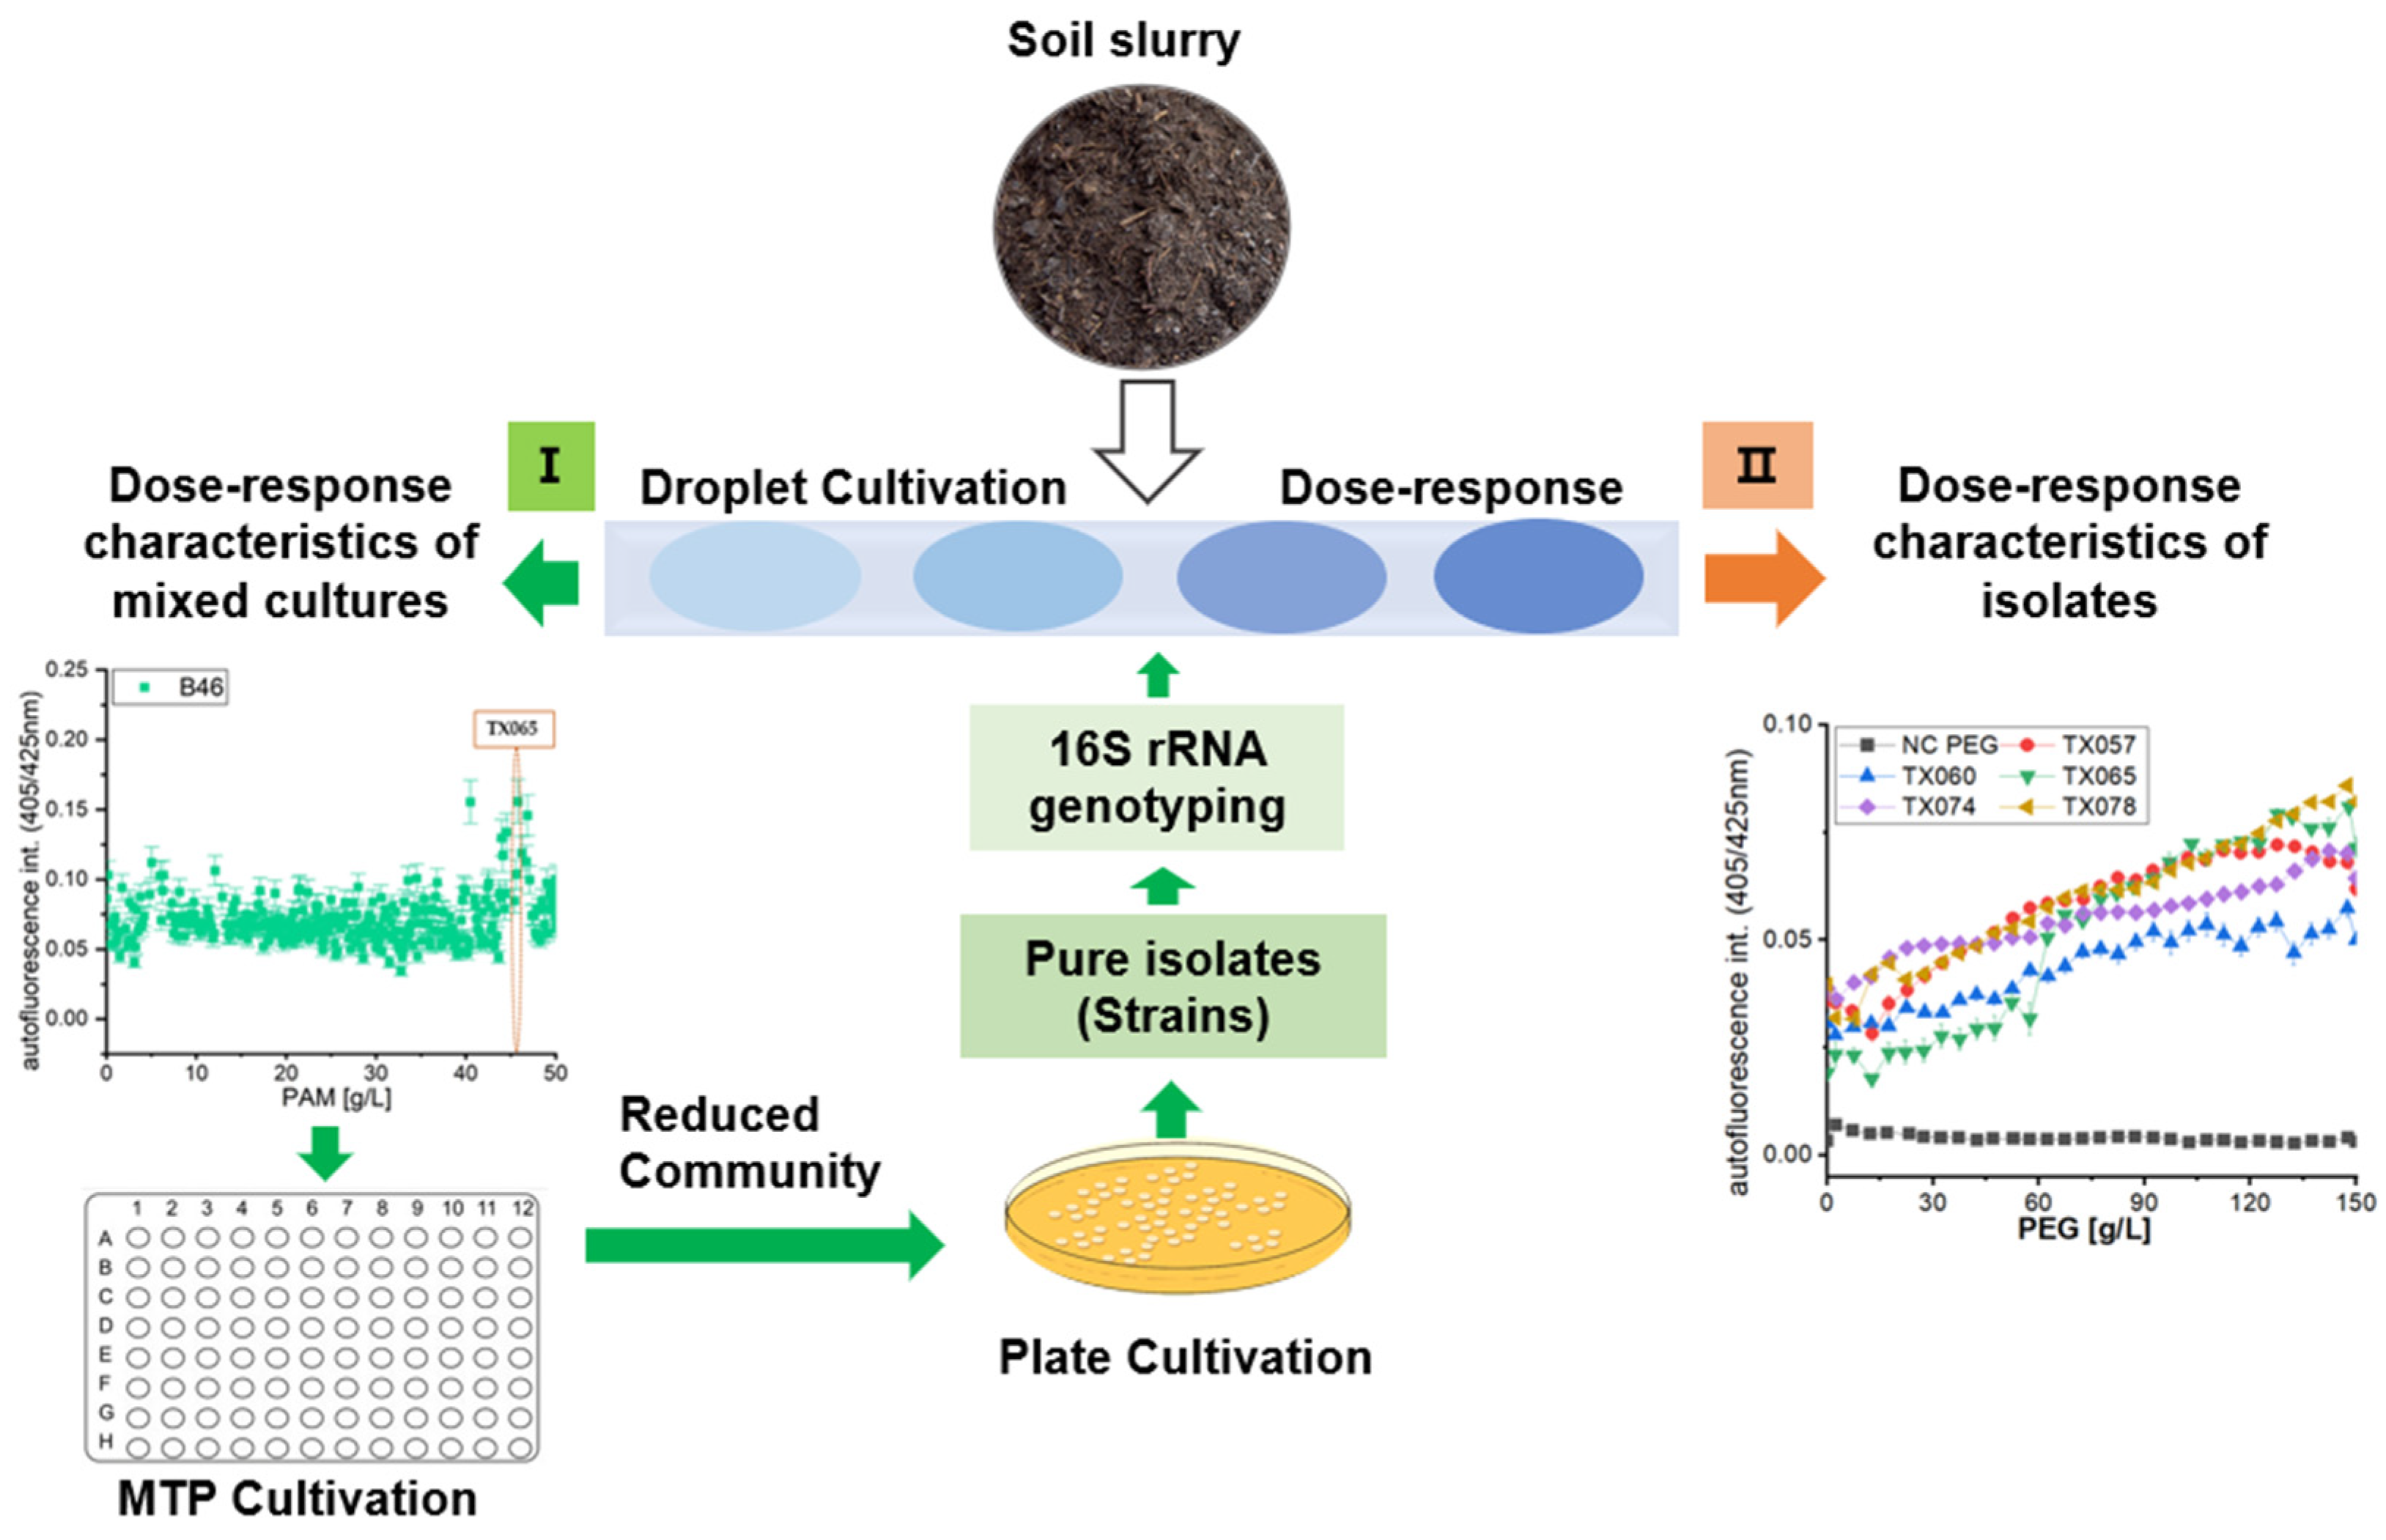
Figure 1. Microfluid cultivation, isolation, and characterization of soil bacteria.
Environments 09 00147 g001
Figure 2. Relative abundance of phyla of soil bacterial community based on the NGS. The classification with less than 1% abundance is classified as ‘other’. The data points represent the abundance of each phylum relative to all phyla in each soil sample.
Environments 09 00147 g002
Figure 3. Relative abundance of orders belonging to the phylum Proteobacteria in each soil bacterial community based on the NGS. These orders can be grouped into class alpha-, beta- delta- and gamma-proteobacteria.
Environments 09 00147 g003
Figure 4. Effect of polymers on soil sample P3 and B46 by the dose-response function in dependence of PEG (a,b) and PAM (c,d) in AM medium: microphotometric signal (a,c) and fluorometric signals (b,d). Each dot represents the optical density/ fluorescence intensity for an individual droplet.
Environments 09 00147 g004
Figure 5. Dose-response curves of isolated Achromobacter spanius strains TX057, TX060, TX065, TX074 and TX078 against 600 Da PEG after 21 days of incubation (a) optical density of the segments measured by microphotometry and (b) normalized autofluorescence intensity of the segments measured by microfluorimetry. Each dot represents the mean and the error bars represent standard deviation of 10 ± 3 droplets.
Environments 09 00147 g005
Figure 6. Dose-response curves of isolated Achromobacter spanius strains TX057, TX060, TX065, TX074 and TX078 against 40 kDa PVP. (a,c,e,g,i) show the optical density of the segments measured by microphotometry and (b,d,f,h,j) show the normalized autofluorescence intensity of the segments measured by microfluorimetry. Each dot represents the mean and the error bars represent standard deviation of 10 ± 3 droplets.
Environments 09 00147 g006
Figure 7. Dose-response curves of isolated Achromobacter spanius strains TX057, TX060, TX065, TX074 and TX078 against 10 kDa PAM. (a,c,e,g,i) show the optical density of the segments measured by microphotometry and (b,d,f,h,j) show the normalized autofluorescence of the segments measured by microfluorimetry. Each dot represents the mean and the error bars represent standard deviation of 10 ± 3 droplets.
Environments 09 00147 g007
Figure 8. Dose-response curves of isolated Achromobacter spanius strains TX057, TX060, TX065, TX074 and TX078 against 1,4-Dioxane (a,c) und Diglyme (b,d). a and c show the optical density of the segments measured by microphotometry, b and d show the normalized autofluorescence intensity of the segments measured by microfluorimetry. Each dot represents the mean and the error bars represent standard deviation of 10 ± 3 droplets.
Environments 09 00147 g008
Table 1. Soil sample description.
Soil SampleLocationGPS Coordinates (Gauss-Krueger)DescriptionCollection Date
P3Pößneck4472.292/5616.998prehistorical mining site4 November 2013
Q16Morungen4446.336/5708.593pre-industrial mining site9 November 2013
B46Sondershausen, Ole Burg4418.862/5690.465prehistorical rampart20 May 2017
HB46Jena4471.400/5643.9Archaeological excavation historical tannery area16 July 2019
Q45Morungen4446.306/5708.705pre-industrial mining site30 December 2015
Table 2. Effectors and range of concentrations used in the screening experiments.
Effector GroupNameConcentration RangeMedium
Synthetic polymerPEG6000–50 g/LAM without glucose
PVP0–50 g/LAM without glucose
PAM0–50 g/LAM without glucose
Organic solvent1,4-dioxiane0–25%AM without glucose
Diglyme0–25%AM without glucose
Table 3. Characteristics of soil samples.
Soil SamplepH-ValueConductivity [µS/cm]Number of ReadsNumber of Reads with the Type of the Genus
Q457.43818.3177,34081,701
Q167.49219.0144,40985,235
B467.7491.3132,60769,322
P37.82245.7133,72567,819
HB46no datano data245,077201,476
Table 4. Overview of obtained A. spanius strains using droplet-based microfluid technique.
Strain CodeTX057TX060TX065TX074TX078
Soil sampleP3Q16B46HB46Q45
EffectorPEG600PEG600PAMPAMPAM
Effector conc.41 g/L46 g/L46 g/L32 g/L28 g/L
Sequencing resultAchromobacter spaniusAchromobacter spaniusAchromobacter spaniusAchromobacter spaniusAchromobacter spanius
Query cover100%100%100%99%100%
Percent identity98.71%99.28%97.99%97.56%99.35%
Publisher’s Note: MDPI stays neutral with regard to jurisdictional claims in published maps and institutional affiliations.