
Greenspaces and Human Well-Being: Perspectives from a Rapidly Urbanising Low-Income Country


Abstract
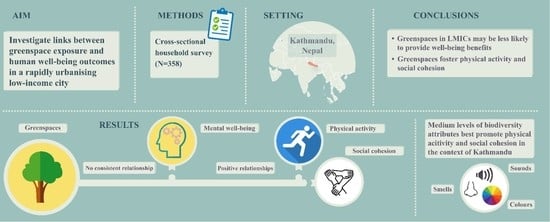
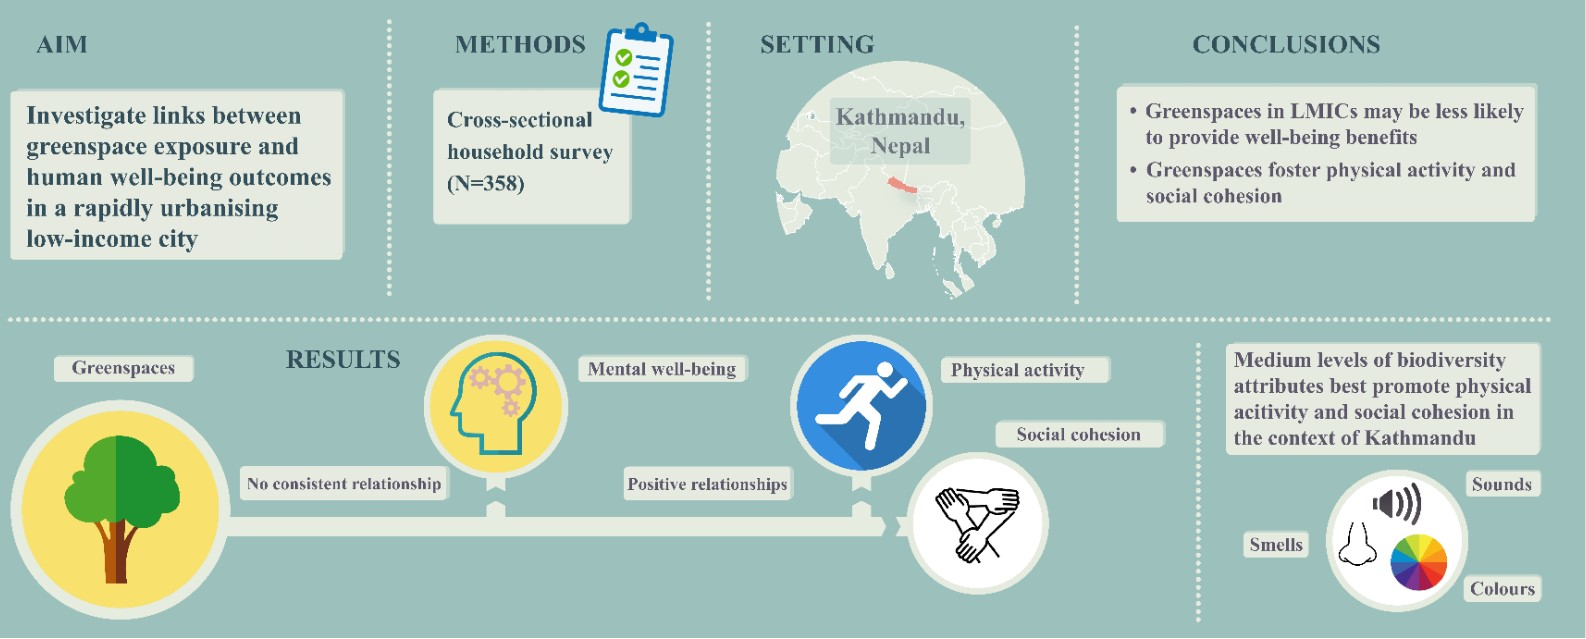
1. Introduction
2. Materials and Methods
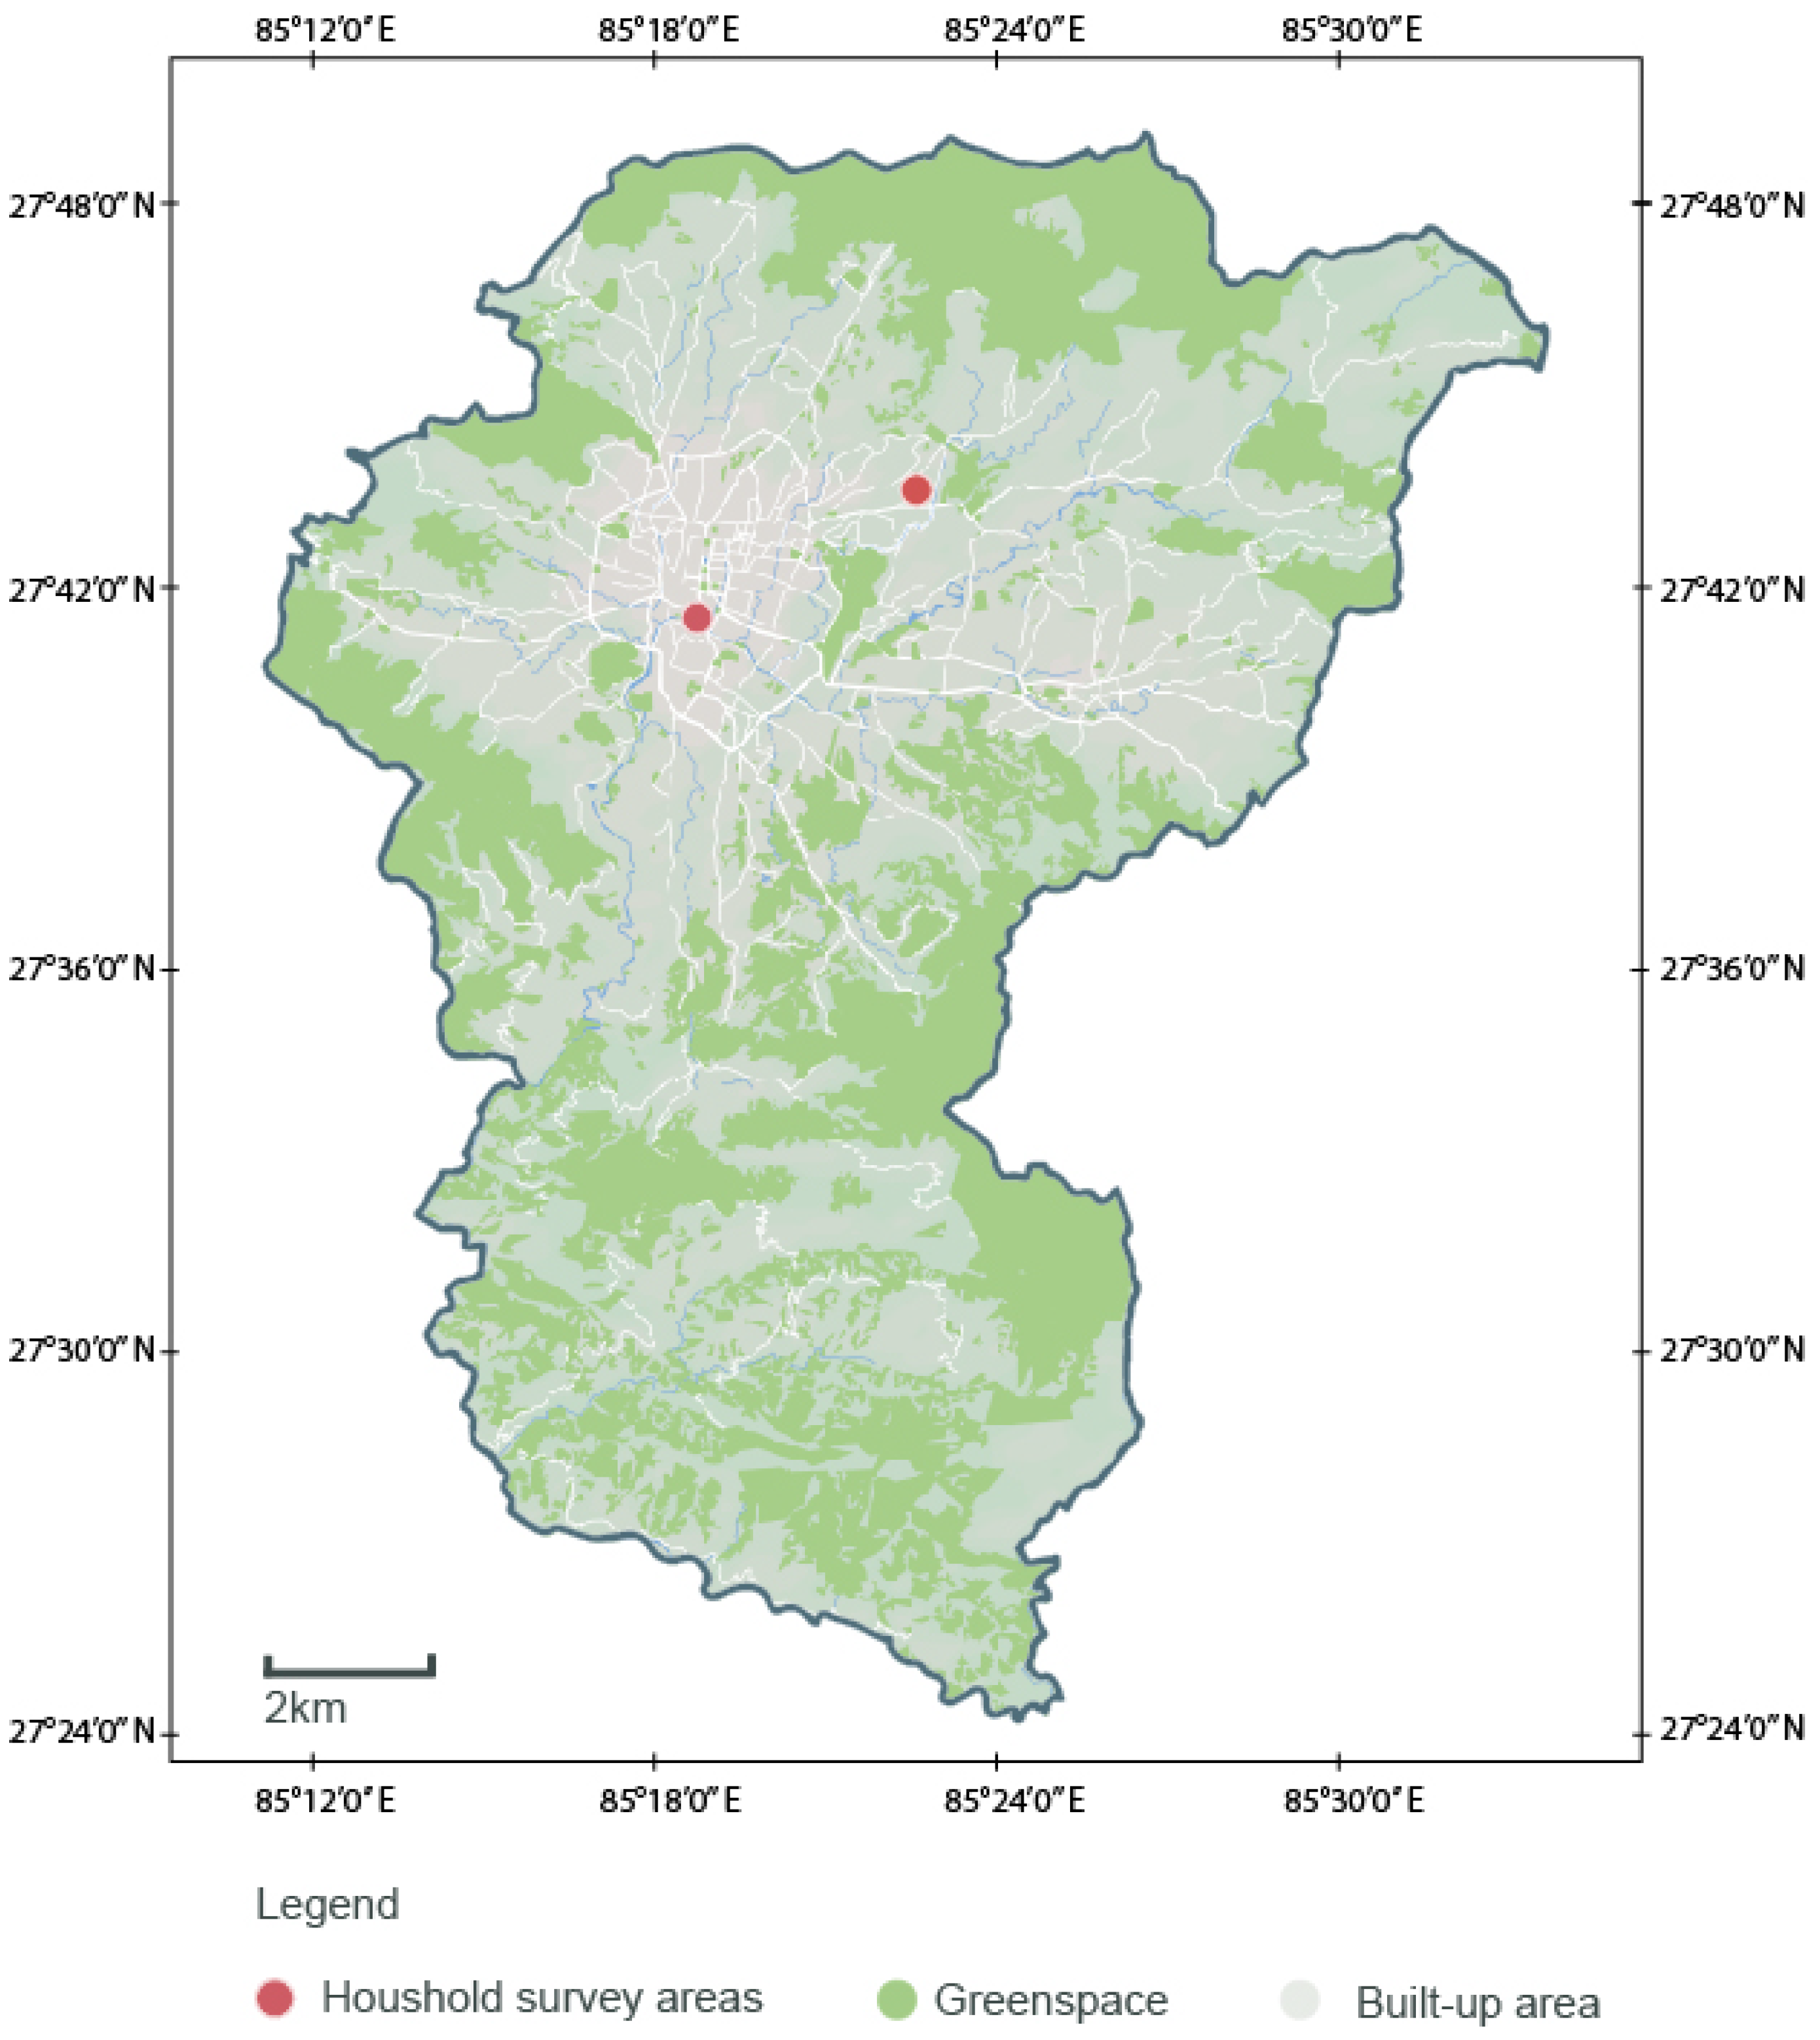
2.1. Setting
2.2. Sample Population
2.3. Survey
2.3.1. Sampling Design
2.3.2. Measures
2.3.3. Statistical Analyses
2.3.4. Ethical Considerations
3. Results
3.1. Sample Characteristics
3.2. Links between Measures of Greenspace Exposure and Human Well-Being Outcomes
4. Discussion
5. Conclusions
Supplementary Materials
Author Contributions
Funding
Data Availability Statement
Acknowledgments
Conflicts of Interest
References
- Ferrari, A.J.; Charlson, F.; Norman, R.E.; Patten, S.; Freedman, G.D.; Murray, C.J.; Vos, T.; Whiteford, H. Burden of depressive disorders by country, sex, age, and year: Findings from the global burden of disease study 2010. PLoS Med. 2013, 10, e1001547. [Google Scholar] [CrossRef] [PubMed]
- GBD 2019 Diseases and Injuries Collaborators. Global burden of 369 diseases and injuries in 204 countries and territories, 1990–2019: A systematic analysis for the global burden of disease study 2019. Lancet 2020, 396, 1204–1222. [Google Scholar] [CrossRef] [PubMed]
- Whiteford, H.A.; Degenhardt, L.; Rehm, J.; Baxter, A.J.; Ferrari, A.J.; Erskine, H.E.; Charlson, F.J.; Norman, R.E.; Flaxman, A.D.; Johns, N.; et al. Global burden of disease attributable to mental and substance use disorders: Findings from the global burden of disease study 2010. Lancet 2013, 382, 1575–1586. [Google Scholar] [CrossRef]
- Moussavi, S.; Chatterji, S.; Verdes, E.; Tandon, A.; Patel, V.; Ustun, B. Depression, chronic diseases, and decrements in health: Results from the world health surveys. Lancet 2007, 370, 851–858. [Google Scholar] [CrossRef] [PubMed]
- Kohrt, B.A.; Luitel, N.P.; Acharya, P.; Jordans, M.J.D. Detection of depression in low resource settings: Validation of the Patient Health Questionnaire (PHQ-9) and cultural concepts of distress in Nepal. BMC Psychiatry 2016, 16, 58. [Google Scholar] [CrossRef] [PubMed]
- Luitel, N.P.; Jordans, M.J.; Adhikari, A.; Upadhaya, N.; Hanlon, C.; Lund, C.; Komproe, I.H. Mental health care in Nepal: Current situation and challenges for development of a district mental health care plan. Confl. Health 2015, 9, 3. [Google Scholar] [CrossRef]
- World Health Organization. Global Status Report on Non-Communicable Diseases 2014; World Health Organization: Geneva, Switzerland, 2014; ISBN 9789241564854.
- United Nations. World Urbanization Prospects; United Nations: New York, NY, USA, 2014. [Google Scholar]
- Angel, S.; Parent, J.; Civco, D.L.; Blei, A.; Potere, D. The dimensions of global urban expansion: Estimates and projections for all countries, 2000–2050. Prog. Plan. 2011, 75, 53–107. [Google Scholar] [CrossRef]
- McPhearson, T.; Pickett, S.T.A.; Grimm, N.B.; Niemelä, J.; Alberti, M.; Elmqvist, T.; Weber, C.; Haase, D.; Breuste, J.; Qureshi, S. Advancing urban ecology toward a science of cities. Bioscience 2016, 66, 198–212. [Google Scholar] [CrossRef]
- Galea, S.; Vlahov, D. (Eds.) . Handbook of Urban Health; Springer Science & Business Media: Berlin, Germany, 2005. [Google Scholar]
- Dye, C. Health and Urban Living. Science 2008, 319, 766–769. [Google Scholar] [CrossRef]
- Habitat, U.N. Urbanization and development. Emerg. Futures 2016, 1, 47–66. [Google Scholar] [CrossRef]
- Sallis, J.F.; Cerin, E.; Conway, T.L.; Adams, M.A.; Frank, L.D.; Pratt, M.; Salvo, D.; Schipperijn, J.; Smith, G.; Cain, K.L.; et al. Physical activity in relation to urban environments in 14 cities worldwide: A cross-sectional study. Lancet 2016, 387, 2207–2217. [Google Scholar] [CrossRef]
- Vlahov, D.; Galea, S. Urbanization, urbanicity, and health. J. Urban Health 2002, 79, S1–S12. [Google Scholar] [CrossRef]
- Shanahan, D.F.; Fuller, R.A.; Bush, R.; Lin, B.B.; Gaston, K.J. The health benefits of urban nature: How much do we need? Bioscience 2015, 65, 476–485. [Google Scholar] [CrossRef]
- Peen, J.; Schoevers, R.A.; Beekman, A.; Dekker, J. The current status of urban-rural differences in psychiatric disorders. Acta Psychiatr. Scand. 2010, 121, 84–93. [Google Scholar] [CrossRef] [PubMed]
- Subbaraman, R.; Nolan, L.B.; Shitole, T.; Sawant, K.; Shitole, S.; Sood, K.; Nanarkar, M.; Ghannam, J.; E Bloom, D.; Patil-Deshmukh, A. The psychological toll of slum living—An assessment of mental health, disability, and slum-related adversities in Mumbai, India. Lancet Glob. Health 2014, 2, S26. [Google Scholar] [CrossRef]
- Ezeh, A.; Oyebode, O.; Satterthwaite, D.; Chen, Y.-F.; Ndugwa, R.; Sartori, J.; Mberu, B.; Melendez-Torres, G.J.; Haregu, T.; Watson, S.I.; et al. The history, geography, and sociology of slums and the health problems of people who live in slums. Lancet 2017, 389, 547–558. [Google Scholar] [CrossRef]
- Missinne, S.; Bracke, P. Depressive symptoms among immigrants and ethnic minorities: A population based study in 23 European countries. Soc. Psychiatry 2010, 47, 97–109. [Google Scholar] [CrossRef] [PubMed]
- Lindert, J.; von Ehrenstein, O.S.; Priebe, S.; Mielck, A.; Brähler, E. Depression and anxiety in labor migrants and refugees—A systematic review and meta-analysis. Soc. Sci. Med. 2009, 69, 246–257. [Google Scholar] [CrossRef]
- Lund, C.; Breen, A.; Flisher, A.J.; Kakuma, R.; Corrigall, J.; Joska, J.A.; Swartz, L.; Patel, V. Poverty and common mental disorders in low and middle income countries: A systematic review. Soc. Sci. Med. 2010, 71, 517–528. [Google Scholar] [CrossRef] [PubMed]
- Meyer-Lindenberg, A. Social neuroscience and mechanisms of risk for mental disorders. World Psychiatry 2014, 13, 143–144. [Google Scholar] [CrossRef]
- Lovell, R.; Depledge, M.; Maxwell, S. Health and the Natural Environment: A Review of Evidence, Policy, Practice and Opportunities for the Future; Department for Environment, Food and Rural Affairs: London, UK, 2018.
- Stigsdotter, U.K.; Ekholm, O.; Schipperijn, J.; Toftager, M.; Kamper-Jørgensen, F.; Randrup, T.B. Health promoting outdoor environments—Associations between green space, and health, health-related quality of life and stress based on a Danish national representative survey. Scand. J. Public Health 2010, 38, 411–417. [Google Scholar] [CrossRef] [PubMed]
- White, M.P.; Alcock, I.; Wheeler, B.W.; Depledge, M.H. Would you be happier living in a greener urban area? A fixed-effects analysis of panel data. Psychol. Sci. 2013, 24, 920–928. [Google Scholar] [CrossRef]
- Mavoa, S.; Davern, M.; Breed, M.; Hahs, A. Higher levels of greenness and biodiversity associate with greater subjective wellbeing in adults living in Melbourne, Australia. Health Place 2019, 57, 321–329. [Google Scholar] [CrossRef] [PubMed]
- Roberts, H.; van Lissa, C.; Hagedoorn, P.; Kellar, I.; Helbich, M. The effect of short-term exposure to the natural environment on depressive mood: A systematic review and meta-analysis. Environ. Res. 2019, 177, 108606. [Google Scholar] [CrossRef]
- Gascon, M.; Sánchez-Benavides, G.; Dadvand, P.; Martínez, D.; Gramunt, N.; Gotsens, X.; Cirach, M.; Vert, C.; Molinuevo, J.L.; Crous-Bou, M.; et al. Long-term exposure to residential green and blue spaces and anxiety and depression in adults: A cross-sectional study. Environ. Res. 2018, 162, 231–239. [Google Scholar] [CrossRef]
- Yao, W.; Zhang, X.; Gong, Q. The effect of exposure to the natural environment on stress reduction: A meta-analysis. Urban For. Urban Green. 2021, 57, 126932. [Google Scholar] [CrossRef]
- Ohly, H.; White, M.P.; Wheeler, B.W.; Bethel, A.; Ukoumunne, O.C.; Nikolaou, V.; Garside, R. Attention Restoration Theory: A systematic review of the attention restoration potential of exposure to natural environments. J. Toxicol. Environ. Health Part B 2016, 19, 305–343. [Google Scholar] [CrossRef]
- Marselle, M.R.; Hartig, T.; Cox, D.T.; de Bell, S.; Knapp, S.; Lindley, S.; Triguero-Mas, M.; Böhning-Gaese, K.; Braubach, M.; Cook, P.A.; et al. Pathways linking biodiversity to human health: A conceptual framework. Environ. Int. 2020, 150, 106420. [Google Scholar] [CrossRef]
- Markevych, I.; Schoierer, J.; Hartig, T.; Chudnovsky, A.; Hystad, P.; Dzhambov, A.M.; De Vries, S.; Triguero-Mas, M.; Brauer, M.; Nieuwenhuijsen, M.; et al. Exploring pathways linking greenspace to health: Theoretical and methodological guidance. Environ. Res. 2017, 158, 301–317. [Google Scholar] [CrossRef] [PubMed]
- Nawrath, M.; Elsey, H.; Dallimer, M. Why cultural ecosystem services matter most: Exploring the pathways linking greenspaces and mental health in a low-income country. Sci. Total Environ. 2021, 806, 150551. [Google Scholar] [CrossRef] [PubMed]
- Hough, R.L. Biodiversity and human health: Evidence for causality? Biodivers. Conserv. 2013, 23, 267–288. [Google Scholar] [CrossRef]
- Marselle, M.R.; Martens, D.; Dallimer, M.; Irvine, K.N. Review of the mental health and well-being benefits of biodiversity. In Biodiversity and Health in the Face of Climate Change; Marselle, M.R., Stadler, J., Korn, H., Irvine, K.N., Bonn, A., Eds.; Springer International Publishing: Cham, Germany, 2019; pp. 175–211. [Google Scholar]
- United Nations. Convention on Biological Diversity; United Nations: New York, NY, USA, 1992. [Google Scholar]
- Lovell, R.; Wheeler, B.W.; Higgins, S.L.; Irvine, K.N.; Depledge, M.H. A systematic review of the health and well-being benefits of biodiverse environments. J. Toxicol. Environ. Health Part B 2014, 17, 1–20. [Google Scholar] [CrossRef]
- Dallimer, M.; Irvine, K.N.; Skinner, A.M.J.; Davies, Z.G.; Rouquette, J.R.; Maltby, L.; Warren, P.H.; Armsworth, P.; Gaston, K.J. Biodiversity and the feel-good factor: Understanding associations between self-reported human well-being and species richness. Bioscience 2012, 62, 47–55. [Google Scholar] [CrossRef]
- Hoyle, H.; Hitchmough, J.; Jorgensen, A. All about the ‘wow factor’? The relationships between aesthetics, restorative effect and perceived biodiversity in designed urban planting. Landsc. Urban Plan. 2017, 164, 109–123. [Google Scholar] [CrossRef]
- Austen, G.E.; Dallimer, M.; Irvine, K.N.; Maund, P.R.; Fish, R.D.; Davies, Z.G. Exploring shared public perspectives on biodiversity attributes. People Nat. 2021, 3, 901–913. [Google Scholar] [CrossRef]
- Lamichhane, D.; Thapa, H.B. Participatory urban forestry in Nepal: Gaps and ways forward. Urban For. Urban Green. 2012, 11, 105–111. [Google Scholar] [CrossRef]
- Central Bureau of Statistics Nepal. National Population and Housing Census 2011; Government of Nepal: Kathmandu, Nepal, 2011.
- Ishtiaque, A.; Shrestha, M.; Chhetri, N. Rapid urban growth in the Kathmandu Valley, Nepal: Monitoring land use land cover dynamics of a Himalayan City with landsat imageries. Environments 2017, 4, 72. [Google Scholar] [CrossRef]
- Tol, W.A.; Kohrt, B.A.; Jordans, M.J.; Thapa, S.B.; Pettigrew, J.; Upadhaya, N.; de Jong, J.T. Political violence and mental health: A multi-disciplinary review of the literature on Nepal. Soc. Sci. Med. 2010, 70, 35–44. [Google Scholar] [CrossRef]
- Pokhrel, S. Green space suitability evaluation for urban resilience: An analysis of Kathmandu Metropolitan city, Nepal. Environ. Res. Commun. 2019, 1, 105003. [Google Scholar] [CrossRef]
- Bennet, L.; Dahal, D.R.; Govindasamy, P. Caste Ethnic and Regional Identity in Nepal: Further Analysis of the 2006 Nepal Demographic and Health Survey; Macro International: Calverton, MD, USA, 2008; pp. 23–25. [Google Scholar]
- Sharma, V.; Mishra, S.; Yesudas, R.; Rajput, R.S. A review on ficus religiosa (Sacred Fig). Int. J. Res. Anal. Rev. 2019, 6, 901–906. [Google Scholar]
- Myers, N.; Mittermeier, R.A.; Mittermeier, C.G.; Da Fonseca, G.A.; Kent, J. Biodiversity hotspots for conservation priorities. Nature 2000, 468, 895. [Google Scholar] [CrossRef] [PubMed]
- Risal, A.; Manandhar, K.; Linde, M.; Steiner, T.J.; Holen, A. Anxiety and depression in Nepal: Prevalence, comorbidity and associations. BMC Psychiatry 2016, 16, 102. [Google Scholar] [CrossRef] [PubMed]
- Elsey, H.; Manandah, S.; Sah, D.; Khanal, S.; MacGuire, F.; King, R.; Wallace, H.; Baral, S.C. Public health risks in urban slums: Findings of the qualitative ‘healthy kitchens healthy cities’ study in Kathmandu, Nepal. PLoS ONE 2016, 11, e0163798. [Google Scholar] [CrossRef] [PubMed]
- Aryal, K.K.; Mehata, S.; Neupane, S.; Vaidya, A.; Dhimal, M.; Dhakal, P.; Rana, S.; Bhusal, C.L.; Lohani, G.R.; Paulin, F.H.; et al. The burden and determinants of non communicable diseases risk factors in Nepal: Findings from a nationwide STEPS survey. PLoS ONE 2015, 10, e0134834. [Google Scholar] [CrossRef] [PubMed]
- Kohrt, B.A.; Harper, I. Navigating diagnoses: Understanding mind-body relations, mental health, and stigma in Nepal. Cult. Med. Psychiatry 2008, 32, 462–491. [Google Scholar] [CrossRef] [PubMed]
- Pendse, S.R.; Karusala, N.; Siddarth, D.; Gonsalves, P.; Mehrotra, S.; Naslund, J.A.; Sood, M.; Kumar, N.; Sharma, A. Mental health in the global south: Challenges and opportunities in HCI for development. In Proceedings of the COMPASS 2019—Conference on Computing and Sustainable Societies, Accra, Ghana, 3–5 July 2019; pp. 22–36. [Google Scholar] [CrossRef]
- Gurung, D.; Poudyal, A.; Wang, Y.L.; Neupane, M.; Bhattarai, K.; Wahid, S.S.; Aryal, S.; Heim, E.; Gronholm, P.; Thornicroft, G.; et al. Stigma against mental health disorders in Nepal conceptualised with a ‘what matters most’ framework: A scoping review. Epidemiol. Psychiatr. Sci. 2022, 31, e11. [Google Scholar] [CrossRef] [PubMed]
- Raguram, R.D.P.M.; Weiss, M.G.; Channabasavanna, S.M.; Devins, G.M. Stigma, depression, and somatization in South India. Am. J. Psychiatry 1996, 153, 1043–1049. [Google Scholar]
- Corrigan, P.W.; Druss, B.G.; Perlick, D.A. The impact of mental illness stigma on seeking and participating in mental health care. Psychol. Sci. Public Interest 2014, 15, 37–70. [Google Scholar] [CrossRef]
- Keller, S. What does mental health have to do with well-being? Bioethics 2019, 34, 228–234. [Google Scholar] [CrossRef]
- Gallegos-Riofrío, C.A.; Arab, H.; Carrasco-Torrontegui, A.; Gould, R.K. Chronic deficiency of diversity and pluralism in research on nature’s mental health effects: A planetary health problem. Curr. Res. Environ. Sustain. 2022, 4, 100148. [Google Scholar] [CrossRef]
- Amiya, R.M.; Poudel, K.C.; Poudel-Tandukar, K.; Pandey, B.D.; Jimba, M. Perceived family support, depression, and suicidal ideation among people living with HIV/AIDS: A cross-sectional study in the Kathmandu Valley, Nepal. PLoS ONE 2014, 9, e90959. [Google Scholar] [CrossRef] [PubMed]
- Suh, E.; Diener, E.; Oishi, S.; Triandis, H.C. The shifting basis of life satisfaction judgments across cultures: Emotions versus norms. J. Personal. Soc. Psychol. 1998, 74, 482–493. [Google Scholar] [CrossRef]
- Turner, A.G. Expert Group Meeting to Review the Draft Handbook on Designing of Household Sample Surveys; United Nations Statistics Division: New York, NY, USA, 2003. [Google Scholar]
- Nawrath, M.; Kowarik, I.; Fischer, L.K. The influence of green streets on cycling behavior in European cities. Landsc. Urban Plan. 2019, 190, 103598. [Google Scholar] [CrossRef]
- Natural England. Monitor of Engagement with the Natural Environment: The National Survey on People and the Natural Environment—Headline Report 2019; Natural England: York, UK, 2019.
- Kamitsis, I.; Francis, A.J. Spirituality mediates the relationship between engagement with nature and psychological wellbeing. J. Environ. Psychol. 2013, 36, 136–143. [Google Scholar] [CrossRef]
- Wood, C.; Barron, D.; Smyth, N. The current and retrospective intentional nature exposure scales: Development and factorial validity. Int. J. Environ. Res. Public Health 2019, 16, 4443. [Google Scholar] [CrossRef] [PubMed]
- Lee, P.H.; Macfarlane, D.J.; Lam, T.H.; Stewart, S.M. Validity of the international physical activity questionnaire short form. Int. J. Behav. Nutr. Phys. Act. 2011, 8, 115. [Google Scholar] [CrossRef]
- IPAQ. Guidelines for Data Processing and Analysis of the International Physical Activity Questionnaire (IPAQ); Karolinska Institute: Stockholm, Sweden, 2005. [Google Scholar] [CrossRef]
- Buckner, J.C. The development of an instrument to measure neighborhood cohesion. Am. J. Community Psychol. 1988, 16, 771–791. [Google Scholar] [CrossRef]
- Konerding, U.; Elkhuizen, S.G.; Faubel, R.; Forte, P.; Malmström, T.; Pavi, E.; Janssen, M.B. The validity of the EQ-5D-3L items: An investigation with type 2 diabetes patients from six European countries. Health Qual. Life Outcomes 2014, 12, 1–11. [Google Scholar] [CrossRef]
- Ghimire, S.; Pradhananga, P.; Baral, B.K.; Shrestha, N. Factors associated with health-related quality of life among hypertensive patients in Kathmandu, Nepal. Front. Cardiovasc. Med. 2017, 4, 69. [Google Scholar] [CrossRef]
- IPBES. Chapter 2.1. Status and Trends—Drivers of Change. In The IPBES Global Assessment on Biodiversity and Ecosystem Services; IPBES: Bonn, Germany, 2019. [Google Scholar]
- Apicella, C.; Norenzayan, A.; Henrich, J. Beyond WEIRD: A review of the last decade and a look ahead to the global laboratory of the future. Ethol. Sociobiol. 2020, 41, 319–329. [Google Scholar] [CrossRef]
- Nawrath, M.; Guenat, S.; Elsey, H.; Dallimer, M. Exploring uncharted territory: Do urban greenspaces support mental health in low- and middle-income countries? Environ. Res. 2020, 194, 110625. [Google Scholar] [CrossRef] [PubMed]
- Mowafi, M.; Khadr, Z.; Bennett, G.; Hill, A.; Kawachi, I.; Subramanian, S. Is access to neighborhood green space associated with BMI among Egyptians? A multilevel study of Cairo neighborhoods. Health Place 2011, 18, 385–390. [Google Scholar] [CrossRef] [PubMed]
- Gruebner, O.; Khan, M.M.H.; Lautenbach, S.; Müller, D.; Krämer, A.; Lakes, T.; Hostert, P. Mental health in the slums of Dhaka—A geoepidemiological study. BMC Public Health 2012, 12, 177. [Google Scholar] [CrossRef]
- Amano, T.; Butt, I.; Peh, K.S.-H. The importance of green spaces to public health: A multi-continental analysis. Ecol. Appl. 2018, 28, 1473–1480. [Google Scholar] [CrossRef] [PubMed]
- Fone, D.; White, J.; Farewell, D.; Kelly, M.; John, G.; Lloyd, K.; Williams, G.; Dunstan, F. Effect of neighbourhood deprivation and social cohesion on mental health inequality: A multilevel population-based longitudinal study. Psychol. Med. 2014, 44, 2449–2460. [Google Scholar] [CrossRef] [PubMed]
- Etnier, J.L. Psychology of physical activity: Determinants, well-being, and interventions. Med. Sci. Sports Exerc. 2001, 33, 1796. [Google Scholar] [CrossRef][Green Version]
- Dadvand, P.; Gascon, M.; Markevych, I. Green spaces and child health and development. In Biodiversity and Health in the Face of Climate Change; Springer: Cham, Switzerland, 2019. [Google Scholar]
- Pensini, P.; Horn, E.; Caltabiano, N.J. An exploration of the relationships between adults’ childhood and current nature exposure and their mental well-being. Child. Youth Environ. 2016, 26, 125. [Google Scholar] [CrossRef]
- Pretty, J.; Angus, C.; Bain, M.; Barton, J.; Gladwell, V.; Hine, R.; Sellens, M. Nature, childhood, health and life pathways. Occas. Pap. 2009, 2, 202009-2. [Google Scholar]
- Muthuri, S.K.; Wachira, L.-J.M.; Leblanc, A.G.; Francis, C.E.; Sampson, M.; Onywera, V.O.; Tremblay, M.S. Temporal trends and correlates of physical activity, sedentary behaviour, and physical fitness among school-aged children in sub-saharan africa: A systematic review. Int. J. Environ. Res. Public Health 2014, 11, 3327–3359. [Google Scholar] [CrossRef]
- Soga, M.; Gaston, K.J. Extinction of experience: The loss of human-nature interactions. Front. Ecol. Environ. 2016, 14, 94–101. [Google Scholar] [CrossRef]
- Nisbet, E.K.; Zelenski, J.M.; Murphy, S.A. Happiness is in our Nature: Exploring nature relatedness as a contributor to subjective well-being. J. Happiness Stud. 2011, 12, 303–322. [Google Scholar] [CrossRef]
- Dean, J.H.; Shanahan, D.F.; Bush, R.; Gaston, K.J.; Lin, B.B.; Barber, E.; Franco, L.; Fuller, R.A. Is nature relatedness associated with better mental and physical health? Int. J. Environ. Res. Public Health 2018, 15, 1371. [Google Scholar] [CrossRef] [PubMed]
- Buijs, A.E.; Elands, B.H.; Langers, F. No wilderness for immigrants: Cultural differences in images of nature and landscape preferences. Landsc. Urban Plan. 2009, 91, 113–123. [Google Scholar] [CrossRef]
- Capaldi, C.A.; Dopko, R.L.; Zelenski, J.M. The relationship between nature connectedness and happiness: A meta-analysis. Front. Psychol. 2014, 5, 976. [Google Scholar] [CrossRef]
- Hägerhäll, C.M.; Sang, Å.O.; Englund, J.-E.; Ahlner, F.; Rybka, K.; Huber, J.; Burenhult, N. Do Humans Really Prefer Semi-open Natural Landscapes? A Cross-Cultural Reappraisal. Front. Psychol. 2018, 9, 822. [Google Scholar] [CrossRef]
- Lindemann-Matthies, P.; Keller, D.; Li, X.; Schmid, B. Attitudes toward forest diversity and forest ecosystem services—A cross-cultural comparison between China and Switzerland. J. Plant Ecol. 2014, 7, 1–9. [Google Scholar] [CrossRef]


| Mobility | Self-Care | Usual Activities | Pain and Discomfort | Anxiety and Depression | |
|---|---|---|---|---|---|
| Level 1 | 347 (98.00) | 346 (97.70) | 347 (98.00) | 285 (80.50) | 284 (80.20) |
| Level 2 | 7 (2.00) | 7 (2.00) | 6 (1.70) | 68 (19.20) | 68 (19.2) |
| Level 3 | 0 (0.00) | 1 (0.30) | 1 (0.30) | 1 (0.30) | 2 (0.6) |
| Chi2 (df) | p-Value | Fisher’s (p-Value) | |
|---|---|---|---|
| Greenspace use | |||
| Quality of life | NA | NA | >0.05 |
| Heart-mind problems | NA | NA | >0.05 |
| Depressive disorders | NA | NA | >0.05 |
| Physical activity | NA | NA | p < 0.001 |
| Social cohesion | NA | NA | p < 0.001 |
| Distance to nearest greenspace | |||
| Quality of life | 1.18 (3) | >0.05 | NA |
| Heart-mind problems | NA | NA | >0.05 |
| Depressive disorders | NA | NA | >0.05 |
| Physical activity | NA | NA | >0.05 |
| Social cohesion | NA | NA | >0.05 |
| Greenspace experience as child | |||
| Quality of life | NA | NA | >0.05 |
| Heart-mind problems | NA | NA | >0.05 |
| Depressive disorders | NA | NA | <0.05 |
| Physical activity | NA | NA | <0.01 |
| Social cohesion | NA | NA | <0.001 |
| Greenspace experience as teenager | |||
| Quality of life | NA | NA | >0.05 |
| Heart-mind problems | NA | NA | <0.05 |
| Depressive disorders | NA | NA | >0.05 |
| Physical activity | NA | NA | <0.01 |
| Social cohesion | NA | NA | <0.001 |
| Importance of greenspaces | |||
| Quality of life | NA | NA | >0.05 |
| Heart-mind problems | NA | NA | <0.05 |
| Depressive disorders | NA | NA | >0.05 |
| Physical activity | NA | NA | <0.001 |
| Social cohesion | NA | NA | <0.001 |
| Noticing nature | NA | NA | |
| Quality of life | NA | NA | <0.001 |
| Heart-mind problems | NA | NA | <0.001 |
| Depressive disorders | NA | NA | <0.05 |
| Physical activity | NA | NA | <0.05 |
| Social cohesion | NA | NA | <0.001 |
| Variety of sounds in nearby greenspace | |||
| Quality of life | 13.10 (2) | <0.01 | NA |
| Heart-mind problems | 2.30 (2) | >0.05 | NA |
| Depressive disorders | NA | NA | >0.05 |
| Physical activity | 41.87 (4) | <0.001 | NA |
| Social cohesion | NA | NA | <0.001 |
| Variety of colours in nearby greenspace | |||
| Quality of life | 23.40 (2) | <0.001 | NA |
| Heart-mind problems | 4.19 (2) | >0.05 | NA |
| Depressive disorders | NA | NA | >0.05 |
| Physical activity | 35.5 (4) | <0.001 | NA |
| Social cohesion | NA | NA | <0.001 |
| Variety of smells in nearby greenspace | |||
| Quality of life | (2) 18.52 | <0.001 | NA |
| Heart-mind problems | 4.71 (2) | >0.05 | NA |
| Depressive disorders | NA | NA | >0.05 |
| Physical activity | 36.72 (4) | <0.001 | NA |
| Social cohesion | NA | NA | <0.001 |
| Social cohesion | |||
| Quality of life | NA | NA | <0.05 |
| Heart-mind problems | NA | NA | <0.001 |
| Depressive disorders | NA | NA | >0.05 |
| Physical activity | |||
| Quality of life | 8.62 (2) | <0.05 | |
| Heart-mind problems | NA | NA | <0.01 |
| Depressive disorders | NA | NA | >0.05 |
Publisher’s Note: MDPI stays neutral with regard to jurisdictional claims in published maps and institutional affiliations. |
© 2022 by the authors. Licensee MDPI, Basel, Switzerland. This article is an open access article distributed under the terms and conditions of the Creative Commons Attribution (CC BY) license (https://creativecommons.org/licenses/by/4.0/).
Share and Cite
Nawrath, M.; Elsey, H.; Rijal, M.L.; Dallimer, M. Greenspaces and Human Well-Being: Perspectives from a Rapidly Urbanising Low-Income Country. Environments 2022, 9, 148. https://doi.org/10.3390/environments9120148
Nawrath M, Elsey H, Rijal ML, Dallimer M. Greenspaces and Human Well-Being: Perspectives from a Rapidly Urbanising Low-Income Country. Environments. 2022; 9(12):148. https://doi.org/10.3390/environments9120148
Chicago/Turabian StyleNawrath, Maximilian, Helen Elsey, Moti Lal Rijal, and Martin Dallimer. 2022. "Greenspaces and Human Well-Being: Perspectives from a Rapidly Urbanising Low-Income Country" Environments 9, no. 12: 148. https://doi.org/10.3390/environments9120148
APA StyleNawrath, M., Elsey, H., Rijal, M. L., & Dallimer, M. (2022). Greenspaces and Human Well-Being: Perspectives from a Rapidly Urbanising Low-Income Country. Environments, 9(12), 148. https://doi.org/10.3390/environments9120148