Land Conversion Dynamics in the Borana Rangelands of Southern Ethiopia: An Integrated Assessment Using Remote Sensing Techniques and Field Survey Data

Abstract
:1. Introduction
2. Materials and Methods
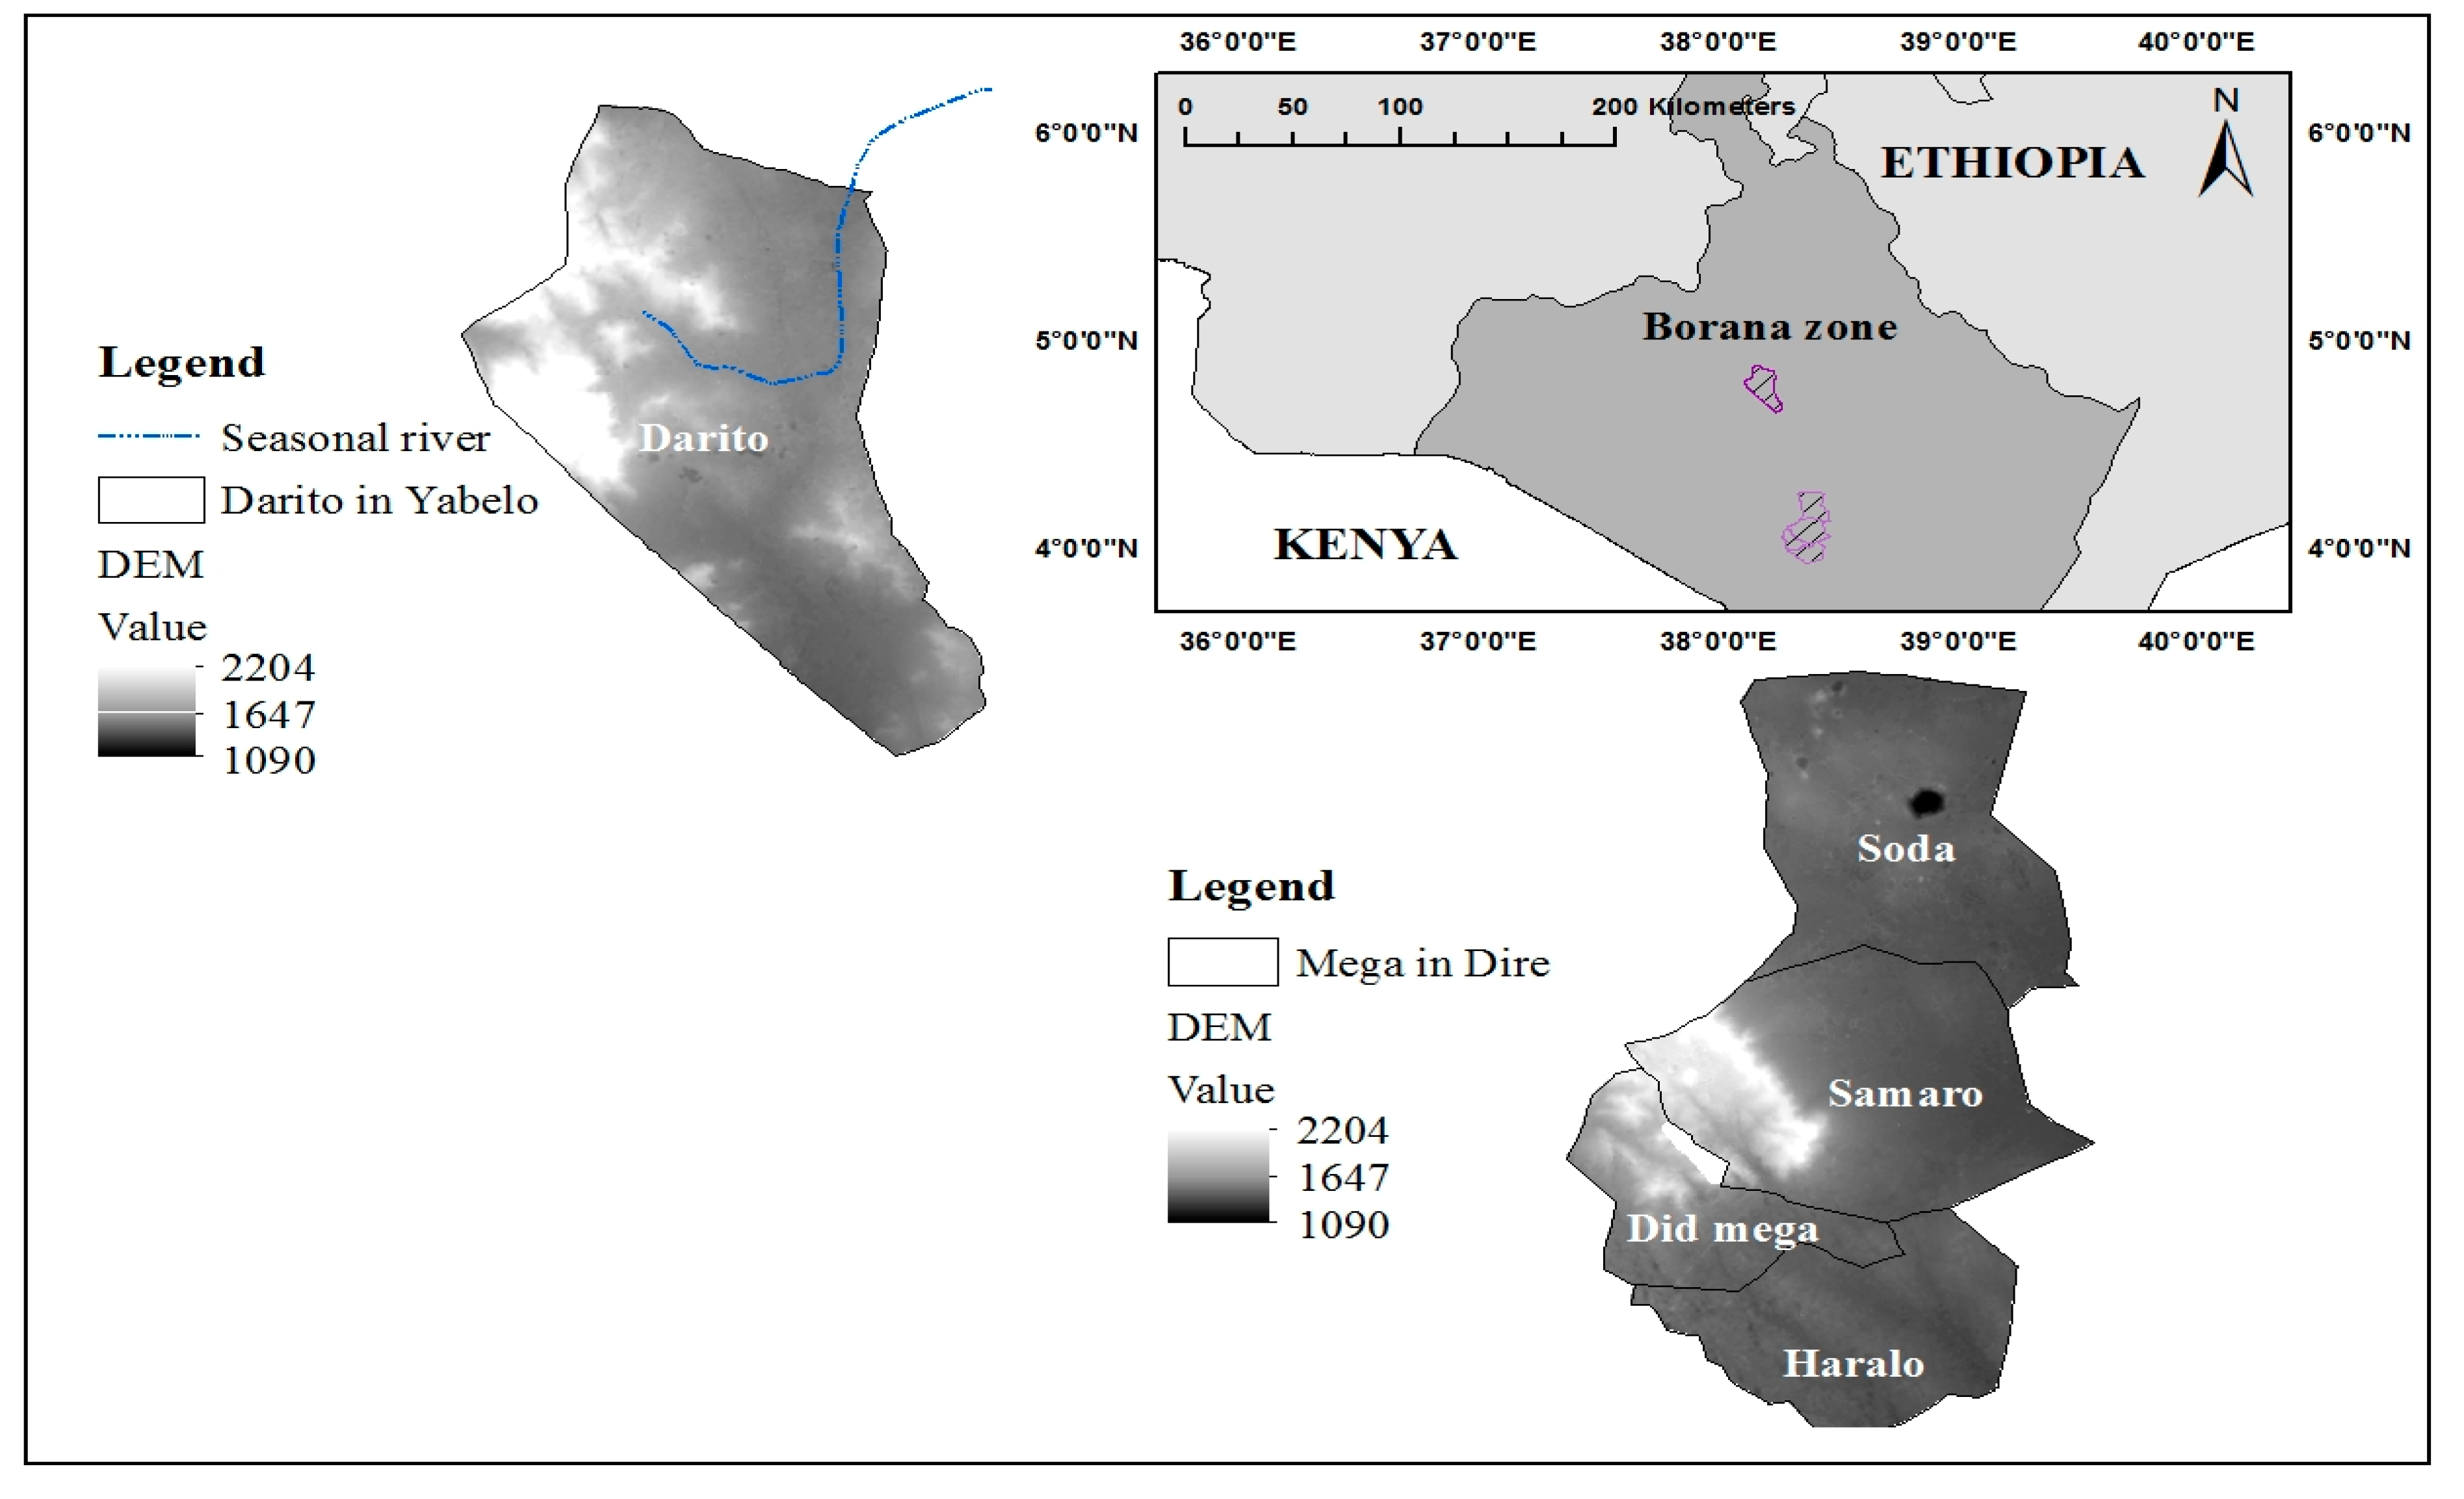
2.1. The Study Areas

2.2. Data Collected for Land Use and Land Cover Classification
2.3. Socio-Economic Data Collected
2.4. Data Analysis
2.4.1. Land Cover Classification and Change Detection

| Land Use/Cover Class | Description |
|---|---|
| Woodland | Land covered with vegetation species (plants higher than 5 m to 20 m classified as woodland trees |
| Bushland | Land composed of bush or shrubs (plants lower than 5 m are classified as bushland) |
| Grassland | Land cover dominated by grass and herbs with scattered trees and shrubs |
| Cultivated land | Crop fields with rural settlements |
| Bare land | Non vegetative land such as rock, sand and lava |
| Shrub/Grassland with seasonal floods | Semi-permanent and seasonal water logged land with less than 10% of vegetation cover (flood plains comprised of herbs, grass and dwarf bushes) |
| Settlement/Built up area | Permanent settlement areas with more than 2000 inhabitants |
2.4.2. Socio-Demographic and Economic Profile of the Respondents
| Land Cover Classes | Land Cover | Land Cover change | ||||
|---|---|---|---|---|---|---|
| 1985 | 2011 | 1985–2011 | ||||
| Area (ha) | % | Area (ha) | % | Area (ha) | % | |
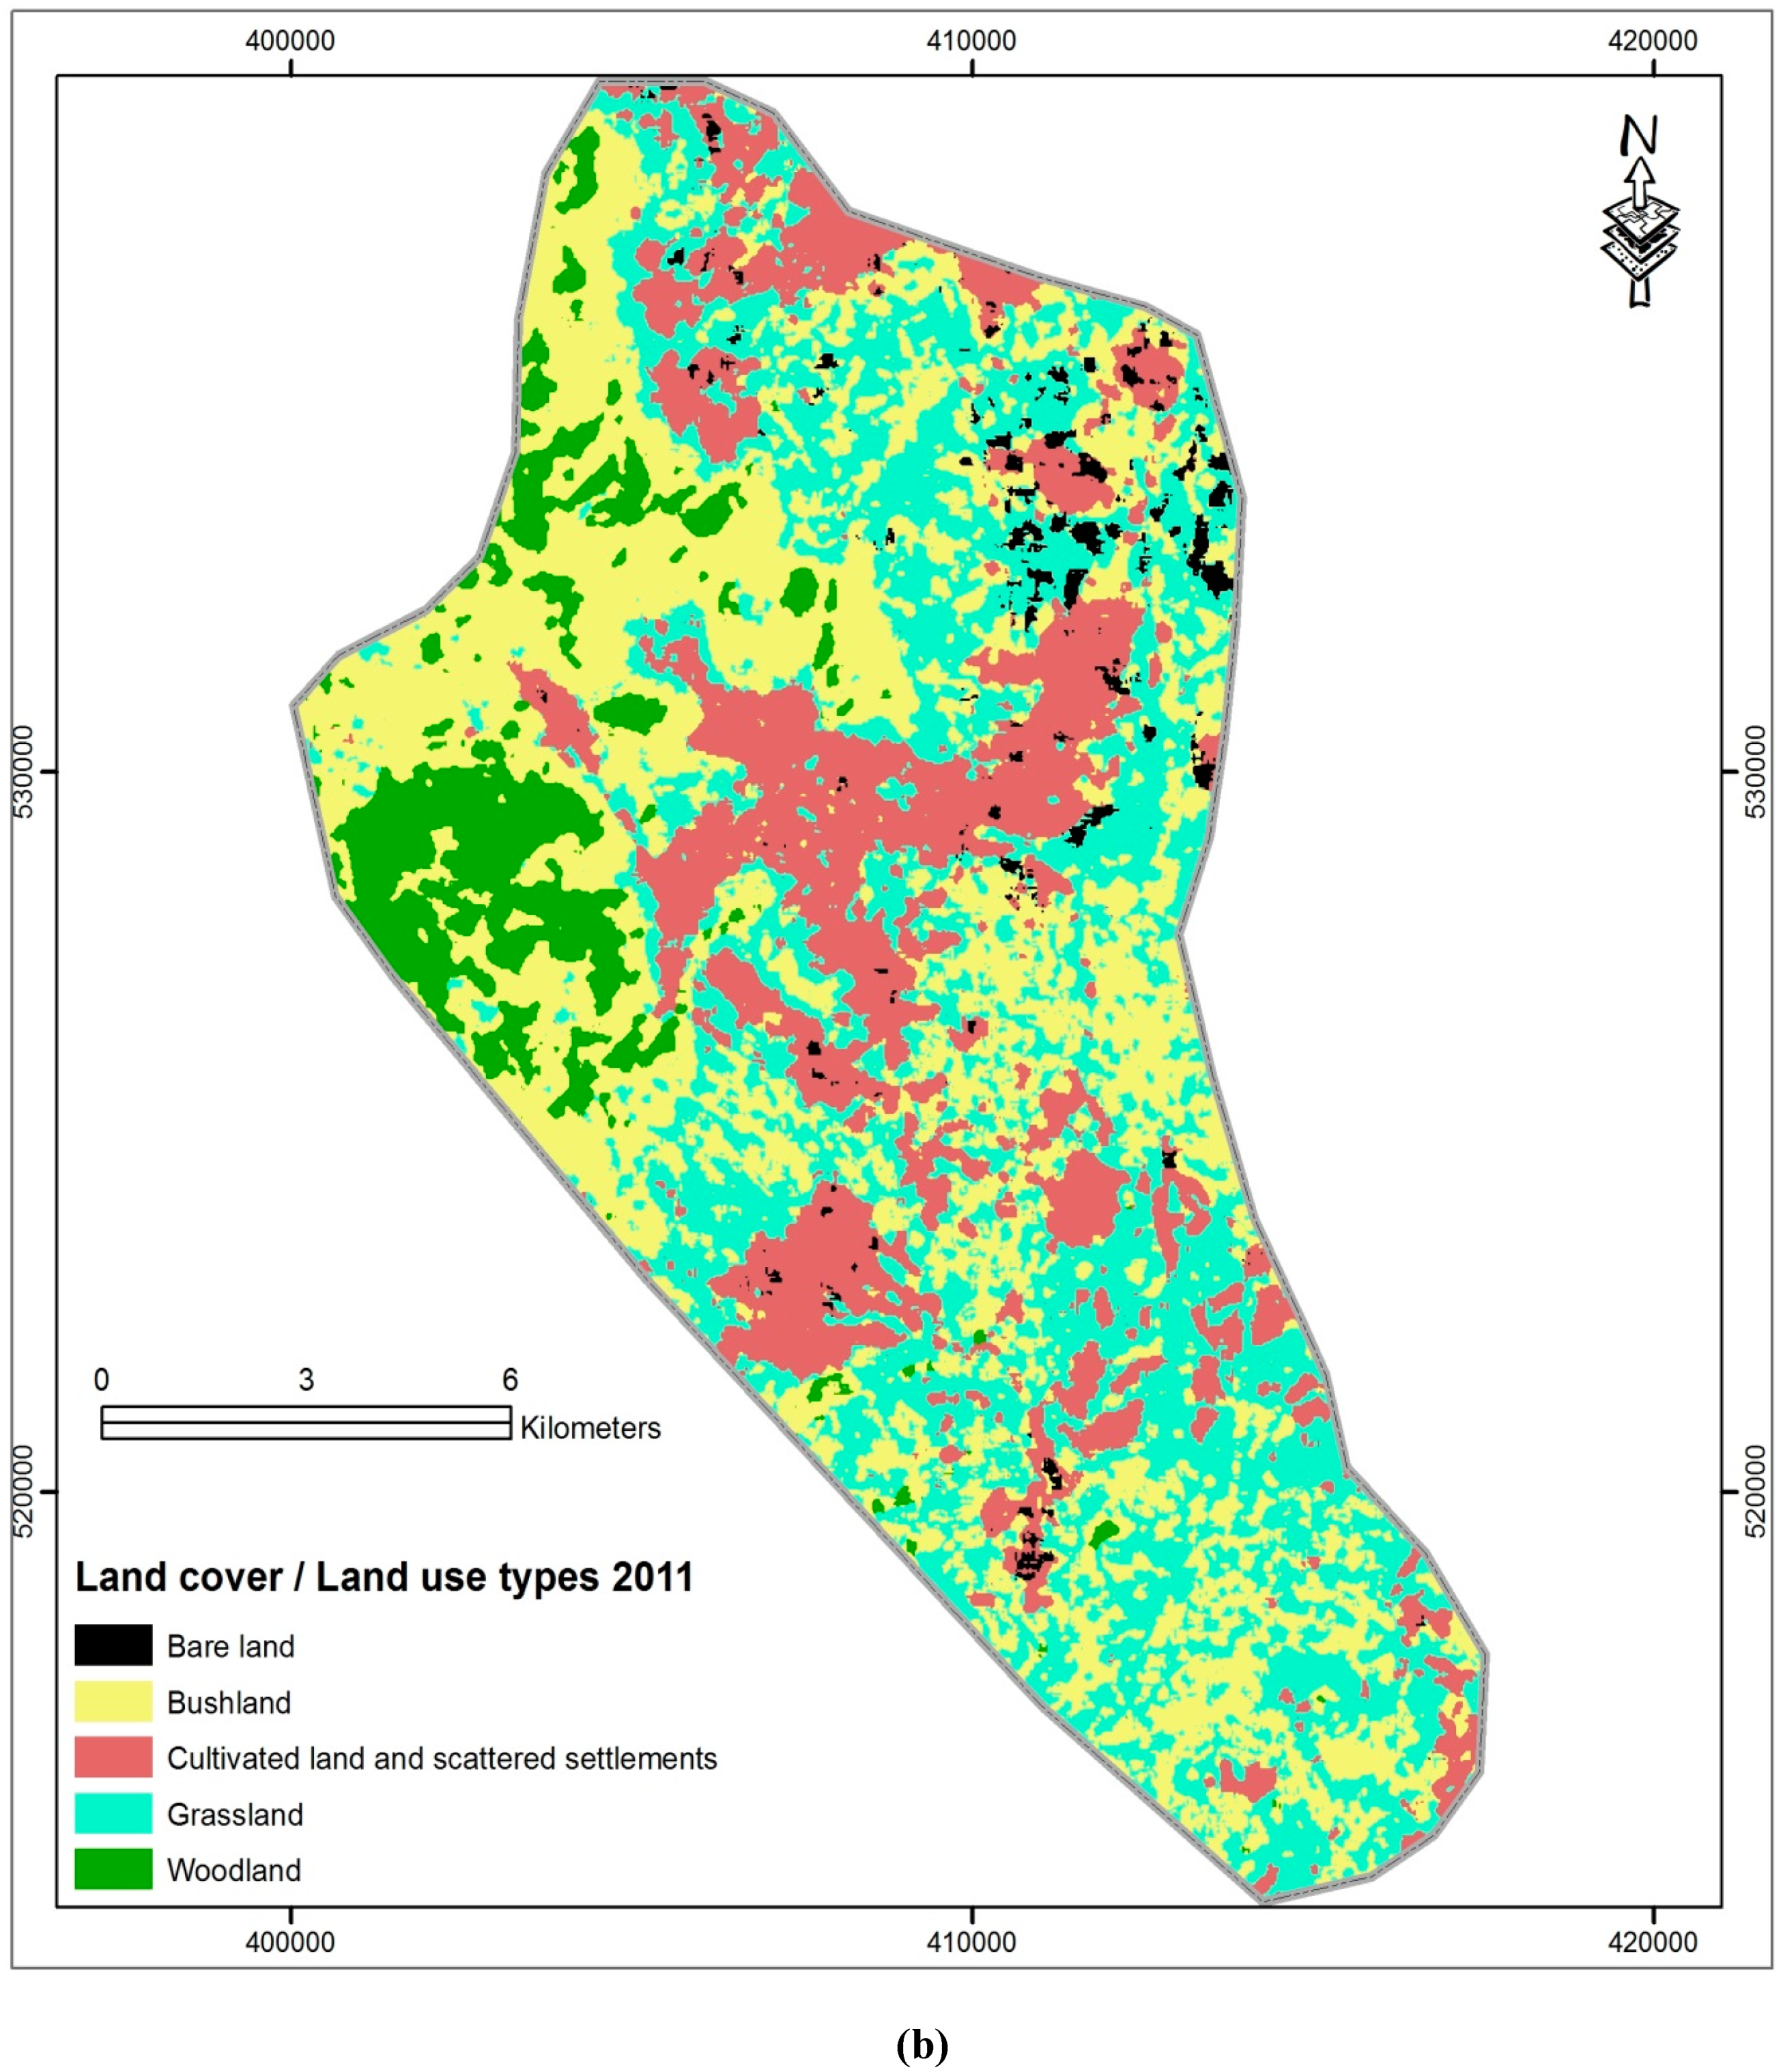
| Bare land | 0 | 0 | 364 | 1.60 | 364 | 1.60 |
| Bushland | 10576 | 46.50 | 8293 | 36.46 | −2283 | −10.04 |
| Cultivated land | 1917 | 8.43 | 4758 | 20.92 | 2841 | 12.49 |
| Grassland | 8274 | 36.38 | 7620 | 33.50 | −654 | −2.88 |
| Woodland | 1979 | 8.70 | 1711 | 7.52 | −268 | −1.18 |
| Total | 22746 | 100 | 22746 | 100 | ||
| Land Cover Classes | Land Cover in Soda | Land Cover Change | ||||
| 1985 | 2011 | 1985–2011 | ||||
| Area (ha) | % | Area (ha) | % | Area (ha) | % | |
| Bare land | 1243 | 7.60 | 523 | 3.20 | −720 | −4.40 |
| Bushland | 8886 | 54.32 | 4428 | 27.07 | −4458 | −27.25 |
| Cultivated land | 1431 | 8.75 | 694 | 4.24 | −737 | −4.51 |
| Shrub/grassland with seasonal floods | 633 | 3.87 | 773 | 4.73 | 140 | 0.86 |
| Grassland | 3881 | 23.73 | 8441 | 52.60 | 4560 | 27.88 |
| Woodland | 284 | 1.74 | 1499 | 9.60 | 1215 | 7.43 |
| Total | 16358 | 100 | 16358 | 100 | ||
| Land Cover Classes | Land Cover in Samaro | Land Cover Change | ||||
| 1985 | 2011 | 1985–2011 | ||||
| Area (ha) | % | Area (ha) | % | Area (ha) | % | |
| Bare land | 1270 | 7.11 | 1729 | 9.67 | 459 | 2.57 |
| Bushland | 8451 | 47.29 | 4315 | 24.14 | −4136 | −23.14 |
| Cultivated land | 1665 | 9.32 | 1639 | 9.17 | −26 | −0.15 |
| Shrub/grassland with seasonal floods | 2380 | 13.32 | 1932 | 10.81 | −448 | −2.51 |
| Grassland | 2991 | 16.74 | 6924 | 38.74 | 3933 | 22.01 |
| Woodland | 1047 | 5.86 | 1254 | 7.02 | 207 | 1.16 |
| Settlement/Built up Area | 68 | 0.38 | 79 | 0.44 | 11 | 0.06 |
| Total | 17872 | 100 | 17872 | 100 | ||
| Land Cover Classes | Land Cover in Haralo | Land Cover Change | ||||
| 1985 | 2011 | 1985–2011 | ||||
| Area (ha) | % | Area (ha) | % | Area (ha) | % | |
| Bare land | 576 | 5.16 | 2044 | 18.30 | 1468 | 13.14 |
| Bushland | 5813 | 52.04 | 2320 | 20.77 | −3493 | −31.27 |
| Cultivated land | 1231 | 11.02 | 1601 | 14.33 | 370 | 3.31 |
| Shrub/grassland with seasonal floods | 2209 | 19.78 | 1979 | 17.72 | −230 | −2.06 |
| Grassland | 1340 | 12.00 | 3146 | 28.16 | 1806 | 16.17 |
| Woodland | 1 | 0.01 | 80 | 0.72 | 79 | 0.71 |
| Total | 11170 | 100 | 11170 | 100 | ||
| Land Cover Classes | Land Cover in Did mega | Land Cover Change | ||||
| 1985 | 2011 | 1985–2011 | ||||
| Area (ha) | % | Area (ha) | % | Area (ha) | % | |
| Bare land | 919 | 13.20 | 1069 | 15.35 | 150 | 2.15 |
| Bushland | 4041 | 58.04 | 1860 | 26.71 | −2181 | −31.32 |
| Cultivated land | 851 | 12.22 | 912 | 13.10 | 61 | 0.88 |
| Shrub/grassland with seasonal floods | 339 | 4.87 | 940 | 13.50 | 601 | 8.63 |
| Grassland | 341 | 4.90 | 1908 | 27.40 | 1567 | 22.50 |
| Woodland | 472 | 6.78 | 274 | 3.94 | −198 | −2.84 |
| Total | 6963 | 100 | 6963 | 100 | ||
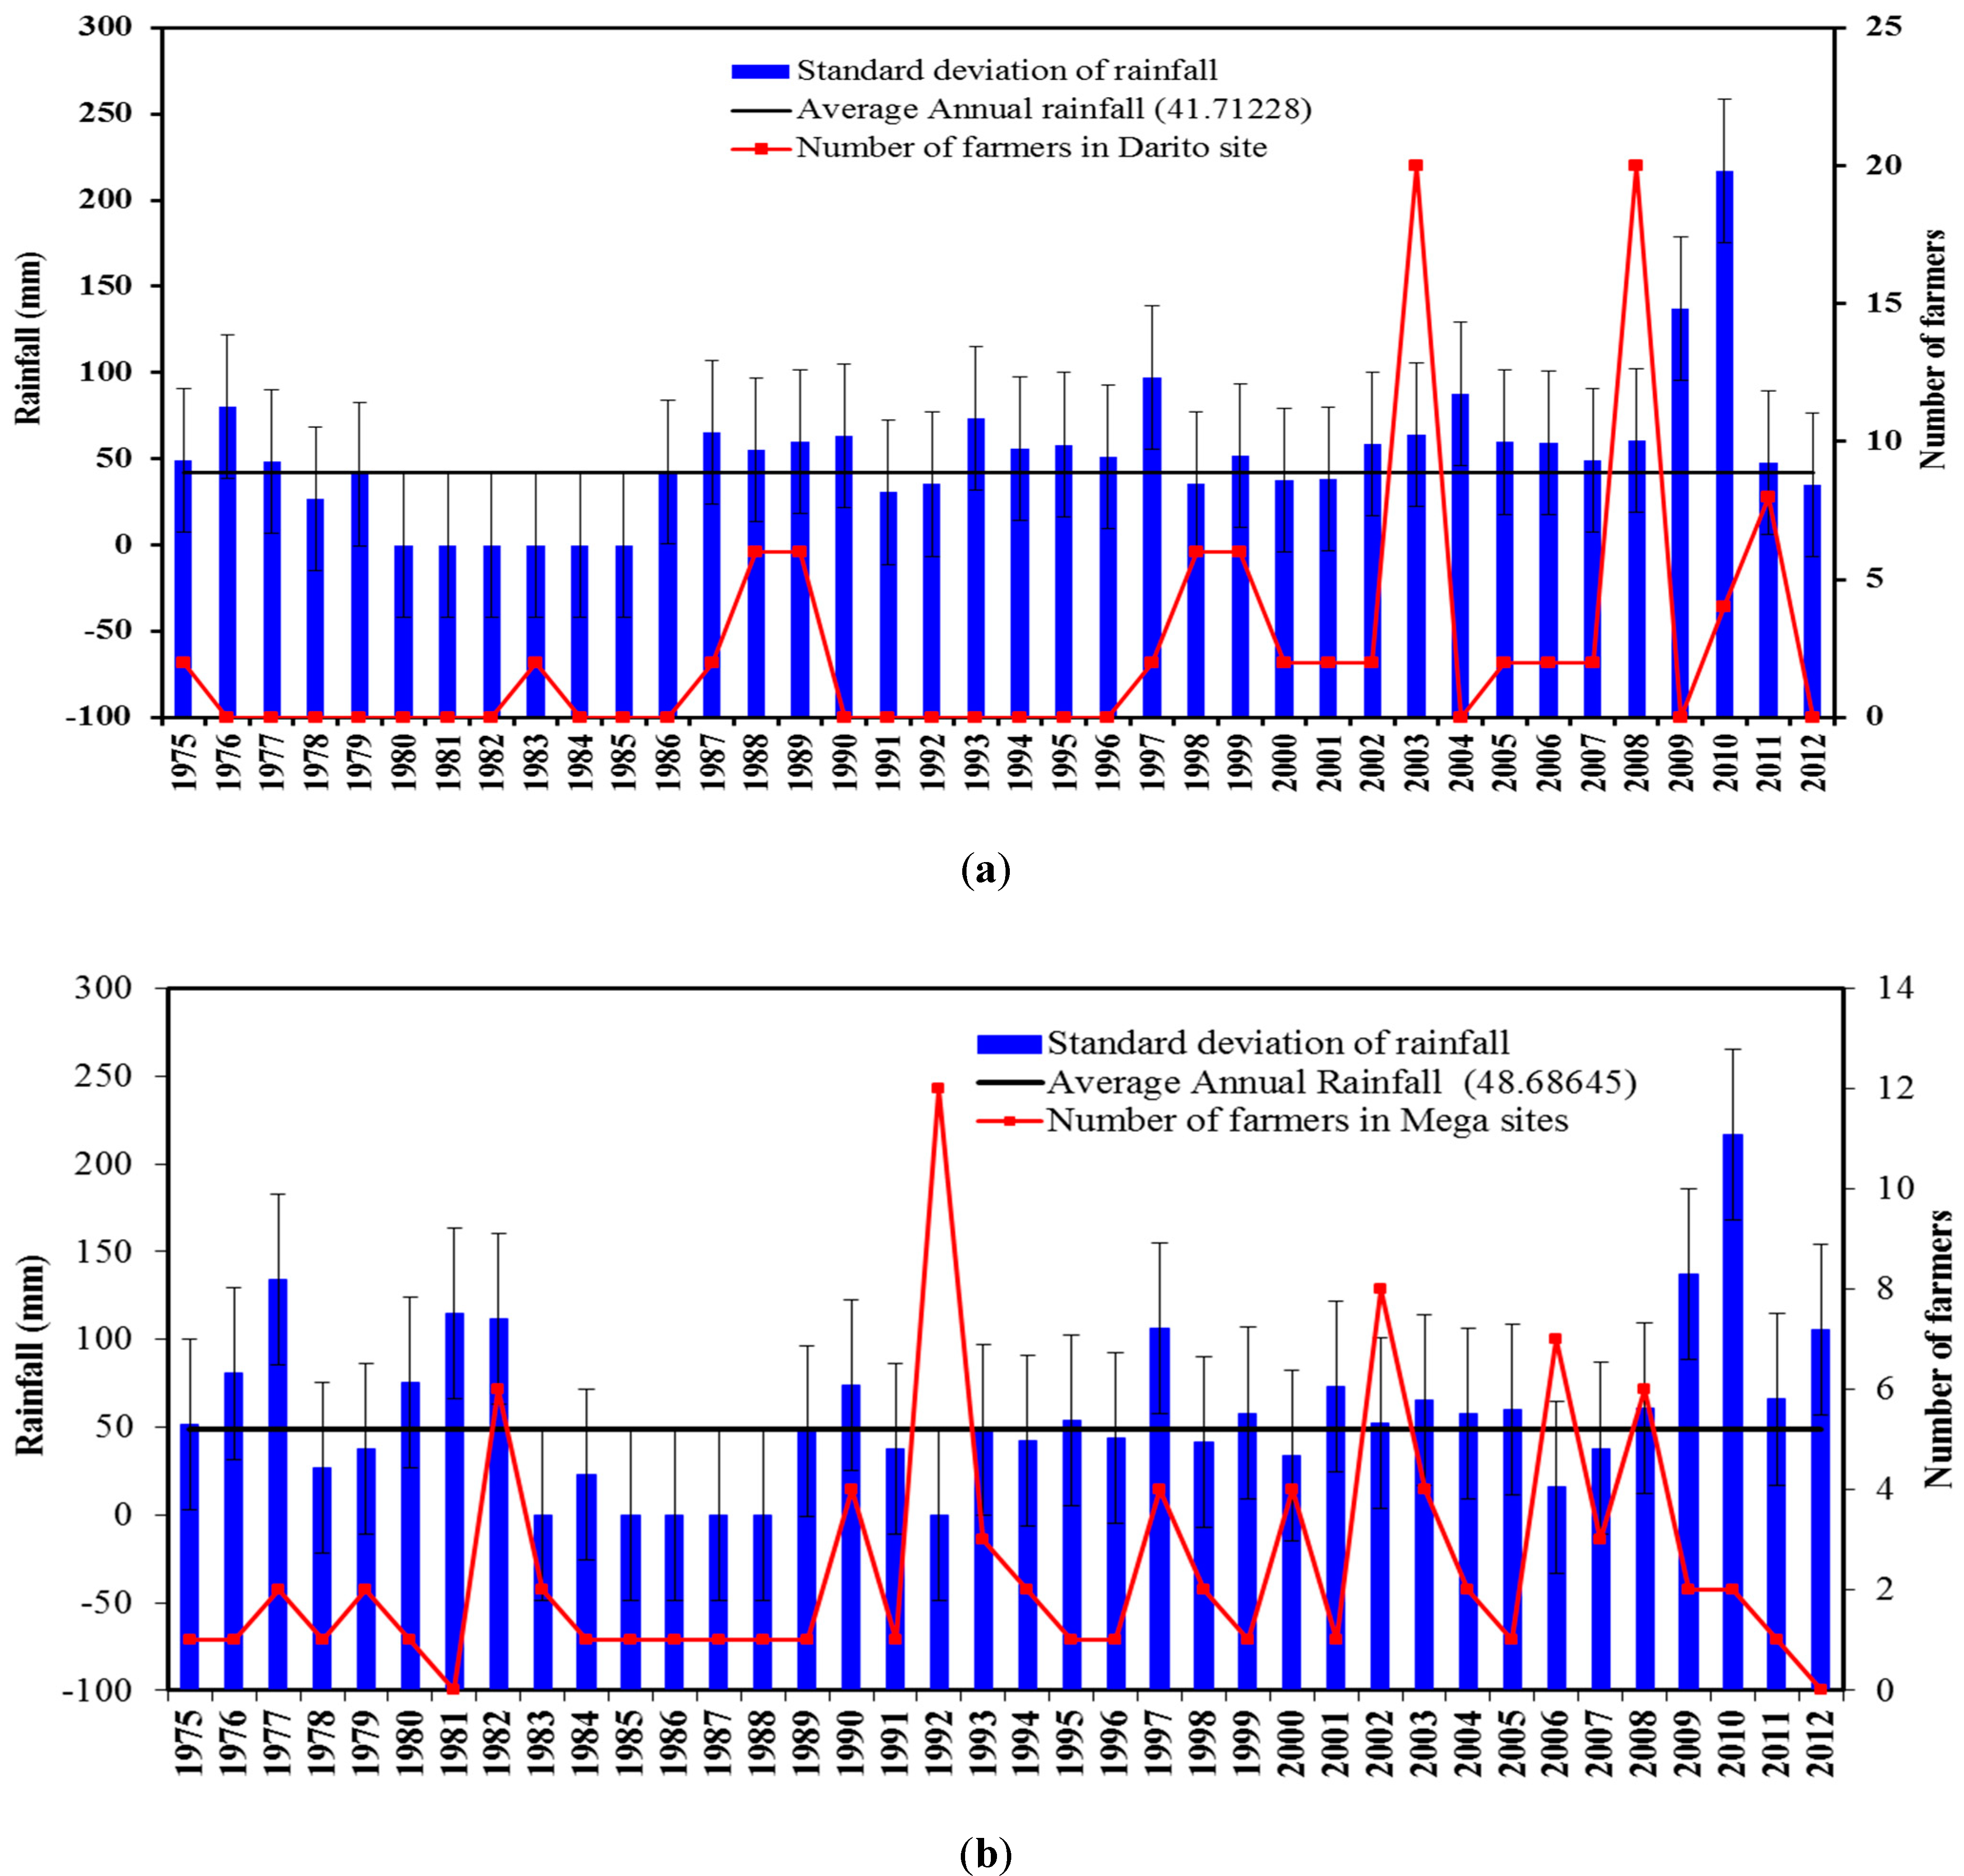
2.4.3. Rainfall Data and the Number of Farmers over Time
3. Results
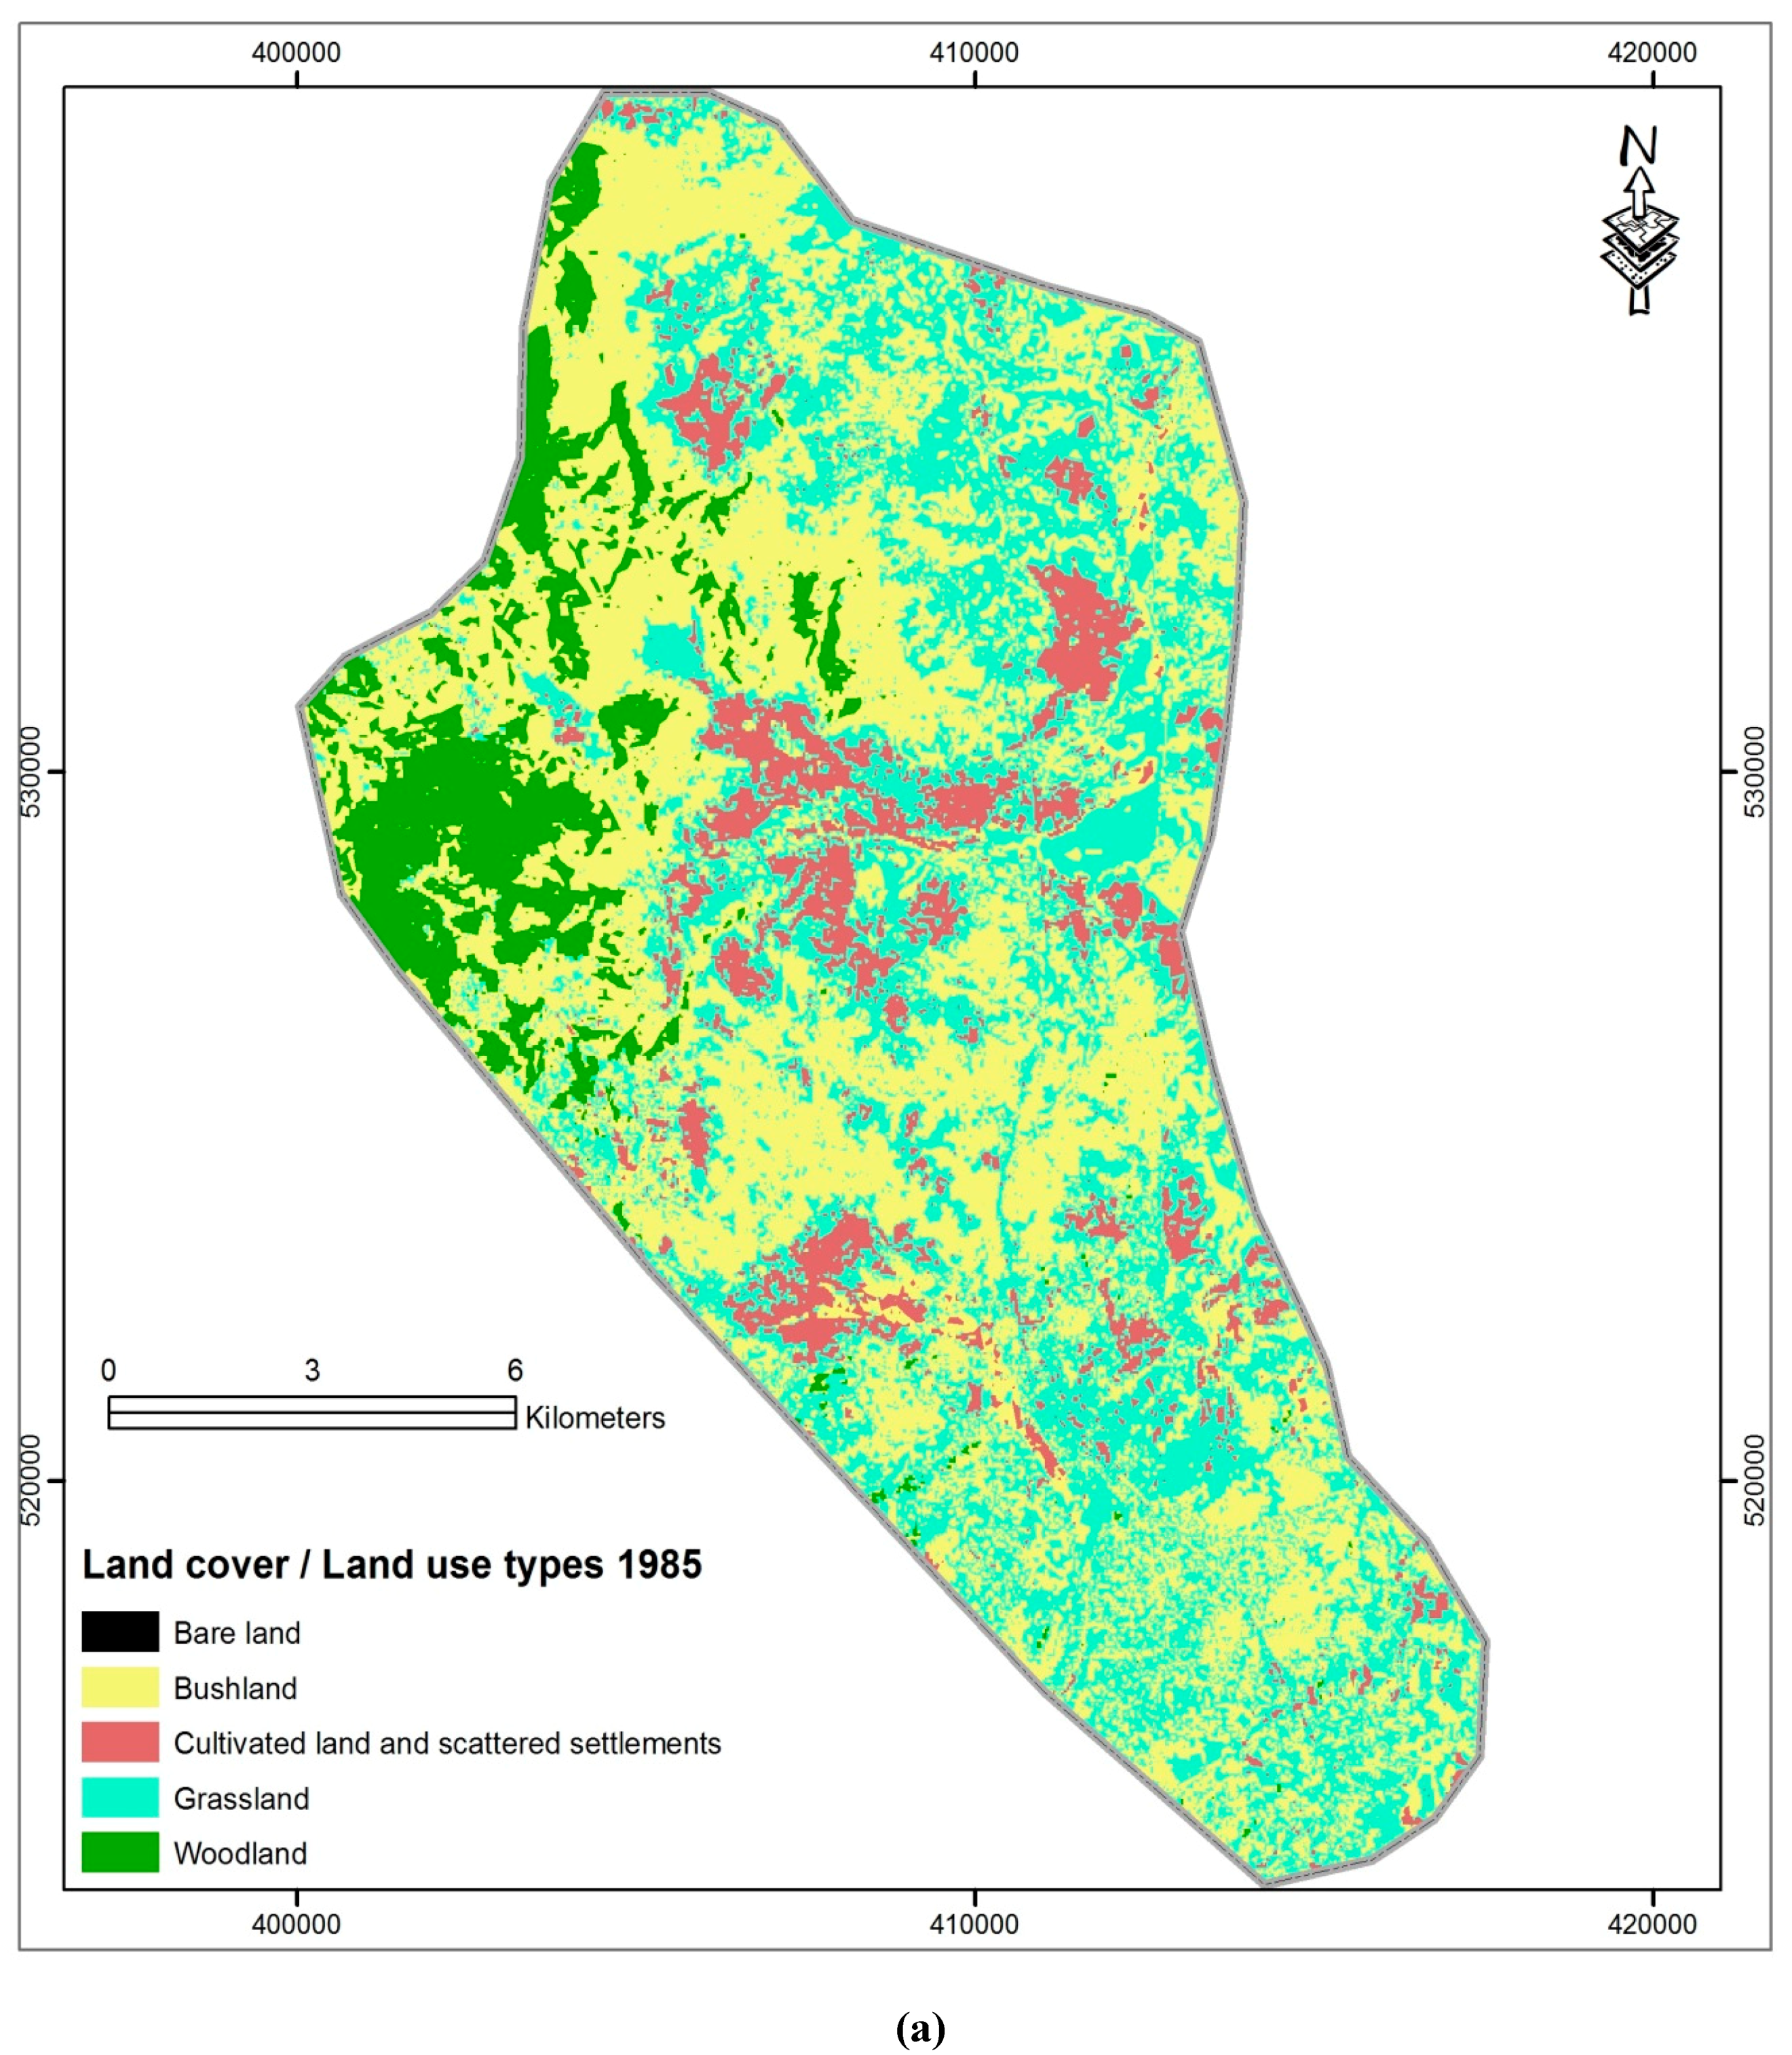
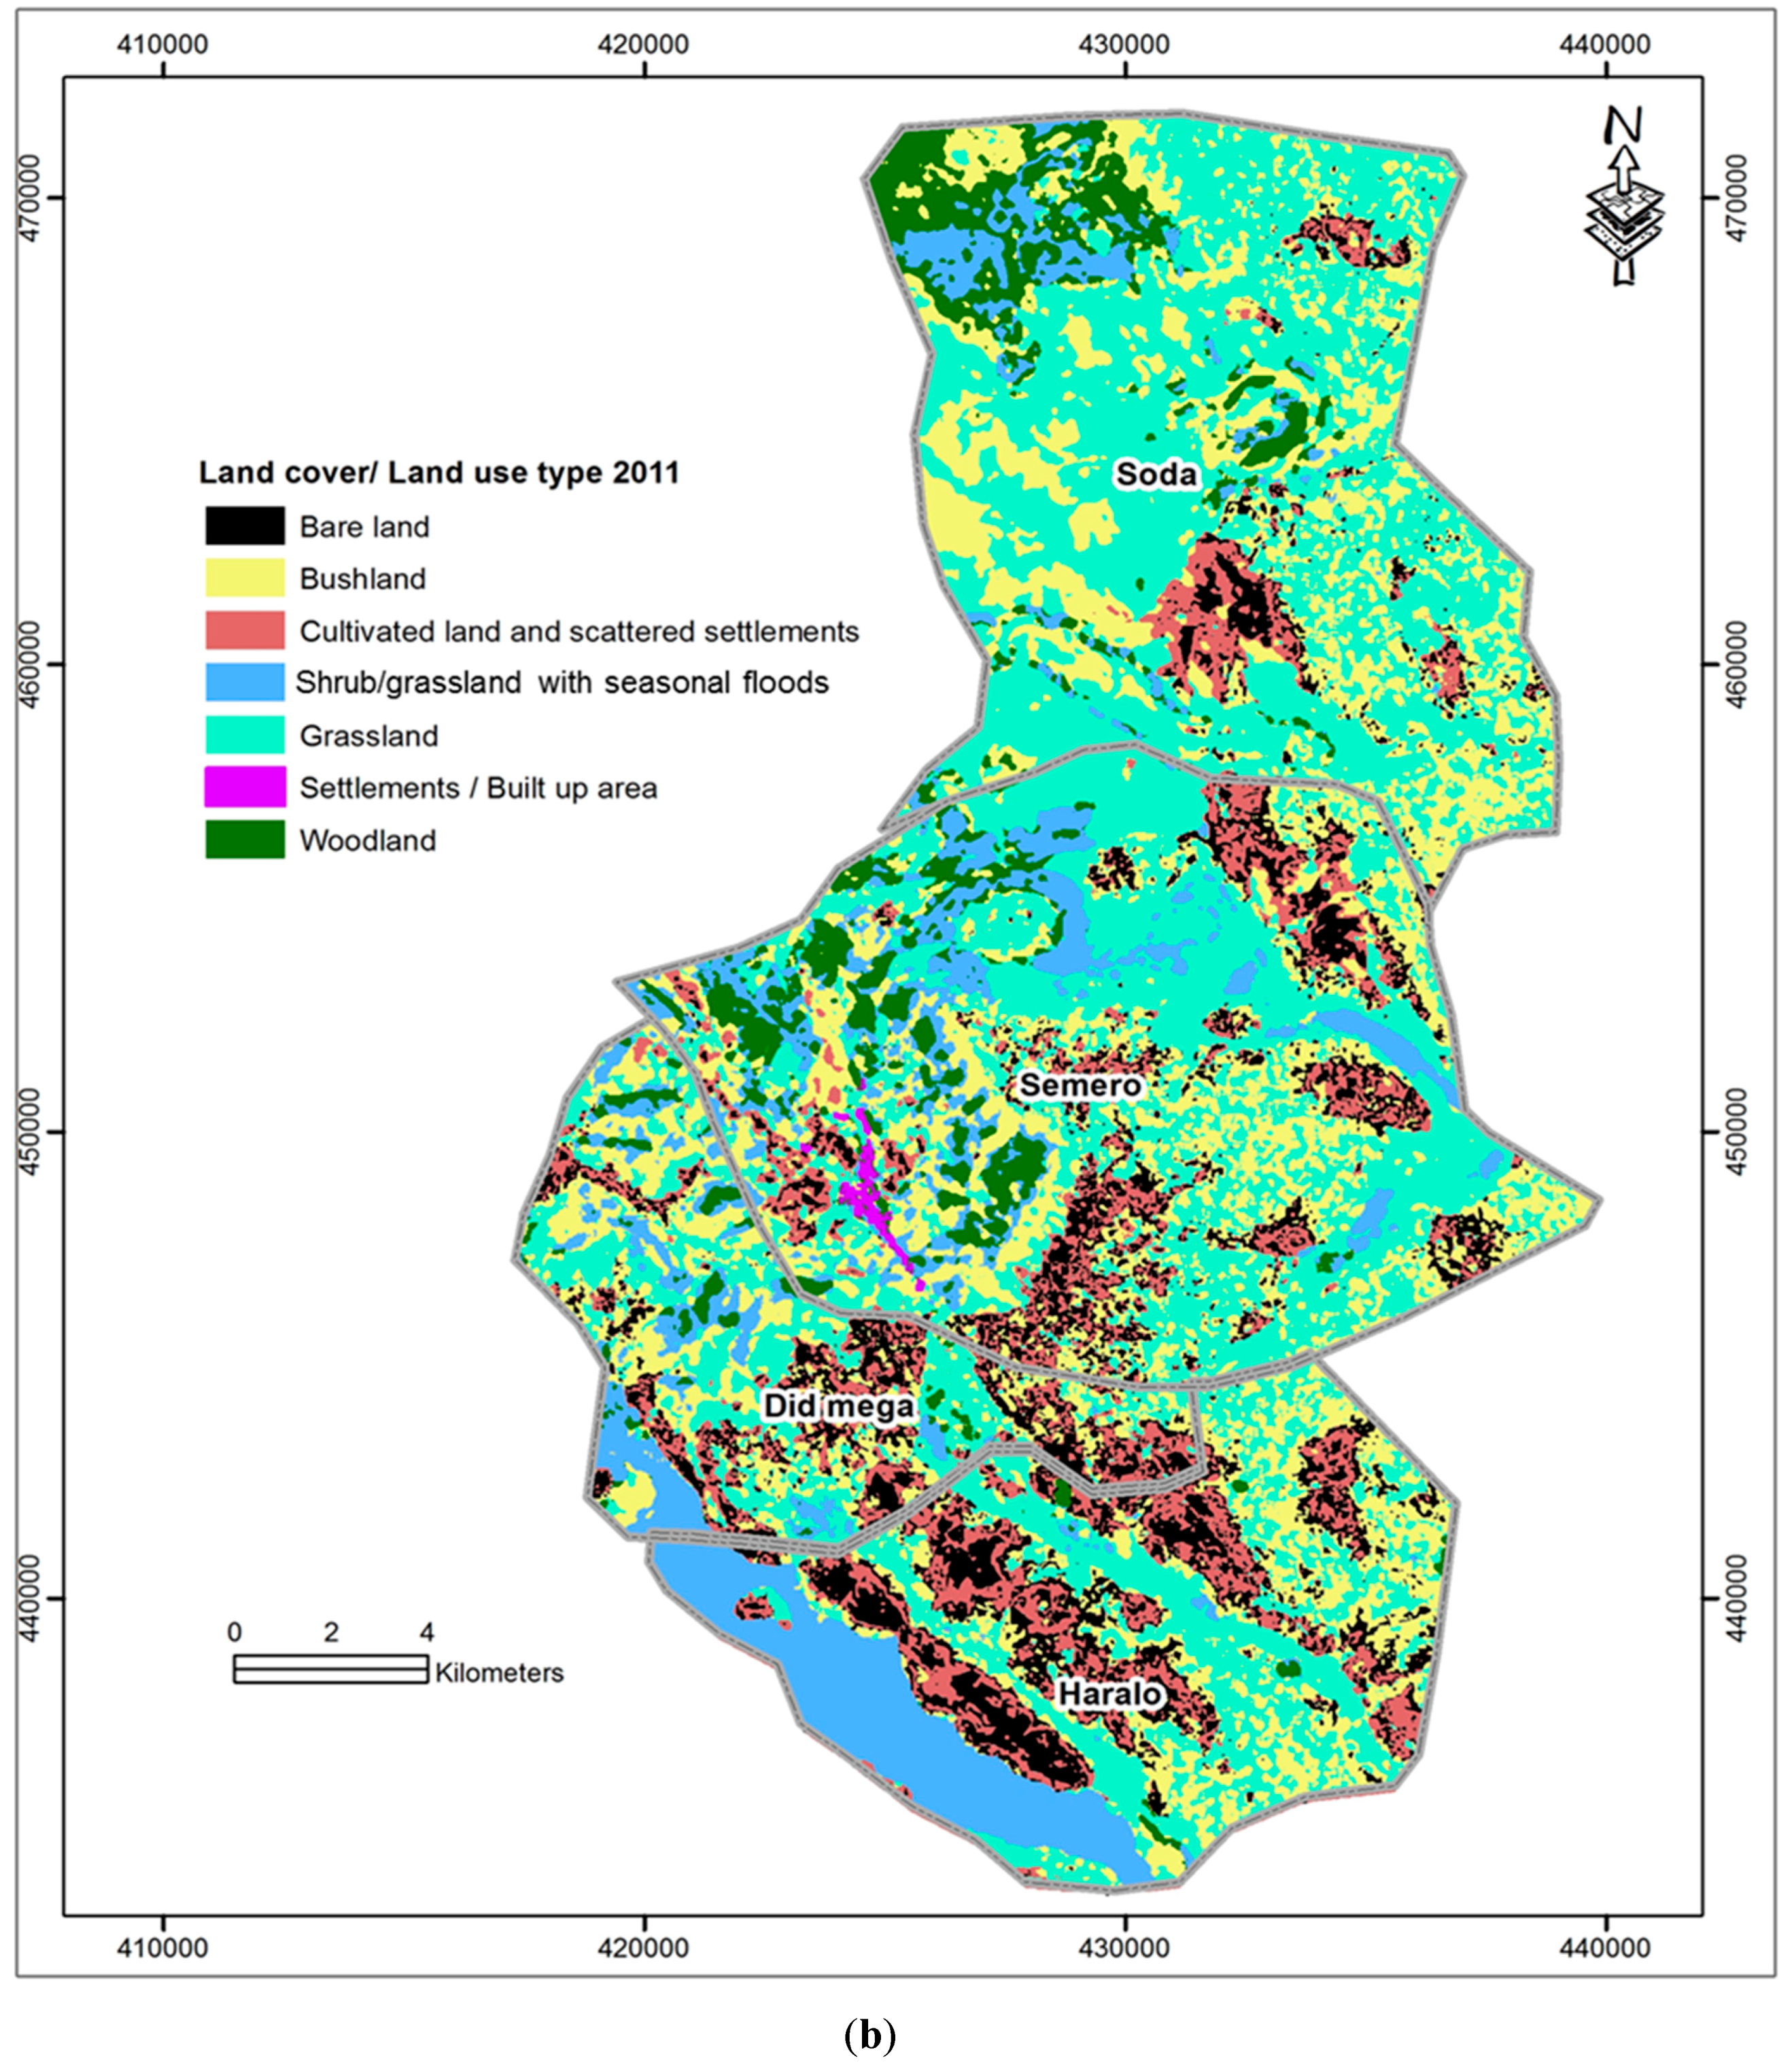
3.1. The Land Cover Changes
3.1.1. Land Cover Changes in the Darito Site

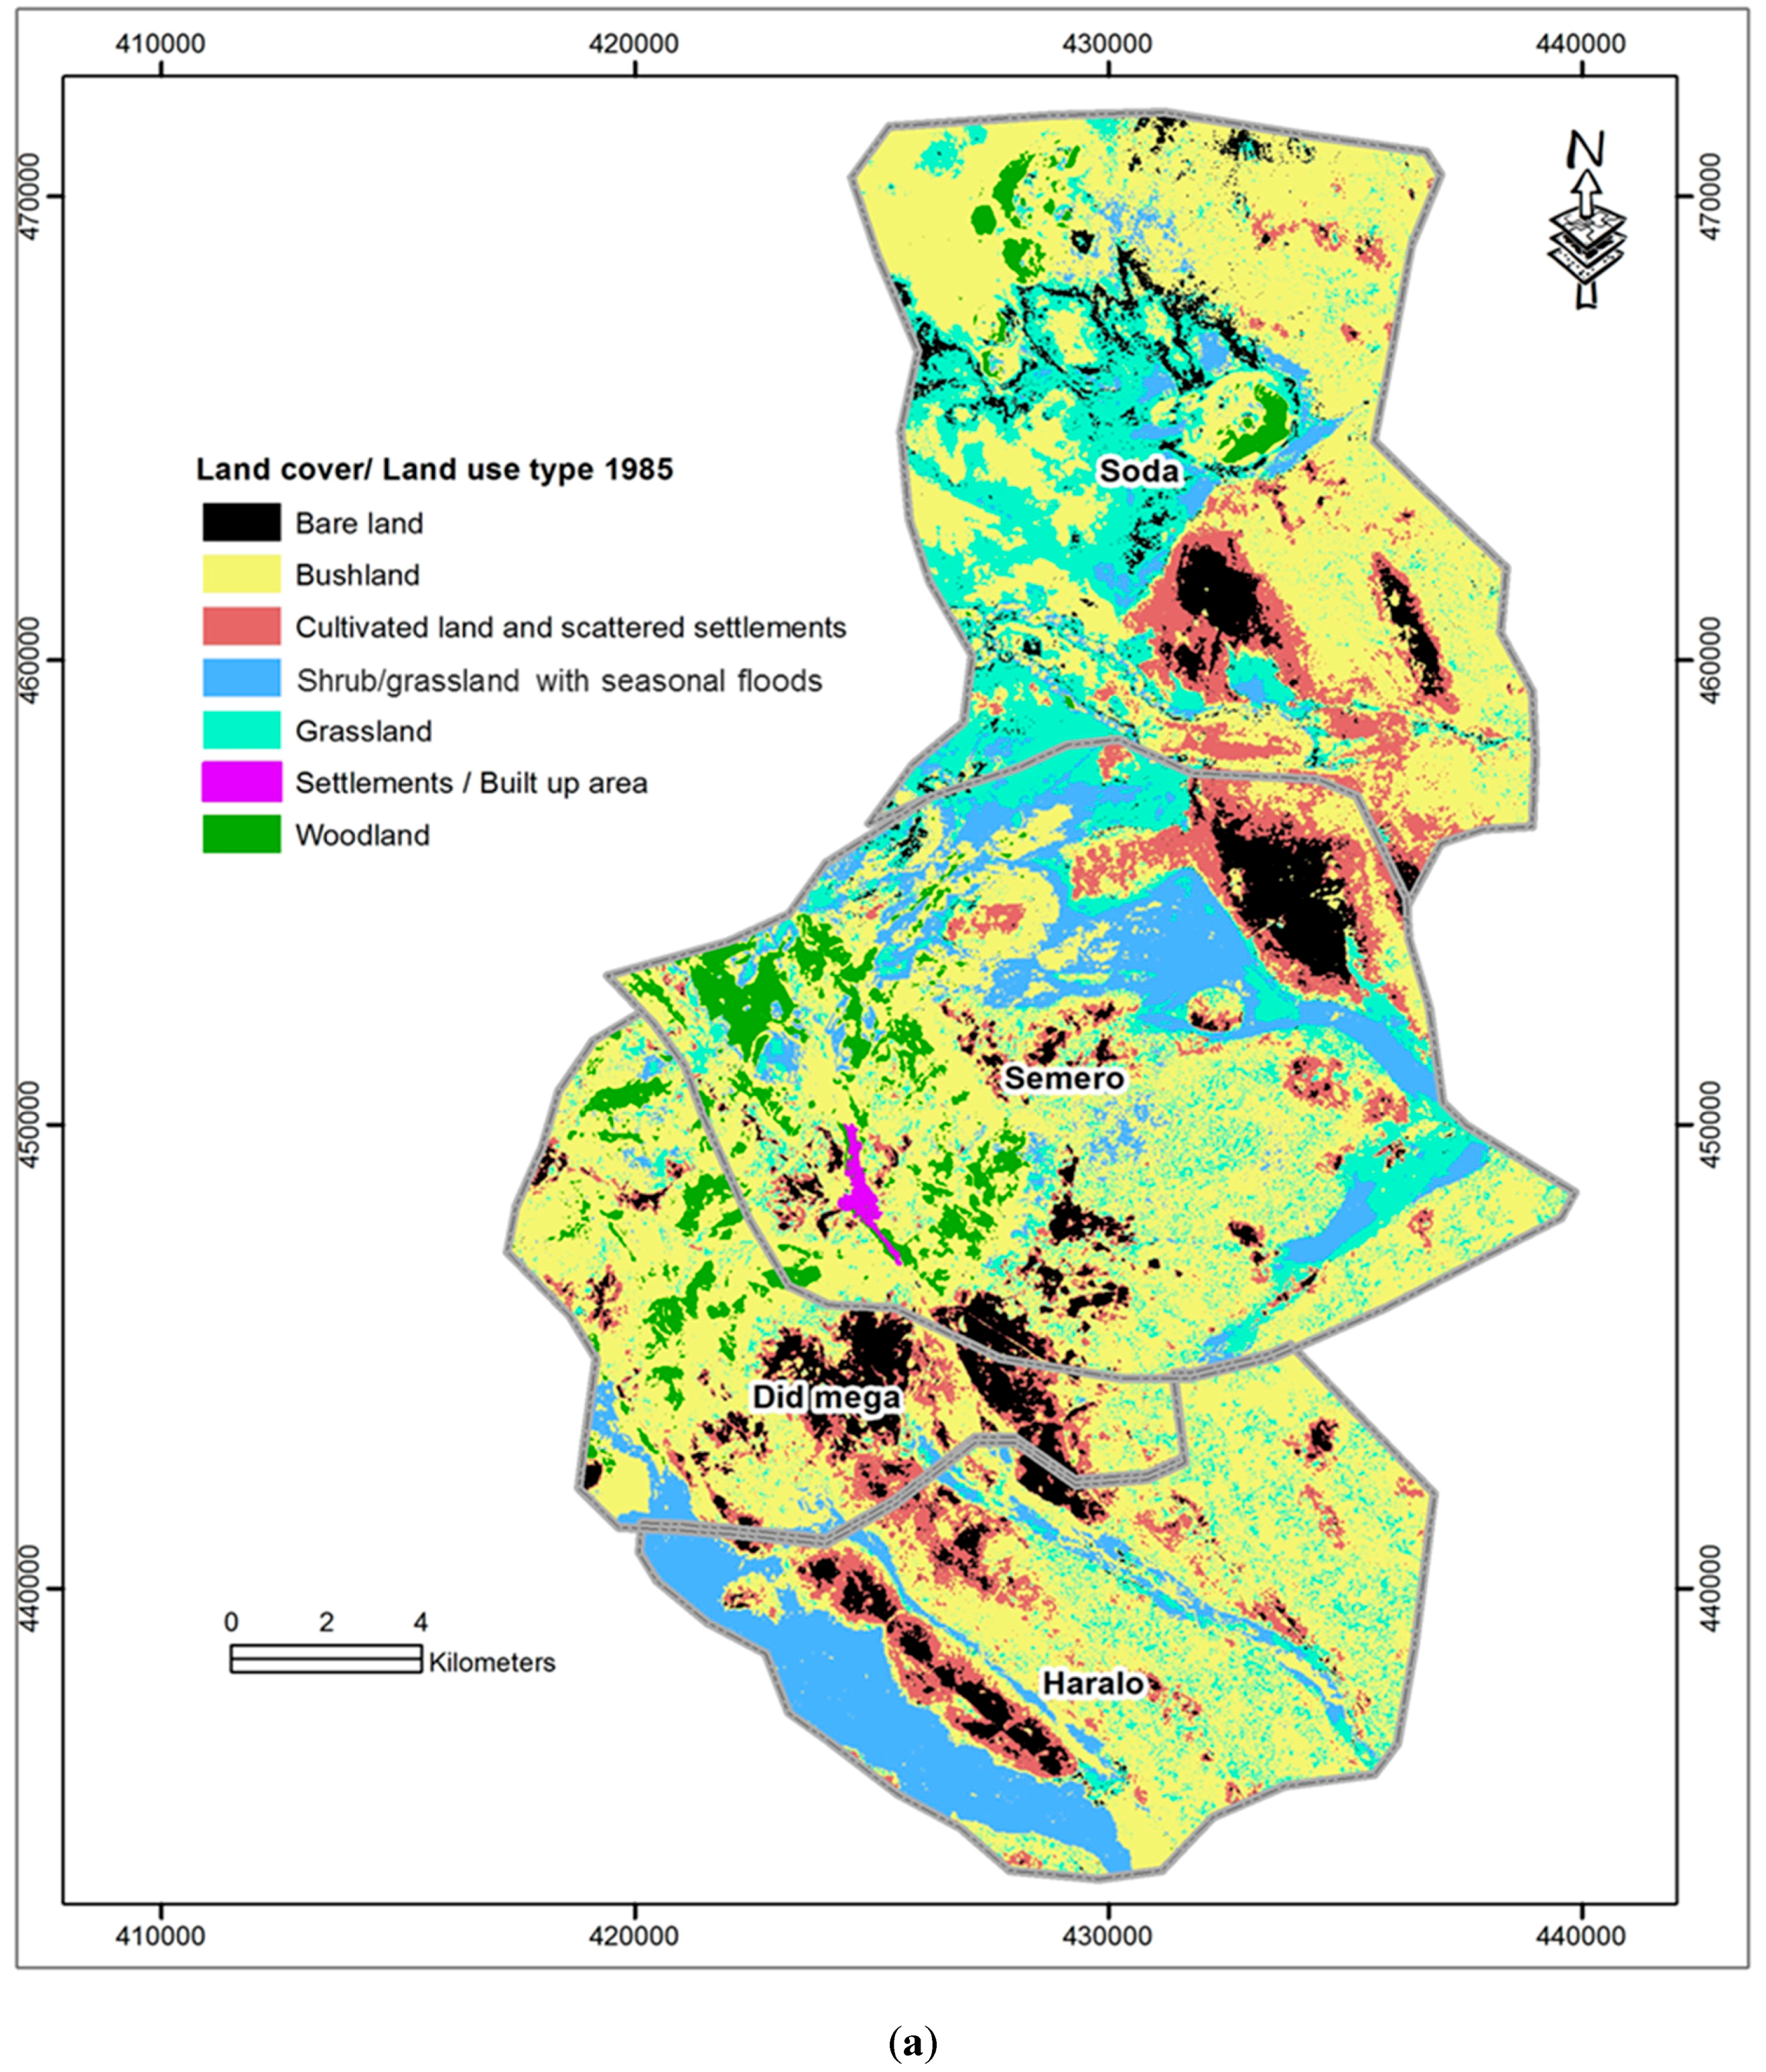
3.1.2. Land Cover Changes in Mega Sites

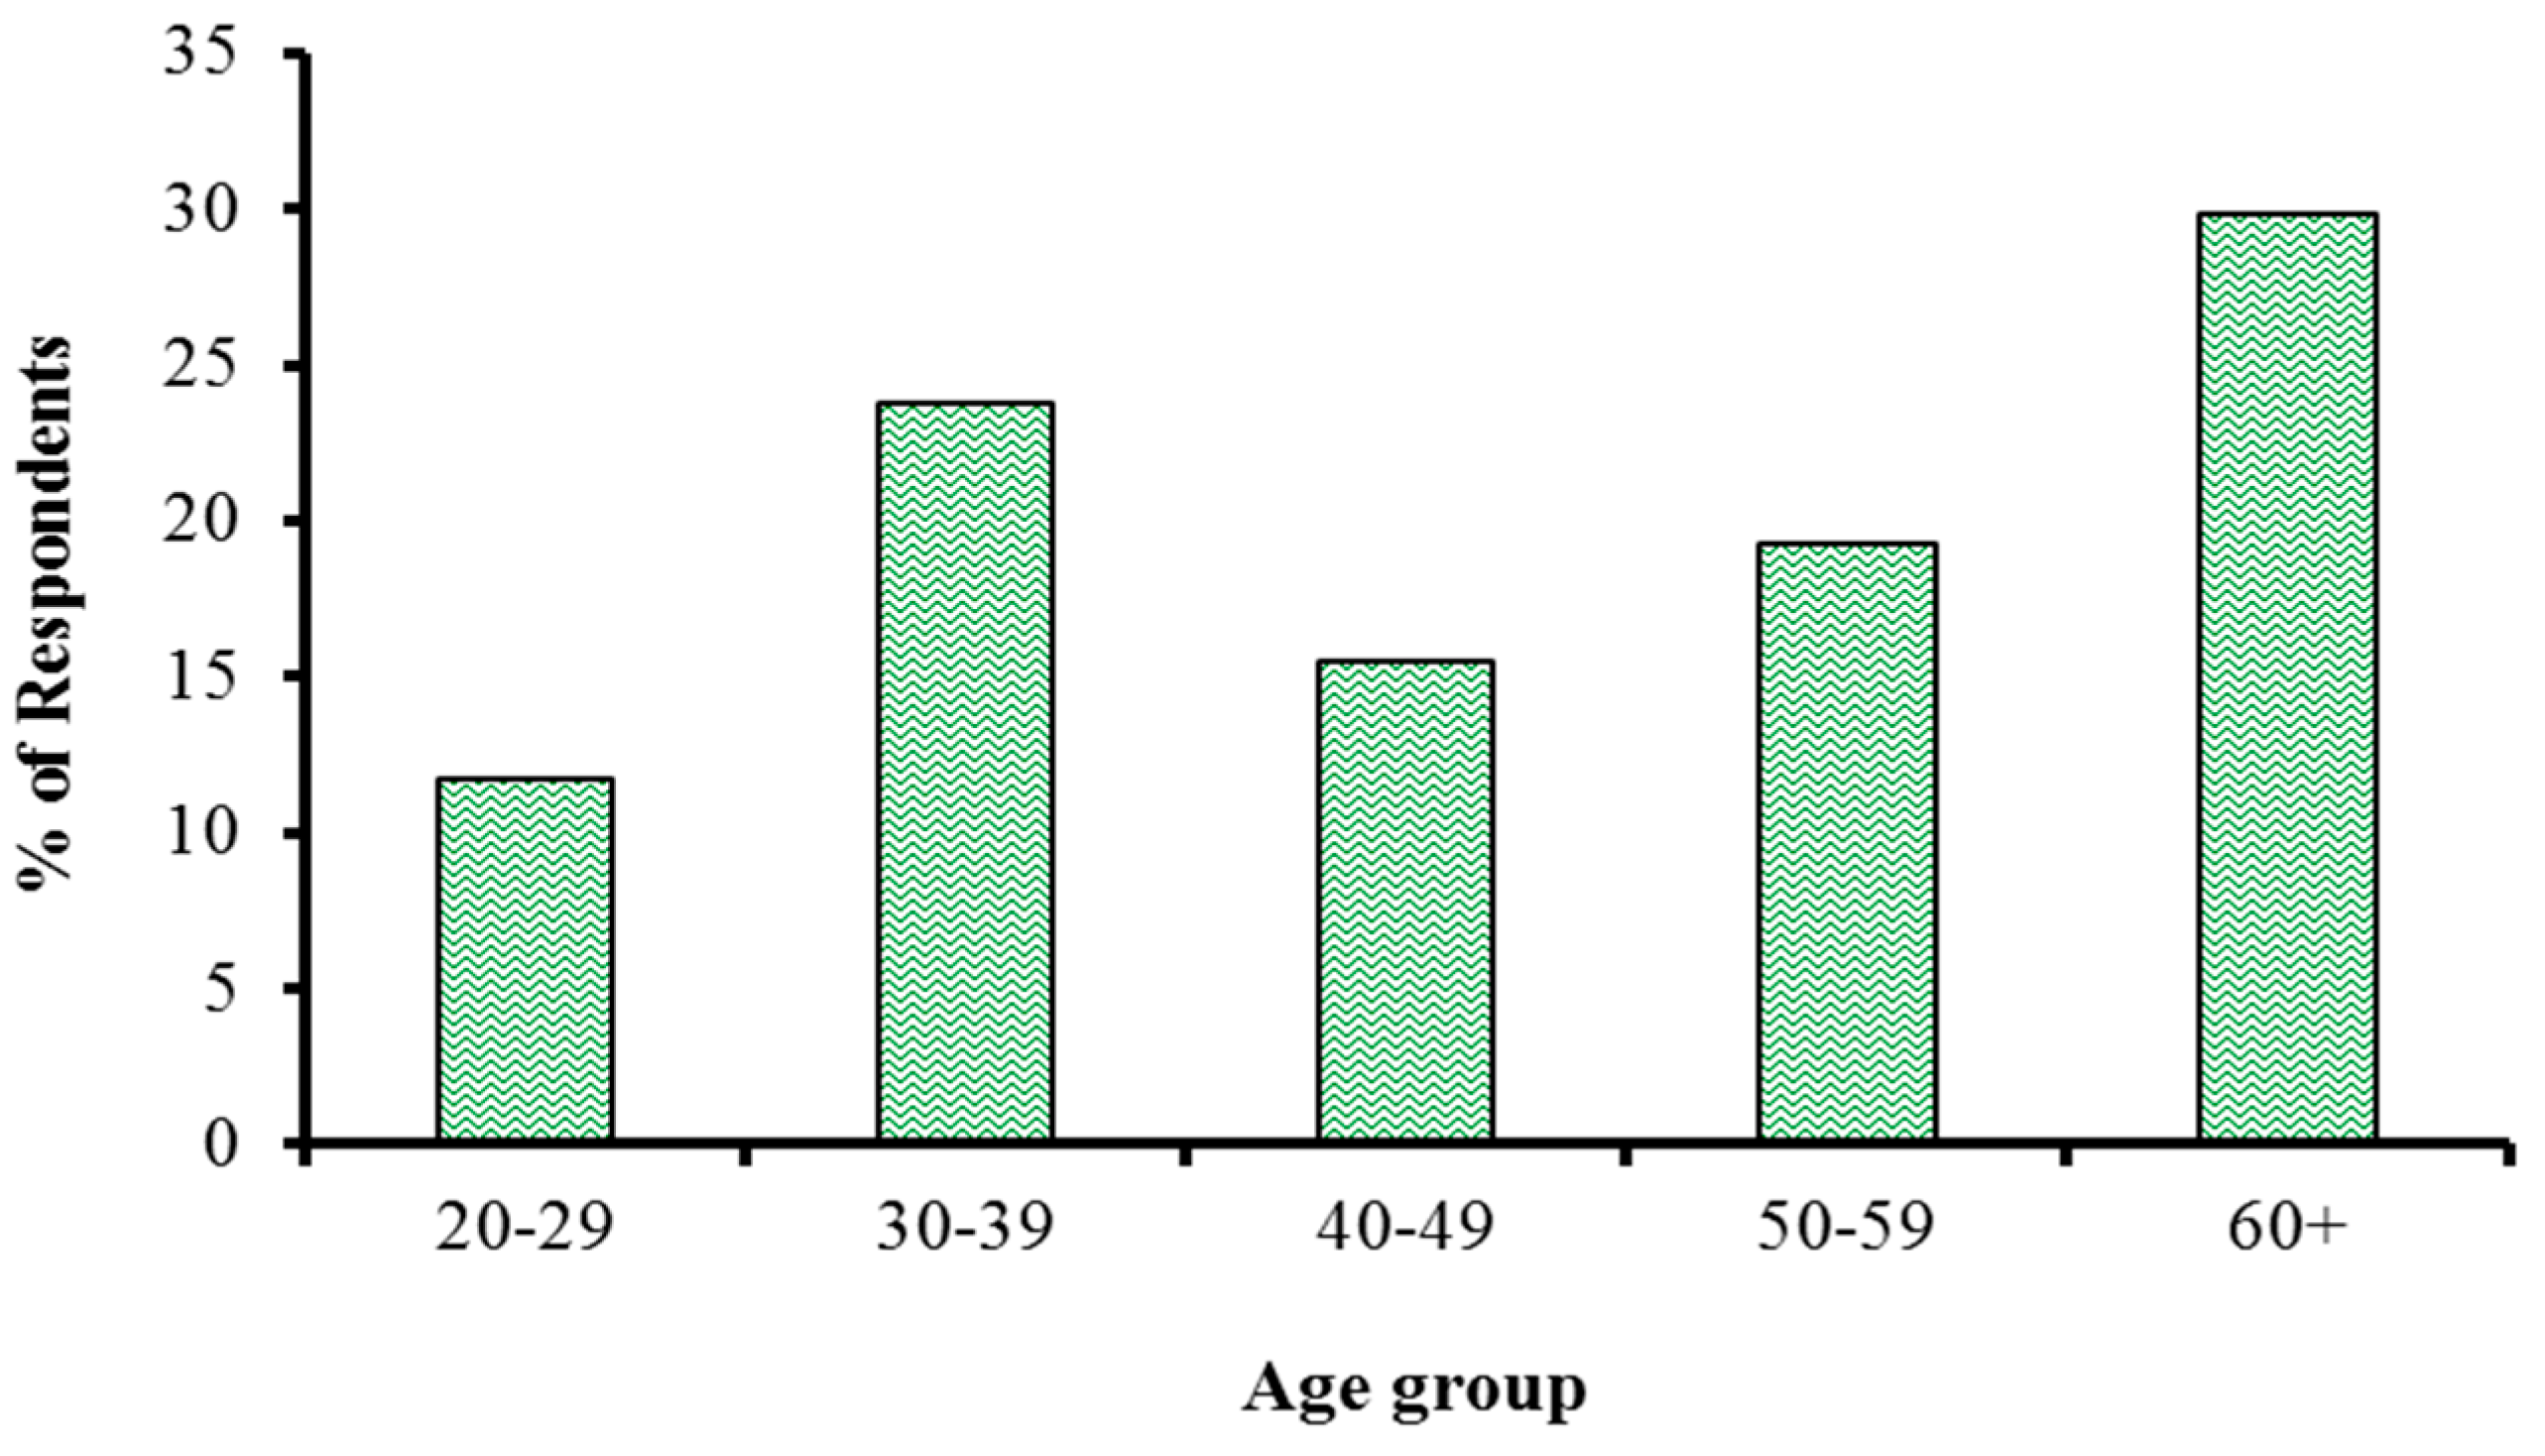
3.2. Socio-Demographic Characteristics of Respondents
3.3. Socio-Demographic and Economic Profiles and Their Linkages to Land Cover Changes
| Kebele | Mean Family Size | Std. Dev | Mean Farm Size | Std. Dev | Mean Monthly Income | Std. Dev (log) |
|---|---|---|---|---|---|---|
| Darito | 6.88 | 3.589 | 2.00 | 1.161 | 0.00 | 0.00000 |
| Soda | 8.06 | 3.75 | 1.19 | 1.191 | 3424.68 | 1.86032 |
| Samaro | 7.33 | 2.942 | 2.09 | 1.057 | 1456.49 | 0.77329 |
| Haralo | 6.88 | 1.965 | 2.22 | 1.093 | 743.00 | 3.27574 |
| Did mega | 7.44 | 3.384 | 2.79 | 1.368 | 1219.34 | 3.52461 |
| Total | 7.32 | 3.189 | 2.10 | 1.281 | 1341.55 |
3.4. Major Economic Activities and Sources of Income
| Main Activities | Number | Percentage |
|---|---|---|
| Crop and livestock farming | 244 | 92.1 |
| Livestock husbandry | 18 | 6.8 |
| Petty trade | 16 | 6.0 |
| Crop production | 4 | 1.5 |
| Wage employment | 4 | 1.5 |
| Salt extraction | 4 | 1.5 |
| Sources of Income | ||
| Livestock husbandry | 255 | 96.2 |
| Crops production | 216 | 81.5 |
| Petty trade | 24 | 9.1 |
| Salt extraction | 9 | 3.4 |
| Wage labour | 7 | 2.6 |
| Brocker | 4 | 1.5 |
| Wage employment | 3 | 1.1 |
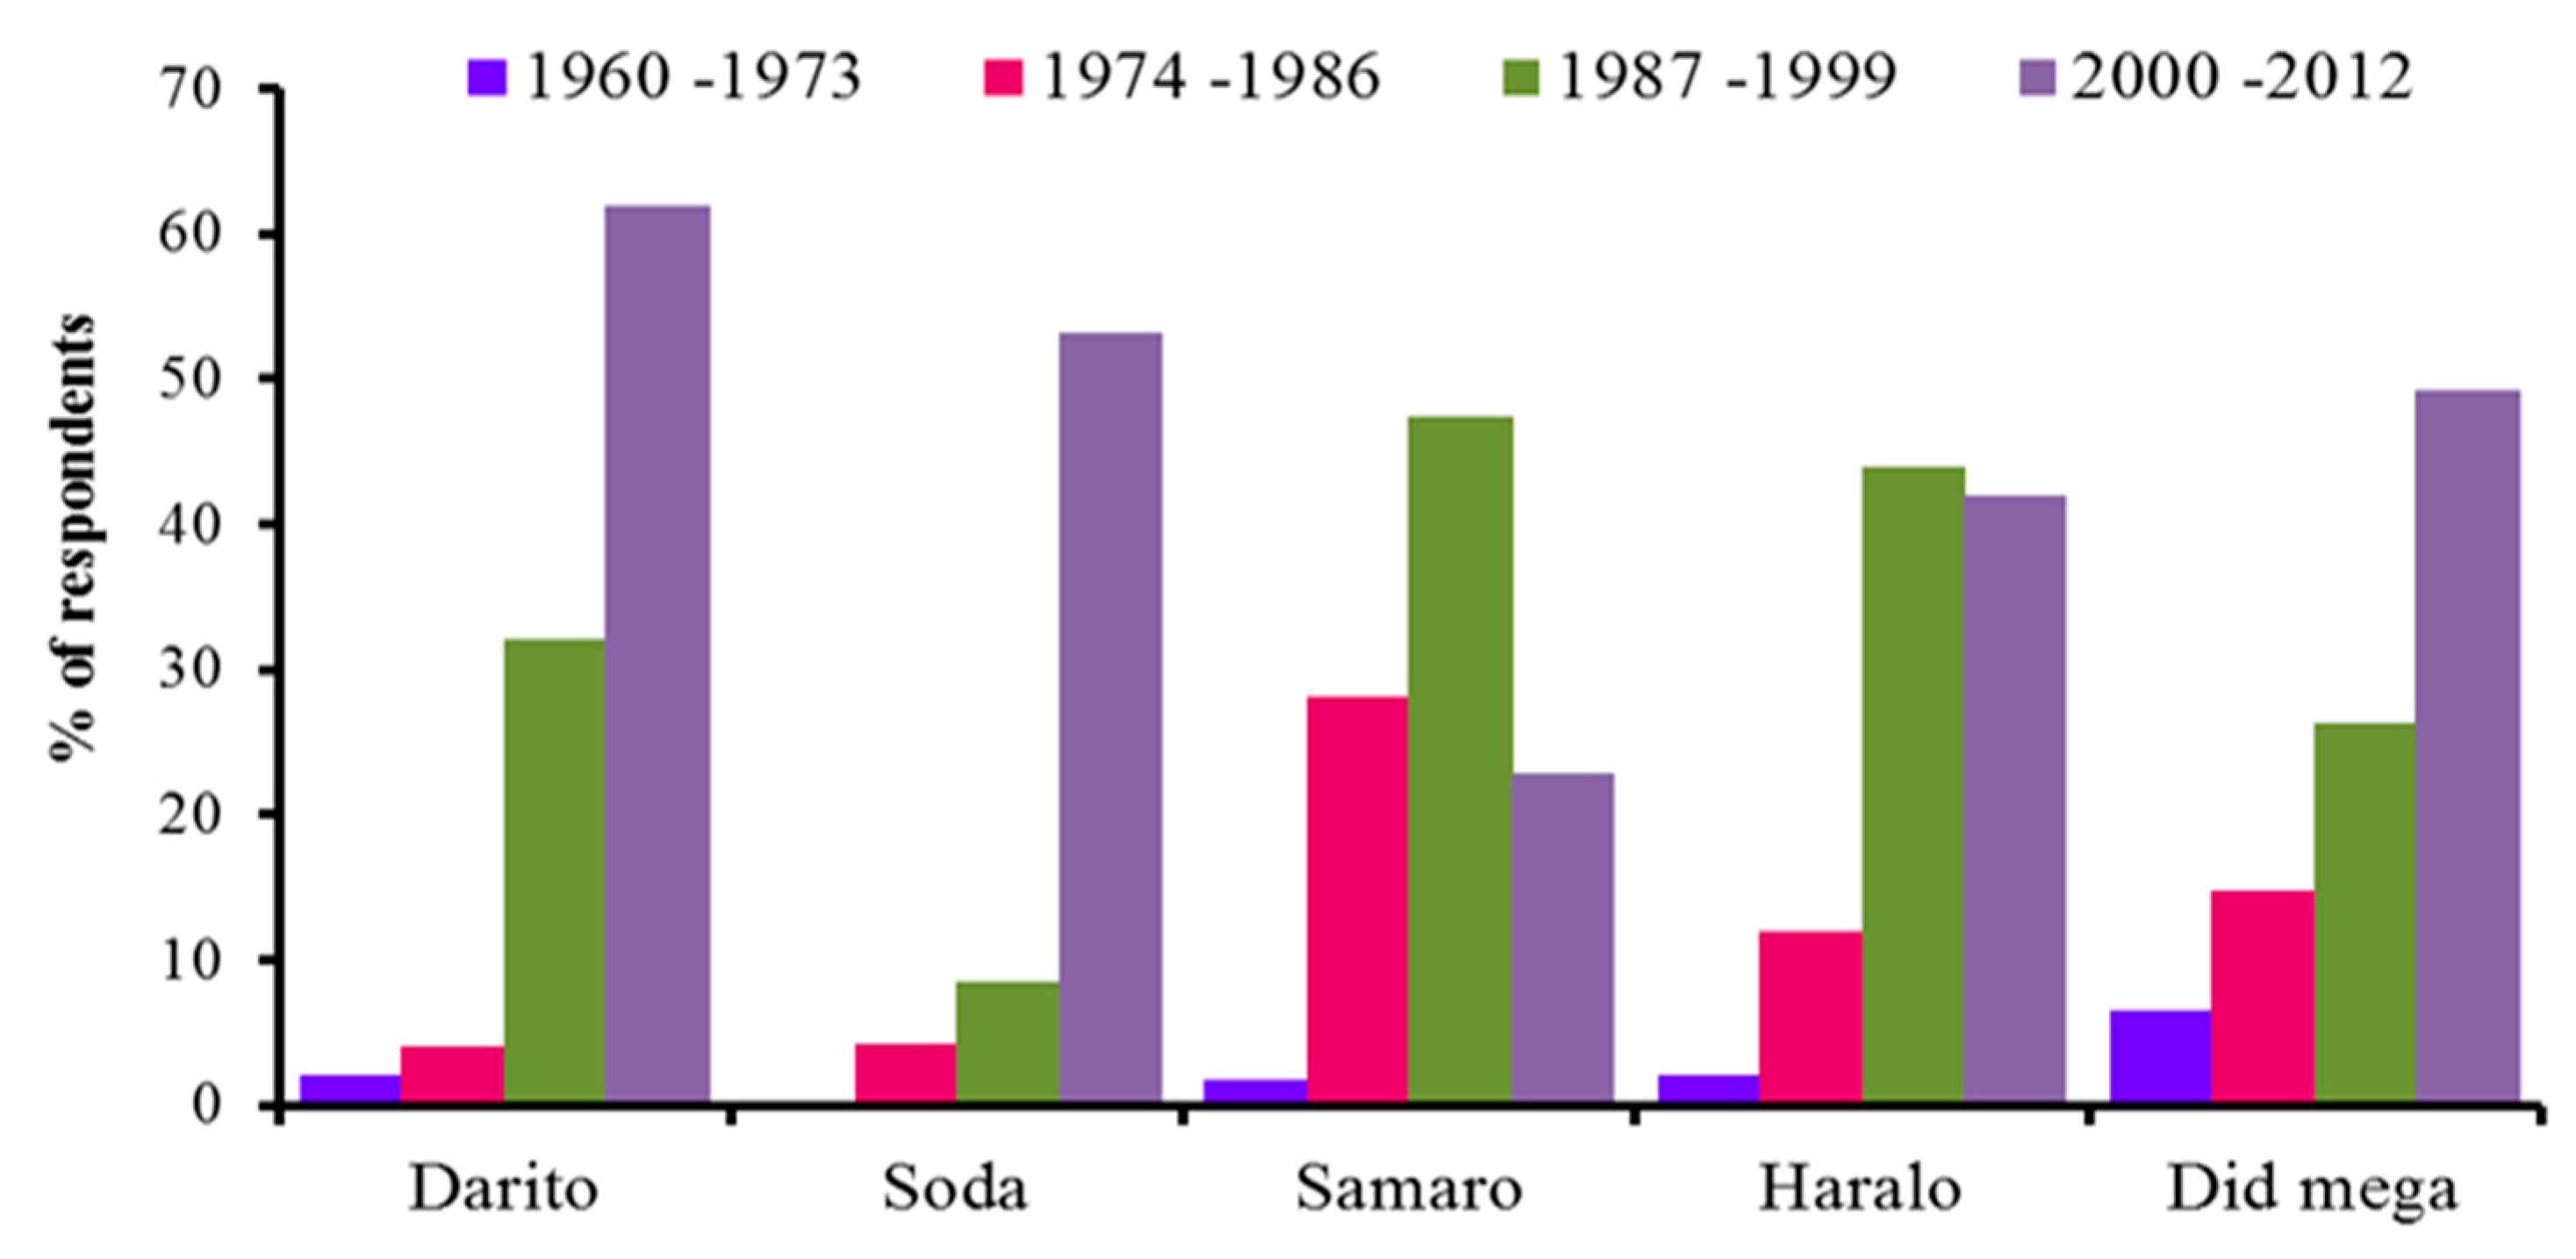
3.5. Land Ownership and the Temporal Growing of Cultivation Activities in the Study Sites
| Kebele | 0 ha | 1–2 ha | >2 ha | p–Value |
|---|---|---|---|---|
| Numbers | Numbers | Numbers | ||
| Darito | 0 | 35 | 15 | <0.0001 |
| Soda | 17 | 22 | 8 | |
| Samaro | 0 | 42 | 15 | |
| Haralo | 0 | 34 | 16 | |
| Did mega | 2 | 25 | 34 | |
| Family size | ||||
| <5 | 3 | 37 | 9 | 0.0001 |
| 5–10 | 8 | 111 | 62 | |
| >10 | 8 | 10 | 17 | |
| School going child | ||||
| Household with schooling child | 16 | 95 | 69 | 0.0038 |
| Household with no schooling child | 3 | 63 | 19 | |
| Cropping history | ||||
| 1960–1979 | 0 | 10 | 9 | 0.01538361 |
| 1980–1999 | 0 | 59 | 49 | |
| 2000–2012 | 1 | 89 | 30 |
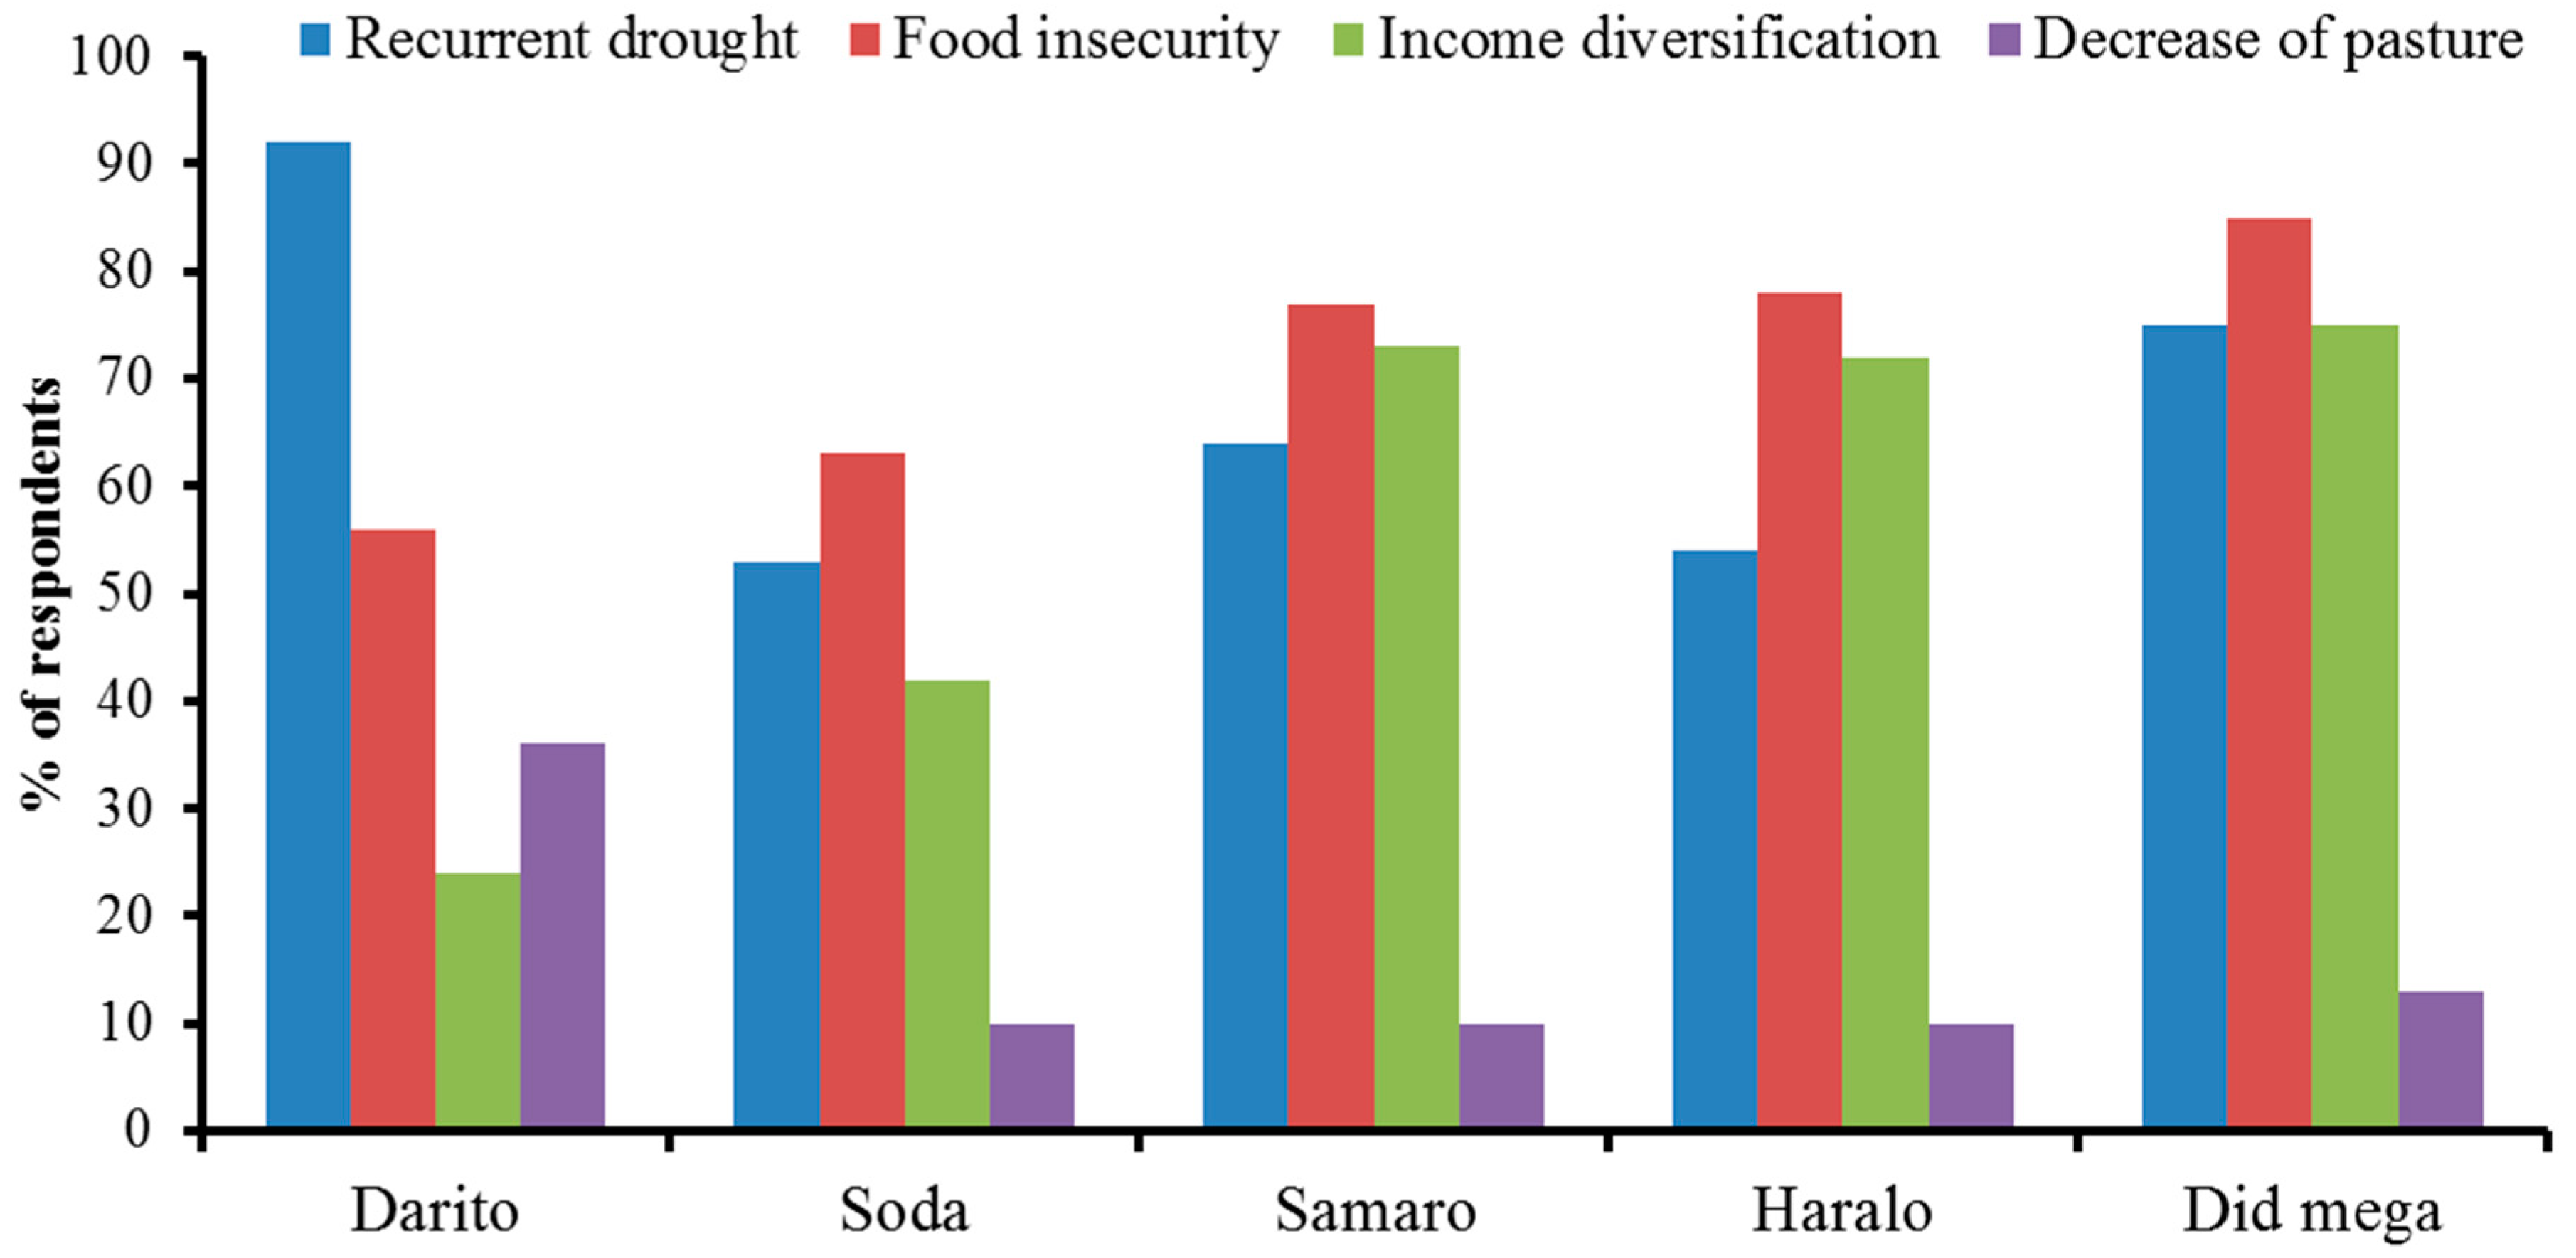
3.6. Perceived Drivers behind the Expansion of Cultivation

3.7. Decadal Rainfall and the Number of Farmers Who Started Cultivation over Time

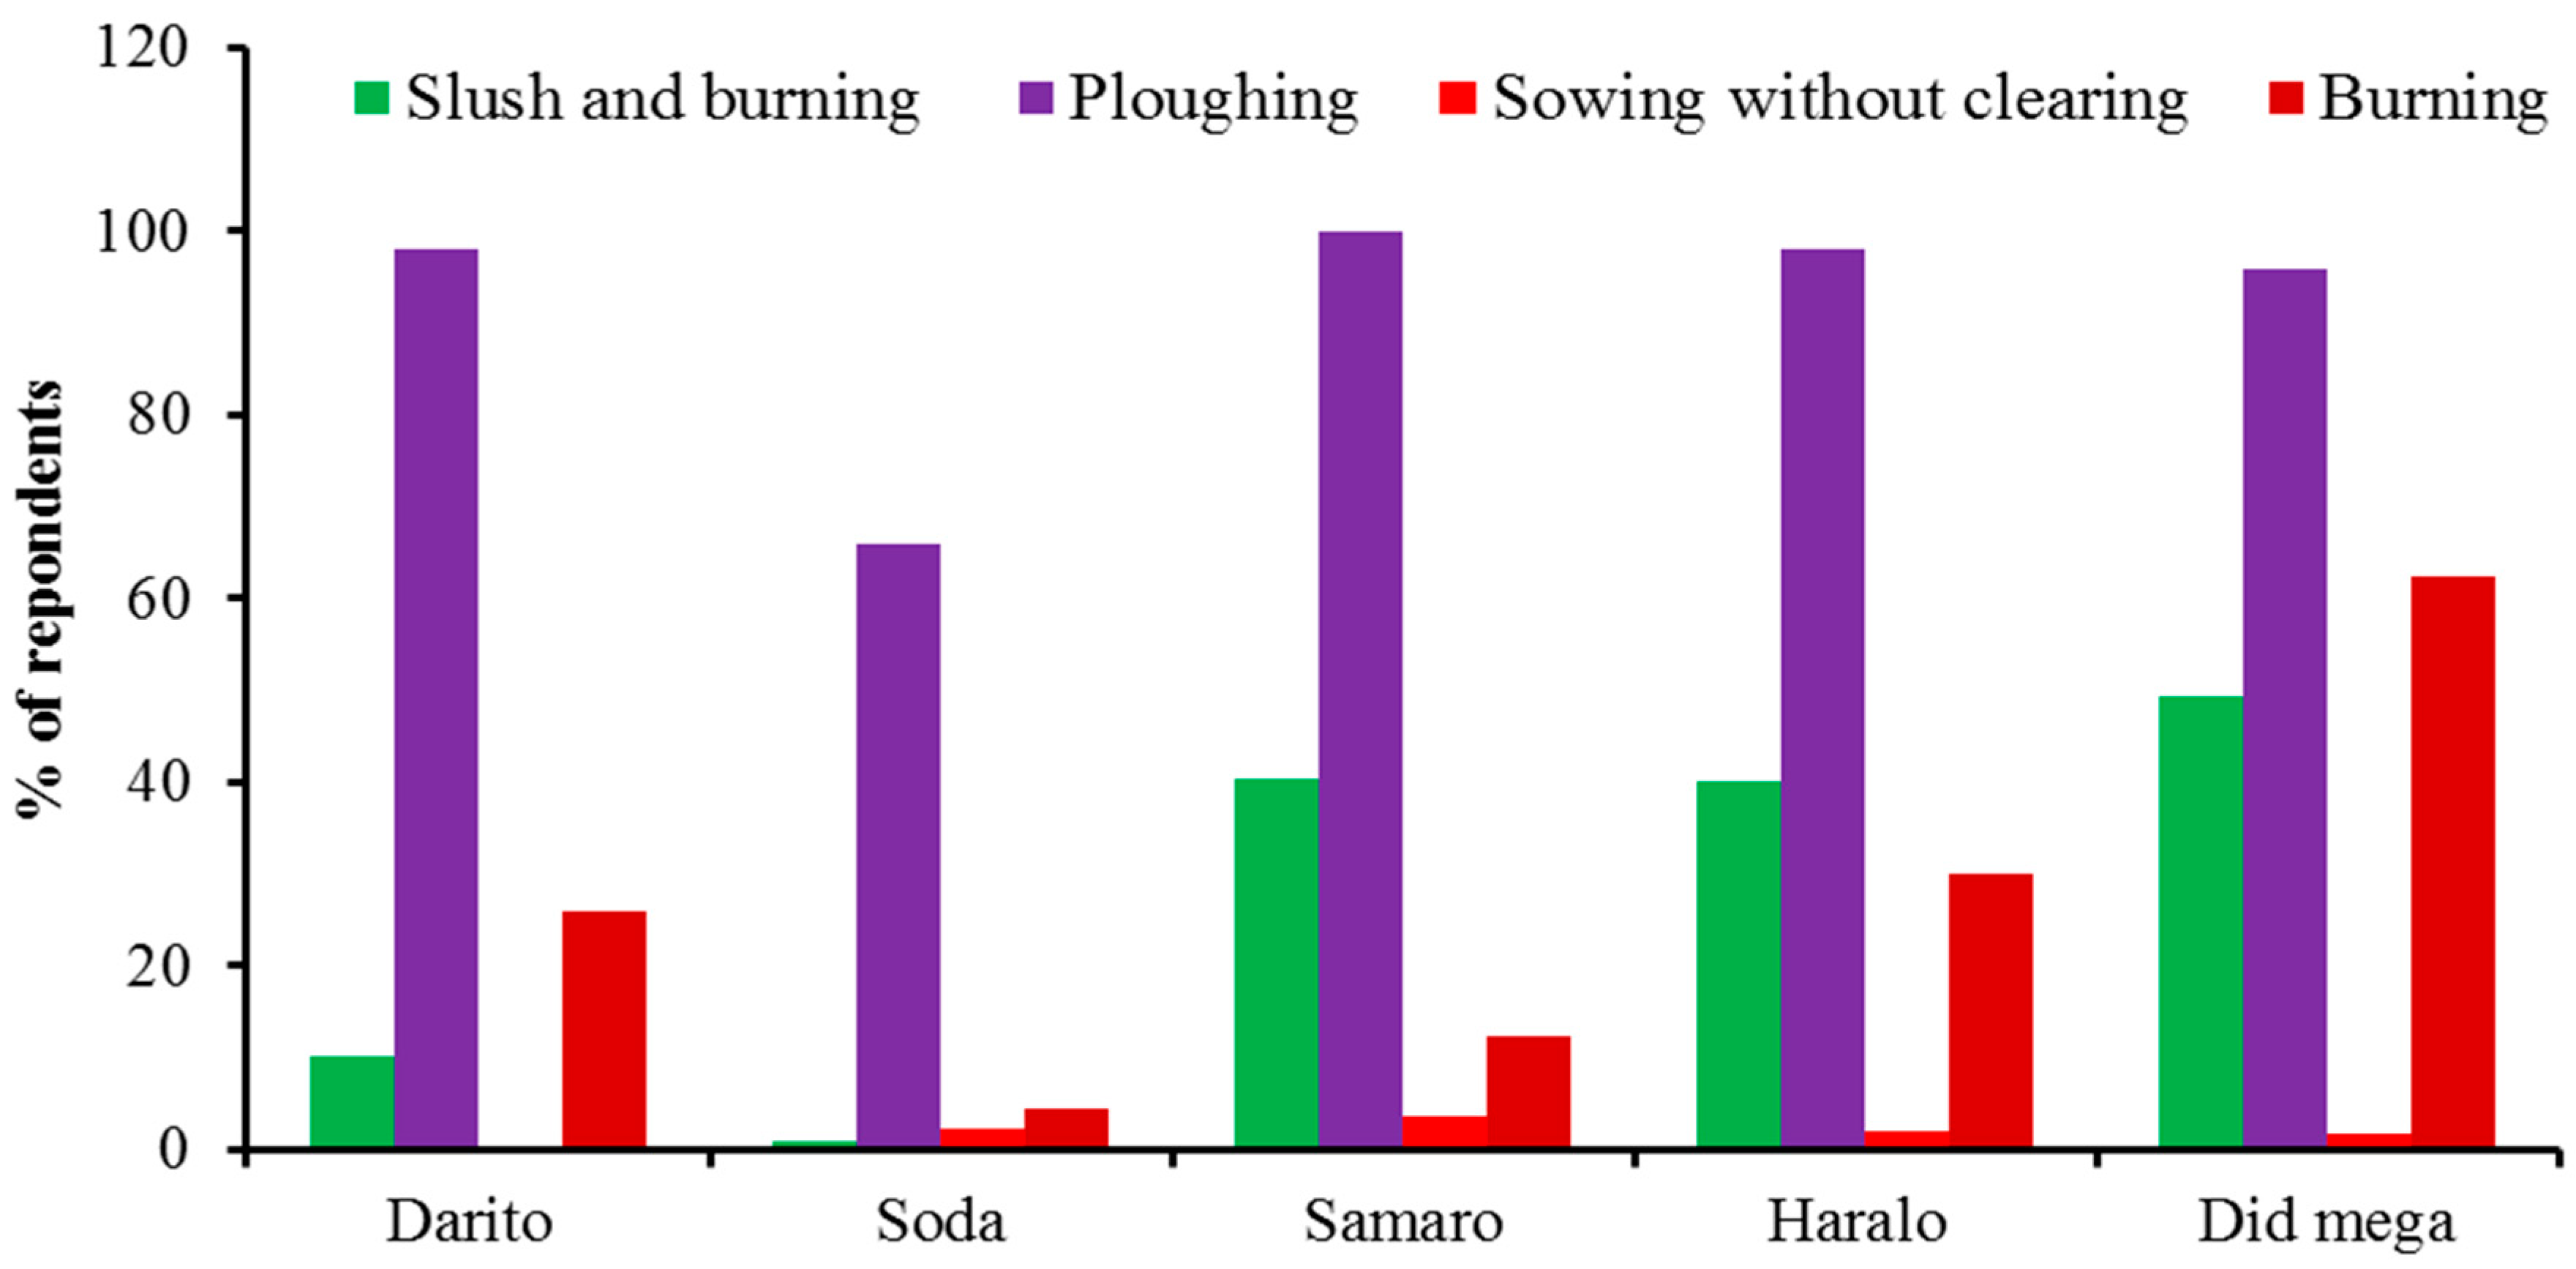
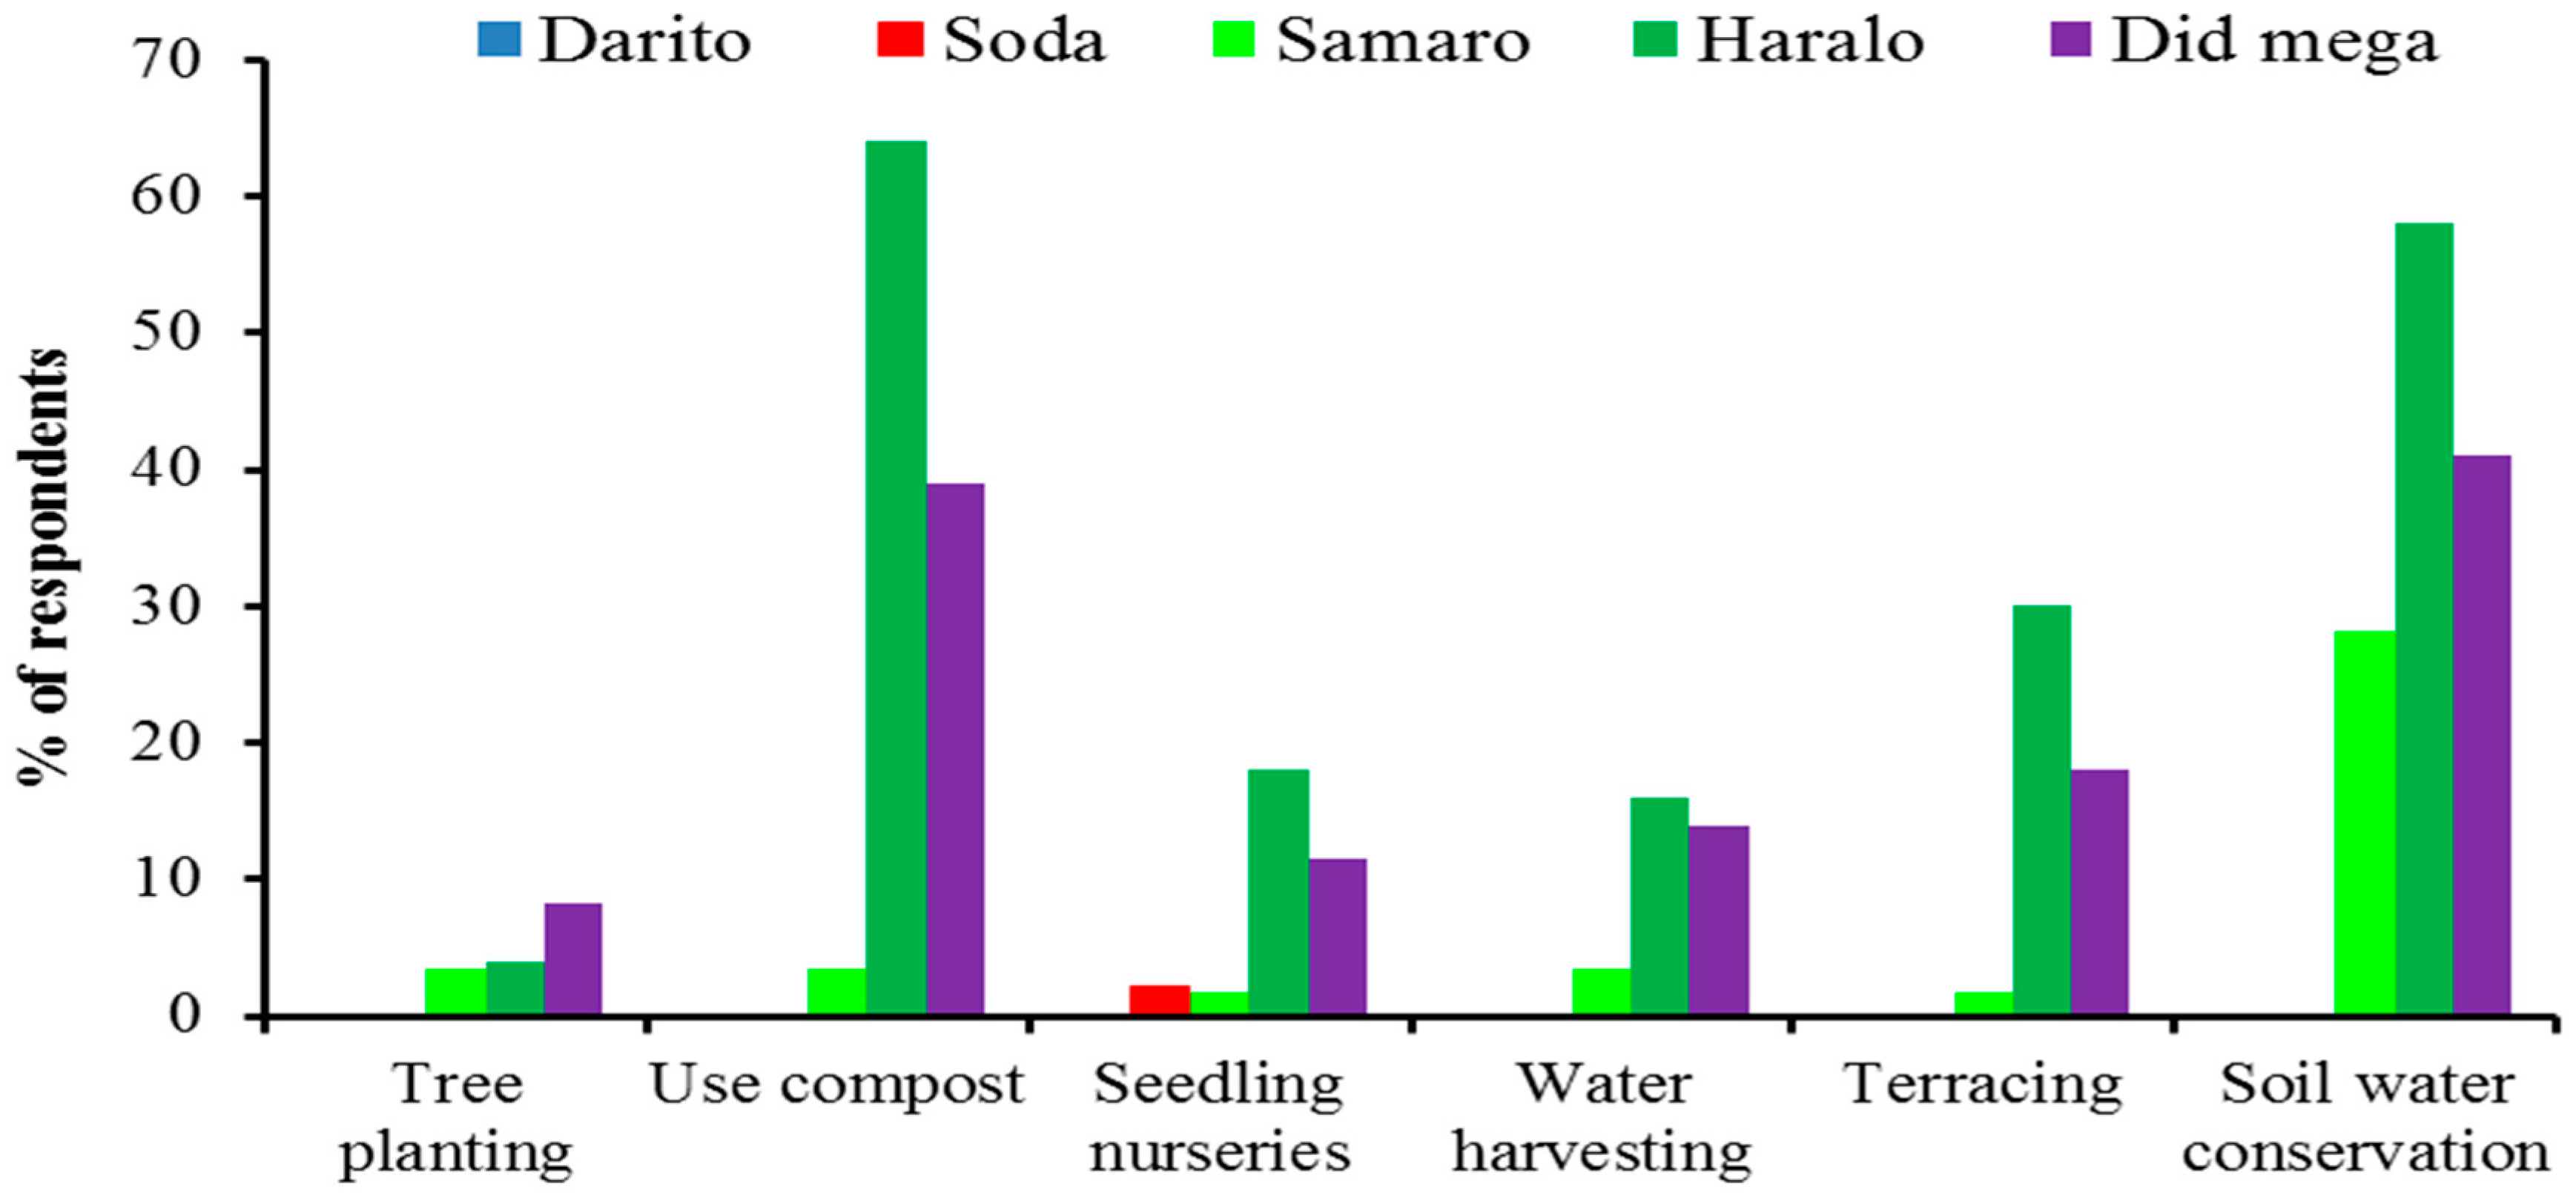
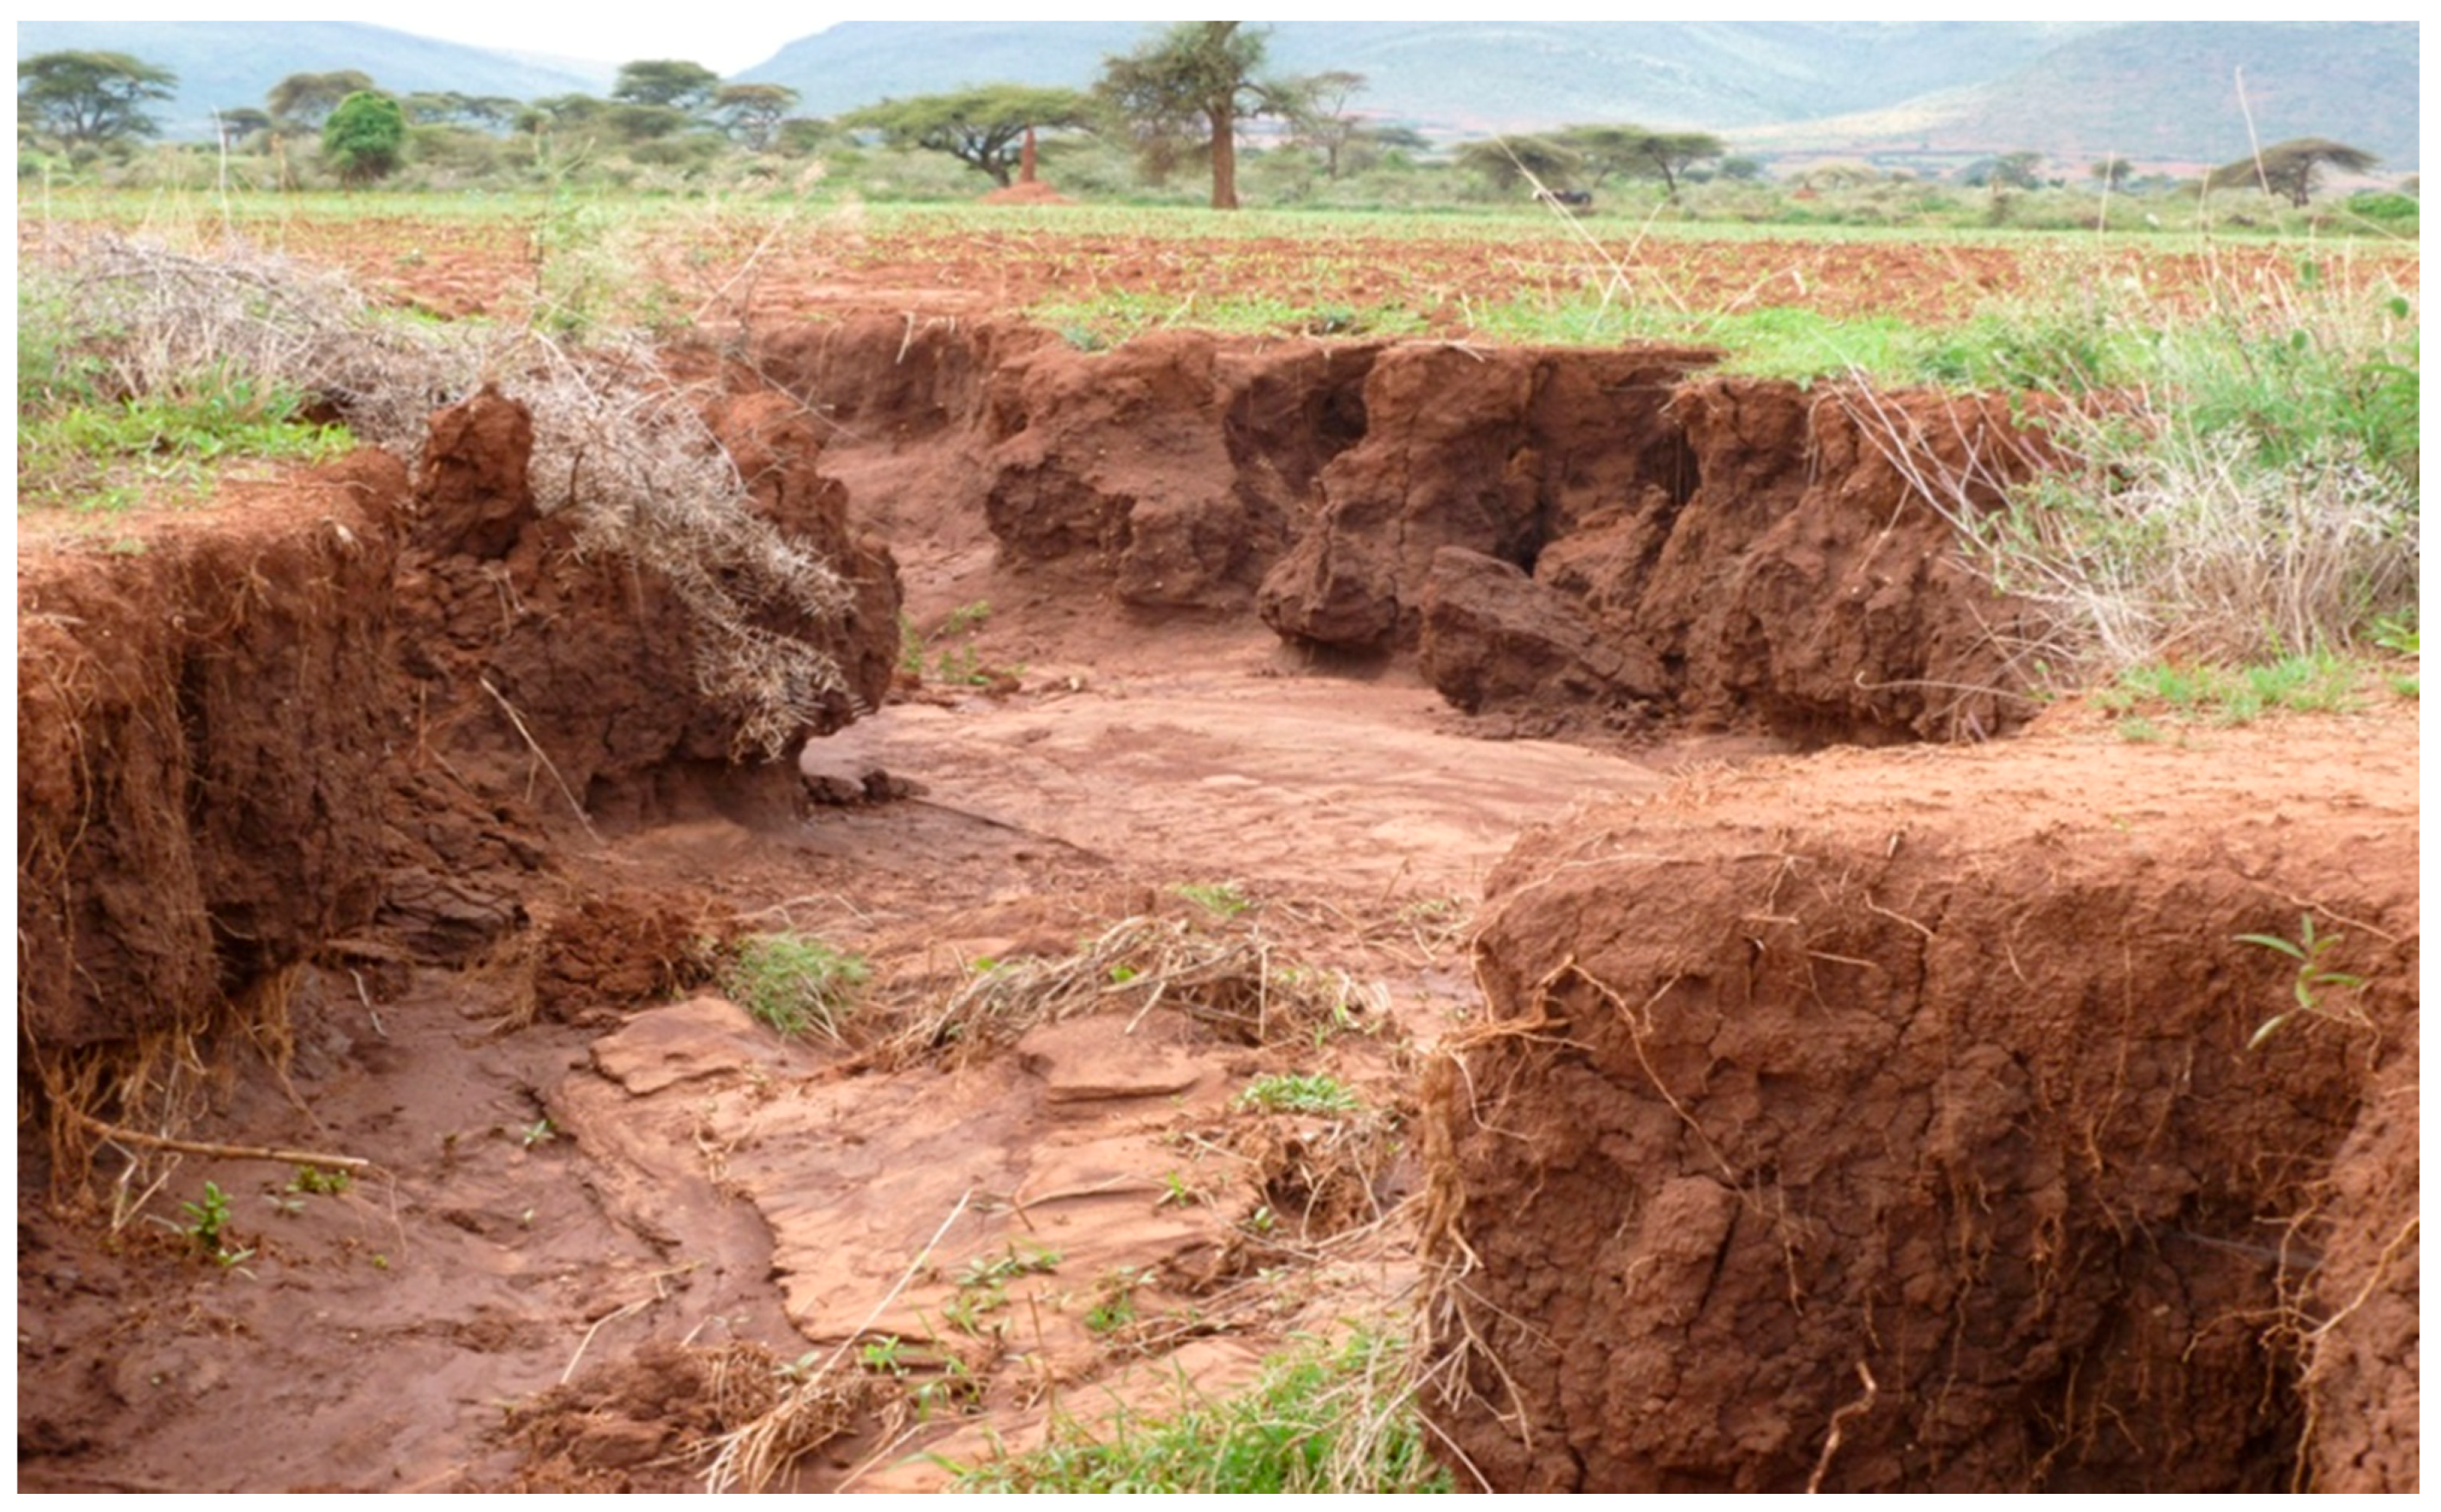
3.8. The Implications of Cultivation Practices and Land Management on the Rangeland
4. Discussion
4.1. Land Cover Changes between 1985 and 2011
4.2. Drivers Contributing to the Expansion of Cultivation in the Rangeland
5. Conclusions
Acknowledgments
Author Contributions
Conflicts of Interest
References
- Turner, B.L. Toward integrated land-change science: Advances in 1.5 decades of sustained international research on land-use and land-cover change. In Challenges of a Changing Earth; Steffen, W., Jäger, J., Carson, D.J., Bradshaw, C., Eds.; Springer: Berlin, Germany, 2002; pp. 21–26. [Google Scholar]
- Camill, P. Global change: An overview. Nat. Educ. Knowl. 2010, 3, p. 49. Available online: http://www.nature.com/scitable/knowledge/library/global-change-an-overview-13255365 (accessed on 10 November 2012).
- Lambin, E.F.; Serneels, S. Proximate causes of land-use change in Narok District, Kenya: A spatial statistical model. Agric. Ecosyst. Environ. 2001, 85, 65–81. [Google Scholar] [CrossRef]
- Geist, H.J.; Lambin, E.F. Proximate causes and underlying driving forces of tropical deforestation. Bioscience 2002, 52, 143–150. [Google Scholar] [CrossRef]
- Lambin, E.F.; Geist, H.J. Land-use and Land-cover Change: Local Processes and Global Impacts; IGBP Series; Springer-Verlag: Berlin, Germany, 2006; pp. 1–8. [Google Scholar]
- Homewood, K.; Coast, E.; Thompson, M. In-migrants and exclusion in East African rangelands: Access, tenure and conflict. Africa 2004, 74, 567–610. [Google Scholar] [CrossRef]
- Hein, L.; De Ridder, N. Desertification in the Sahel: A reinterpretation. Glob. Chang. Biol. 2006, 12, 751–758. [Google Scholar] [CrossRef]
- Wessels, K.J.; Prince, S.D.; Malherbe, J.; Small, J.; Frost, P.E.; VanZyl, D. Can human-induced land degradation be distinguished from the effects of rainfall variability? A case study in South Africa. J. Arid Environ. 2007, 68, 271–297. [Google Scholar] [CrossRef]
- Kaspersen, P.S.; Fensholt, R.; Huber, S. A spatiotemporal analysis of climatic drivers for observed changes in Sahelian vegetation productivity (1982–2007). Int. J. Geophys. 2011, 2011, 1–14. [Google Scholar] [CrossRef]
- WRI. Drylands, People, and Ecosystem Goods and Services: A Web-Based Geospatial Analysis; White, R.P., Nackoney, J., Eds.; World Resources Institute: Washington, DC, USA, 2003; pp. 1–58. [Google Scholar]
- Safriel, U.; Adeel, Z.; Niemeijer, D.; Puigdefabregas, J.; White, R.; Lal, R.; Wilson, M.; Ziedler, J.; Prince, S.; Archer, E.; et al. Dry land systems. In Ecosystems and Human Well-being: Current State and Trends; Hassan, R., Scholes, R., Ash, N., Eds.; World Resource Institute: Washington, DC, USA, 2005; pp. 625–653. [Google Scholar]
- White, R.P.; Wanasselt, W. Grasslands in Pieces: Modification and Conversion Take a Toll; World Resource Institute: Washington, DC, USA, 2000; pp. 1–4. [Google Scholar]
- Garedew, E. Land Use and Land Cover Dynamics and Rural Livelihood Perspectives in the Semi-Arid Areas of Central Rift Valley of Ethiopia. Ph.D. Thesis, Swedish University of Agricultural Sciences, Umeå, Sweden, 2010. [Google Scholar]
- Flintan, F. The Causes, Process and Impacts of Land Fragmentation in the Rangelands of Ethiopia, Kenya and Uganda: Regional Learning and Advocacy Programme for Vulnerable Dryland Communities. 2011. Available online: http://www.preventionweb.net/files/24288_24288summarybrieflandfragmentationf.pdf (accessed 5 September 2012).
- Coppock, D.L. The Borana Plateau of Southern Ethiopia: Synthesis of Pastoral Research, Development and Change, 1980–91; International Livestock Centre for Africa: Addis Ababa. Ethiopia, 1994; p. 393. [Google Scholar]
- Oba, G.; Post, E.; Syvertsen, P.O.; Stenseth, N.C. Bush cover and range condition assessments in relation to landscape and grazing in southern Ethiopia. Landsc. Ecol. 2000, 15, 535–546. [Google Scholar] [CrossRef]
- Tache, B.; Oba, G. Is poverty driving Borana herder in southern Ethiopia to crop cultivation? Hum. Ecol. 2010, 38, 639–649. [Google Scholar] [CrossRef]
- Tolera, A.; Abebe, A. Livestock production in pastoral and agro-pastoral production systems of southern Ethiopia. Livest. Res. Rural Dev. 2007, 19, 177. Available online: http://www.lrrd.org/lrrd19/12/tole19177.htm (accessed on 29 December 2014). [Google Scholar]
- Solomon, T.B.; Snyman, H.A.; Smit, G.N. Cattle-rangeland management practices and perceptions of pastoralists towards rangeland degradation in the Borana zone of southern Ethiopia. J. Environ. Manage. 2007, 82, 481–494. [Google Scholar] [CrossRef]
- Desta, S.; Coppock, D.L. Pastoralism under pressure: Tracking system change in southern Ethiopia. Human Ecology. 2004, 32, 485–486. [Google Scholar] [CrossRef]
- Liavoga, B.A.; Kathumo, V.M.; Onwonga, R.N.; Karuku, G.N.; Onyango, C.M. Assessment of trends in land cover and crop type change over two decades in Yatta sub county, Kenya. Int. J. Agric. For. Fish. 2014, 2, 46–52. [Google Scholar]
- Foody, G.M. Status of land cover classification accuracy assessment remote. Sens. Environ. 2002, 80, 185–201. [Google Scholar] [CrossRef]
- Pisanelli, A.; Chiocchini, F.; Cherubini, L.; Lauteri, M. Combining demographic and land-use dynamics with local communities perceptions for analysing socio-ecological systems: A case study in a mountain area of Italy. iForest 2012, 5, 163–170. [Google Scholar] [CrossRef]
- Mengistu, A. The Borana and the Drought: A Rangeland and Livestock Resource Study; Institute of Sustainable Development: Addis Ababa, Ethiopia, 1998; pp. 1–79. [Google Scholar]
- Tefera, S.; Snyman, H.A.; Smit, G.N. Rangeland dynamics in southern Ethiopia: (1) botanical composition of grasses and soil characteristics in relation to land-use and distance from water in semi-arid Borana rangelands. J. Environ. Manage. 2007, 85, 429–442. [Google Scholar] [CrossRef] [PubMed]
- Ethiopian Meteorological Agency. Topographical Maps of Yabelo (1992) and Mega (1993). Ethiopian Mapping Agency: Addis Ababa, Ethiopia, 2012. [Google Scholar]
- Ethiopian Meteorological Agency. Recorded Rainfall and Temperature Data of Yabelo and Dire Districts in Borana Rangeland. Ethiopian Meteorological Agency: Addis Ababa, Ethiopia, 2012; Unpublished data. [Google Scholar]
- Lillesand, T.M.; Keifer, R.W.; Chipman, J.W. Remote Sensing and Image Interpretation: Digital Image Interpretation and Analysis; John Wiley & Sons: Hoboken, NJ, USA, 2008; pp. 482–621. [Google Scholar]
- Anderson, A. Land Use and Land Cover Classification System; Geological Survey Professional Paper 964; USGS: Washington, DC, USA, 1976. [Google Scholar]
- Pratt, D.J.; Greenway, P.J.; Gwynne, M.D. A classification of East Africa rangeland, with an appendix on terminology. J. Appl. Ecol. 1966, 3, 369–383. [Google Scholar] [CrossRef]
- Pratt, D.J.; Gwynne, M.D. Rangeland Management and Ecology in East Africa; Hodder and Stoughton: London, UK, 1977. [Google Scholar]
- Haile, G.; Assen, M.; Ebro, A. Land use/cover dynamics and its implications since the 1960s in the Borana rangelands of Southern Ethiopia. Livestock Research for Rural Development 2010, 22, 132. Available online: http://www.lrrd.org/lrrd22/7/hail22132.htm (accessed on 8 March 2013). [Google Scholar]
- Wezel, A.; Haigis, J. Farmers’ perception of vegetation changes in semi-arid Niger. Land Degrad. Dev. 2000, 11, 523–534. [Google Scholar] [CrossRef]
- Tsegaye, D.; Moe, S.R.; Vedeld, P.; Aynekulu, E. Land-use/cover dynamics in Northern Afar rangelands, Ethiopia. Agric. Ecosyst. Environ. 2010, 139, 174–180. [Google Scholar] [CrossRef]
- Guo, L.; Gifford, R. Soil carbon stocks and land use change: A meta-analysis. Global Change Biol. 2002, 8, 345–360. [Google Scholar] [CrossRef]
- Lal, R. Soil carbon sequestration to mitigate climate change. Geoderma 2004, 123, 1–22. [Google Scholar] [CrossRef]
- Trumper, K.; Ravilious, C.; Dickson, B.A. Carbon in drylands: desertification, climate change and carbon finance. A UNEP-UNDP-UNCCD technical note for discussions. In Proceedings of the Seventh Session of the Committee for the Review of the Implementation of the Convention (CRIC 7), Istanbul, Turkey, 3–14 November 2008.
- Neely, C.; Bunning, S.; Wilkes, A. Review of Evidence on Drylands Pastoral Systems and Climate Change: Implications and Opportunities for Mitigation and Adaptation; Land and Water Discussion Paper 8; FAO: Rome, Italy, 2009; pp. 1–33. [Google Scholar]
- Reid, R.S.; Thornton, P.K.; McCrabb, G.J.; Kruska, R.L.; Atieno, F.; Jones, P.G. Is it possible to mitigate greenhouse gas emissions in pastoral ecosystems of the tropics. Environ. Dev. Sustain. 2004, 6, 91–109. [Google Scholar] [CrossRef]
- Seleshi, Y.; Zanke, U. Recent changes in rainfall and rainy days in Ethiopia. Int. J. Climatol. 2004, 24, 973–983. [Google Scholar] [CrossRef]
- Lambin, E.F.; Geist, H.J.; Lepers, E. Dynamics of land-use and land cover change in tropical regions. Ann. Rev. Environ. Resour. 2003, 28, 205–241. [Google Scholar] [CrossRef]
- Yemane, B. Drought and famine in the pastoral areas of Ethiopia (Oxfam GB). In Pastoralist Forum Ethiopia; Admassu, Y., Ed.; Pastoralist Forum Ethiopia: Addis Ababa, Ethiopia, 2004; pp. 117–134. [Google Scholar]
- Angassa, A.; Oba, G. Herder perception on impacts of range enclosures, crop farming, fire ban and bush encroachment on the rangeland of Borana, Southern Ethiopia. Hum. Ecol. 2008, 36, 201–215. [Google Scholar] [CrossRef]
- Campbell, D.J.; Lusch, D.P.; Smucker, T.A.; Wangu, E.E. Multiple methods in the study of driving forces of land use and land cover change: A case study of South East Kajiado district Kenya. Hum. Ecol. 2005, 33, 763–794. [Google Scholar] [CrossRef]
- Wasonga, V.O.; Nyariki, D.M.; Ngugi, R.K. Assessing socio-ecological dynamics using local knowledge in the semi-arid lowlands of Baringo districts, Kenya. Environ. Res. J. 2011, 5, 11–17. [Google Scholar] [CrossRef]
- Cheung, W.H.; Senay, G.B.; Singh, A. Trends and spatial distribution of annual and seasonal rainfall in Ethiopia. Int. J. Climatol. 2008, 28. [Google Scholar] [CrossRef]
- Crewett, W.; Bogale, A.; Korf, B. Land Tenure in Ethiopia: Continuity and Change, Shifting Rulers, and the Quest for State Control; CAPRi Working Paper 91; International Food Policy Research Institute: Washington, DC, USA, 2008; pp. 1–22. [Google Scholar]
© 2015 by the authors; licensee MDPI, Basel, Switzerland. This article is an open access article distributed under the terms and conditions of the Creative Commons Attribution license (http://creativecommons.org/licenses/by/4.0/).
Share and Cite
Elias, M.; Hensel, O.; Richter, U.; Hülsebusch, C.; Kaufmann, B.; Wasonga, O. Land Conversion Dynamics in the Borana Rangelands of Southern Ethiopia: An Integrated Assessment Using Remote Sensing Techniques and Field Survey Data. Environments 2015, 2, 1-31. https://doi.org/10.3390/environments2010001
Elias M, Hensel O, Richter U, Hülsebusch C, Kaufmann B, Wasonga O. Land Conversion Dynamics in the Borana Rangelands of Southern Ethiopia: An Integrated Assessment Using Remote Sensing Techniques and Field Survey Data. Environments. 2015; 2(1):1-31. https://doi.org/10.3390/environments2010001
Chicago/Turabian StyleElias, Michael, Oliver Hensel, Uwe Richter, Christian Hülsebusch, Brigitte Kaufmann, and Oliver Wasonga. 2015. "Land Conversion Dynamics in the Borana Rangelands of Southern Ethiopia: An Integrated Assessment Using Remote Sensing Techniques and Field Survey Data" Environments 2, no. 1: 1-31. https://doi.org/10.3390/environments2010001
APA StyleElias, M., Hensel, O., Richter, U., Hülsebusch, C., Kaufmann, B., & Wasonga, O. (2015). Land Conversion Dynamics in the Borana Rangelands of Southern Ethiopia: An Integrated Assessment Using Remote Sensing Techniques and Field Survey Data. Environments, 2(1), 1-31. https://doi.org/10.3390/environments2010001