Abstract
Historical aerial images are important to retain past ground surface information. The land-use land-cover change in the past can be identified using historical aerial images. Automatic historical image registration and stitching is essential because the historical image pose information was usually lost. In this study, the Scale Invariant Feature Transform (SIFT) algorithm was used for feature extraction. Subsequently, the present study used the automatic affine transformation algorithm for historical image registration, based on SIFT features and control points. This study automatically determined image affine parameters and simultaneously transformed from an image coordinate system to a ground coordinate system. After historical aerial image registration, the land-use land-cover change was analyzed between two different years (1947 and 1975) at the Tseng Wen River estuary. Results show that sandbars and water zones were transformed into a large number of fish ponds between 1947 and 1975.
1. Introduction
Land-use and land-cover change is a process for the human modification and biophysical attribute change of the Earth’s terrestrial surface [1]. Historical aerial images are important to retain past ground surface information. However, most historical aerial images have difficulty in applying for environmental monitoring because the pose information of historical images is usually lost. This loss prevents the images from providing useful information for further land-use land-cover change analysis. Therefore, stitching the correct locations of historical aerial photos is a necessary process in multi-temporal image analysis and land-use land-cover change analysis [2,3].
Automatic image stitching or registration is essential for survey and mapping. The first step of image registration is feature extraction from all images. Lowe (2004) first considered image matching and recognition based on the Scale Invariant Feature Transform (SIFT) algorithm [4]. Harris corner and Susan corner detections were used to identify classic point features. However, these features are sensitive to scale and rotation. The SIFT features are invariant to image scaling and rotation, and partially invariant to change in illumination [5,6,7]. A source image is matched by individually comparing each feature from the image to the reference image and finding candidates that match the features, based on the Euclidean distance of their feature vectors. The SIFT algorithm is accurate and reliable in automatic feature-point extraction at the sub-pixel level. SIFT can refine the weakness of area-based image-matching method and can also provide good feature points for quick image stitching [8]. Image exterior parameters were automatically obtained based on SIFT features through further processing [9]. However, the stitched images must be transformed into a ground coordinate system. In the present study, the transformation parameters of each image were simultaneously obtained based on SIFT features and control points, and the image coordinate system can be transformed into a ground coordinate system. After registration, historical aerial images can be efficient data in land-use land-cover change investigations. Evidence of land-use land-cover change has been found through the comparison of historical photographs.
The purpose of the study is to provide a quantitative description of land-use land-cover change using historical image registration, on-screen digitizing and land-use land-cover change analysis. The historical images enhanced the information on land-use land-cover change and image registration was considered a critical step for land-use land-cover change analysis. In the present study, image registration was simultaneously obtained, based on SIFT features and control points. After successfully registering the historical aerial images, the historical images were applied to analyze the land-use land-cover change between two different years (1947 and 1975) at the Tseng Wen River estuary.
2. Experimental Data
2.1. Study Area
The study area was located at the Qigu and Annan District of Tainan in the Tseng Wen river estuary of Taiwan (Figure 1). In 1945, following the end of World War II, Japan lost the governing polity on Taiwan. From 1974, the Taiwan government started the Ten Major Construction Projects of the infrastructure for transport and industry. The study area covers approximately 86.6 km2. In the past hundred years, this area contained a large lagoon. This lagoon was called the Old Taijiang Inner Sea. In the study area, the river course was changed annually. The study area shows a strong fluvial process indicating that sediments are deposited in the estuary. After the long-term sediment accumulation, a part of the lagoon changed into fish ponds.
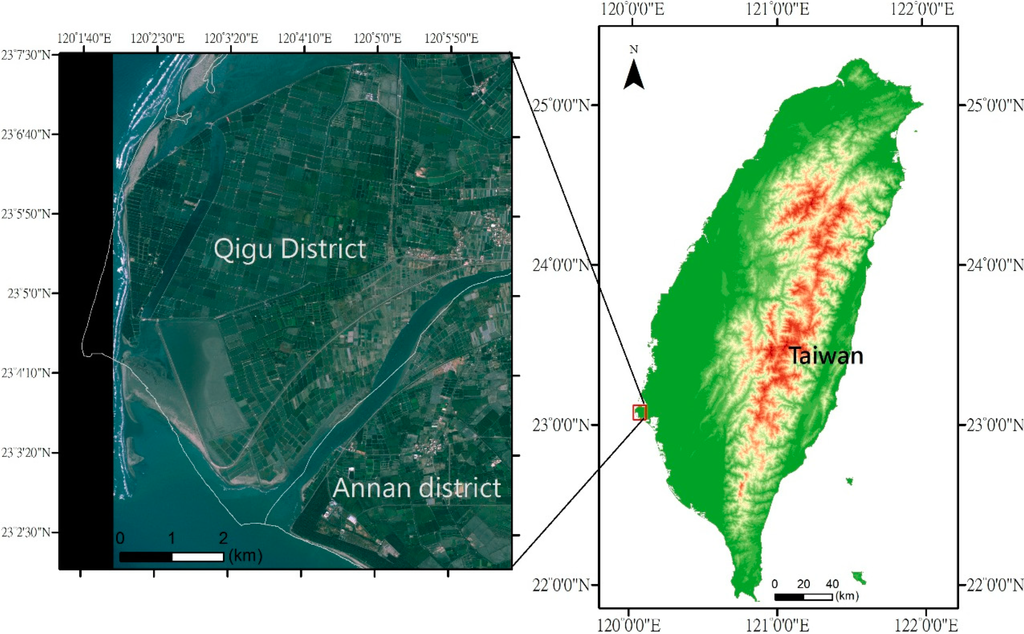
Figure 1.
Location of study area in Tainan, Southern Taiwan.
2.2. Datasets
The present study used two historical aerial images for the land-use land-cover change analysis. The U.S. military obtained the first military aerial images in 1947. Six overlapped images were involved in two flights. The resolution of the images was about 1 m. The camera parameters of these images in 1947 were lost and registration could not be made using general photogrammetry software. In the present study, we used SIFT for image matching and automatic image registration.
Second, the Taiwan military obtained the aerial images with camera calibration reports in 1975. Five strips and 100 images were involved. The images were obtained using a metric camera, Zeiss RMK-A 15/23, with a record of the camera calibration report. Thus, these images can follow the general process of aerial triangulation using SOCET GXP software.
3. Methods
3.1. Data Processing
Figure 2 shows the workflow of the present study. Aerial images lacked camera parameters in 1947, and the geometry could not be recovered using aerial triangulation. To overcome this problem, we applied SIFT to calculate the affine transformation parameters during image registration. First, we conducted image matching using the SIFT algorithm to obtain the matching points between the two images. Multi-image tie points must be detected in the next step for detailed image registration. The control points were selected and measured from FORMOSA-2 satellite images in the TWD97 (1997’s Taiwan Datum) coordinate system. The final step was the utilization of least-squares to calculate the affine transformation parameters of each image based on control and tie points. In addition, the aerial images in 1975 could be registered based on camera calibration reports. After image registration, the images were combined using a mosaic tool.
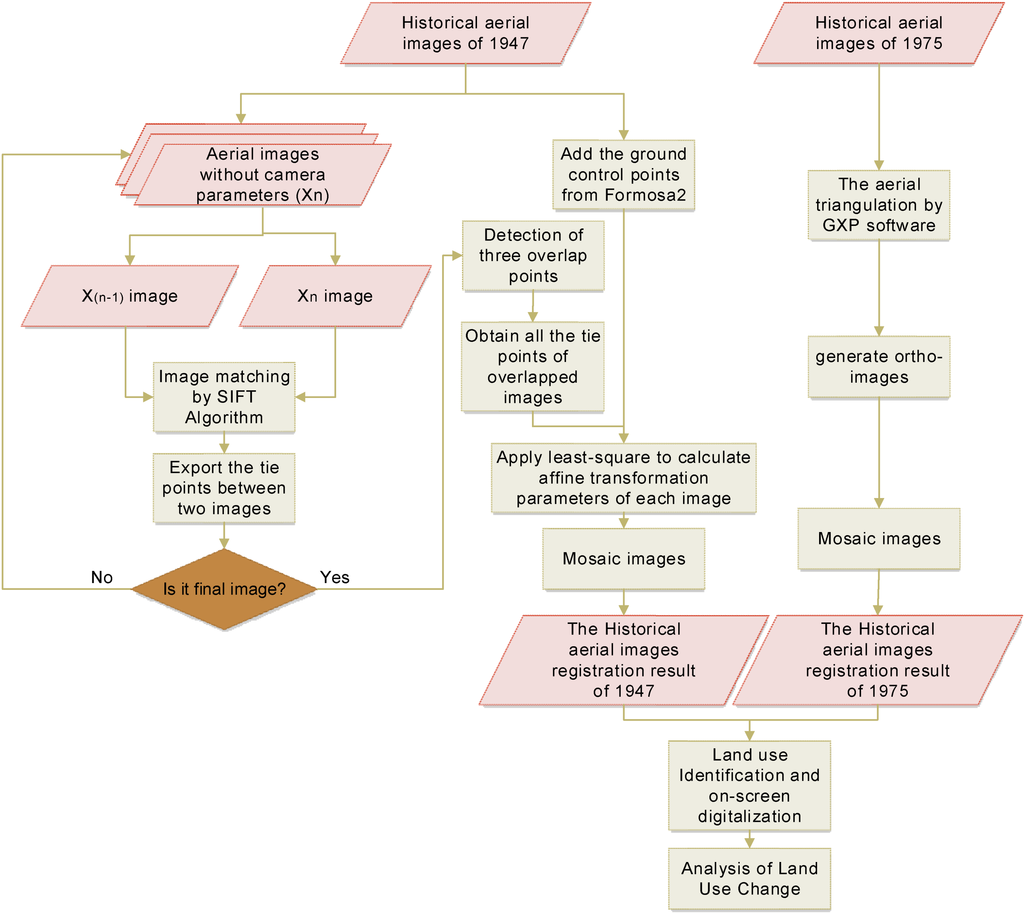
Figure 2.
Workflow of this study.
After successfully registering the historical aerial images, these images were used to analyze the land-use land-cover change between 1947 and 1975 in the Tseng Wen River estuary. Land-use land-cover vectorization via on-screen digitizing and then land-use land-cover change analysis between 1947 and 1975 were applied. In the present study, land-use land-cover was classified into seven categories: fish pond, agriculture, water zone, sandbar, village, forest, and others.
3.2. Scale Invariant Feature Transform (SIFT)
The SIFT algorithm accurately selected the feature points to obtain the tie point of historical aerial images in the overlapped area. The SIFT algorithm was applied to match all the images that lacked camera parameters and automatically obtain the tie points through automatic feature point selection.
SIFT features were first extracted from a set of reference images and stored in a database. The following were the major stages of computation used to generate the set of image features: the first stage of computation searched all scales and image locations. Potential interest points were identified using a difference-of-Gaussian function [4]. One or more orientations were assigned to each keypoint location based on local image gradient directions. The data were transformed relative to the assigned orientation, location, and scale for each feature. Finally, the local image gradients were measured and the keypoints were transformed, allowing significant levels of local shape distortion and change in illumination.
3.3. Automatic Affine Transformation
The affine transformation was applied in aerial images without camera parameters. In the model, the initial step was to obtain an approximate value using least-squares, and the next step was to solve the approximation using the iteration of indirect observation adjustments. The equations are as follows: first, both of the ground coordinates of the ground control points and the image coordinates of the points were known. Therefore, the six parameters in Equation (1) and tie points in object coordinate can be solved. The six parameters were used to transfer image coordinates to a ground coordinate system.
The inverse transformation was computed from object coordinates to image coordinates, and the inverse transformation parameters were obtained for each of image.
Least-squares adjustments based on Equation (4) are nonlinear equations, and the initial values are updated using the iteration. The iteration loop stops when the difference is less than 0.00001. The six parameters of each image can be transferred to the ground coordinate system under TWD97 [10].
4. Results and Discussion
4.1. Image Registration Result
The registration results of aerial images from 1947 that have no camera parameters are displayed in a GIS overlaid with 2009 FORMOSA-2 satellite image (Figure 3a). The interior accuracy was obtained, as shown in Table 1. The pixel resolution is approximately 1.03 m, and the sigma0 is 3.52 pixels, and the standard deviation of X and Y are 5.61 and 8.89 m, respectively (Table 1). The distribution of control points and check points are shown in Figure 3b. Eleven independent check points were used to evaluate the external accuracy of the registration result. Table 2 shows the external accuracy/root-mean-square error (RMSE) of whole images. The RMSE of check points is 17.62 m and RMSE of X and Y are 9.42 and 14.89 m, respectively (Table 2). Figure 3c shows registration results of the historical aerial images from 1975 that have camera parameters. In these images, the external accuracy of X and Y are 2.09 and 2.6 m, respectively.
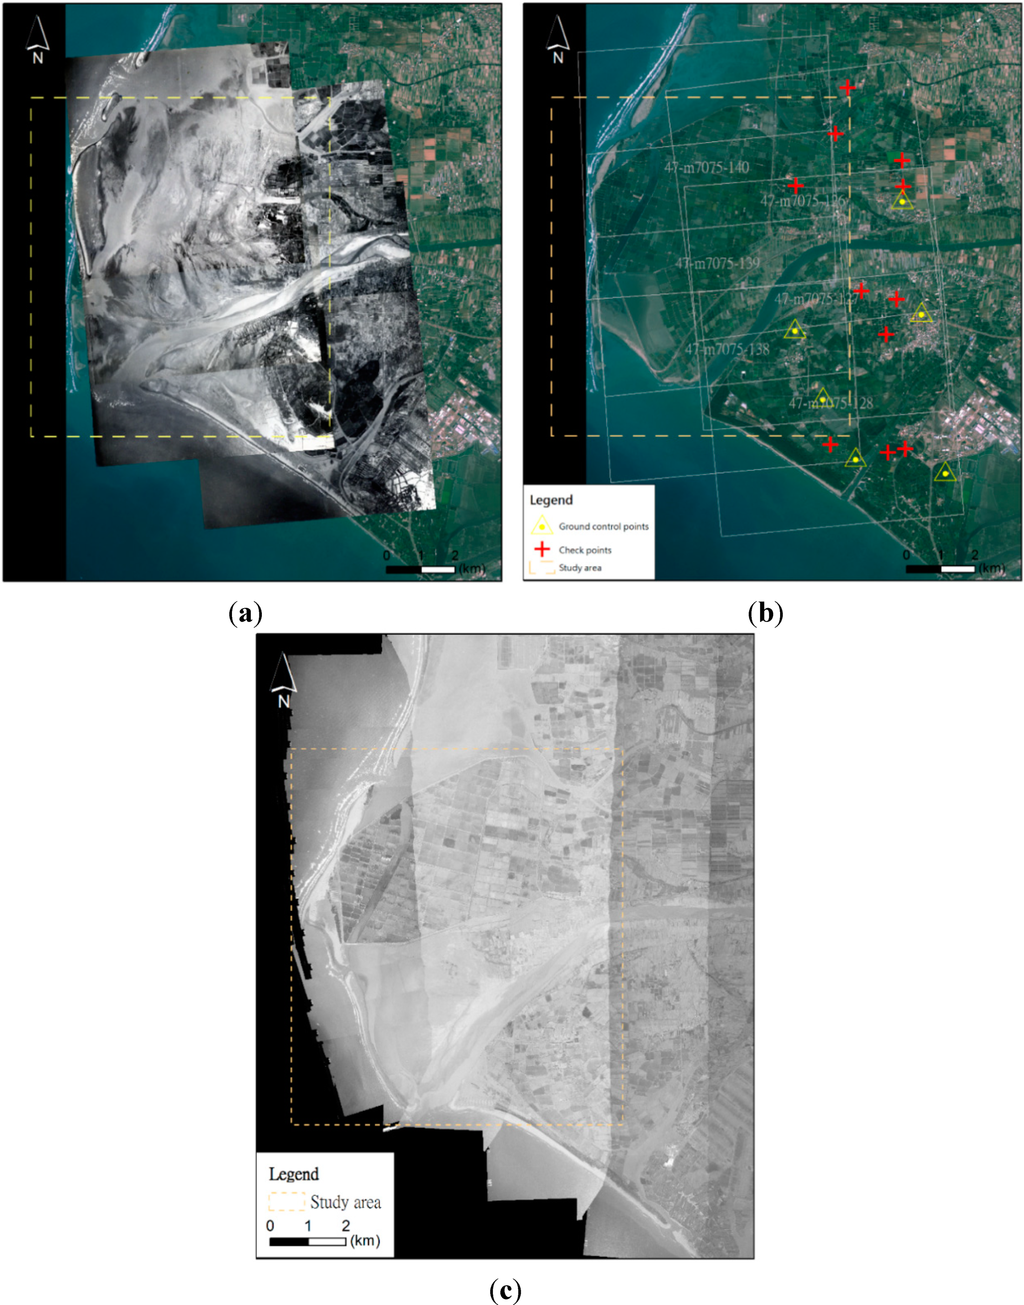
Figure 3.
(a) The registration results of historical aerial images in 1947; (b) The distribution of control points and check points in 1947; (c) The registration results of historical aerial images in 1975 (the study area is in the dash-line polygon).

Table 1.
The interior accuracy of historical aerial images.
| Item | X | Y |
|---|---|---|
| Standard deviation of Control Points (m) | 5.61 | 8.89 |
| Total number of Control Points | 9 | |
| Sigma 0 (pixels) | 3.52 | |

Table 2.
The external accuracy of historical aerial images.
| Item | X | Y |
|---|---|---|
| RMSE of Check Points (m) | 9.42 | 14.89 |
| Total number of Check Points | 9 | |
| Overall RMSE of Check Points (m) | 17.62 | |
4.2. Land-Use Land-Cover Change
The registered images were used to analyze land-use land-cover change between 1947 and 1975. Figure 4 shows the land-use land-cover of 1947 and 1975. In 1947, water zones and sand bars cover most of the area, but the fish ponds increased in 1975. The coastal development expanded to the west side with the time and was related to human activities. A large accumulation of sediment and sandbar was around the river. The area percentage histogram of each land-use land-cover type is shown in Figure 5. The result shows a large change in the three land-use land-cover categories between 1947 and 1975, which are fish pond, sandbar, and water zone. Between 1947 and 1975, the river changed its main course. The changes of the three categories are 30.95, −14.60, and −12.60 km2 in the fish pond, sandbar, and water zone, respectively. In 1975, the sandbar and water zone areas reduced but the fish ponds increased because local residents built the fish ponds. Fish ponds covered most of the land use in the study area in 1975. In addition, the study area had a certain percentage of agriculture near the Tseng Wen River.
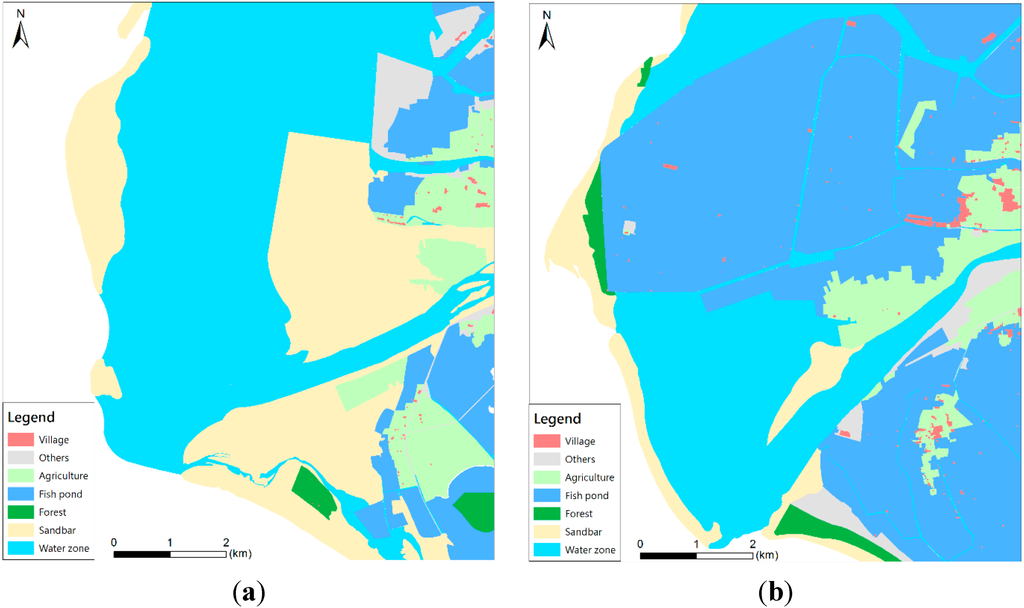
Figure 4.
(a) The land-use land-cover of 1947; (b) The land-use land-cover of 1975.
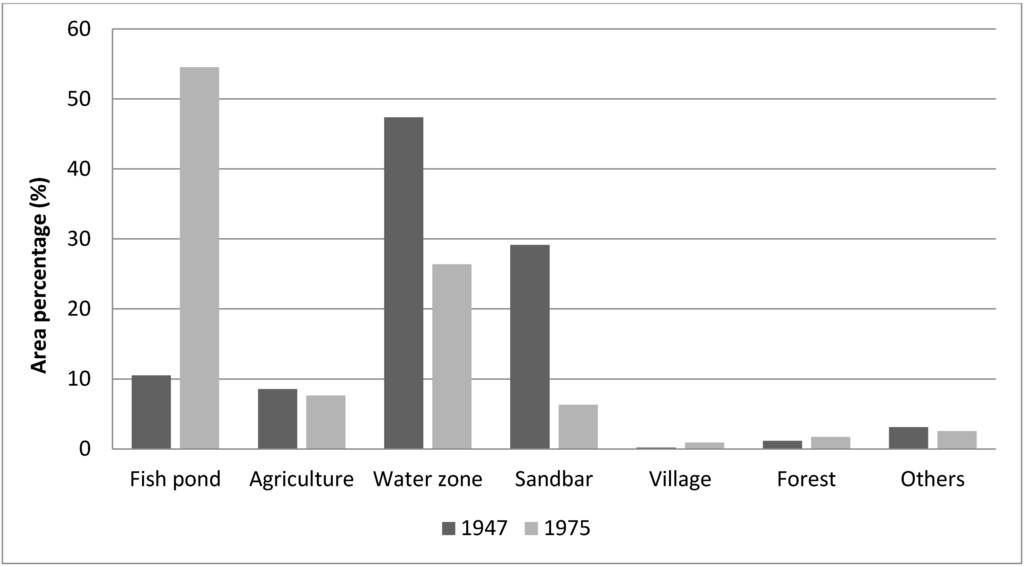
Figure 5.
Histogram for area percentage of each land-use land-cover between 1947 and 1975.
After successfully registering the historical photographs and recent imagery, the series of images were easily applied to detect the land-use land-cover changes between before and after [2].
5. Conclusions
This study was accomplished land-use land-cover analysis based on historical image registration and on-screen digitizing. The SIFT algorithm provided feature points and performed image stitching efficiently. Then, the six affine transformation parameters of each image simultaneously were calculated based on SIFT features and control points. The present study can automatically obtain image exterior parameters and transform these images from the image coordinate system to the ground coordinate system.
After image registration, historical aerial images comprise crucial spatial datasets for understanding changes in landscape. During this period (1947–1975), fish ponds were built in the sandbar and water zone areas. The water zone and sandbar decreased but the fish pond increased from 1947 to 1975 because of the local economic development in the study area. Long-term land-use land-cover change can be discovered in this region from multiple-period historical aerial images. Historical aerial images were the critical evidences for land-use land-cover change analysis. In the current study, land-use land-cover mapping was based on on-screen digitizing. The land-use land-cover will be automatically classified using a supervised classification approach in the future.
Acknowledgments
We would like to thank the Center for GIS, RCHSS, Academia Sinica for collecting and providing the historical aerial images for this research.
Author Contributions
Fang-Ju Jao performed the experiments and conducted the analyses; Hone-Jay Chu and Yi-Hsing Tseng conceived and designed the research.
Conflicts of Interest
The authors declare no conflict of interest.
References
- Lambin, E.F.; Turner, B.L.; Geist, H.J.; Agbola, S.B.; Angelsen, A.; Bruce, J.W.; Xu, J. The causes of land-use and land-cover change: Moving beyond the myths. Glob. Environ. Chang. 2001, 11, 261–269. [Google Scholar]
- Necsoiu, M.; Dinwiddie, C.L.; Walter, G.R.; Larsen, A.; Stothoff, S.A. Multi-temporal image analysis of historical aerial photographs and recent satellite imagery reveals evolution of water body surface area and polygonal terrain morphology in Kobuk Valley National Park, Alaska. Environ. Res. Lett. 2013, 8. [Google Scholar] [CrossRef]
- Grip, W.M.; Grip, R.W.; Morrison, R.D. Application of aerial photography and photogrammetry in environmental forensic investigations. Environ. Forensics 2000, 1, 121–129. [Google Scholar] [CrossRef]
- Lowe, D.G. Distinctive image features from scale-invariant keypoints. Int. J. Comput. Vis. 2004, 60, 91–110. [Google Scholar] [CrossRef]
- Yu, L.; Zhang, D.; Holden, E.J. A fast and fully automatic registration approach based on point features for multi-source remote-sensing images. Comput. Geosci. 2008, 34, 838–848. [Google Scholar] [CrossRef]
- Li, Q.; Wang, G.; Liu, J.; Chen, S. Robust scale-invariant feature matching for remote sensing image registration. IEEE Geosci. Remote Sens. Lett. 2009, 6, 287–291. [Google Scholar] [CrossRef]
- Mahesh, M.; Subramanyam, M.V. Automatic feature based image registration using SIFT algorithm. In Proceedings of the 2012 Third International Conference on Computing Communication & Networking Technologies (ICCCNT), Coimbatore, India, 26–28 July 2012.
- Chen, Y.-T. The Application and Analysis of Automatic Aero-triangulation Based on SIFT Feature Matching. Master’s Thesis, National Kaohsiung University of Applied Sciences Institutional Repository, Kaohsiung, Taiwan, 2008. [Google Scholar]
- Yang, H.C.; Zhang, S.B.; Wang, Y.B. Robust and precise registration of oblique images based on scale-invariant feature transformation algorithm. IEEE Geosci. Remote Sens. Lett. 2012, 9, 783–787. [Google Scholar] [CrossRef]
- Chiang, J.-T. Triangulation and registration of historical aerial images. In Proceedings of the 35th International Symposium on Remote Sensing of environment (ISRSE35), Beijing, China, 22–26 April 2013.
© 2014 by the authors; licensee MDPI, Basel, Switzerland. This article is an open access article distributed under the terms and conditions of the Creative Commons Attribution license (http://creativecommons.org/licenses/by/4.0/).