Article

Application of Response Surface Methodology, Isotherms, and Kinetics in Metronidazole Removal from Water Using Highly Porous Maize Cob Activated Carbon

1
Department of Chemistry, College of Natural Sciences, Makerere University, Kampala P.O. Box 7062, Uganda
2
Department of Chemistry, Busitema University, Tororo P.O. Box 236, Uganda
3
Department of Physics, Busitema University, Tororo P.O. Box 236, Uganda
4
Department of Physics, College of Natural Sciences, Makerere University, Kampala P.O. Box 7062, Uganda
5
Department of Chemistry, Faculty of Science, Gulu University, Gulu P.O. Box 166, Uganda
6
Department of Chemistry, Mississippi State University, Mississippi State, MS 39762-9573, USA
*
Authors to whom correspondence should be addressed.
Environments 2026, 13(7), 393; https://doi.org/10.3390/environments13070393
Submission received: 21 May 2026 / Revised: 29 June 2026 / Accepted: 8 July 2026 / Published: 10 July 2026
(This article belongs to the Section Environmental Pollution, Toxicology and Restoration)

Abstract

The increasing discharge of pharmaceutical contaminants, particularly antibiotics like metronidazole (MNZ), into water systems poses significant ecological and public health risks due to their high solubility and low biodegradability. This study developed and characterized a highly porous activated carbon derived from maize cob (MC-AC). The synthesized material was characterized using FTIR, FESEM, PXRD, HRTEM, and BET analysis. Batch adsorption experiments were conducted, and the removal efficiency of MC-AC for MNZ was 98.6%. Optimization and modeling of the process variables of pH (3–11), contact time (0–75 min), concentration (0–70 mg/L), temperature (25–35 °C), and adsorbent dosage (0.5–1.5 g/L) were investigated using the Box–Behnken design (BBD) of response surface methodology, and 29 runs were obtained. The BBD model determined an optimal removal efficiency of 94.6 for metronidazole. Furthermore, non-linearized kinetic and isotherm models were used to determine the adsorption mechanism and mode of metronidazole from water. From the investigation, it was observed that both the Freundlich and pseudo-second-order models exhibited high correlation coefficients. The models with the best performance and low error metrics were determined by R2, MSE, RMSE, SAE, and SSE. Therefore, the adsorption mode was multilayer heterogeneous, and the mechanism was chemisorption. Therefore, this study provides a unique alternative for using the Box–Behnken design, kinetic, and isotherm models to understand the removal of metronidazole from water using maize cob-activated carbon.

1. Introduction

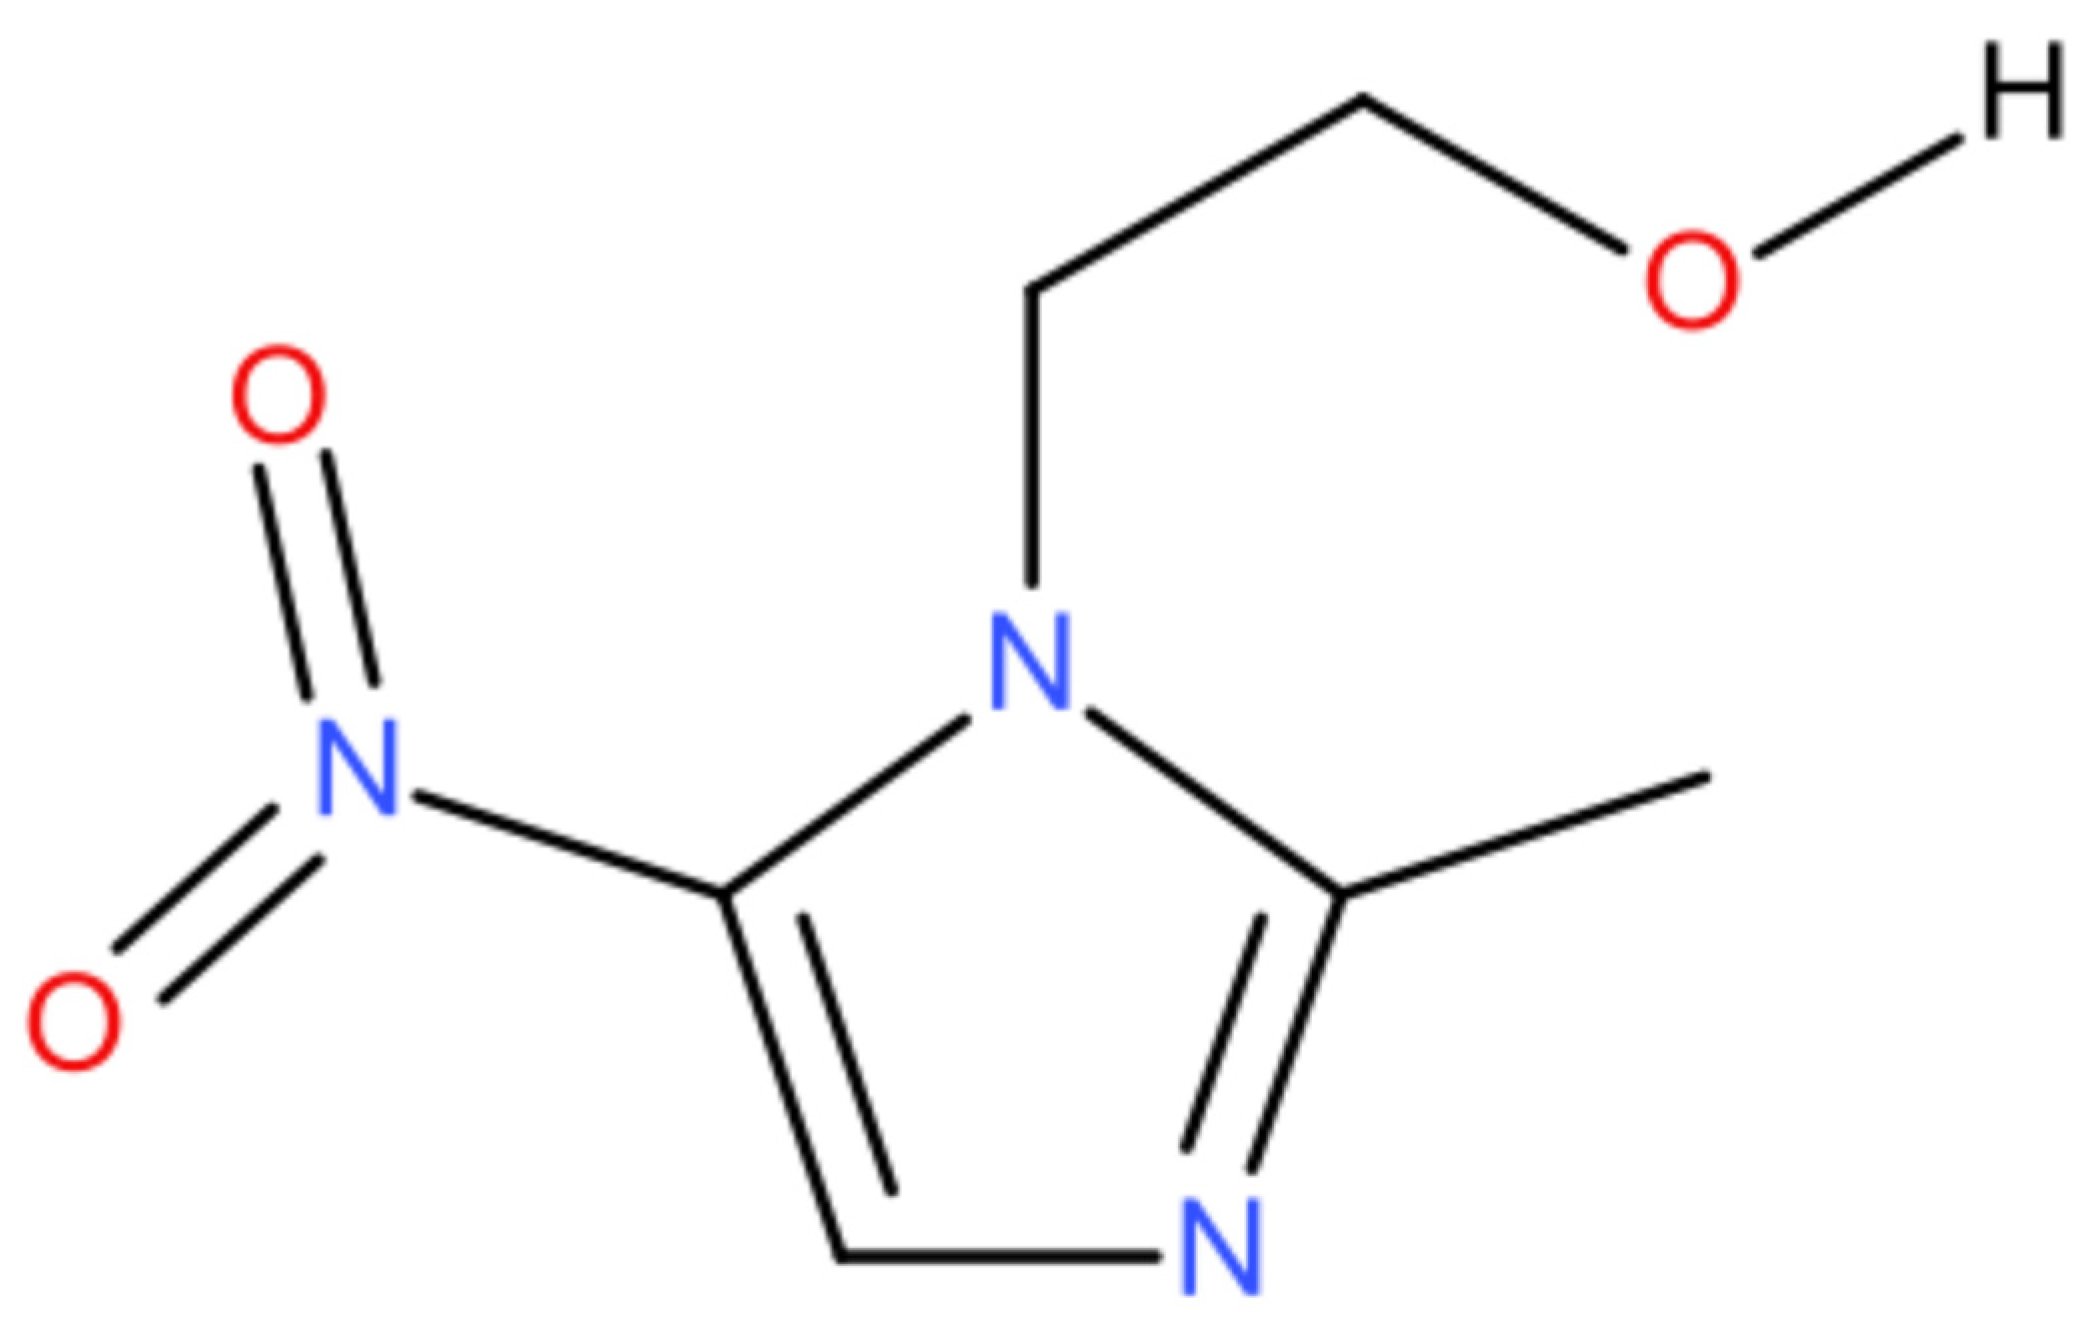
In 2026, the growing demand for processed products has increased exponentially as the population grows. The vast number of people that consume industrial, agricultural, and factory products has resulted in the discharge of materials into the environment [1,2,3]. Commonly discharged materials into the environment include toxic heavy metals, textile dyes, pharmaceuticals, and microplastics [4,5,6,7]. Among these contaminants, pharmaceuticals have been discharged into water systems at high rates [8]. The pharmaceuticals of concern include tetracycline, caffeine, metronidazole, ciprofloxacin, sulfamethoxazole, and ibuprofen [9,10,11,12,13]. These products are known antibiotics commonly used to treat bacterial infections in most parts of the world, particularly in Africa. Metronidazole, a first-generation therapeutic drug derived from 5-nitroimidazole, is used to treat infections [14,15,16,17]. Figure 1 shows the structure of metronidazole.
This drug has a wide range of applications, as observed in its use in both humans and livestock, with very few side effects reported. Antibiotics are known to have very short life cycles in the ecosystem, particularly in soil and water bodies, which is not the case for metronidazole, as it has a high solubility and low biodegradability. Due to the characteristics, it has been observed that treating both water and wastewater containing metronidazole is inefficient, with treatment efficiencies below 40%. The high toxicity of MNZ to both non-target and target organisms in ecosystems necessitates the application of water treatment techniques that effectively and efficiently remove it from water.
Several studies have reported high efficiencies in removing MNZ from water. Common techniques include reverse osmosis, advanced oxidation processes, adsorption, ion exchange, precipitation, coagulation, biodegradation, and membrane separation [18]. Among these techniques, adsorption is widely used for the removal of metronidazole from water [19]. Adsorption is a technique in which the adsorbent and adsorbate interact to establish an equilibrium between the two phases. It is well-known that this method is efficient, simple, and economically feasible for removing pollutants. Many materials follow the adsorption principle, including activated carbon, metal–organic frameworks, agricultural wastes, metal oxides, carbon nanotubes, graphene, and clays [20,21]. Among these, activated carbon has been used for treating polluted water due to its well-developed internal structure (pores) [22,23]. A variety of materials can serve as activated carbon sources, including plastics, banana peels, rice husks, walnuts, sugarcane bagasse, coconut shells, maize cob, coal, and orange peels [24,25]. The excellent surface area, diverse functional groups, and pore sizes spanning meso-, micro-, and macro-pore sizes have enabled the widespread application of activated carbon in water treatment [26]. Common elements chemically bonded to carbon include hydrogen, sulfur, nitrogen, and oxygen, which are responsible for the functional groups observed in activated carbon [27]. The functional groups that normally occur on the surface of activated carbon include quinones, carboxyl, lactones, phenols, and carbonyl, among others [28]. These functional groups are mainly influenced by the activation process, thermal treatment, carbon source, and post-chemical treatment [19]. The concentration of functional groups and the surface nature can be modified through chemical and physical treatments [29]. The chemical process is normally influenced by the addition of a suitable base (potassium or sodium hydroxide) or an acid (sulfuric or phosphoric acid), which greatly affects the surface area and pore-size distribution of the activated carbon [30]. Hena et al. [31] conducted an experiment on the removal of metronidazole from water using C. vulgaris, achieving an efficiency of 50.80%. Another study by El Farissi et al. [32] also showed that the removal efficiency of MNZ by a carbon modified with phosphoric acid was 83%. Lotfi Golsefidi et al. [33] investigated the removal of MNZ from water using modified red mud, achieving a 69.87% efficiency.
Response surface methodology (RSM) is used to model the adsorption process through different variables when applied in the removal of metronidazole from water [34]. It has been used by researchers to understand the underlying principles in the interaction between the adsorbate and adsorbent. In the removal of metronidazole from water, response surface methodology plays a crucial role in optimization of the process variables, which include pH, time, concentration, and adsorbent dosage [35]. RSM mainly comprises two response models: the central composite design (CCD) and the Box–Behnken design (BBD), which are used to determine the optimal operating conditions and the parameter space of the variables [36,37]. The novelty of this study is in the application of kinetic analysis, isotherms, and RSM to model and predict the removal of metronidazole from water using alkali-modified maize cob. Furthermore, this study aims to investigate the mechanism and mode of adsorption using mathematical calculations based on non-linearized kinetic and isotherm models. To the best of the authors’ knowledge, no studies have combined response surface methodology with non-linearized models to optimize and model metronidazole removal from water.

2. Materials and Methods

2.1. Chemicals and Materials

Sodium hydroxide, nitric acid, distilled water, sulfuric acid, and metronidazole were all obtained from Sigma-Aldrich (St. Louis, MO, USA). The maize cob used in the study was obtained from a market in Kampala district, Uganda, and used for biochar synthesis.

2.2. Preparation of Adsorbate Stock Solution

A total of 1 g of metronidazole was weighed on a balance, dissolved in 500 mL of water, and then diluted to 1 liter to obtain 1000 mg/L of the stock solution. Hence, serial dilutions were made from the stock to make different concentrations, which were used to obtain the calibration series.

2.3. Preparation of Activated Carbon from Maize Cob

The method for preparing activated carbon from maize cobs was reported by Kigozi et al. [38], and necessary adjustments were made. The maize cob (100 mg) was cleaned with deionized water to remove soil, dried, and chopped into small pieces measuring about 3 cm. The material obtained was oven-dried at 110 °C for 48 h, then ground and passed through a 1.0 mm filter. The MC powder was synthesized at elevated temperatures using a two-step process. Initially, the MC was carbonized at 400 °C under a nitrogen atmosphere with a ramp rate of 3 °C/min. This was followed by alkali pretreatment (KOH) at a mass ratio of 1:4, which was placed in a furnace at 800 °C, with a nitrogen flow rate of 300 mL/min, a ramp temperature of 3 °C/min, and a time of 2 h.

2.4. Characterization of the Maize Cob Activated Carbon

The maize cob activated carbon was characterized using Fourier transform infrared spectroscopy (FTIR), field-emission scanning electron microscopy (FESEM), powder X-ray diffraction (PXRD), high-resolution transmission electron microscopy (HRTEM), and Brunauer–Emmett–Teller (BET).

2.4.1. Fourier Transform Infrared Spectroscopy

Surface functional groups of the synthesized maize cob-activated carbon were measured using a Bruker Optik GmbH Vertex 70 (Ettlingen, Germany) FTIR instrument. The FTIR spectra were acquired in 32 scans within a range of 4000–600 cm−1, with an 8 cm−1 resolution.

2.4.2. Field Emission Scanning Electron Microscopy (FESEM)

The structural morphology of the synthesized MC-AC was determined using a 9GeminiSEM 500 M/s Carl ZEISS-EDAX Z2 Analyzer AMETEK (AMETEK, Inc., Berwyn, PA, USA) field emission scanning electron microscope.

2.4.3. Powder X-Ray Diffraction (PXRD)

The crystalline structure was investigated on a Rigaku SmartLab Autosampler (Rigaku Corporation, Neu-Isenburg, Germany) and a powder X-ray diffractometer (Rigaku Corporation, Neu-Isenburg, Germany). Information from the International Center for Diffraction Data (ICDD), with a known scan range of 5 to 80° in 2θ using Cu kα radiation, was referenced during the analysis.

2.4.4. High-Resolution Transmission Electron Microscope (HRTEM)

The topology and morphology of the synthesized MC-AC material were determined using a high-resolution transmission electron microscope (Tecnai F20 ST (FEI Company, Eindhoven, The Netherlands)) equipped with a field-emission gun, operating at 200 kV.

2.4.5. Brunauer–Emmett–Teller (BET)

The pore size and surface area of the material were determined using a Gemini 2360 (Micromeritics Instrument Corporation, Norcross, GA, USA) automated at 77 K, which provides N2 adsorption/desorption isotherms. It is operated at a 10 °C/min ramp rate, with a 90 °C preheating, under a vacuum environment established after 10 h of degassing. The investigation of adsorption/desorption isotherms is conducted at relative pressures ( P / P o ), as shown in Equation (1):
P / P o V a d s 1 P / P o = 1 C V m + C 1 C V m P / P o
where Vads shows the volume of adsorbed gas, P is the pressure of the gas at equilibrium, C shows the adsorption energy constant of BET, Vm shows the coverage of the volume on a monolayer surface, and Po is the saturation vapor pressure.

2.5. Batch Experiments

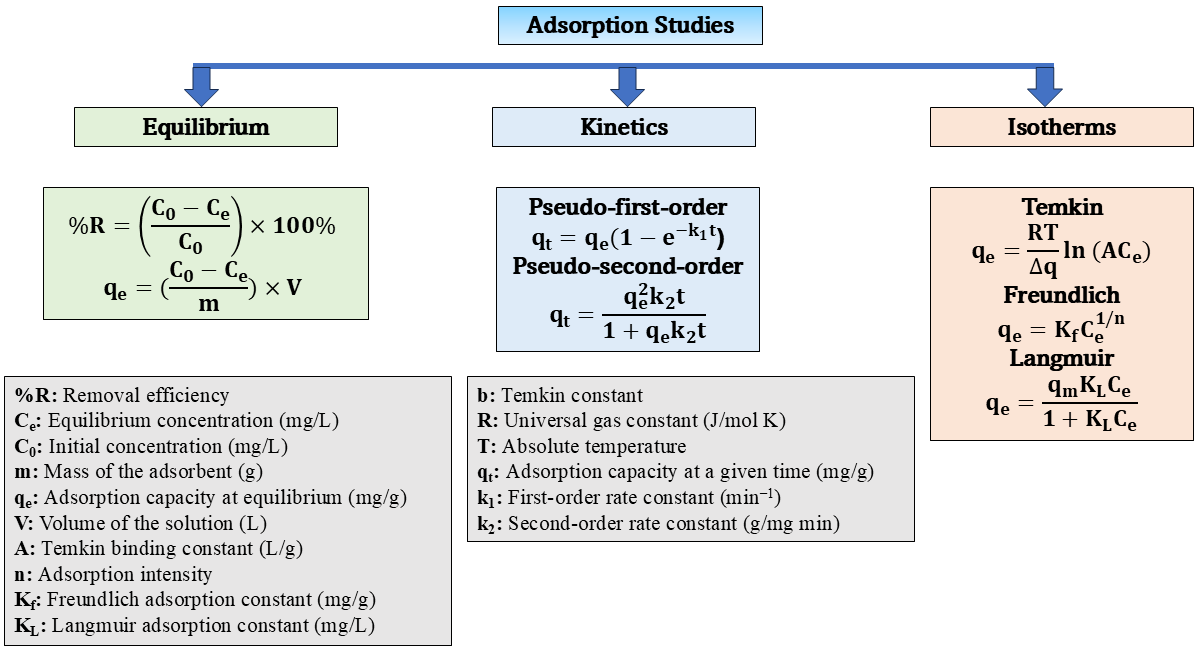
These were conducted to evaluate the percentage removal of MNZ using MC-AC. Experiments were carried out in a 100 mL solution of MNZ (0–70 mg L−1), dosage (0.5–1.5 g/L), pH (3–11), temperature (25–35 °C), and time (0–75 min). To improve experimental efficiency, one parameter was determined at a time, with the others held constant, and the data were averaged across three runs. The resultant solution was analyzed using a spectrophotometer (UV-3100PC (Avantor, Inc., Radnor, PA, USA)) at 350 nm. Adsorption isotherms were investigated for MNZ in the range of 0, 10, 20, 30, 40, 50, 60, and 70 mg/L at a pH of 7.5 (neutral). The mixture was placed on a magnetic stirrer at 150 rpm, with an adsorbent dosage of 0.015 g/L, a temperature range of 25–30 °C, and a time duration of 90 min. After the adsorption process, the mixture was filtered using Whatman 11 µm pore size filter papers, and the filtrate was analyzed using a UV-3100PC spectrophotometer. In addition, the contact time (0–75 min), pH 7.5, concentration 10 mg/L, and temperature 25 °C were investigated to determine performance in a batch process. Finally, the thermodynamics of MNZ adsorption onto MC-AC at optimal reaction conditions (pH, time, dosage, and concentration) with varying temperatures (293, 298, 303, and 308 K) was examined. The adsorption experiments for the removal of MNZ using MC-AC are discussed in Figure 2.

2.6. Regeneration Studies

The studies on the regeneration of spent maize cob-activated carbon were conducted to determine the adsorbent’s reusability and applicability. Briefly, the spent maize cob-activated carbon was centrifuged with 0.1 M sodium hydroxide for 2 h. This time allowed the adsorbed MNZ molecules to desorb from the adsorbent surface, after which the adsorbent was washed with distilled water and left to dry. After this, the adsorbent was re-applied to spiked water containing metronidazole to assess its cyclic stability across multiple runs.

2.7. Response Surface Methodology

The modeling and optimization of the input variables were conducted using a Box–Behnken design in the Design of Expert software (version 13.0.5.0, Stat-Ease) to determine the relationship between the input and the response regarding MNZ removal efficiency. This approach introduces three-dimensional space, two-dimensional contour plots, analysis of variance (ANOVA), and the quadratic regression model, which together provide optimal conditions for MNZ removal from water. The BBD offered twenty-nine (29) runs in combination of four input variables, which included pH, time, concentration, and dosage, as shown in Table 1.
The quadratic equation used in this study was obtained using Equation (2):
Y % = β o + β i X i + β i i X i 2 + β i j X i X j + + e
where Y is the parameter output, j and i provide the behavior of the individual parameters, and xi, xij, and xji are factors being coded. Furthermore, β0 is the constant for the final adjustment, and βi, βij, and βii are the linear, interactive, and quadratic effects.
Model performance for both experimental and predicted data was evaluated, and verification was assessed using regression coefficient analysis, congruence, and residual error analysis. The model reliability and stability were investigated by the F values with a 95% confidence level to further determine p < 0.05, which corresponds to statistical significance.

2.8. Functions for Error Analysis

Error analysis was performed using functions such as the correlation coefficient (R2), the sum of absolute errors (SAE), the mean squared error (MSE), and the sum of squared errors (SSE). A detailed description of the statistical metrics is shown in Table 2.

3. Results and Discussion

3.1. Characterization of the Synthesized Maize Cob-Activated Carbon

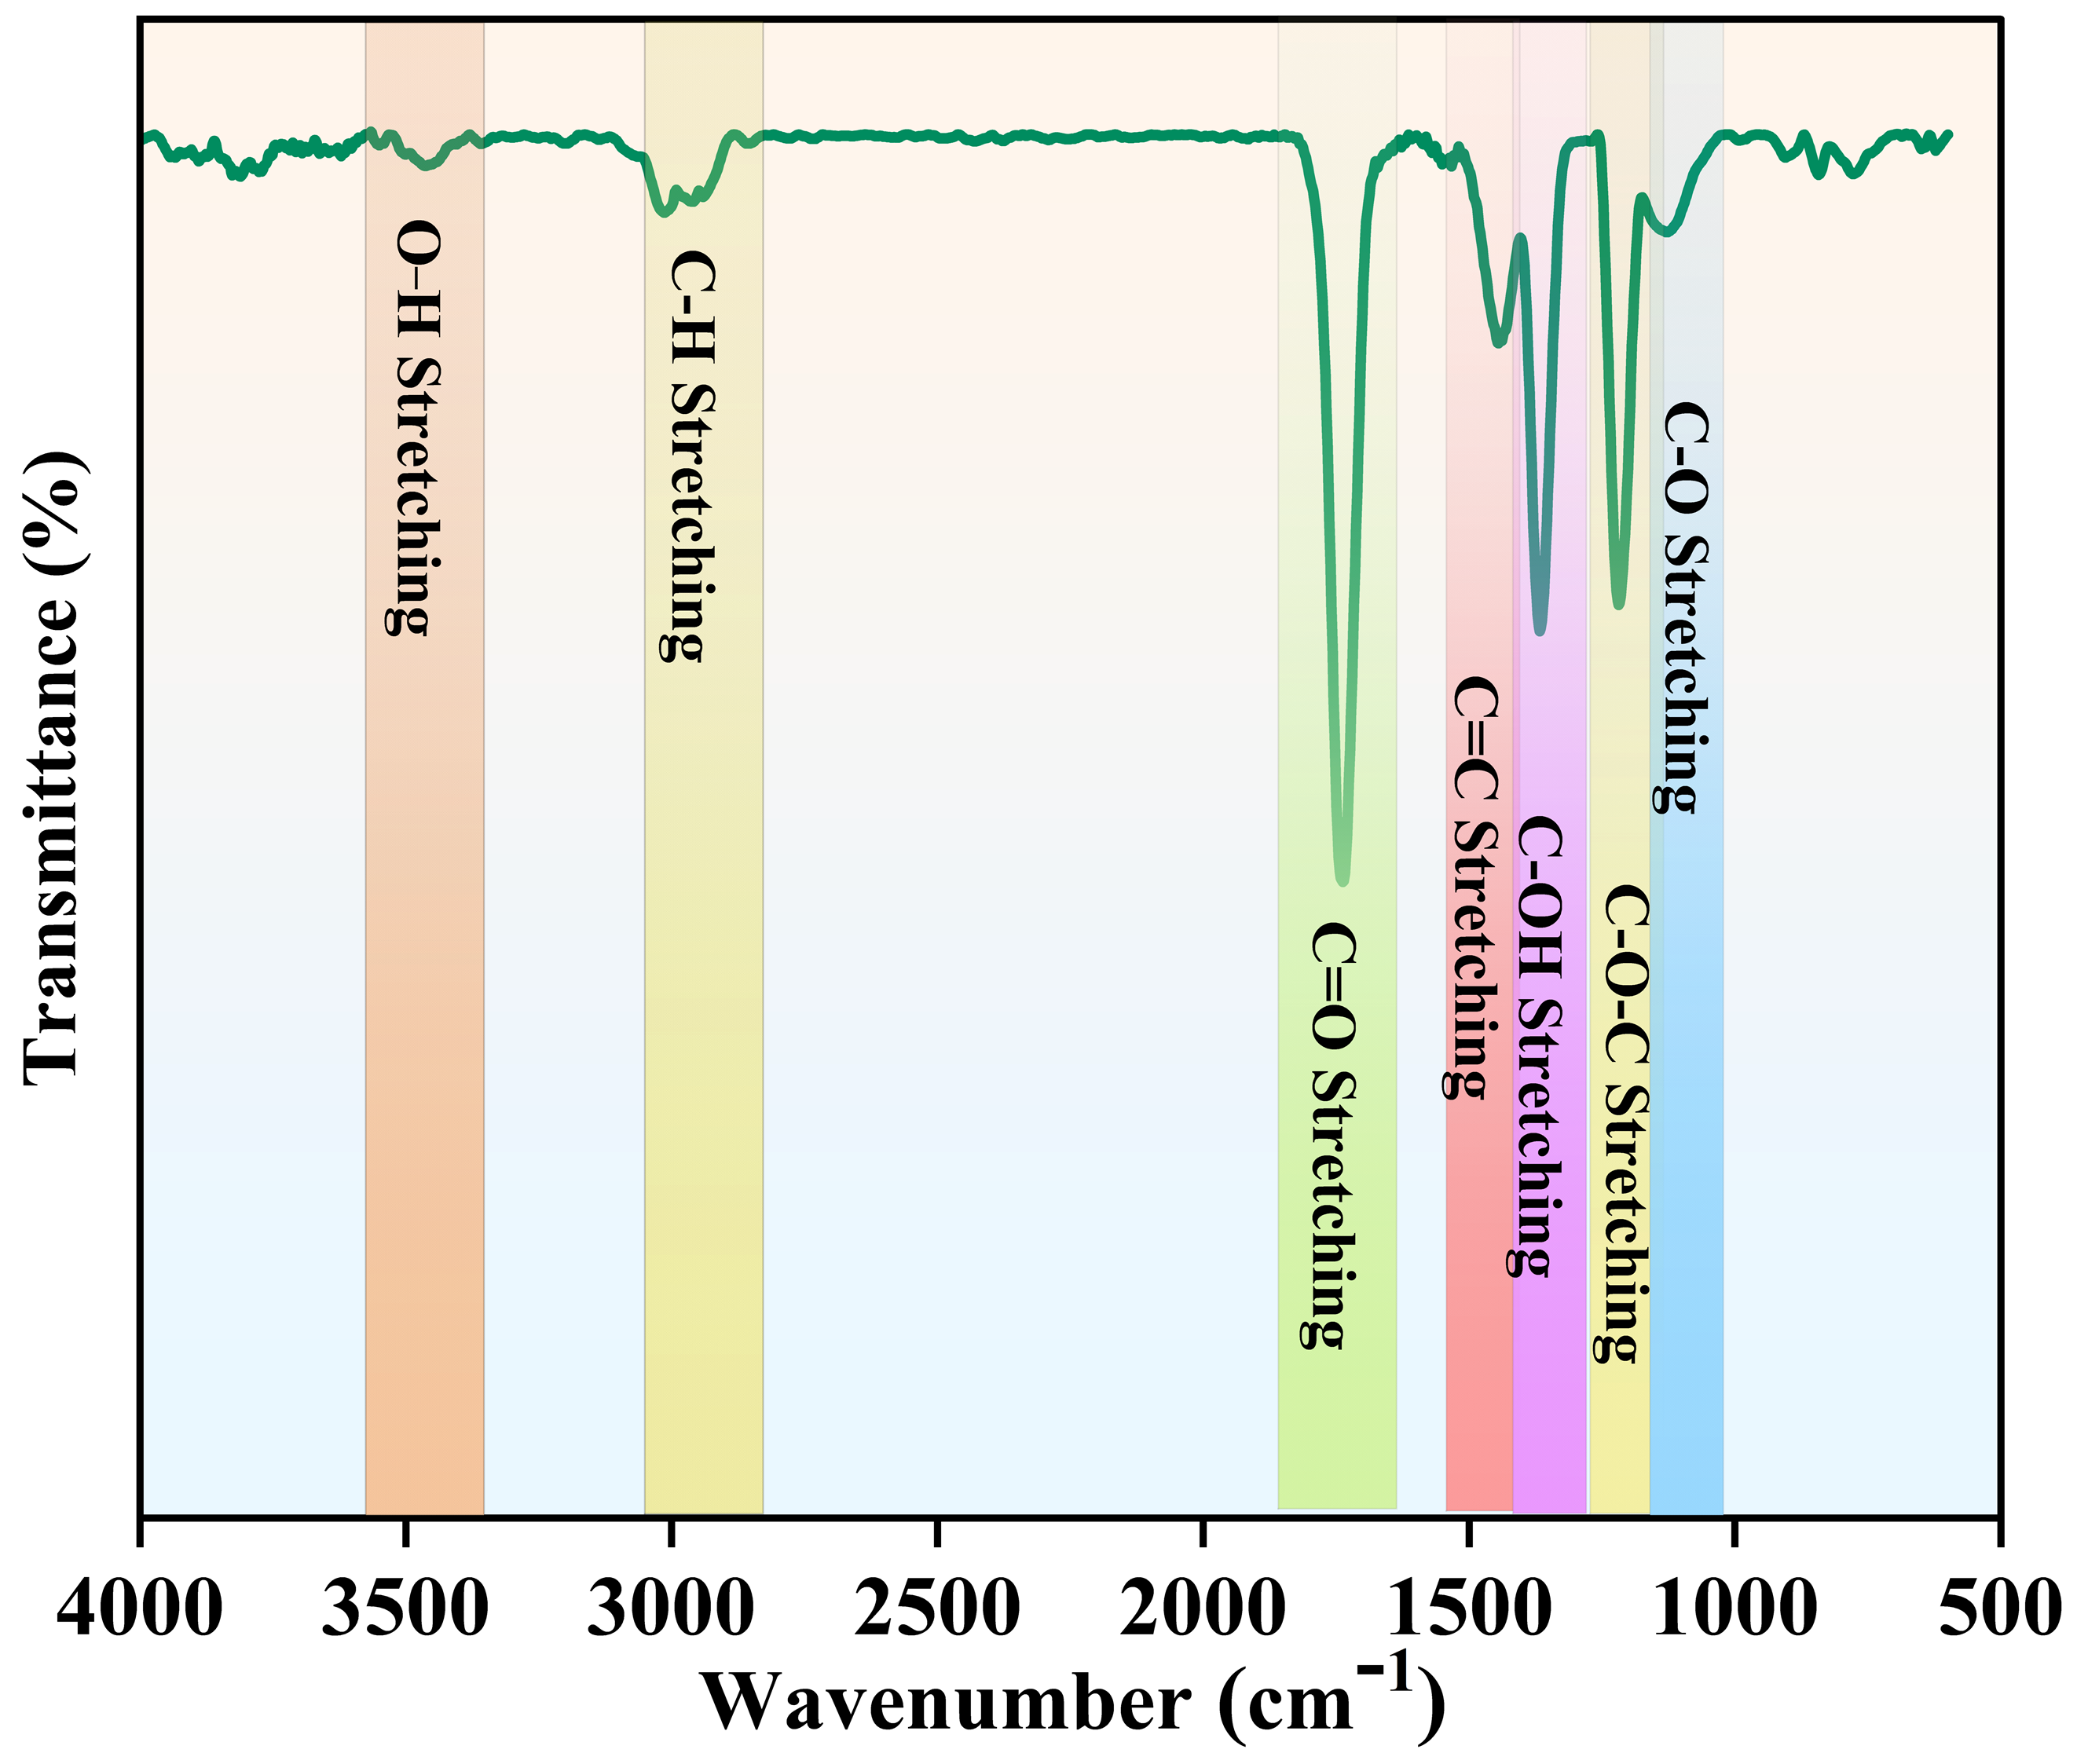
The presence of surface functional groups on the alkali-modified maize cob-activated carbon was determined by FTIR analysis, as illustrated in Figure 3.
A wavelength range of 500–4000 cm−1 was used to detect peaks, which provide insight into the groups attached to the material. This adjustment provides an overview of the range of functional groups on the adsorbent. The presence of hydroxyl, amine, carboxyl, epoxy, and ester groups contributes to the strong interaction between metronidazole and the adsorbent surface. The observed peaks are characteristic of activated carbon from the literature [39,40].
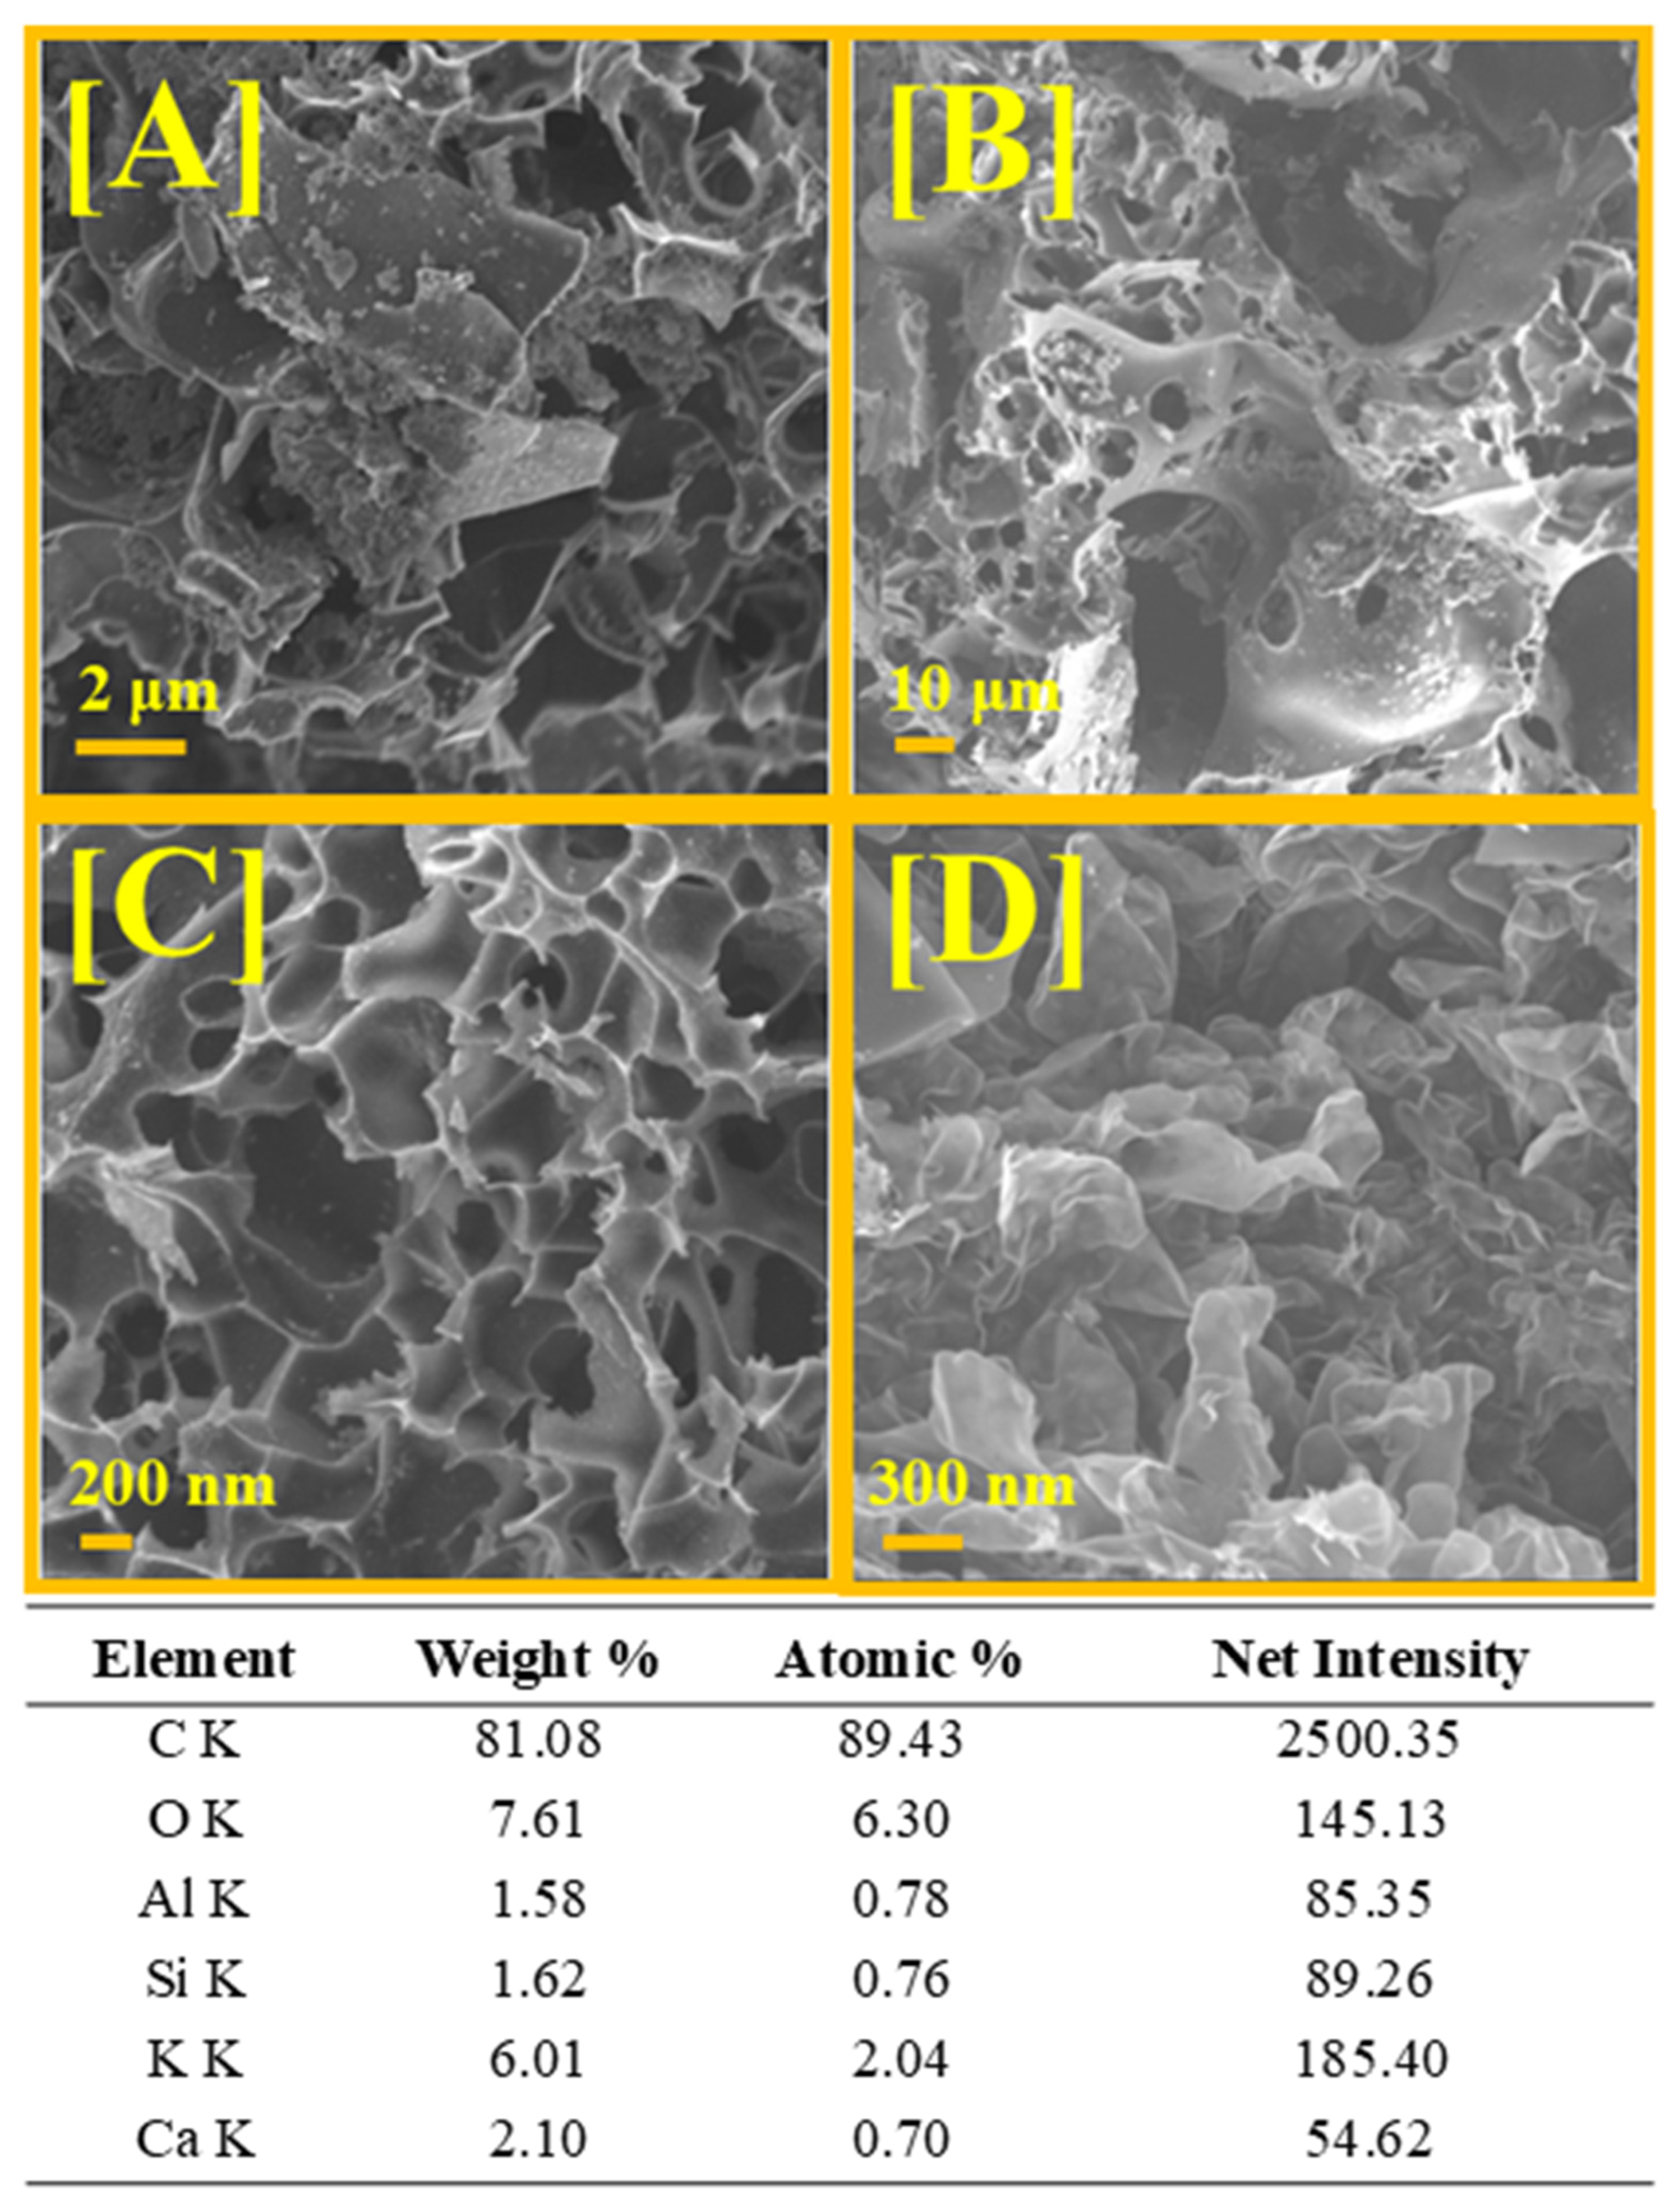
The sample was investigated for morphology and analyzed at different magnifications, as shown in Figure 4. The figure shows the presence of uneven textural surfaces that were rough, which also contained small voids and cracks. The structural nature of MC-AC makes it highly porous, thereby increasing its capacity to adsorb MNZ from spiked water. It was also observed that some regions of the sample exhibited particle agglomeration, which can be attributed to incomplete dispersion during material synthesis [41,42]. It is worth noting that the above-mentioned characteristics ensure that the material maintains its pore structure and permeability, thereby providing sufficient interaction between MNZ and the maize cob-activated carbon. In addition, the EDS spectra show that the material contains carbon and other minerals, such as silicon, calcium, potassium, aluminum, and oxygen, due to the uptake of impurities, as observed in other adsorbents derived from agricultural wastes. The high carbon content ensures electron donor–acceptor interactions with the nitroimidazole rings of metronidazole, resulting in a strong attraction. Furthermore, the oxygen content indicates the presence of functional groups, such as hydroxyl and carbonyl groups, which form extensive hydrogen bonds.
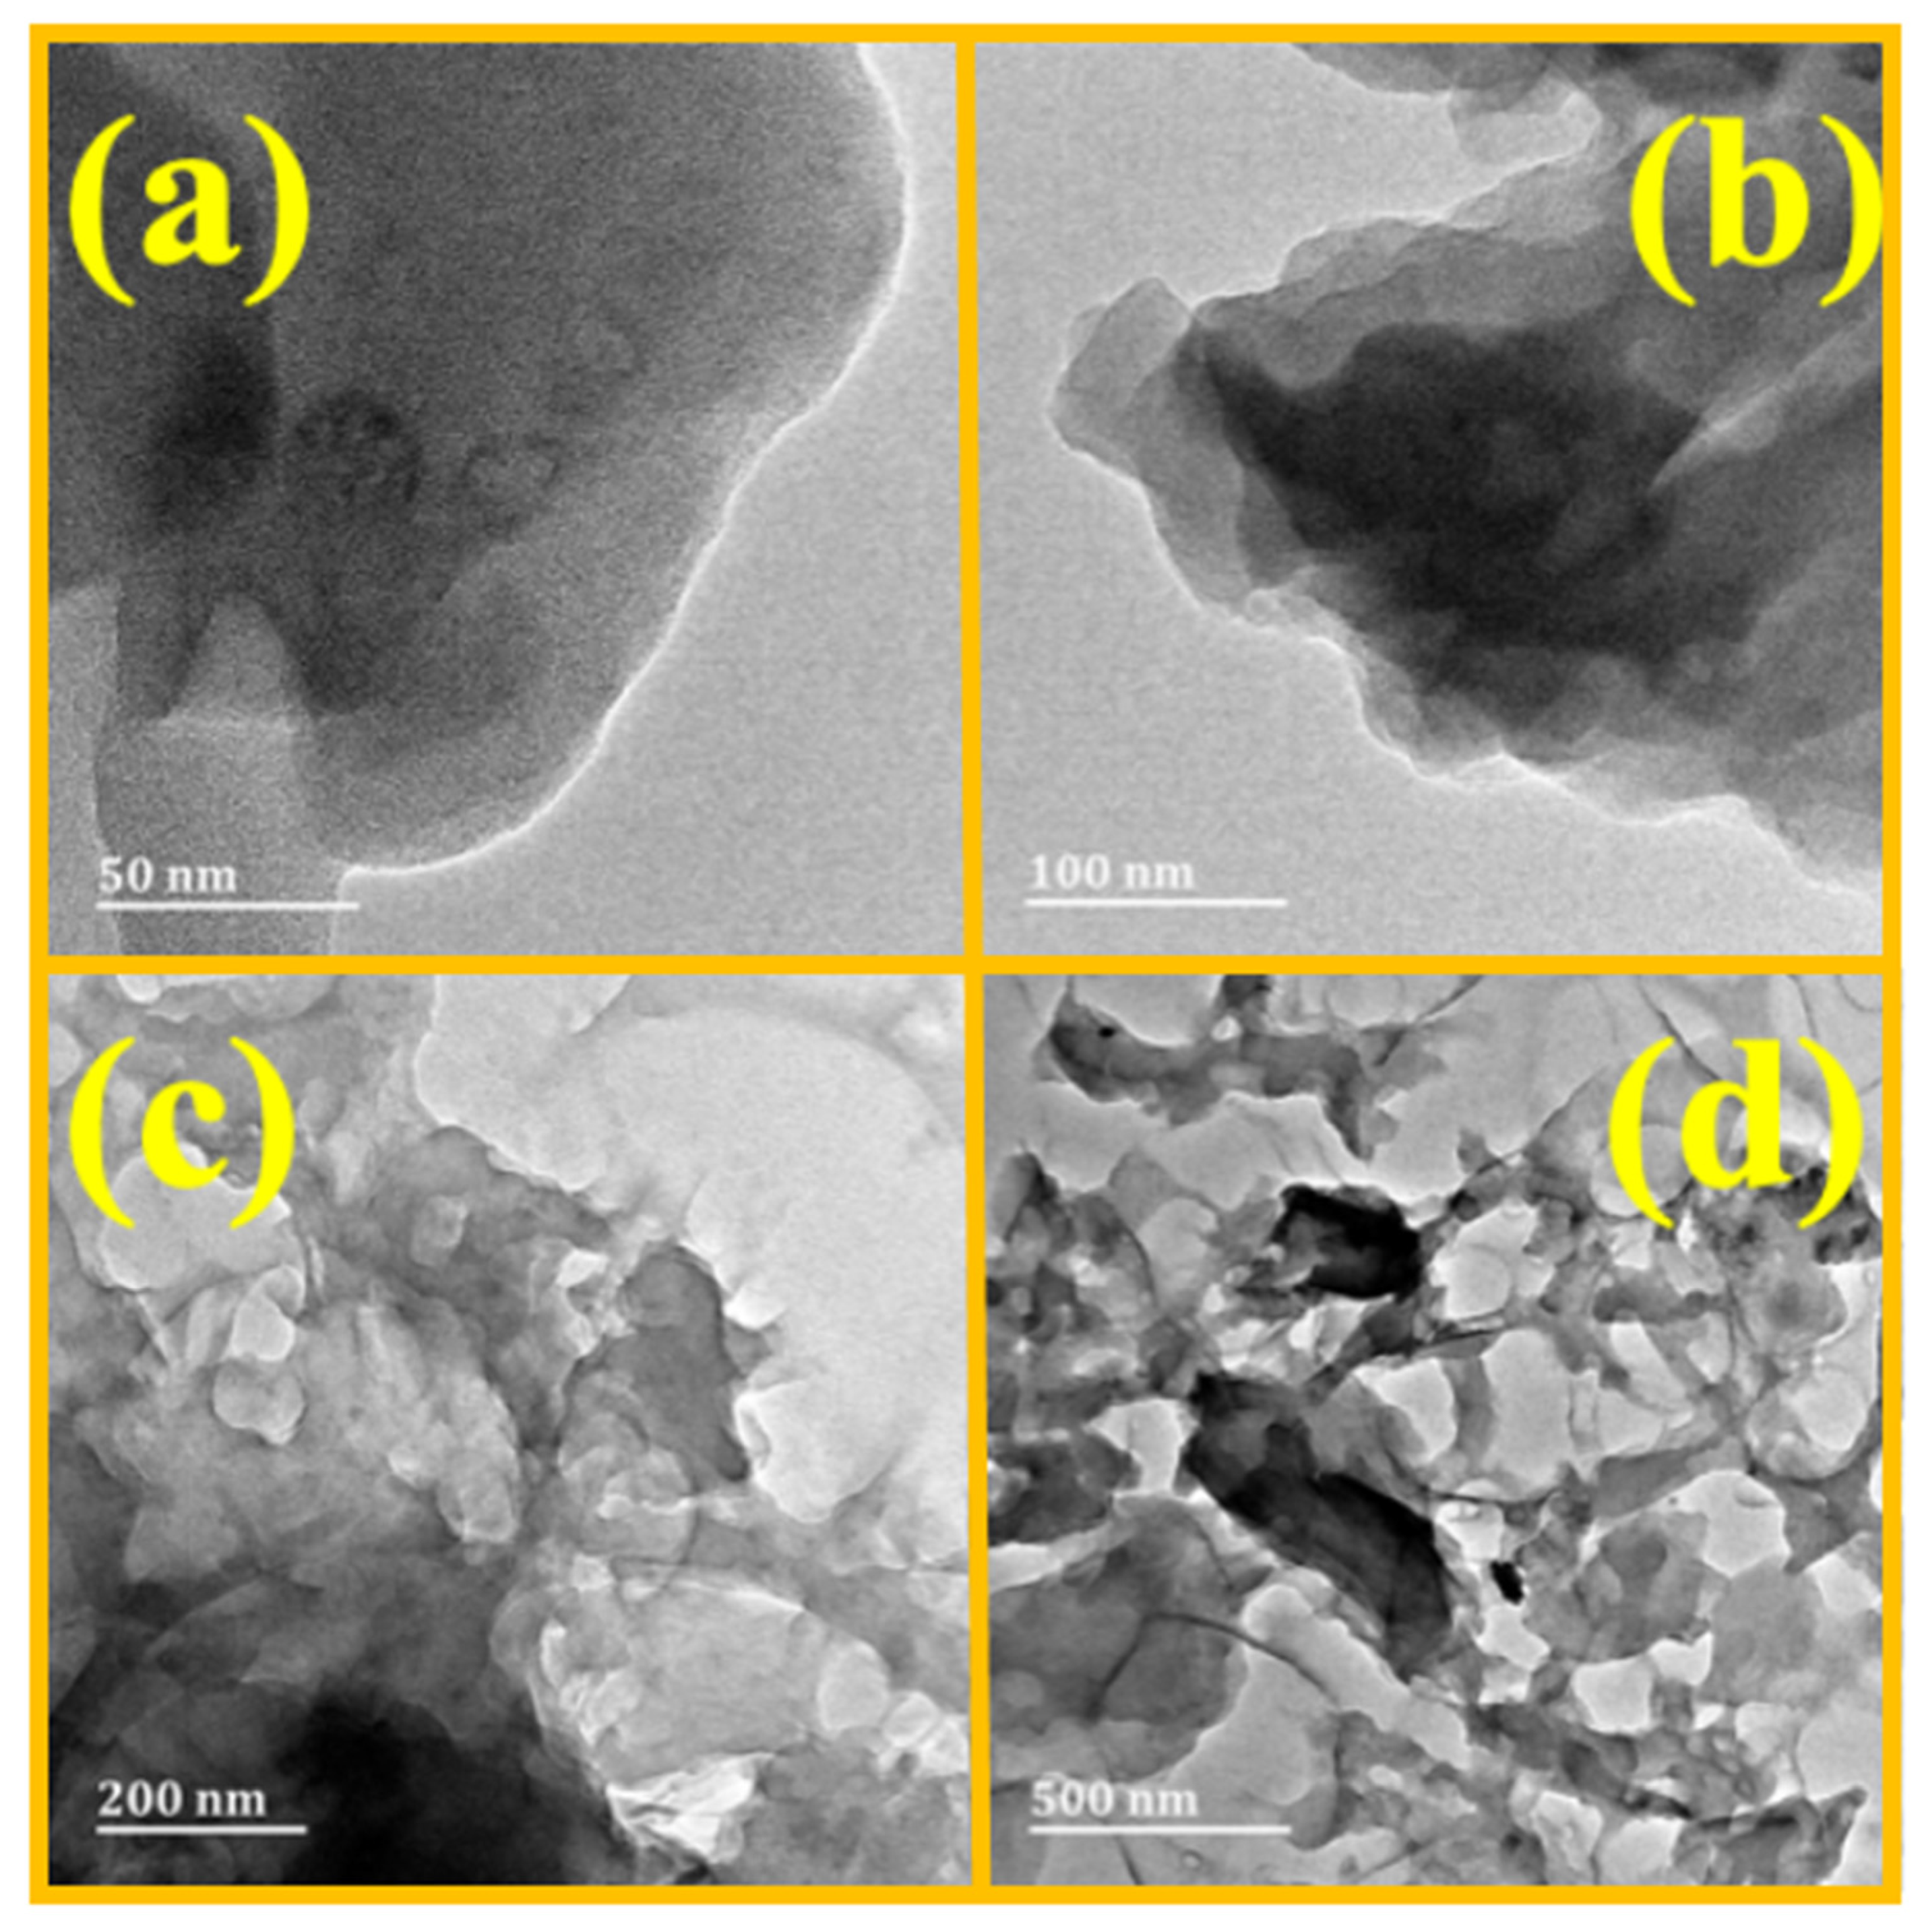
In addition, HRTEM was performed to examine the material’s morphology and topology at different magnifications, as shown in Figure 5.
Figure 5a shows a magnification of 50 nm; it was observed that the nanoparticles surrounded the nanofibers throughout the material. Figure 5b shows that at 100 nm, the networked fibers can be observed to be contained within the activated carbon. In Figure 5c,d, at magnifications of 200 and 500 nm, the presence of pores and micropores can be seen due to the agent used in the chemical treatment and the activation time. Similar observations have been made by studies using agricultural waste-activated carbon [43].
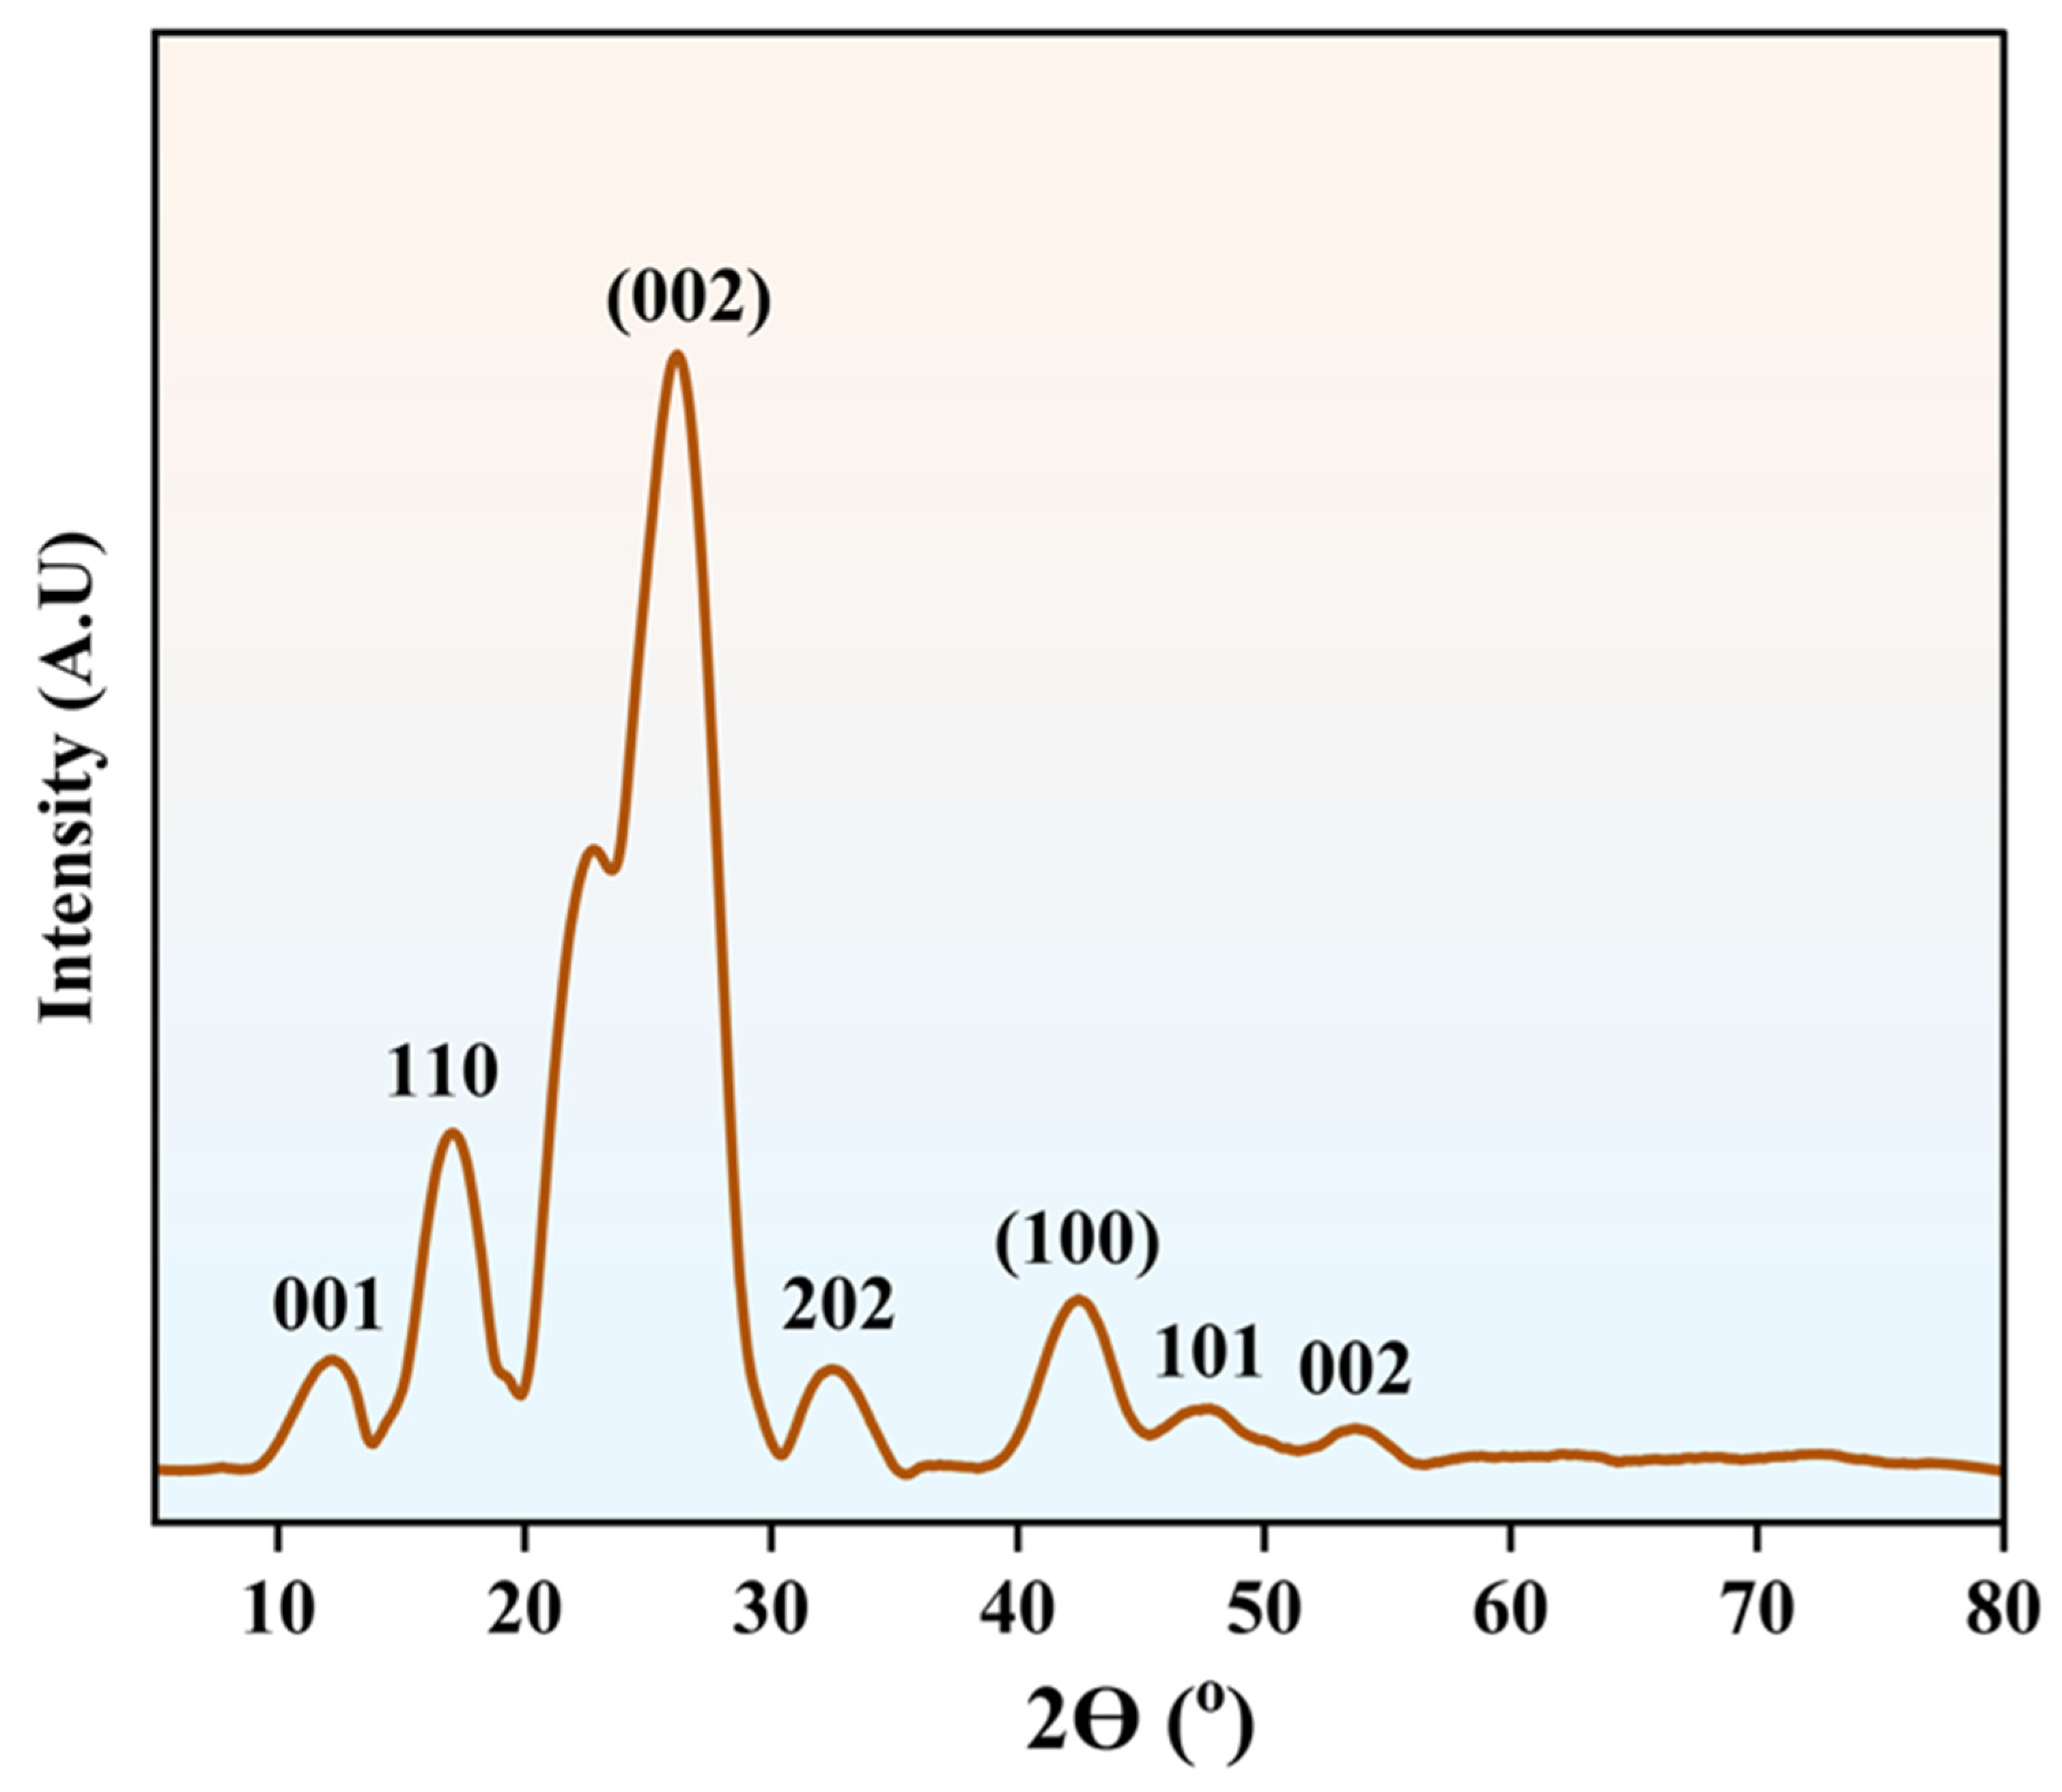
Furthermore, the XRD analysis of the MC-AC material is shown in Figure 6.
The analysis showed peaks at 2θ values of 12.8–54.2°, indicative of crystallographic, amorphous, and graphitic planes in the activated carbon. The peaks were observed to weaken, which shows the presence of surface defects on the synthesized activated carbon [44]. The surface area modification of the material is greatly influenced by the defects formed [45]. The peak at 001 is mainly due to surface activation by potassium hydroxide, which modifies the macropores; 110 normally shows carbon frameworks with a hexagonal localized form. The peaks at 101 and 002 are important for showing the lattice framework and the distribution of the amorphous phase. This shows that the material has meso- and micropores, which create a high surface area for the interacting and trapping of MNZ onto MC-AC.
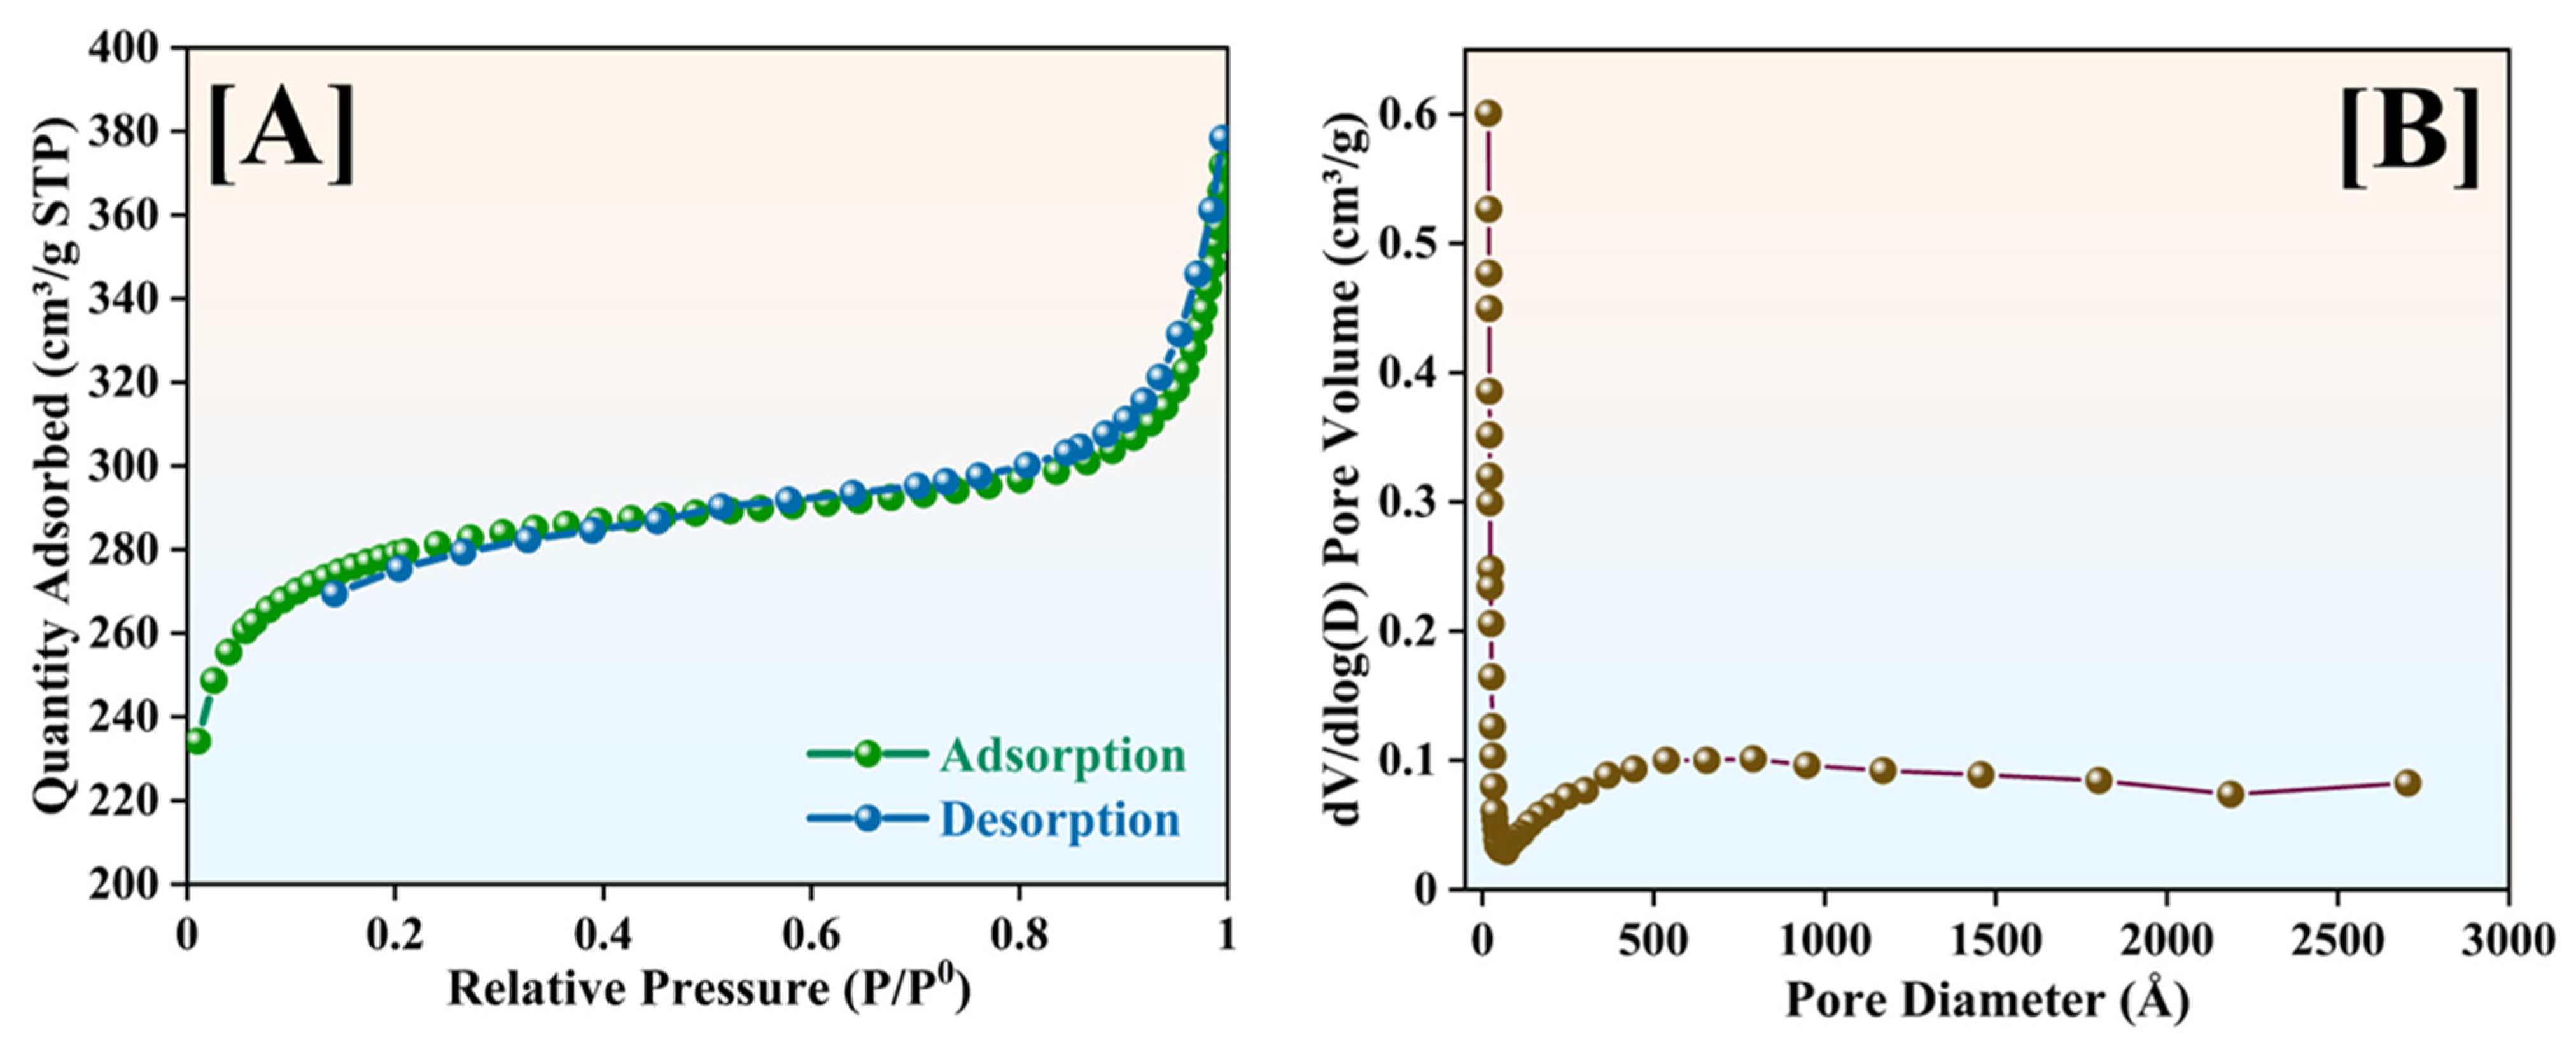
Finally, the pore size, diameter, and surface of the material were also investigated by use of the N2 physisorption isotherm, as shown in Figure 7.
Figure 7 shows the hysteresis loop, which identifies the presence of micropores, and the Type IV isotherm confirms the mesoporous structure. The pore distribution shown in the insert indicates a high intensity below 100 Å, confirming the mesoporous and microporous nature. It provides a maximum pore volume of 0.6 cm3/g, which is based on the small pore sizes. It also shows that between 500 and 3000, there were minor distributions of the mesoporous structure. The pore diameter, BET surface area, and pore volume are reported in Table 3 below.
The observed material properties from BET are in line with previous studies that have been carried out on materials that are within the nanometer range, between 0 and 100 nm [46,47]. Based on the BET parameters, the metronidazole molecule, with a dimension size of 0.45   n m × 0.70   n m × 0.85   n m , can fit well within the pores of the adsorbent through various interactions such as pore filling, electrostatic interactions, and surface interactions.

3.2. Process Parameter Optimization

The interaction between the process parameters was investigated using cubic, quadratic, two-factor (2F), and linear regression models. The statistical analysis provided the model with the highest performance, as illustrated in Table 4.
A p-value below 0.05 indicates that the quadratic equation optimized the process (Table 4). In addition, the adjusted R and R were high for the quadratic model, with values above 0.90 and 0.72, respectively. The lack of fit is normally due to the model terms, which is consistent with the model being a good fit.

3.3. Quadratic Model Based on ANOVA Studies

ANOVA was performed on the process variables used to remove MNZ from water. The studies show the analysis of the four variables—dosage, concentration, time, and pH—that were used to choose the quadratic model. This is important in understanding statistical differences and parameter significance of the model under investigation. The ANOVA studies for the relationship between process parameters are described in Table 5.
The performance of the quadratic model in removing MNZ from water was evaluated using the indicators of lack of fit, p-values, and F-values, as shown in Table 5. In so doing, ANOVA also demonstrated other components such as MS, SS, and DF. The significance of this was initially validated by the probability value > F. The statistical significance was indicated by an F-value of 19.77, suggesting that the observed value is unlikely to be due to random variation rather than noise. Table 5 shows that the input variables A, B, C, D, and BD were significant for the model, while the remaining variables were not.

3.4. 3D Surface Plots

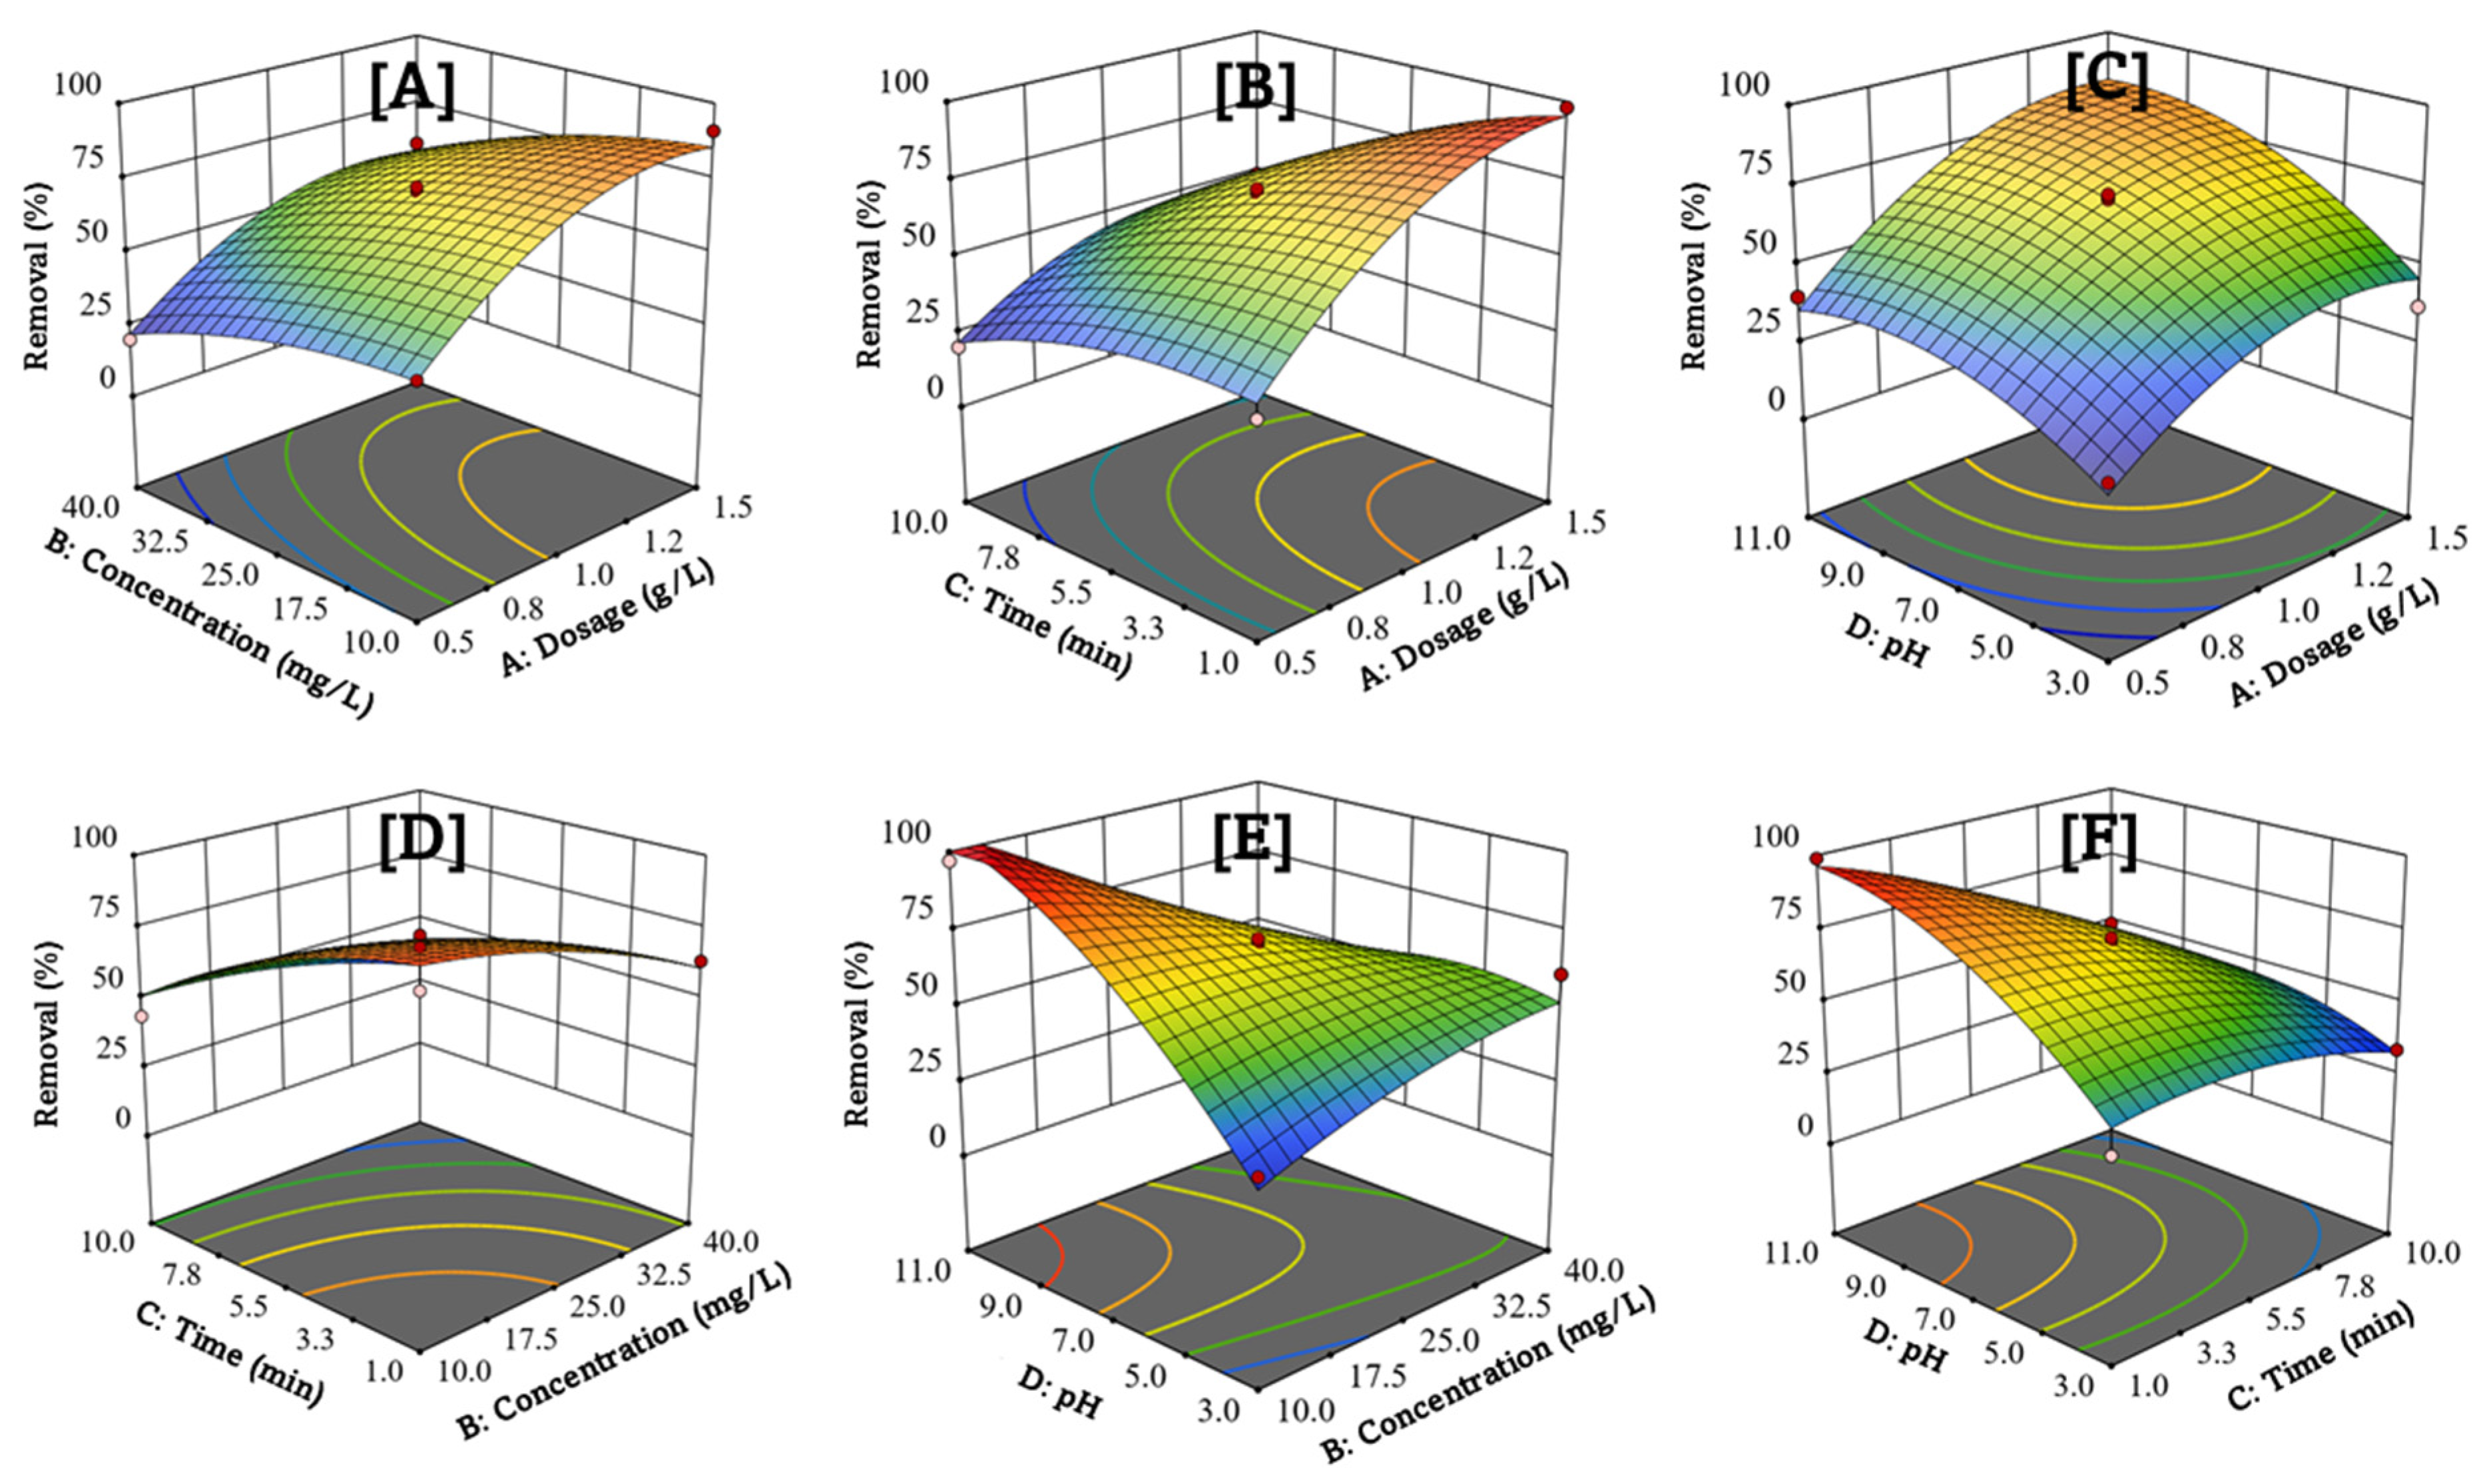
Surface plots were used to understand the relationships among the four process variables and the response, based on a second-order polynomial expression fitted to the experimental runs. The three-dimensional plot clearly shows the interactions among dosage, time, concentration, and pH in the removal of MNZ from water (Figure 8).
Figure 8A shows the effect of concentration and dosage, and it was observed that the efficiency increased. The increase is attributed to the presence of several functional groups and the surface area of the synthesized maize cob-activated carbon. The relationship between dosage and pH is illustrated by Figure 8B. The increase in acidic conditions and mass provides a positive correlation with removal efficiency; however, at alkaline pH, it decreases due to deprotonation by hydroxide ions. Figure 8C shows that the interaction between pH and concentration exhibits a negative correlation, with efficiency decreasing. Figure 8D shows the relationship between time and concentration, where there is an increase in removal as the time of contact with the adsorbent increases and as strong interactive forces develop with the functional groups and the adsorbate molecules, which correlate positively. Figure 8E shows that the removal efficiency increases with time and with variations in dosage. This is because the adsorbate molecules spend more time on the adsorbent’s binding sites, leading to a high removal efficiency. Finally, the interaction between pH and time results were increased, as shown in Figure 8F. The rapid increase can be due to the acidic conditions, which create a high proton concentration, and to the long time spent on the adsorbent surface, which generates a strong bond between the adsorbate and the adsorbent, thereby accounting for the observed removal. The observations from the three-dimensional surface plots are consistent with previous studies on the removal of pharmaceuticals from water [48,49,50].

3.5. 2D Contour Plots

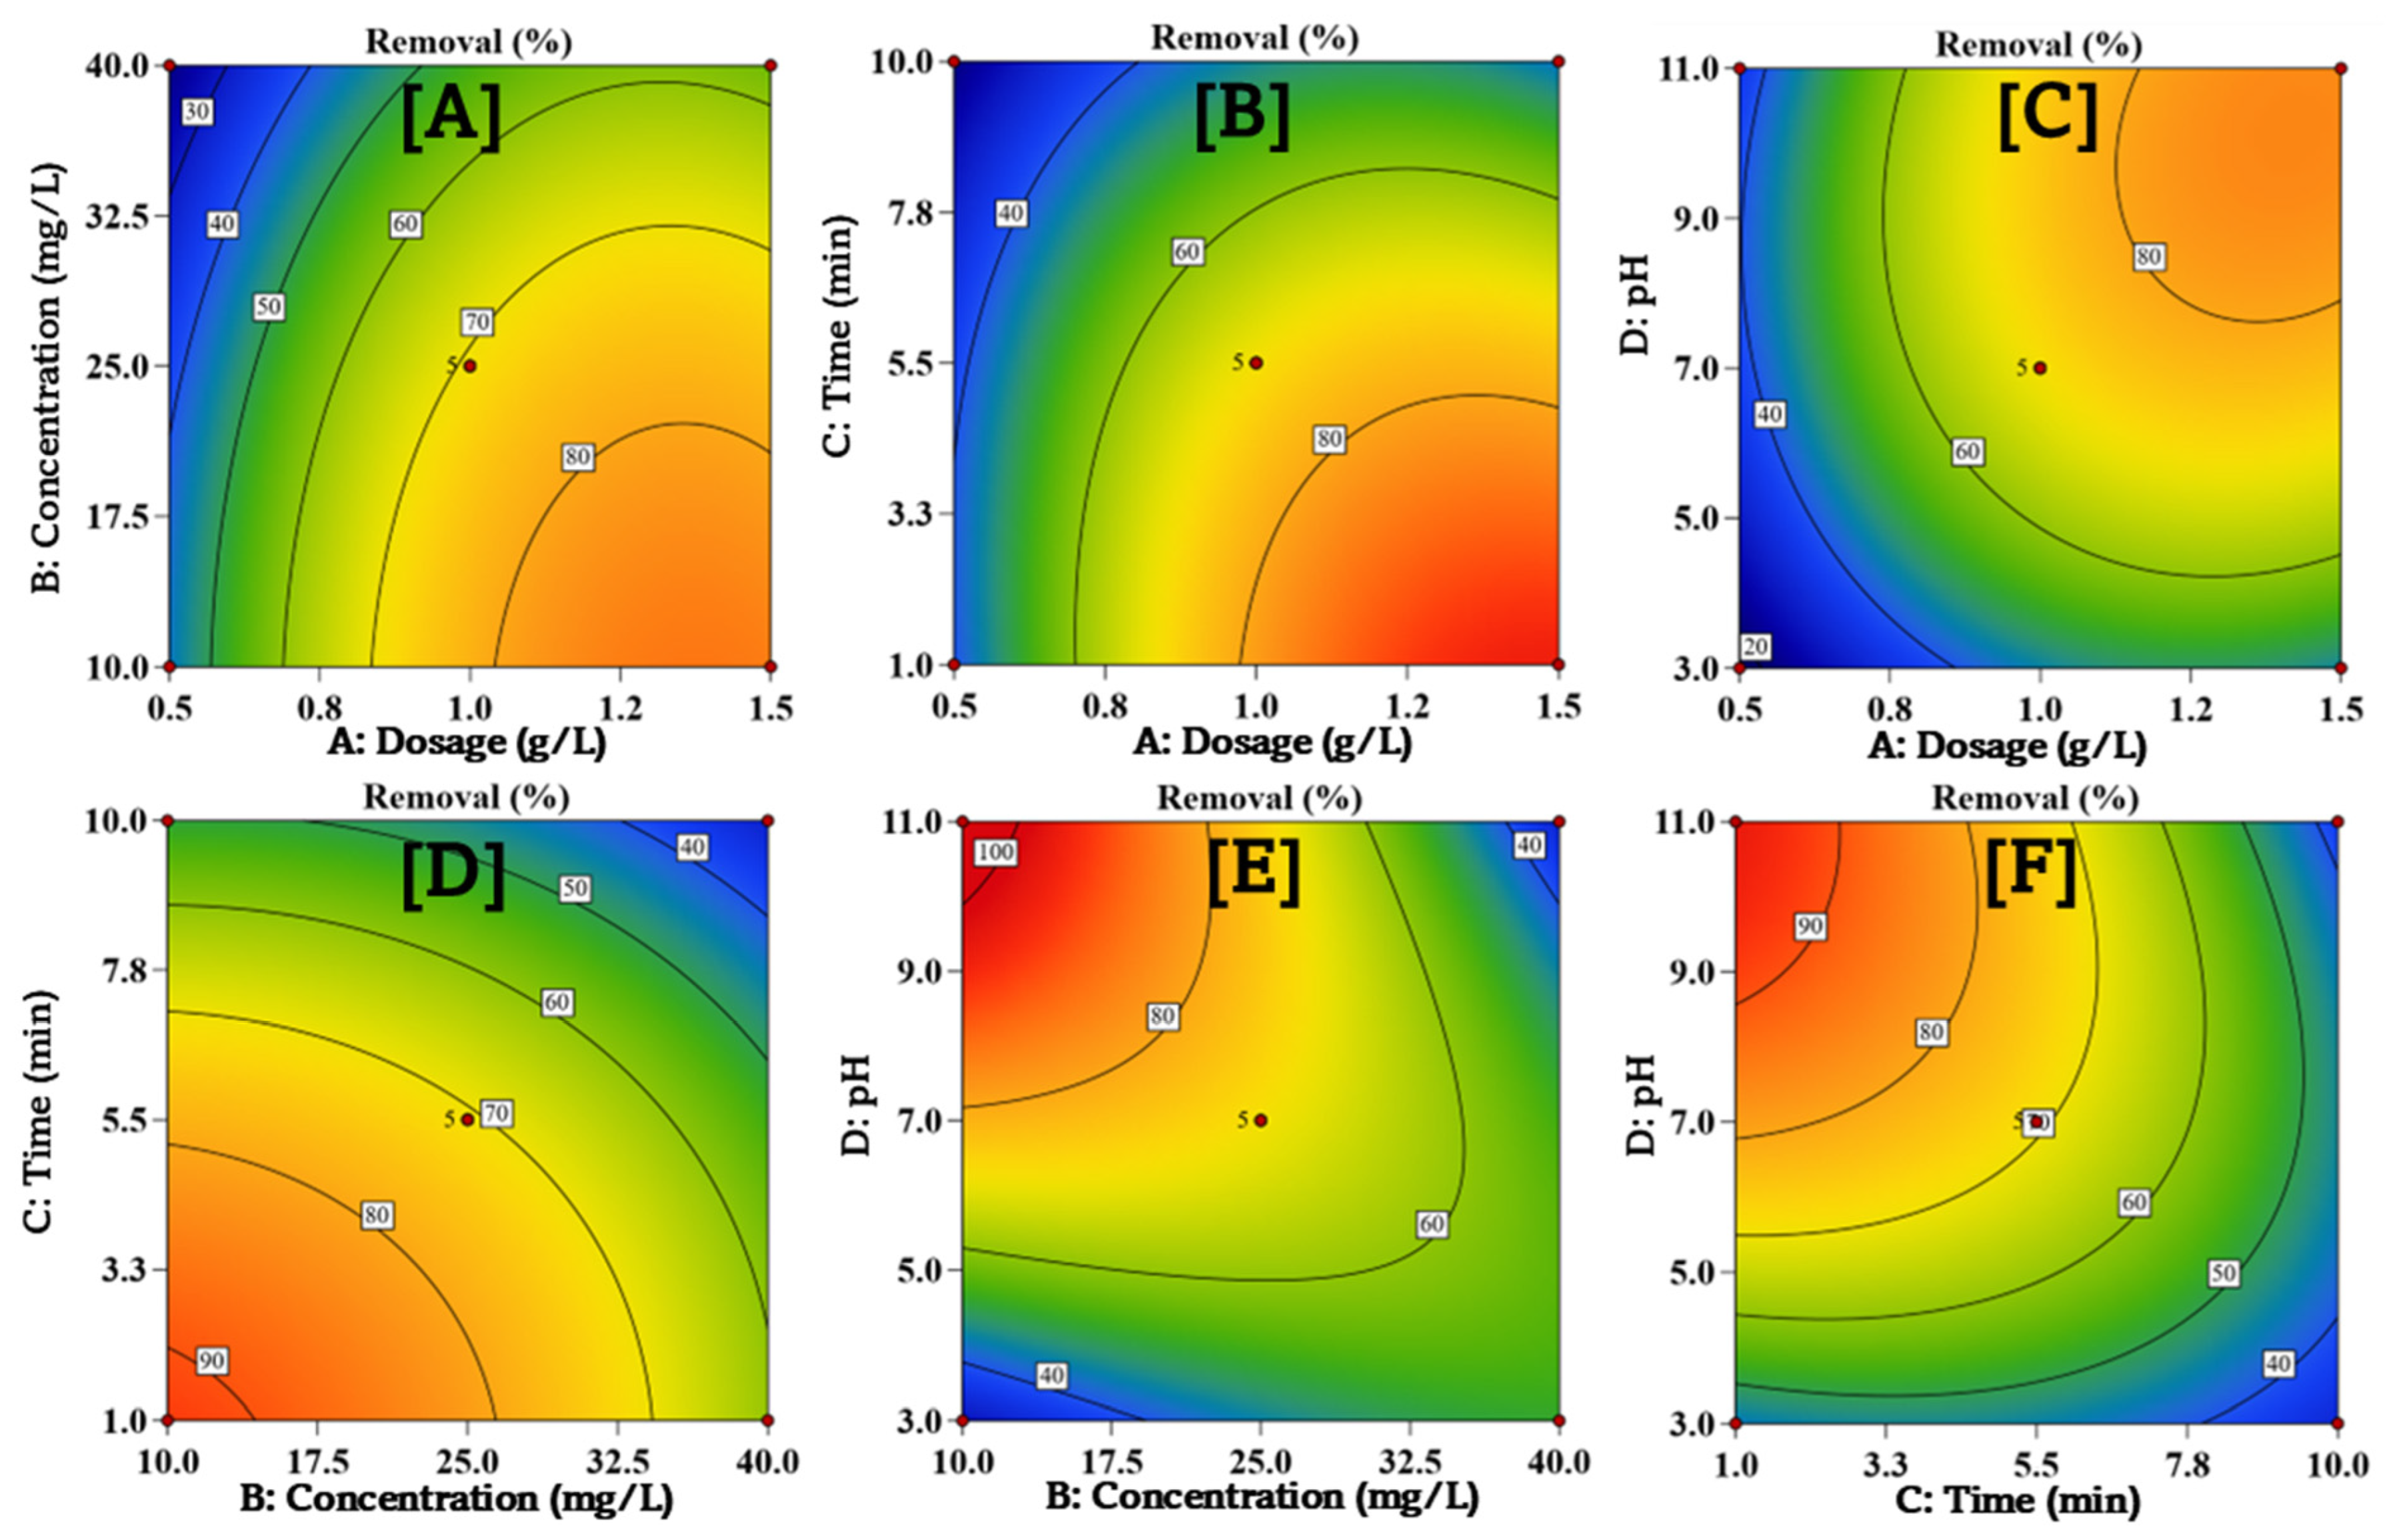
Contour plots are used to visualize the relationship between two independent parameters and are generated from a second-order polynomial equation, as shown in Figure 9.
The explainable geometry from the two-dimensional plots shows a relationship between the variables, which are responsible for the observed response [51]. In this analysis, the process parameters are used to form a contour structure that is based on a design stage [52]. It is worth mentioning that the design boundaries are fundamental in understanding the removal of metronidazole from water, through offering insights into the adsorption process [53,54,55]. The two-dimensional contour plots are extremely crucial in determining the relationship and importance of the interactive effects of the input parameters, as they elaborate more on the adsorption [56]. The explanation of the two-dimensional contour plots is understood based on the nature of the contours, in which the elliptical nature shows the significance of the effects, while a circular form indicates that the parameters are not important when it comes to describing the removal of MNZ from water [57,58,59]. Therefore, it provides an analysis of the interaction between the process parameters by observing the elliptical structure of the contour plots, which offers a much clearer explanation of the relationship between the adsorbate and adsorbent. In conclusion, the two-dimensional contour plots indicate that the greatest MNZ adsorption occurs at the lower boundaries of the plots.

3.6. Run Number, Box–Cox, Experimental, Actual, and Residual Values

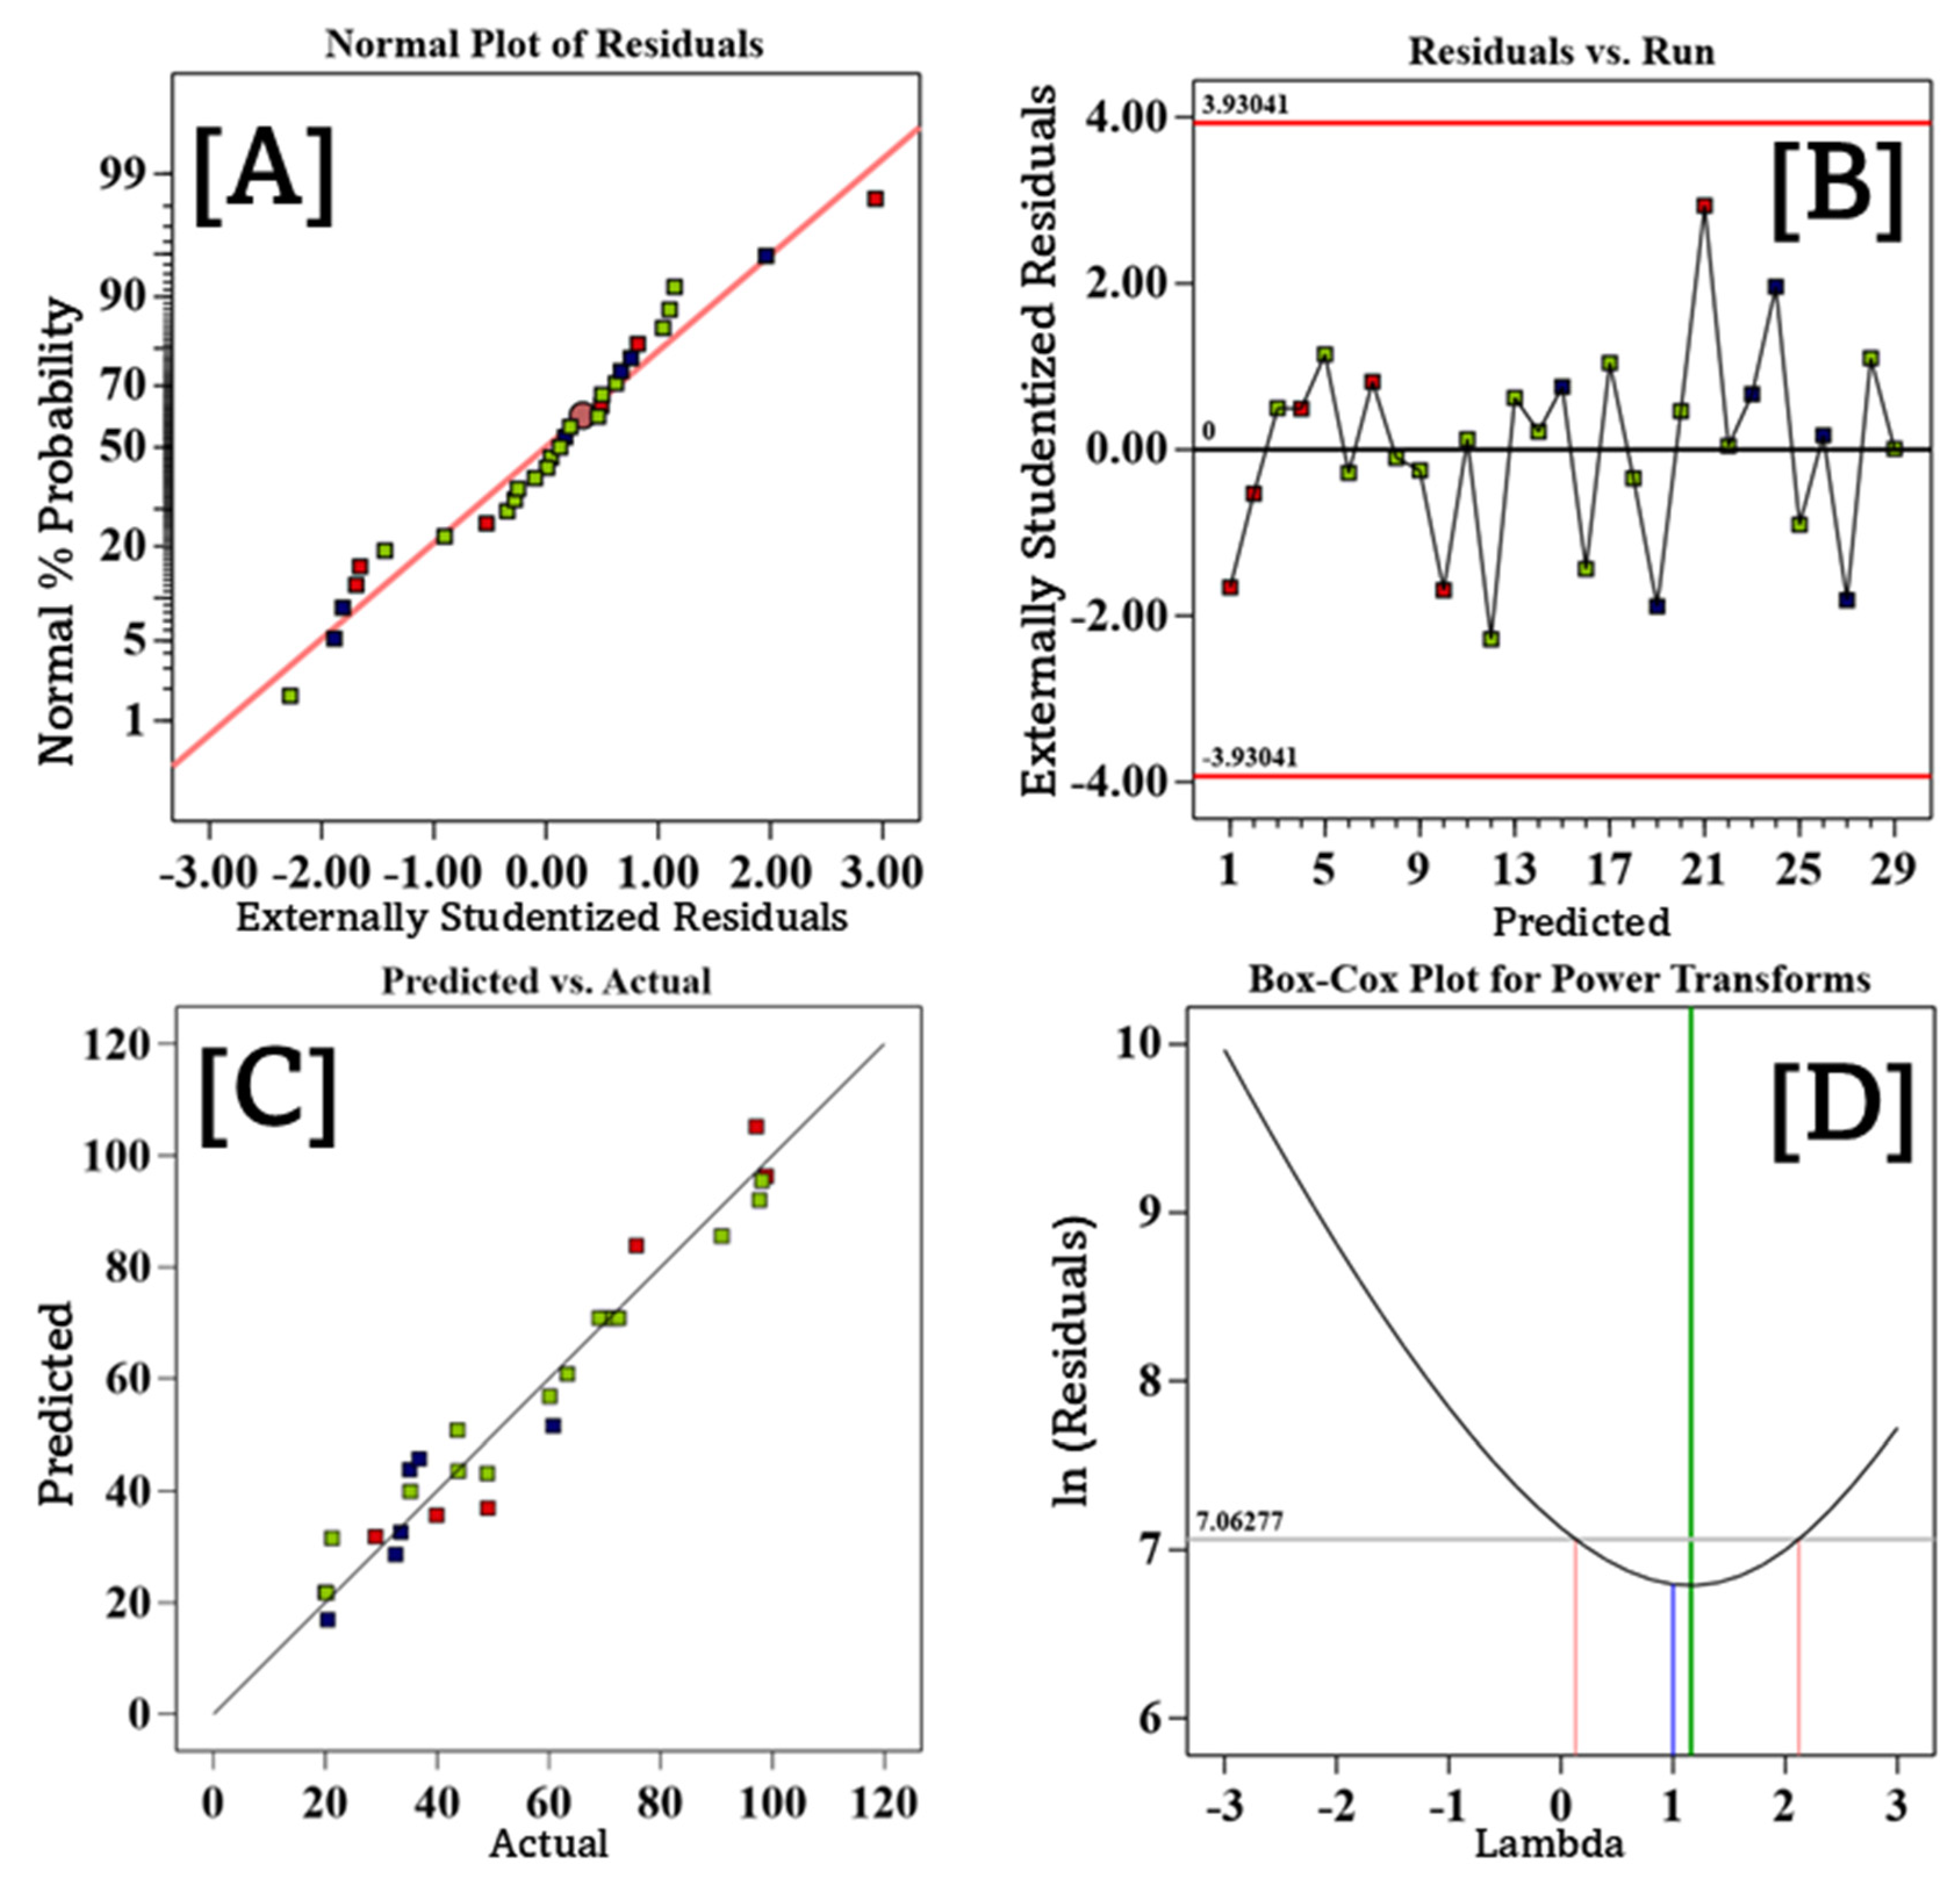
The run number, Box–Cox, experimental, actual, and residual values are illustrated in Figure 10.
Figure 10A shows the normal plot of residuals against externally studentized residuals, which clearly indicates a normal distribution. This indicates that the predicted and experimental data correlate well, forming a strong relationship. Figure 10B shows a small change due to the alignment values predicted on the residual of the studentized analysis [60,61,62,63]. From this, the residuals provide information about the model’s validity. Figure 10C illustrates the linearity between the experimental and predicted values, with minimal diagonal deviations. The Box–Cox with a lambda near 1 provides an understanding of no data transformation, and this can be seen in Figure 10D [64,65,66].
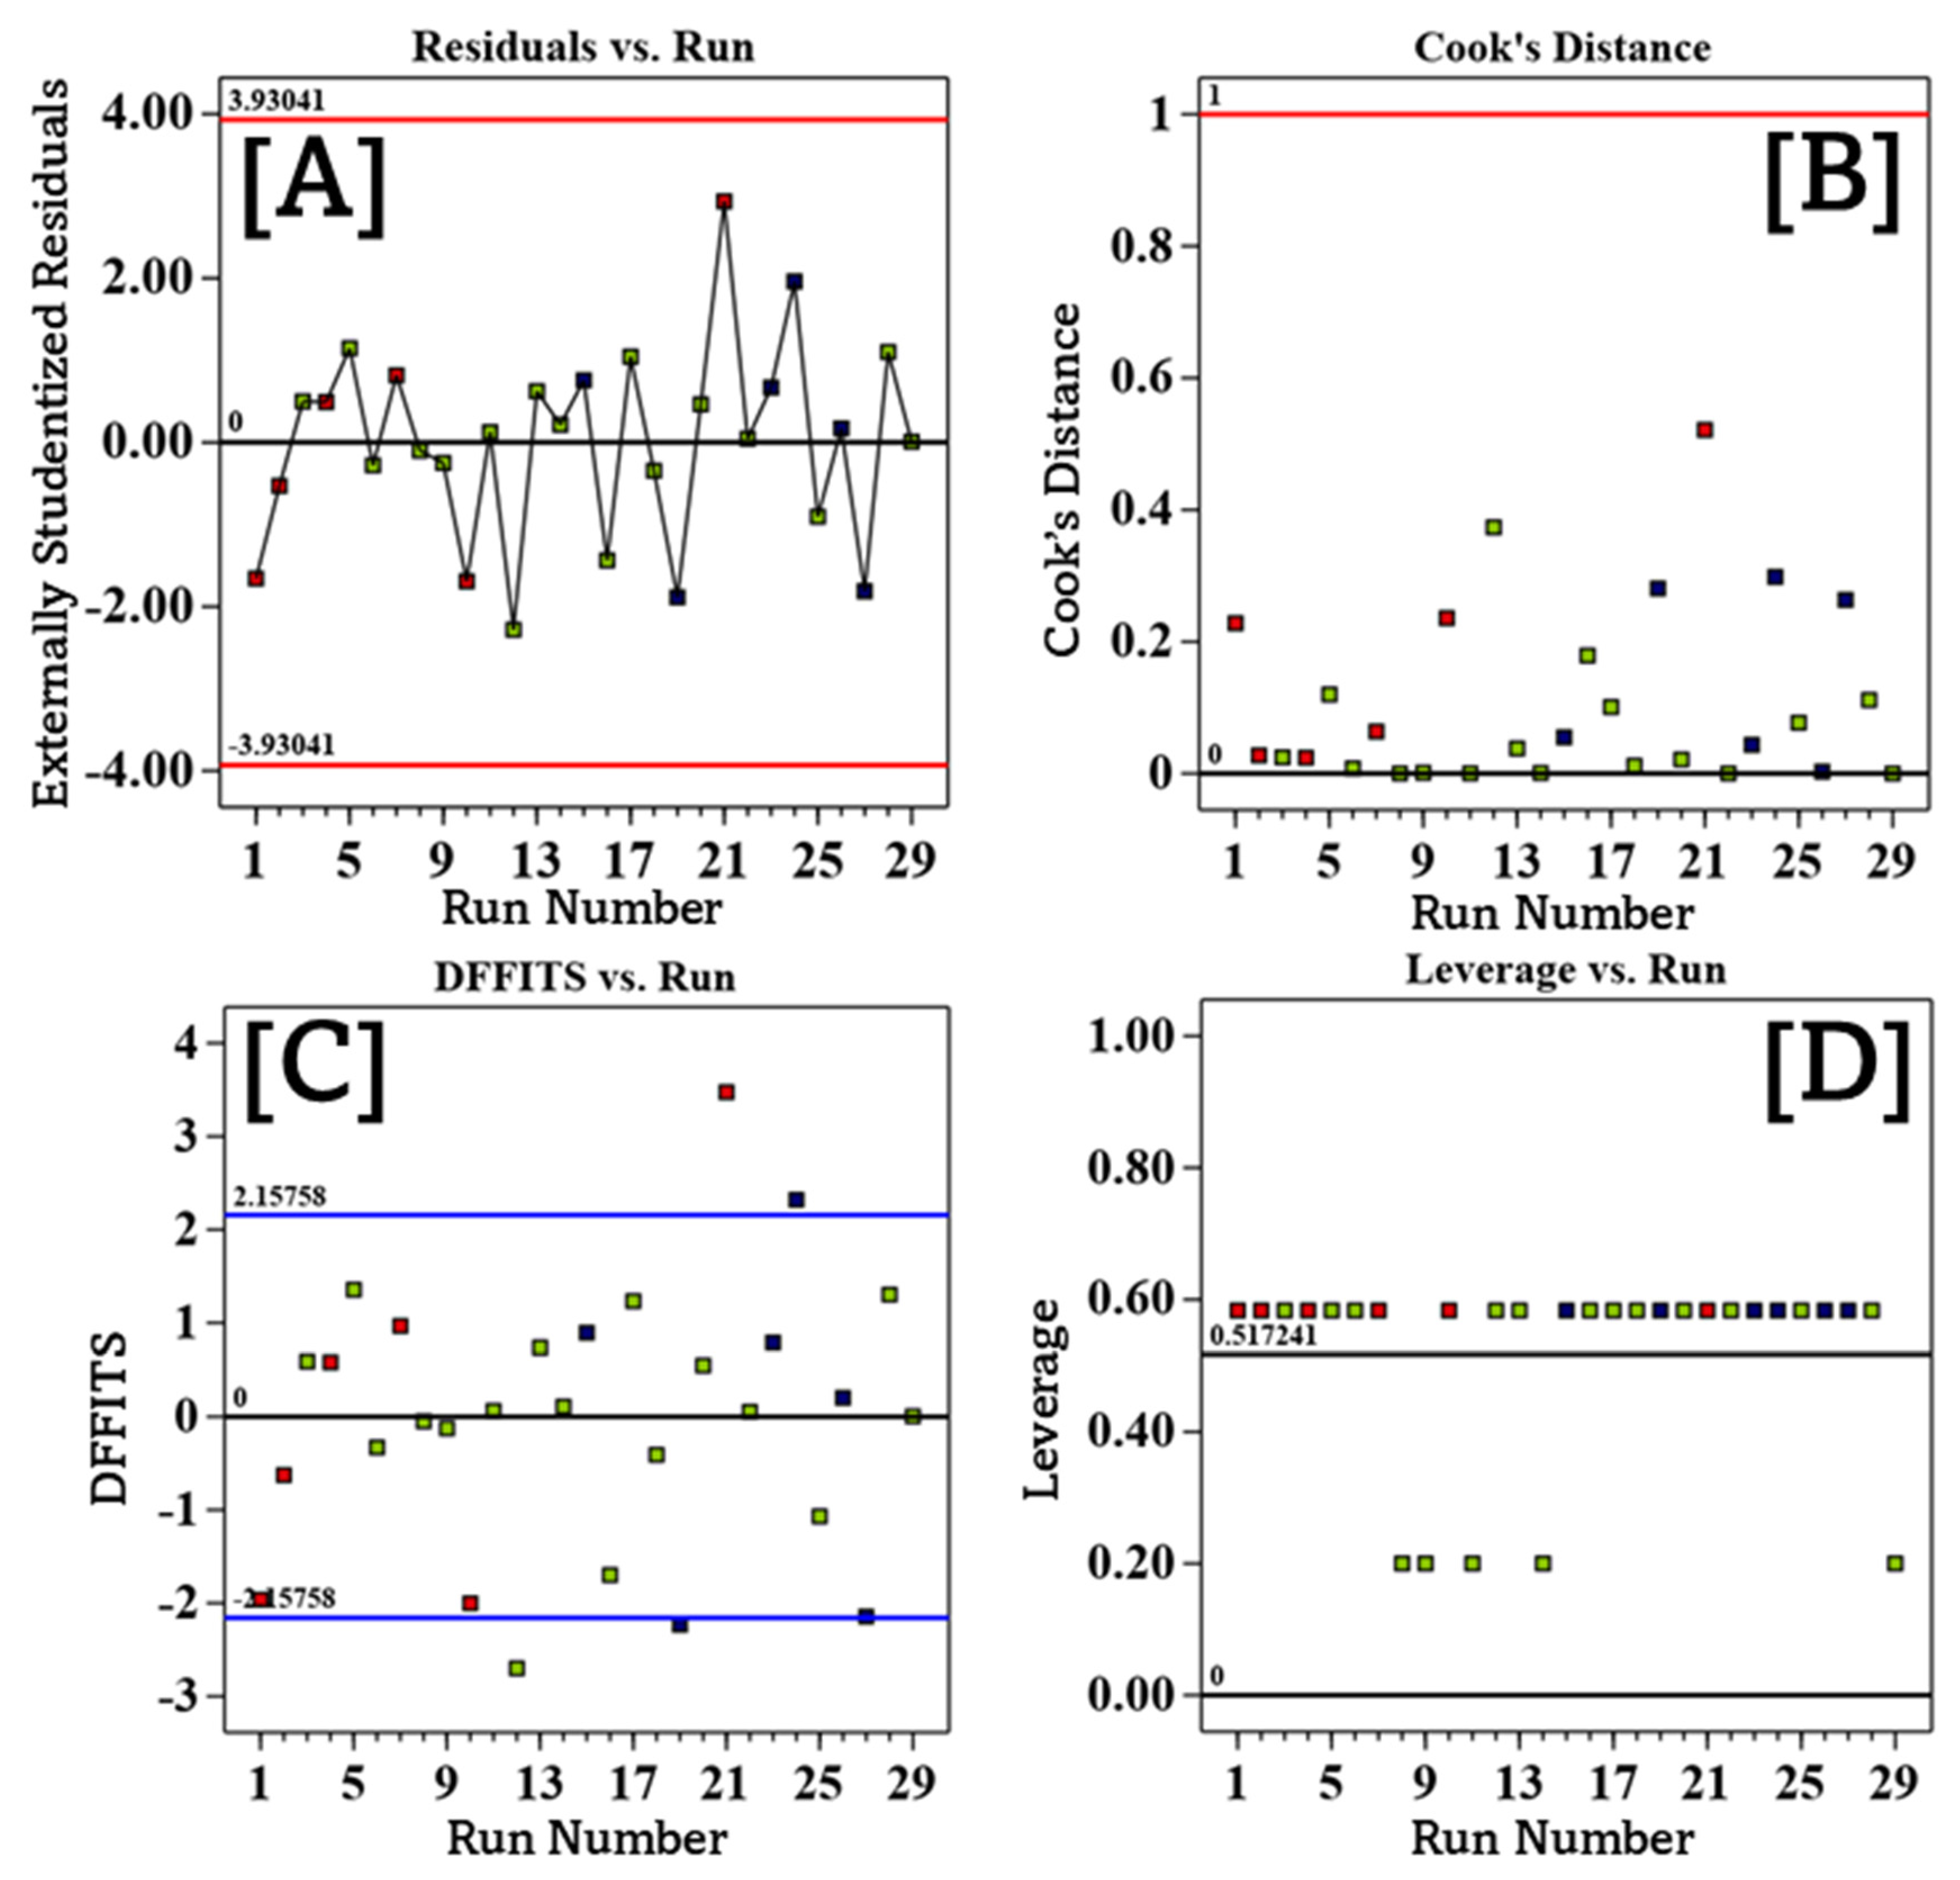
Figure 11 shows the plots of residuals, Cook’s distance, and DFFITS against the run number.
Figure 11A illustrates the relationship between the run number and residuals, which explains the clarity in model strength based on the minimal deviations from the zero mark [67,68]. Figure 11B shows Cook’s distance values that are less than 0.2. This shows that the adsorbent works effectively, since all of the data points were in the acceptable range [69]. Figure 11C shows that the DFFITS plot has an adjustable range within which all data points lie, ensuring the model’s reliability. The plot clearly points to the interaction between variables on the predicted outcome [70]. Furthermore, the effect on the parameters was investigated through the leverage plot, and it was observed that the data were within the mean leverage, as illustrated in Figure 11D [71].

3.7. Kinetic Studies for the Adsorption of MNZ

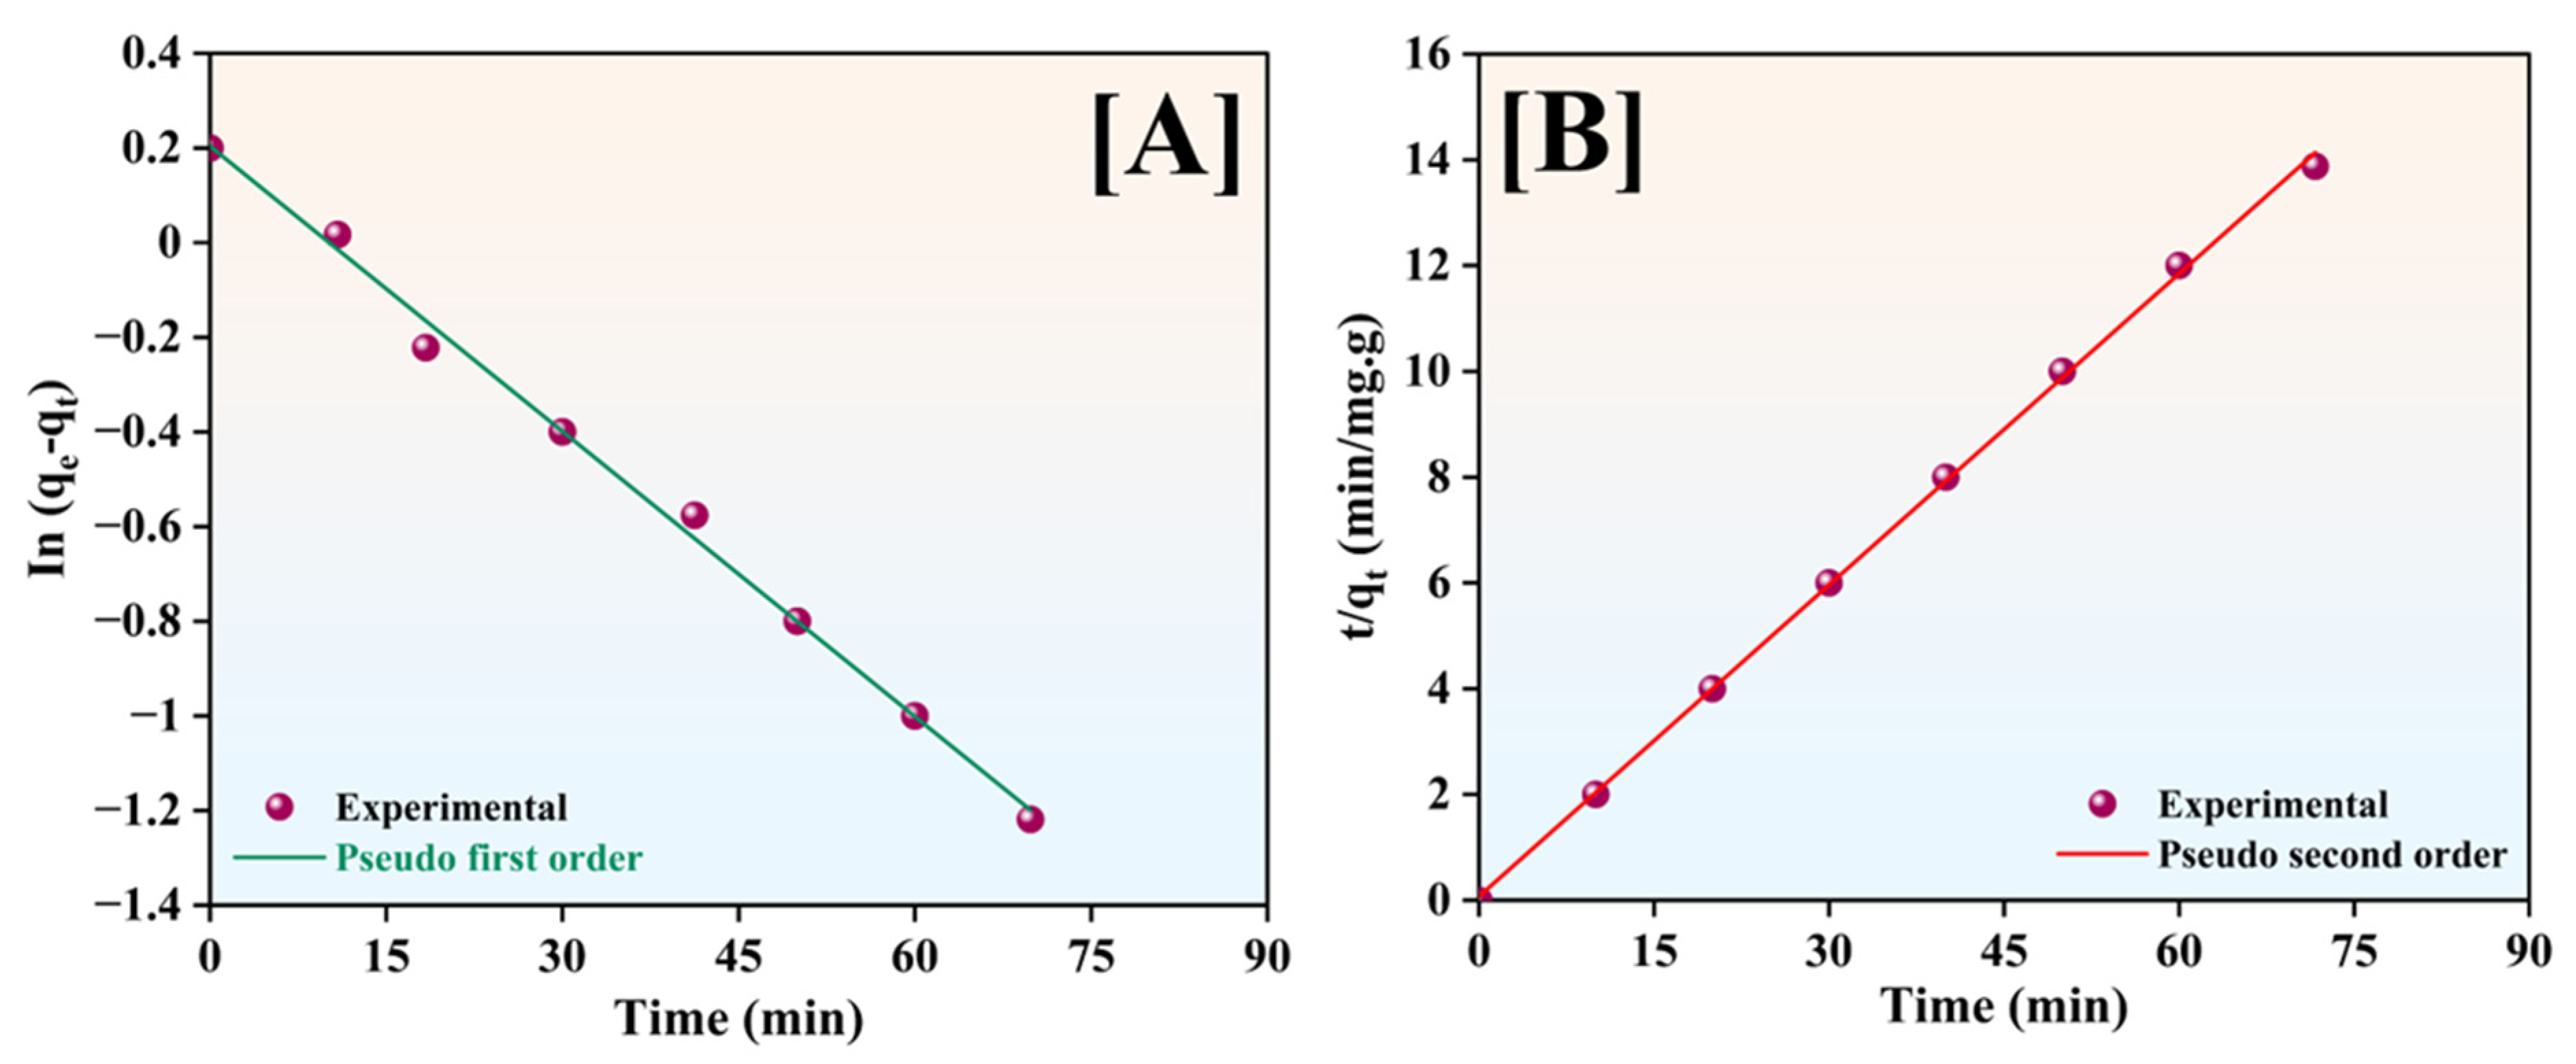
The kinetic models were plotted using linear and non-linear relationships to obtain an insight into the adsorption mechanism. The adsorption mechanisms were based on two kinetic models: the pseudo-first-order and pseudo-second-order, as shown in Figure 12A,B.
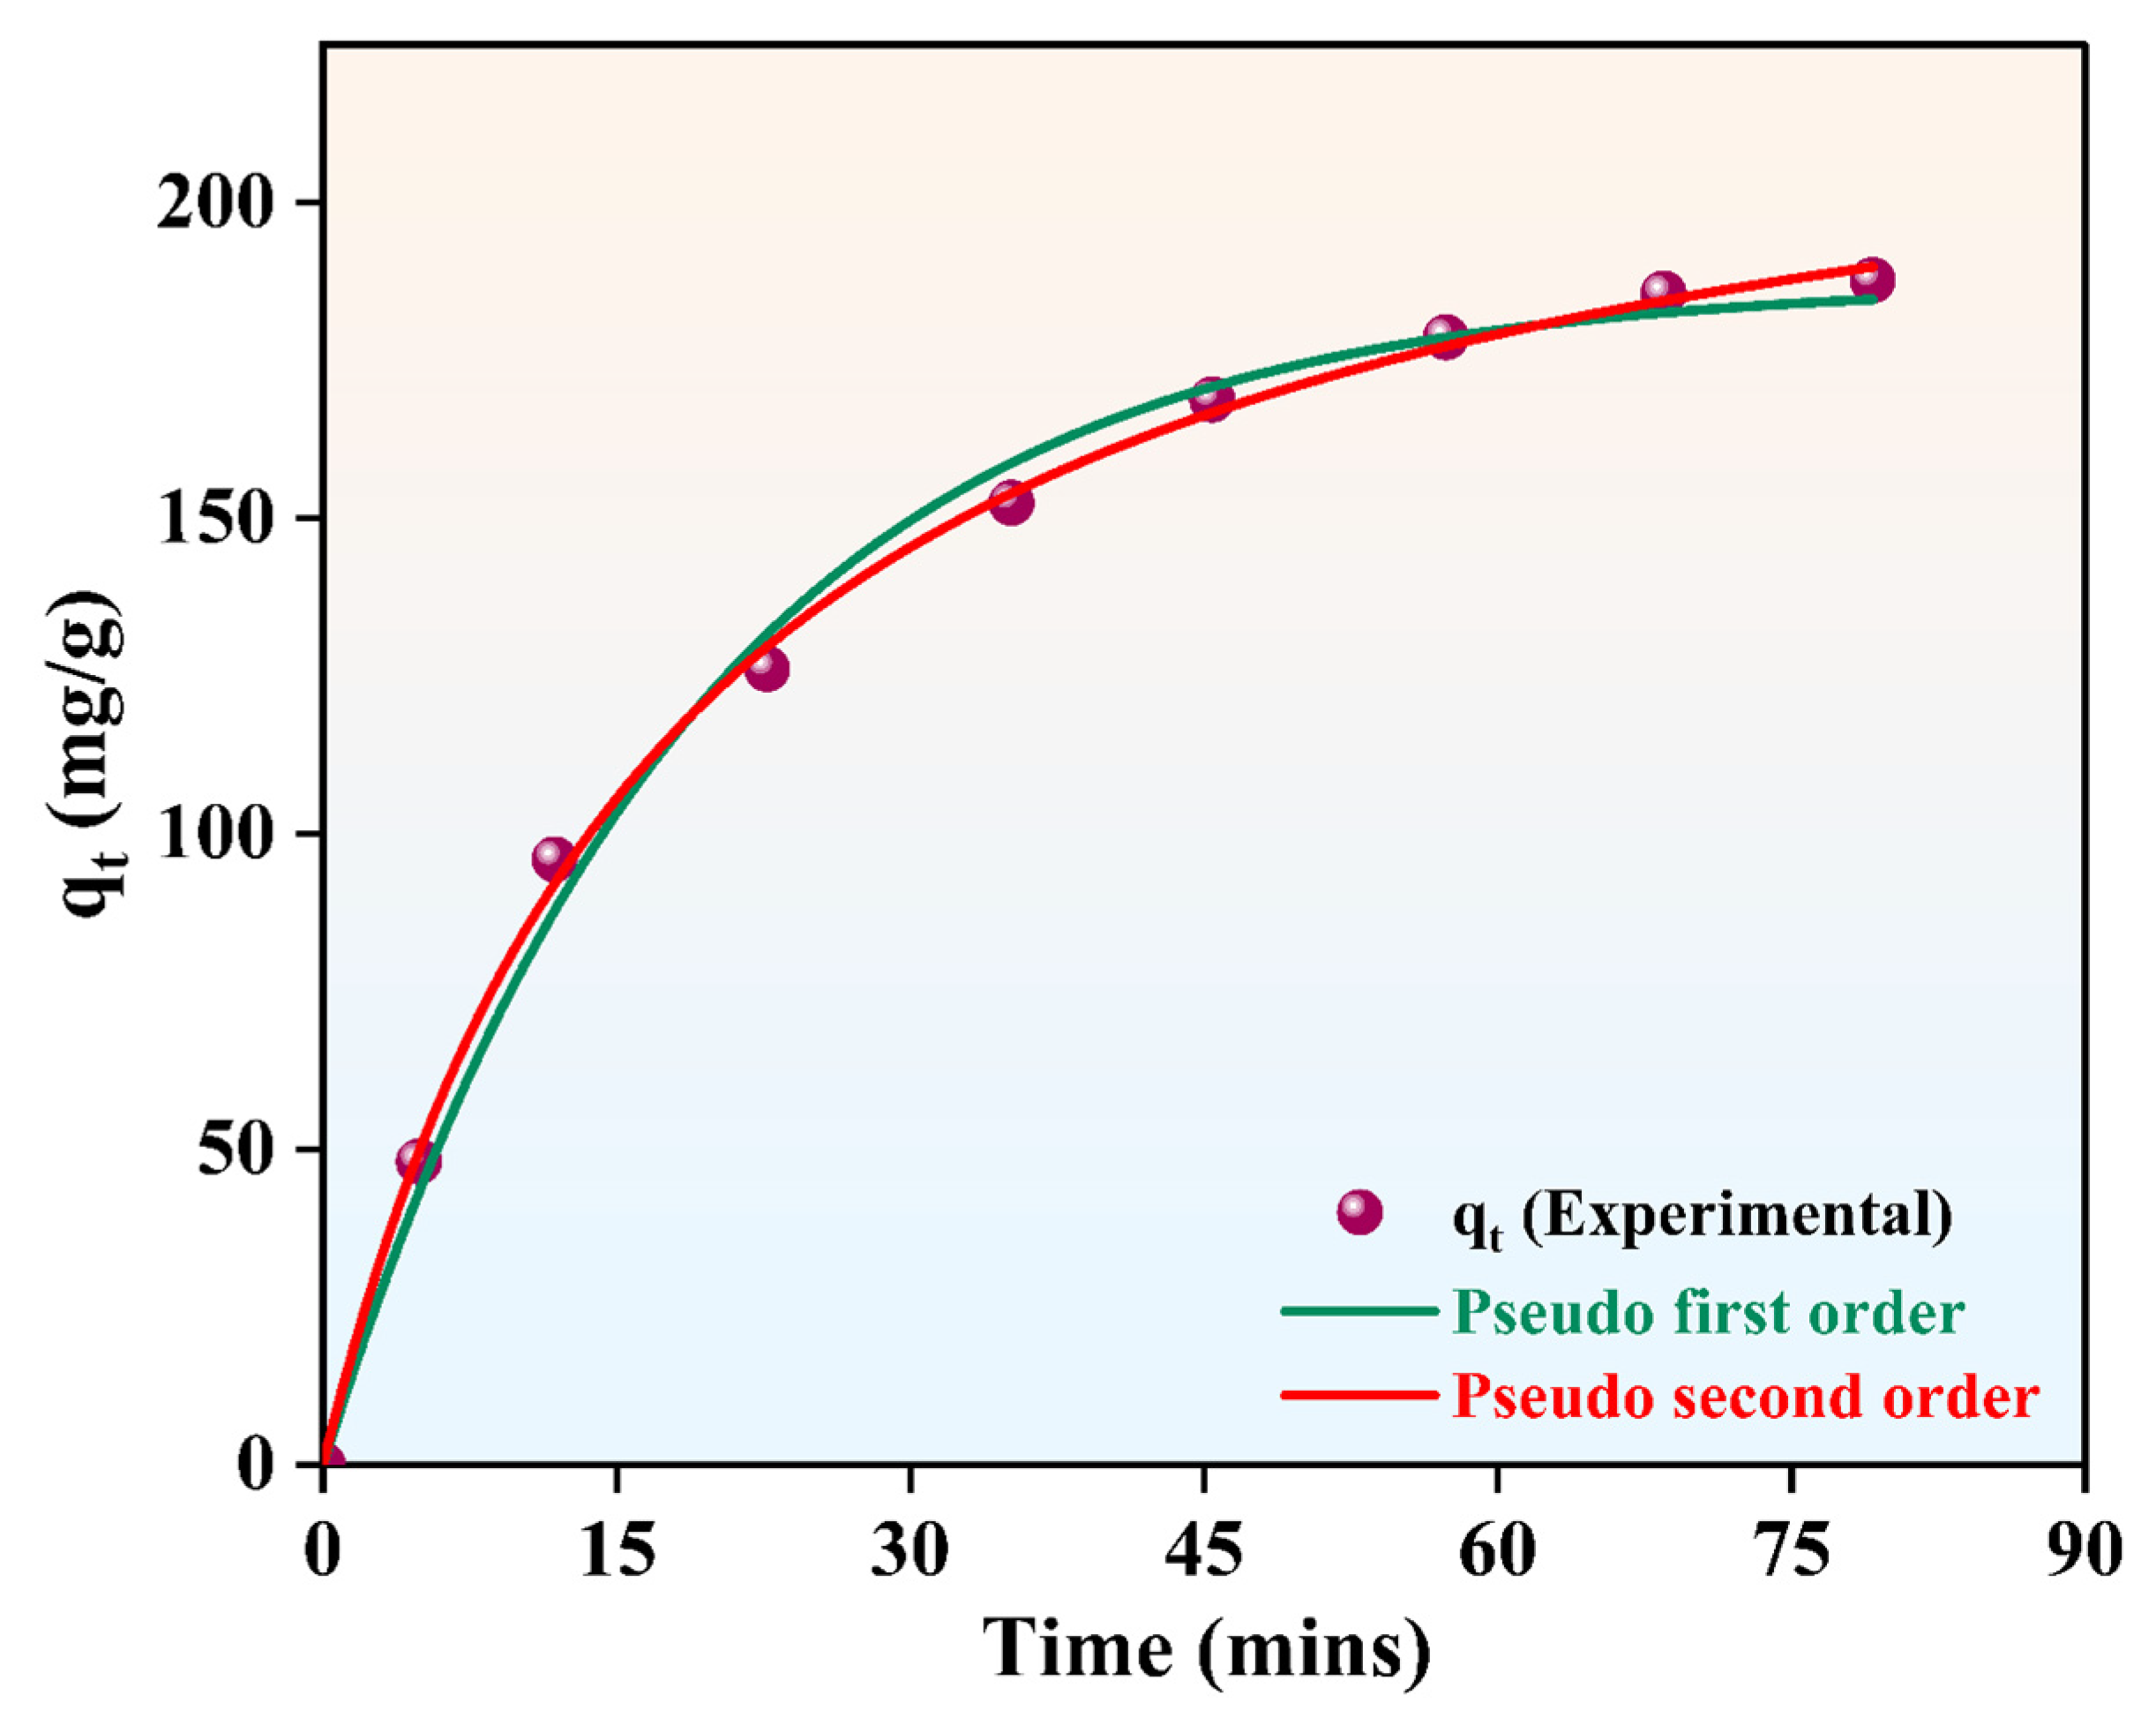
In addition, a non-linear plot of both the pseudo-first-order and pseudo-second-order models was generated to better understand the relationship between the adsorbate and the adsorbent. Non-linear expressions better relate complex parameters with less bias than linear forms. Figure 13 shows the non-linear forms of the kinetic models.
The two models were compared to determine which best explains the adsorption mechanism. Table 6 compares the pseudo-first-order and pseudo-second-order kinetic models.
Table 6 shows that both PFO and PSO models had high correlation coefficients (R2 > 0.96). Therefore, the adsorption mechanism involved both chemisorption and physisorption. The non-linear pseudo-second-order kinetic model yielded an R2 value of 0.9809, suggesting that the dominant mechanism was chemisorption, driven by strong electrostatic and hydrogen bonding between the adsorbent surface and adsorbate, which is created by the hydroxyl, carbonyl, and nitro groups. The study therefore shows that the non-linear kinetic models both describe the adsorption process.

3.8. Isotherms, Both Linear and Non-Linear

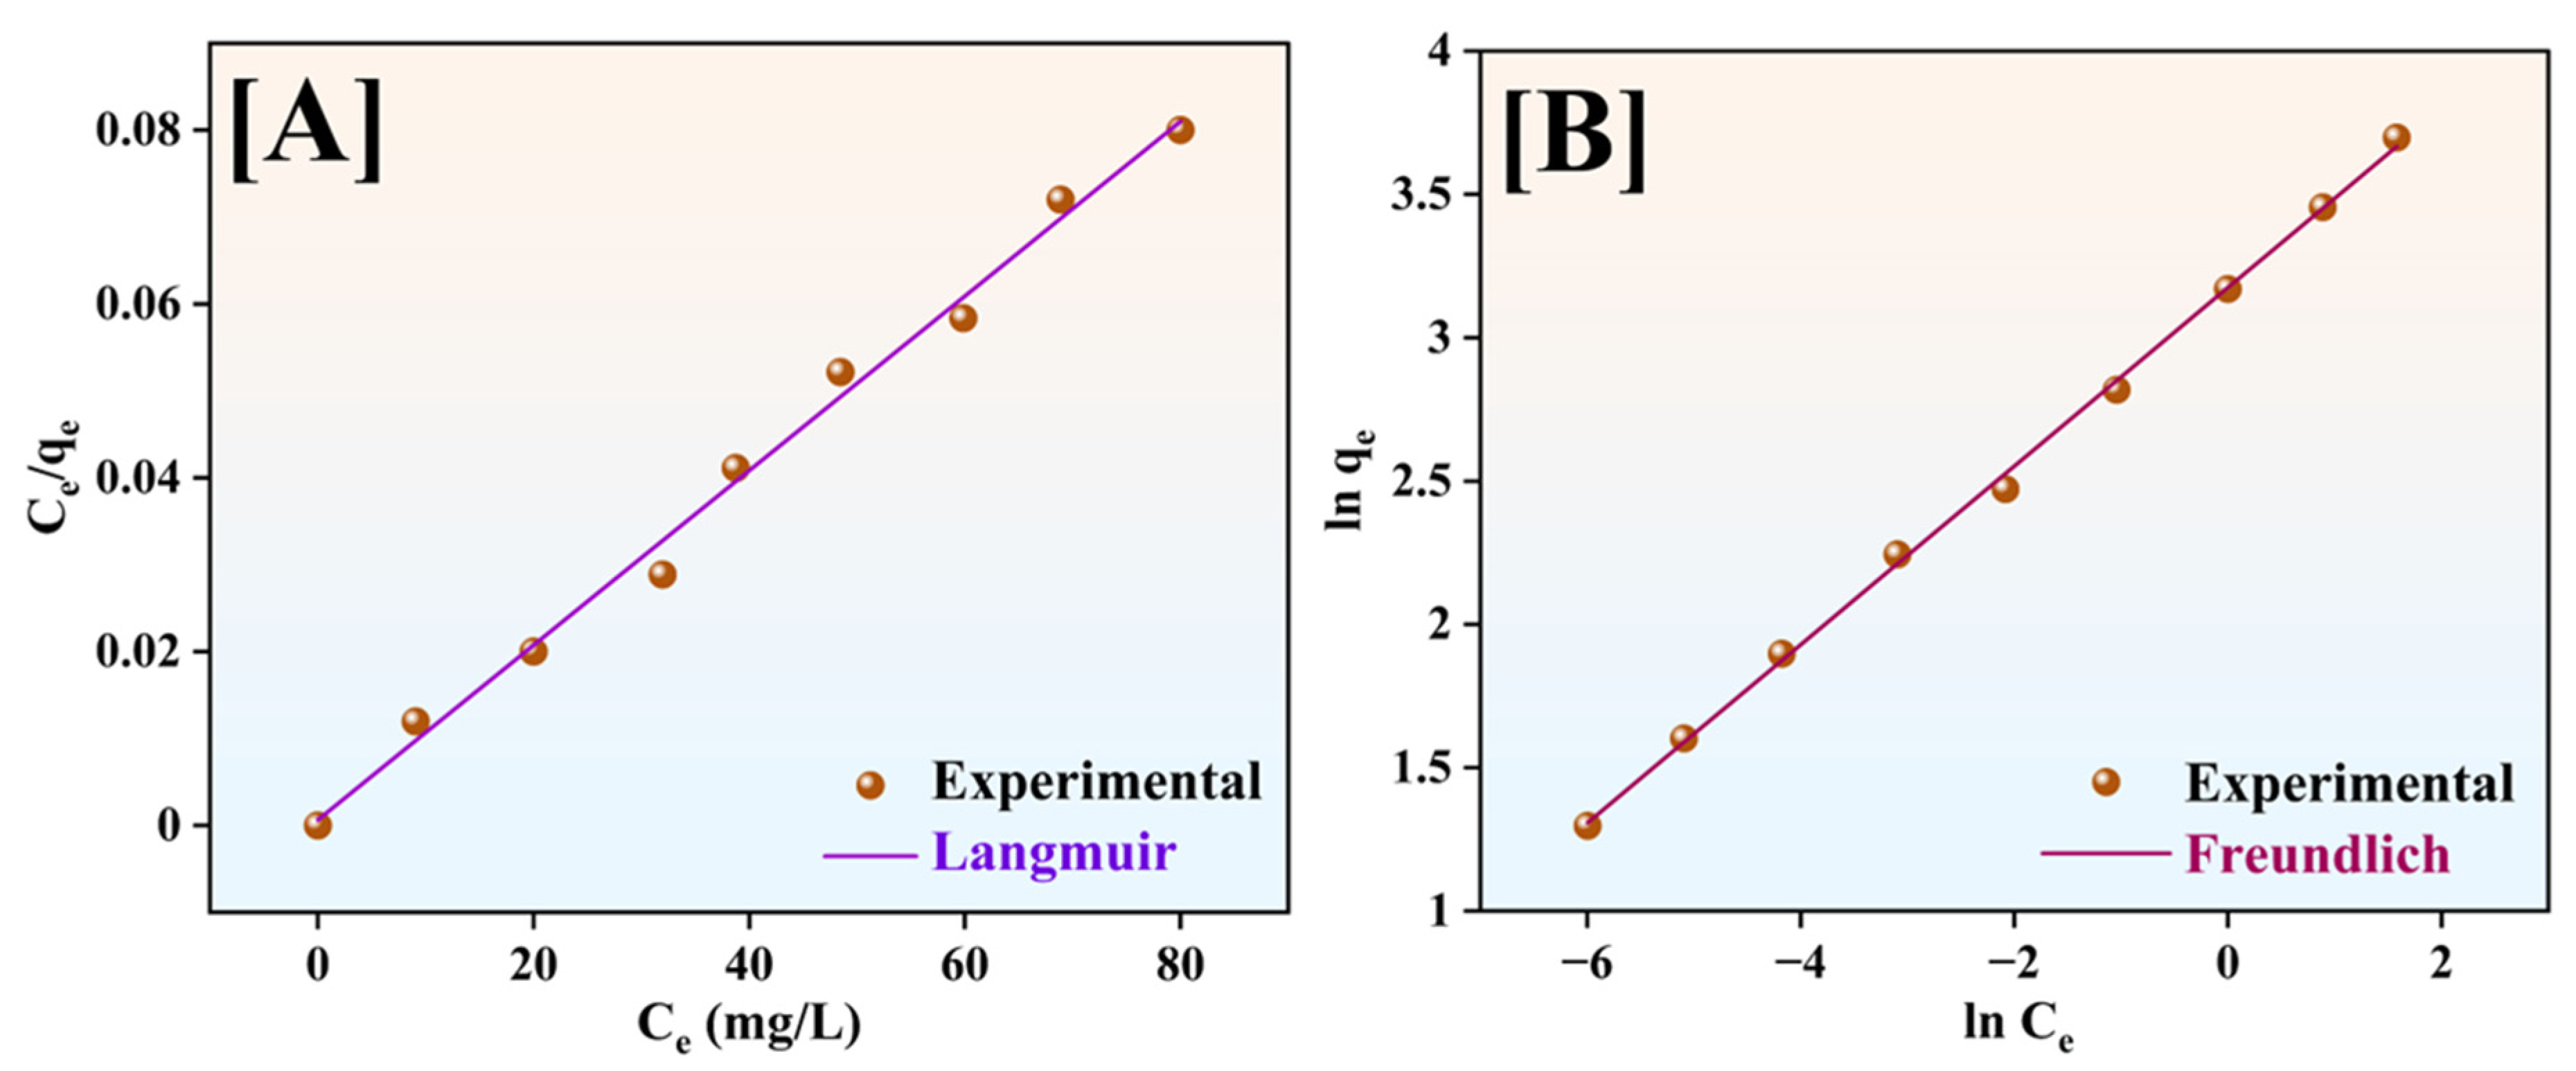
Equilibrium sorption isotherms, defined by specific constants that reflect the surface characteristics and the biosorbent’s affinity for various contaminants, can be used to characterize an adsorbent’s sorption capacity. In this study, linear and non-linear forms of the Freundlich and Langmuir isotherms were selected to fit experimental data on the amount of MNZ adsorbed by maize cob-activated carbon. Figure 14A,B shows the linear forms of the isotherm models.
From the linear plot, it was observed that both the Langmuir and Freundlich isotherm models had high correlation coefficients (R2 > 0.95), indicating that the mode is on both multilayer and monolayer surfaces. The Freundlich model yielded an R2 value of 0.9975, indicating that the main adsorption mode may occur on multilayer surfaces.
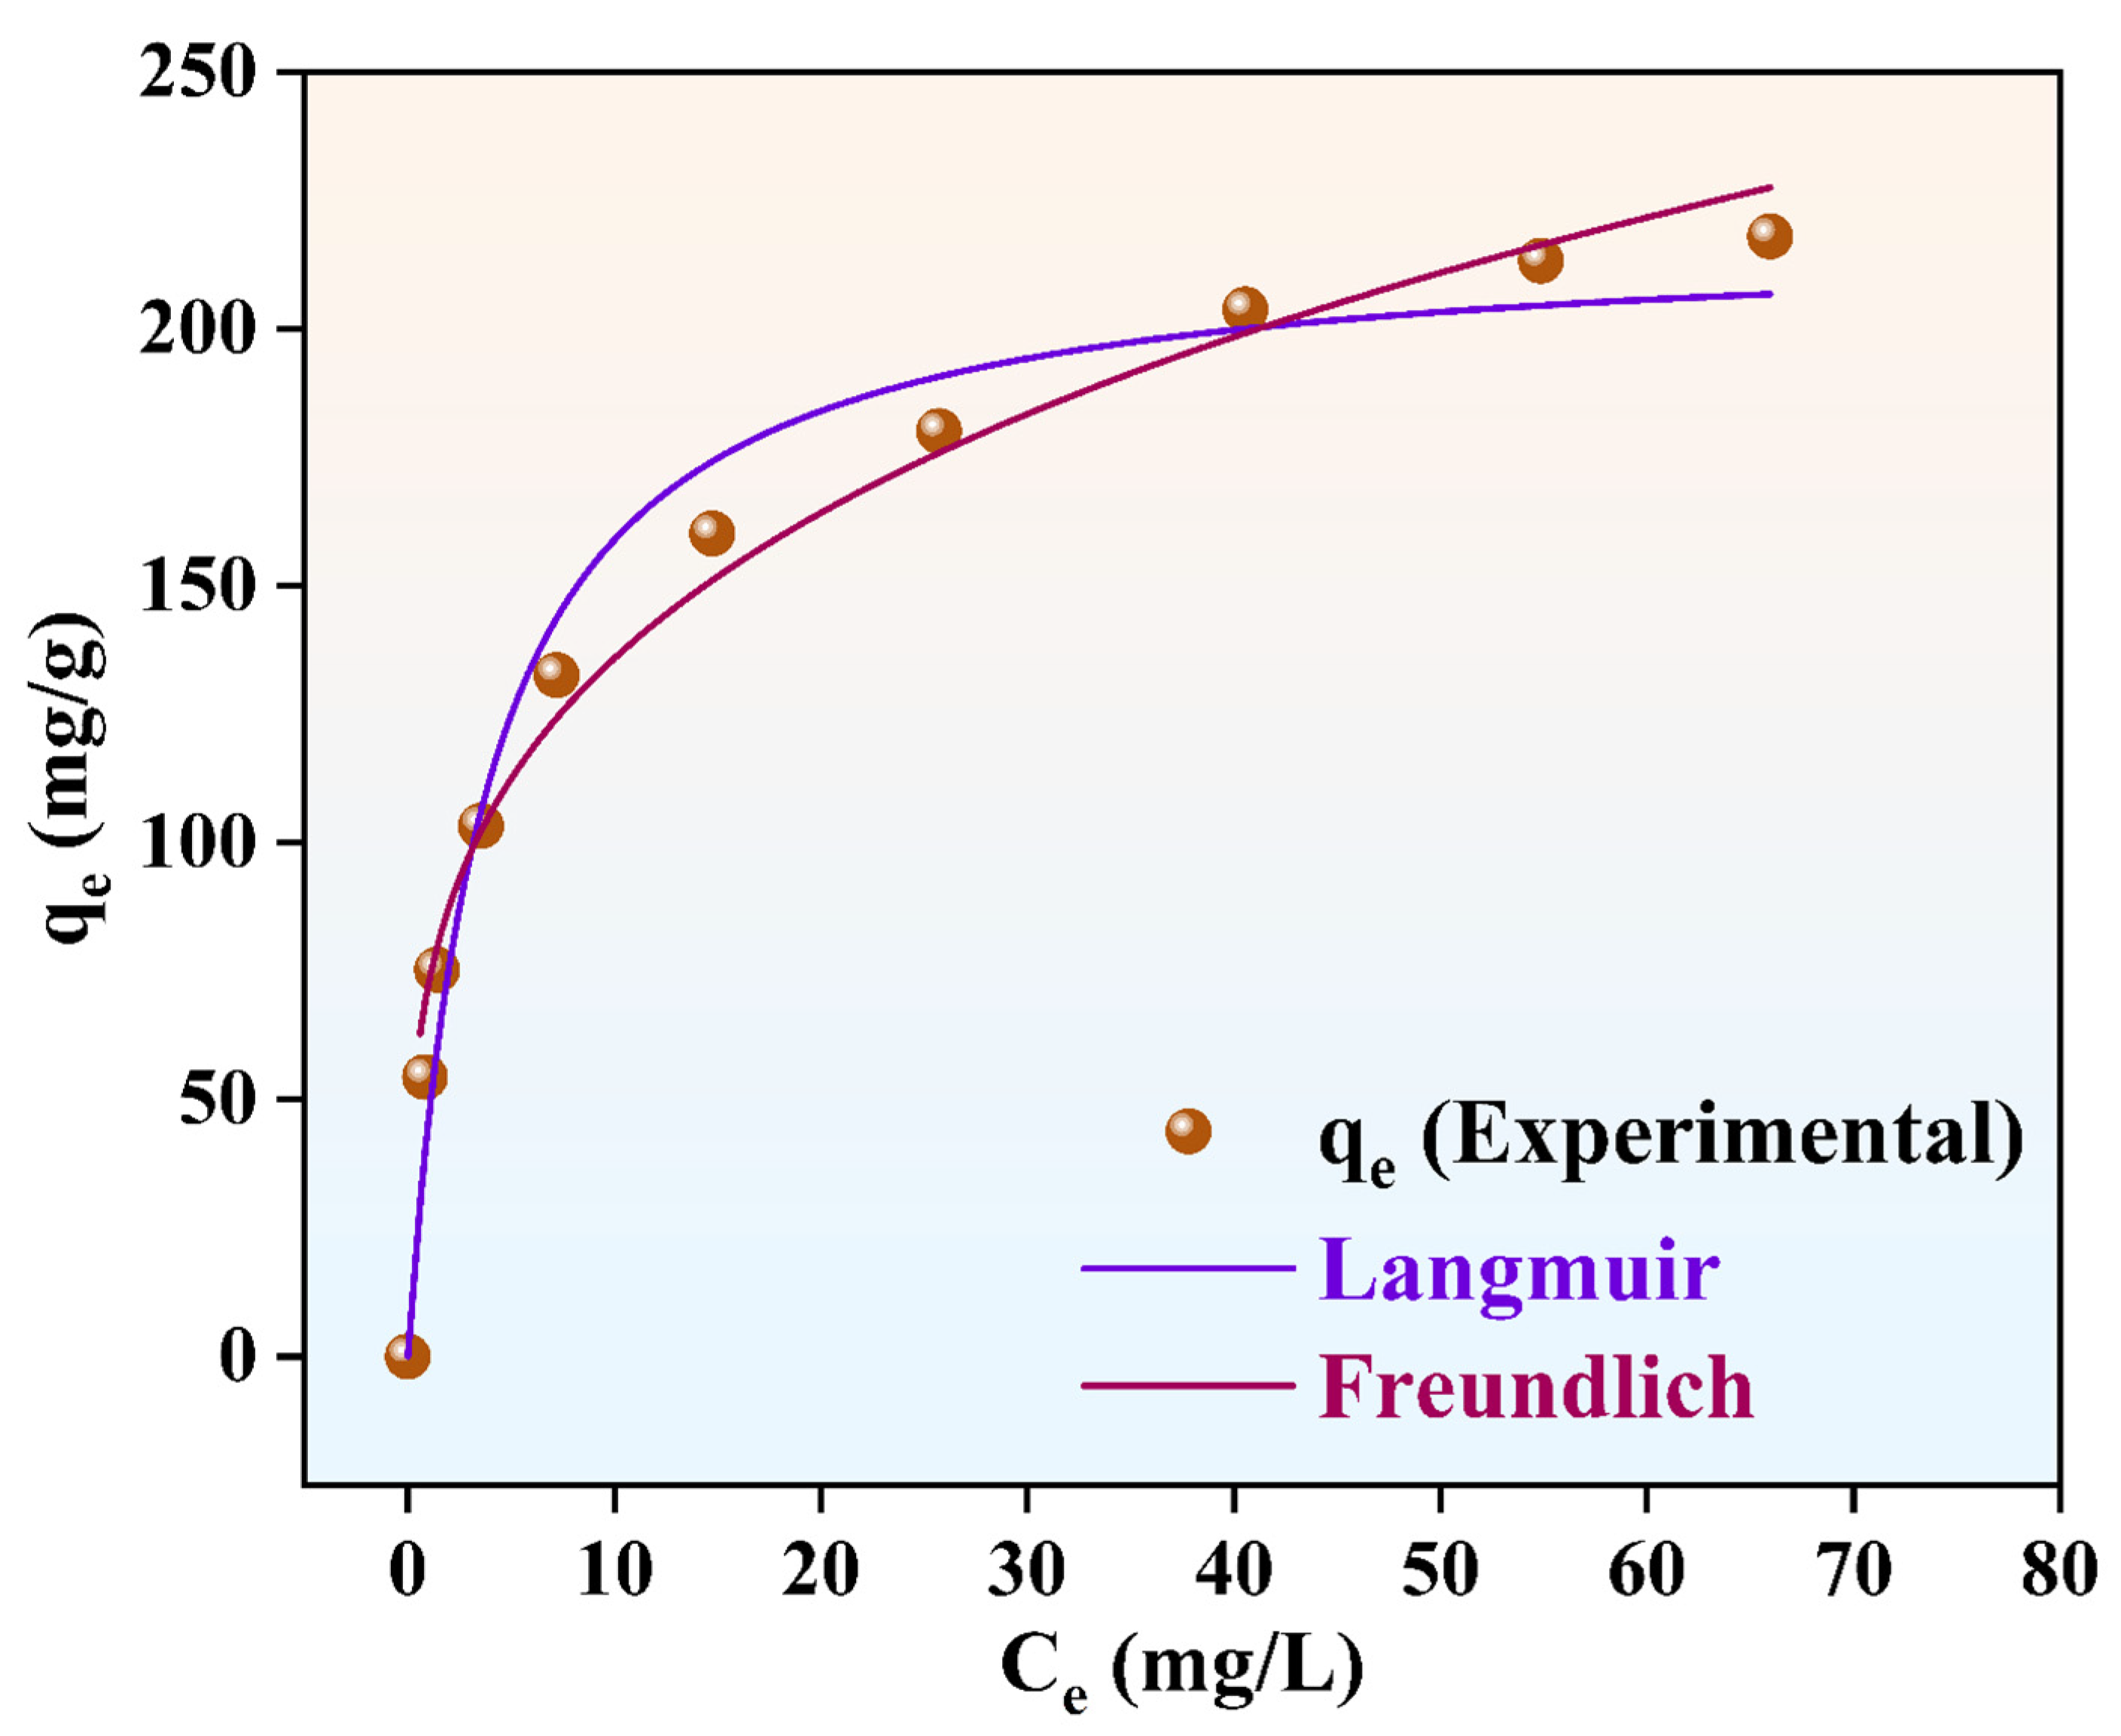
In this work, the non-linear forms of both models were further studied to investigate the interaction between metronidazole and maize cob-activated carbon, thereby determining the mode of action in complex systems. Figure 15 shows the non-linear plots of the isotherm models.
Figure 15. The non-linear isotherm models for the adsorption of MNZ.
Environments 13 00393 g015
It was also observed that both models had high correlation coefficients (R2 > 0.97), further validating that the mode is multilayer and monolayer adsorption. In this study, the non-linear Freundlich model had a high correlation coefficient (R2 = 0.9987), further indicating that adsorption occurred on multilayer surfaces. This is in line with the pore size distribution from BET, scanning electron microscopy analysis, and Fourier transform infrared data, which provide evidence of multilayer adsorption on both the surface and pores of the MC-AC.
To evaluate and validate the models, performance measures were used to determine the best-performing model. Observations have been made regarding isotherm studies, and conclusions cannot be drawn solely from the correlation coefficients. Performance measures provide insight into the model’s fit and quality. Table 7 presents a comparative analysis of the linear and non-linear forms of the models, based on the error functions.
The comparison of the two models using the correlation coefficient shows that both the linear and non-linear forms of the Freundlich isotherm models had the best fit for the adsorption process. By comparing the error functions to determine the best-fitting model, it was further observed that the Freundlich model was the best. The low error function values indicate a model of the best quality, and as such, the Freundlich model was well in agreement. Thus, the main mode of adsorption on the adsorbent surface was multilayer heterogeneous adsorption.

3.9. Application in Real Water Samples

The synthesized MC-AC was applied in four samples, which were distilled, sewage, industrial, and tap water, to investigate the removal of metronidazole. To determine the removal of MNZ by the synthesized MC-AC in real-world processes, 10 mg/L of adsorbate was added to the samples. Before the removal experiments were carried out, the water samples were filtered through a 0.45 µm membrane filter to obtain a consistent sample. The physicochemical characteristics of the sample, including pH, turbidity, and total dissolved solids (TDS), were determined in accordance with the World Health Organization (WHO) acceptable values and are shown in Table 8.
From Table 8, the parameters were brought within the acceptable ranges of WHO, as such, these factors have minimal effects on the adsorption of metronidazole.
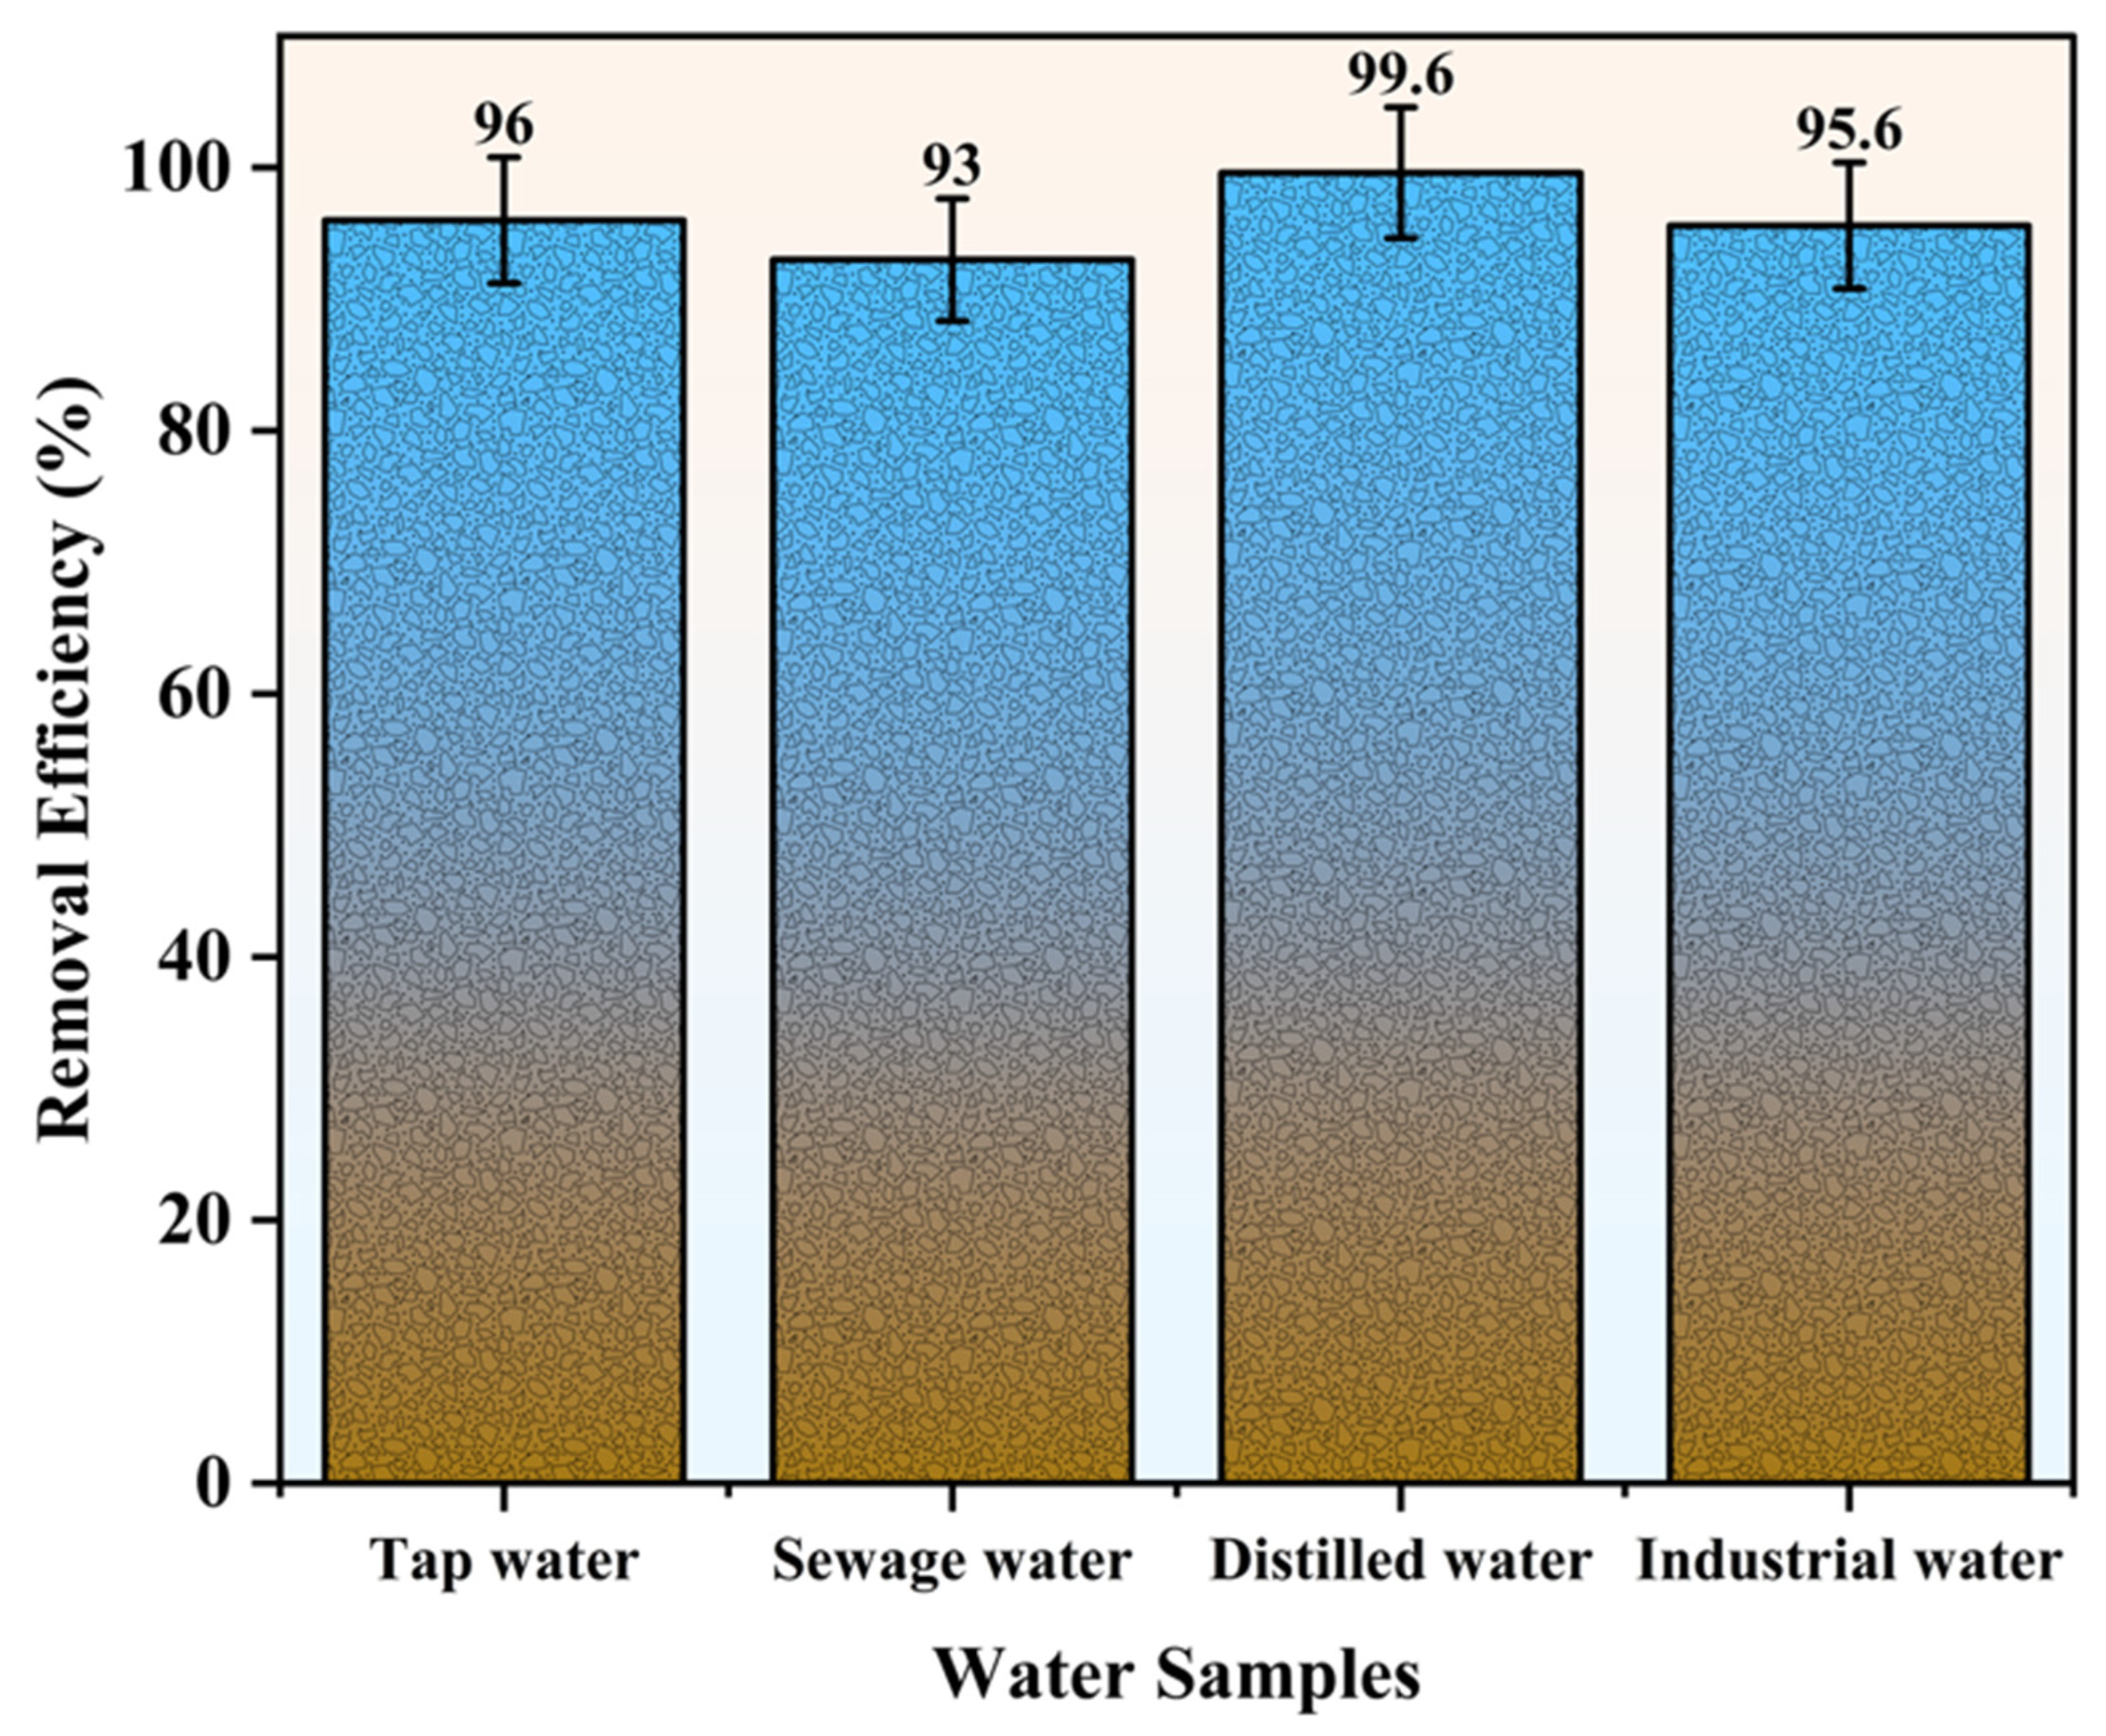
The removal of metronidazole by MC-AC in the four water samples exceeded 89.8%. The application of MC-AC on real wastewater samples is shown in Figure 16.
Figure 16. Adsorption efficiencies of the four water samples.
Environments 13 00393 g016
Figure 16 shows that the water samples from sewage (89.8%) and industrial (93%) sources had relatively low efficiencies, as many ions in the water compete for the active sites of the synthesized MC-AC materials. The observed differences in wastewater samples showed the adsorbents’ robustness and strength matrices with competing ions. This provides evidence on the presence of pores, large surface area, and numerous functional groups that offer binding sites onto which various water components are adsorbed.

3.10. Reusability

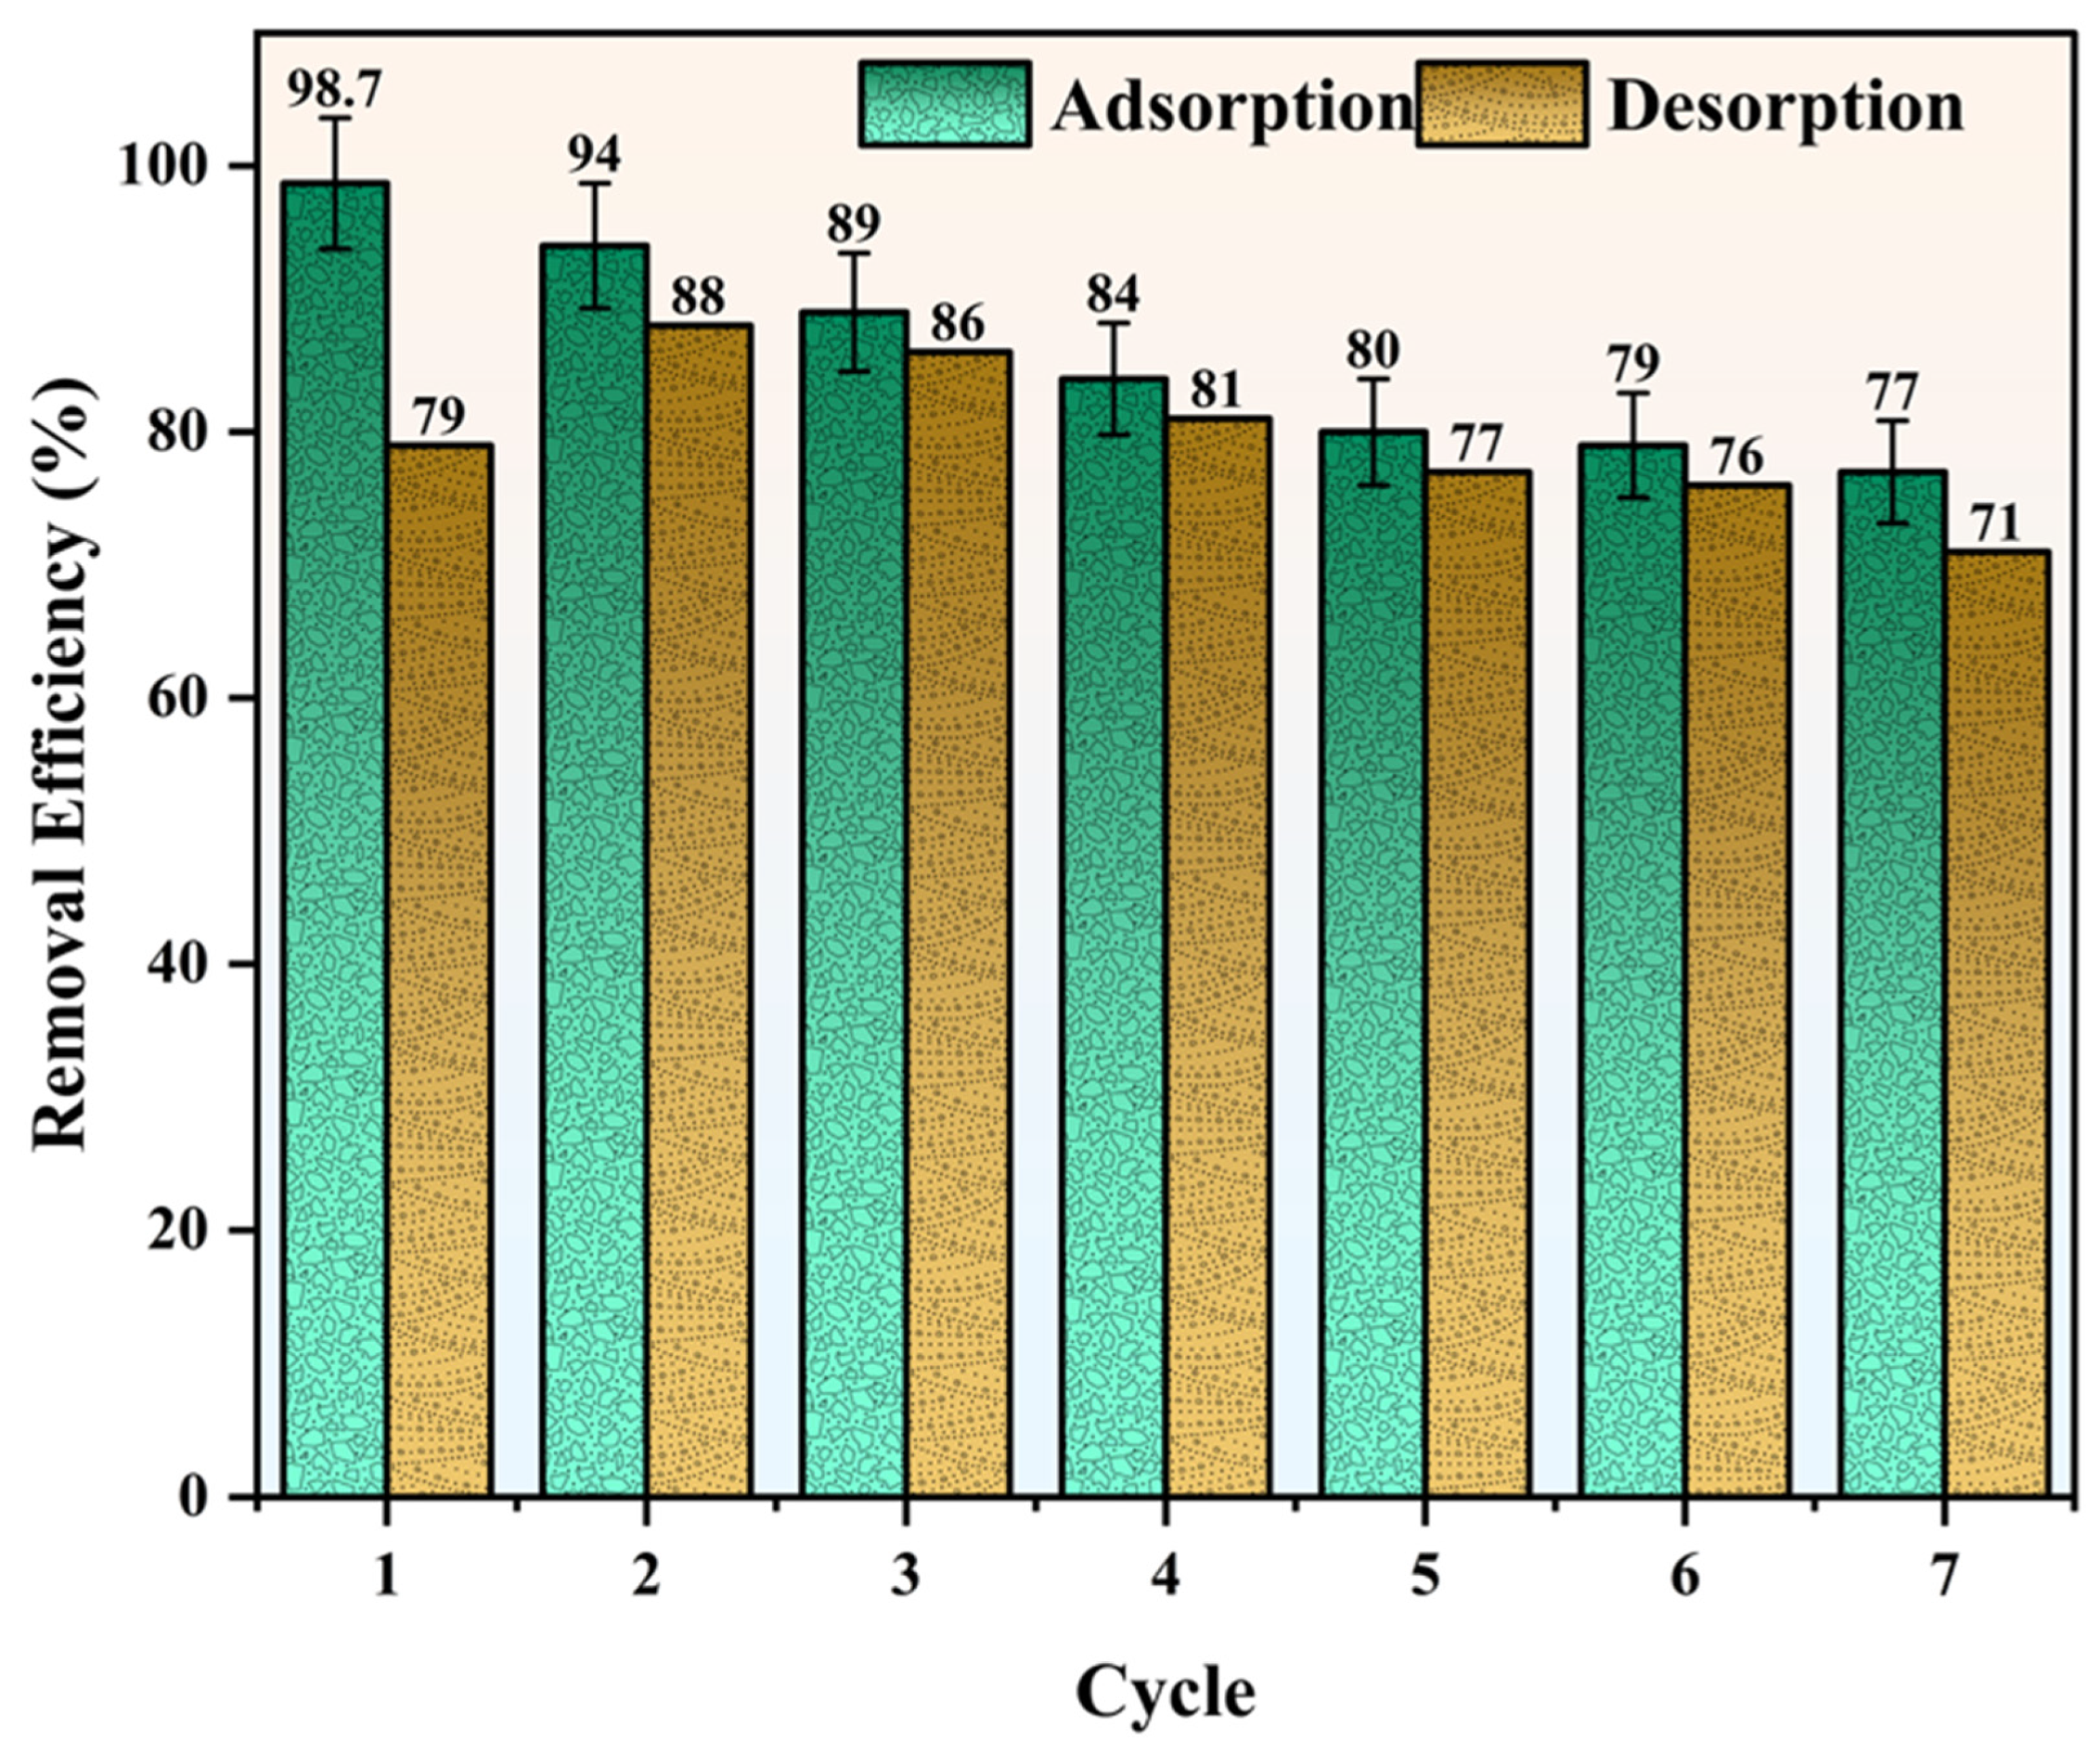
Investigations into the reusability of the material after metronidazole adsorption were conducted to assess applicability, the mechanistic framework, and economic feasibility. The optimal conditions for this study were achieved after four cycles, using sodium hydroxide (0.1 M) to assess the adsorbent’s desorption ability. Beyond seven cycles, the stability and reusability of MC-AC decreased, as shown in Figure 17.
The strong interaction between metronidazole and the maize cob-activated carbon reduces adsorption efficiency, as most surface functional groups are occupied, leaving no additional adsorbate molecules to be taken up. It is worth noting that the desorption efficiency after adding sodium hydroxide ranged between 79 and 71%.

3.11. Comparative Studies of MC-AC with Literature

Various experiments have been conducted to assess the adsorbent’s efficiency in removing metronidazole from water. The study can be based on the adsorbent’s adsorption capacity, qmax (mg/g). Table 9 presents an analysis of adsorbents and their adsorption capacities from various studies.
Table 9 shows that the prepared modified maize cob-activated carbon had an adsorption capacity better than that reported in the literature. A capacity of 72.4 mg/g was obtained in the first 30 min. Based on the literature on MNZ removal from water, maize cob-activated carbon shows a significant advantage in adsorption.

4. Conclusions

This study successfully developed a highly porous activated carbon derived from maize cob (MC-AC) for the efficient removal of metronidazole (MNZ) from aqueous solutions. The comprehensive characterization using FTIR, FESEM, HRTEM, PXRD, and BET analysis confirmed that the synthesized material possesses a well-developed porous structure with a substantial BET surface area of 294.7 m2/g, a mean pore diameter of 2.6 nm, and diverse surface functional groups, including hydroxyl, carbonyl, and carboxyl moieties. These properties collectively contributed to the remarkable adsorption performance of MC-AC, achieving a removal efficiency of 98.6% for MNZ under optimized conditions. The application of response surface methodology employing the Box–Behnken design proved effective in modeling and optimizing the adsorption process; the optimal removal efficiency predicted by the BBD model was 94.6%. Kinetic studies revealed that both pseudo-first-order and pseudo-second-order models described the adsorption mechanism well, with the non-linear pseudo-second-order model exhibiting the best fit (R2 = 0.9989), indicating that chemisorption via electrostatic interactions and hydrogen bonding was the dominant mechanism. Isotherm analysis demonstrated that the Freundlich model provided the best fit for both linear and non-linear forms (R2 = 0.9988 and 0.9825, respectively), suggesting multilayer adsorption on heterogeneous surfaces. The maximum adsorption capacity Kf of MC-AC was determined to be 72.4 (mg/g) (L/mg)1/n through the non-linear Freundlich model. Collectively, this study presents MC-AC as a sustainable, cost-effective, and highly efficient adsorbent for metronidazole removal from contaminated water, offering a promising alternative to conventional treatment methods.

5. Future Perspectives

Future studies should integrate post-adsorption studies of FTIR, HRTEM, and FESEM to investigate the chemical evidence on the interaction between the adsorbate and the surface functional groups on the adsorbent. In addition, molecular simulations of density functional theory can be undertaken to determine the adsorption energy and the precise binding sites of the adsorbate onto graphene oxide, which provides more evidence on the mechanism that is provided by the pseudo-second-order kinetic model. Furthermore, subsequent studies should carry out temperature studies through calculating the ΔG°, ΔH°, and ΔS°, which will be aimed at calculating the heat changes, spontaneity, and degree of disorder to determine whether the process is exothermic or endothermic. Studies regarding the modification of maize cob-activated carbon with magnetic materials can be carried out to facilitate on the potential of regeneration with minimal waste generation. Finally, competitive studies can be sorted with different adsorbates to assess the adsorption capacity of graphene oxide.

Author Contributions

Data analysis, manuscript preparation, conceptualization, S.B., P.M.R., B.A., and M.K.; Investigation, methodology, review and editing, M.K., B.G.S., I.K., B.A., and P.M.R.; Data manipulation, software, visualization, S.B., J.T., M.N., Y.W.M., and P.M.R.; Conceptualization and supervision, B.A., M.K., I.K., and P.M.R. All authors have read and agreed to the published version of the manuscript.

Funding

This study did not receive any funding.

Data Availability Statement

The data presented in this study are available from the corresponding author upon reasonable request.

Conflicts of Interest

The authors declare no conflicts of interest.

Abbreviations

The following are the different abbreviations that were used in the manuscript
MNZMetronidazole
RSMResponse surface methodology
MCMaize cob
ACActivated carbon
PFOPseudo-first order
PSOPseudo-second order
BBDBox–Behnken design

References

  1. Meng, X.; Wang, K.; Xu, J.; Shao, X.; Xu, W. The Governance Logic of Green Technology Diffusion Under Ecological Civilization: The Case of Formaldehyde-Free Biomass Adhesive Industrialization. Sustainability 2026, 18, 1477. [Google Scholar] [CrossRef]
  2. Gidado, S.M.; Olumoh, J.S.; Tyndall, J.; Inyang, V.; Raji, H.; Agboola, B. Assessment of the usage of plastic products, their disposal methods and the impacts on the environment: A case study in Yola, North-Eastern Nigeria. Environ. Monit. Assess. 2026, 198, 511. [Google Scholar] [CrossRef] [PubMed]
  3. Giosafatto, C.V.L.; Avitabile, M.; Famiglietti, M.; Kordjazi, T.; Moosavi-Nasab, M.; Restaino, O.F.; Mariniello, L. Sustainable bioplastics manufacturing from renewable sources. FEBS Open Bio 2026, 16, 686–708. [Google Scholar] [CrossRef] [PubMed]
  4. Venkatesh, M.; Isloor, A.M.; Farnood, R.; Porawati, H. Hybrid metal organic framework-polyethersulfone hollow fiber membrane interface for advanced ultrafiltration of microplastics, dyes, heavy metals, and salts: Toward sustainable development goals for wastewater treatment. Curr. Res. Green Sustain. Chem. 2026, 12, 100518. [Google Scholar] [CrossRef]
  5. Hamdi, R. Assessing Sustainable Approaches in the Face of Industrial Chemical Pollution of Freshwater. Sustainability 2026, 18, 3476. [Google Scholar] [CrossRef]
  6. Hatvate, N.T.; Akolkar, H.N.; Haghi, A.K. Sources and Types of Microplastics in Wastewater Systems. In Microplastics in Wastewater: A Global Perspective on Implementing Sustainable Development; Springer: Berlin/Heidelberg, Germany, 2026; pp. 19–40. [Google Scholar] [CrossRef]
  7. Kumar, P.; Kaur, J.; Rahul; Kaur, P.; Malik, S. Nanomaterials in Water Purification: From Pathogens to Microplastics and Heavy Metals. In Nanotechnology in Environmental Science and Healthcare; Springer: Berlin/Heidelberg, Germany, 2026; pp. 55–82. [Google Scholar] [CrossRef]
  8. Karume, I.; Bbumba, S.; Kigozi, M.; Nabatanzi, A.; Mukasa, I.H.Z.T.; Yiga, Z.T. One-pot removal of pharmaceuticals and toxic heavy metals from water using xerogel-immobilized quartz/banana peels-activated carbon. Green Chem. Lett. Rev. 2023, 16, 2238726. [Google Scholar]
  9. Singh, D.; Kushwaha, J.; Shankar, R.; Singh, S.; Mishra, V.; Singh, D.; Mishra, A.; Singhania, R.R.; Patel, A.K.; Giri, B.S. Pharmaceutical Wastewater as an Emerging Environmental Contaminant: Sustainable Treatment Strategies and Future Perspectives. Bioengineering 2026, 13, 540. [Google Scholar] [CrossRef] [PubMed]
  10. Dejus, B.; Tedoldi, E.L.; Dejus, S.; Kairisa, L.; Rajarao, G.K. The Life Cycle Assessment of Filamentous Fungi in Pharmaceutical Bioremediation and Wastewater Management: A Critical Review. ACS ES&T Water 2026, 6, 2637–2655. [Google Scholar] [CrossRef] [PubMed]
  11. Brillas, E.; Peralta-Hernández, J.M. Advances in Hybrid Photo-Fenton Processes for Treating Pharmaceutical Contaminants in Water and Wastewater Systems. Water 2026, 18, 920. [Google Scholar] [CrossRef]
  12. Seralathan, K.-K.; Sagadevan, S.; Fatimah, I.; Lett, J.A.; Kaus, N.H.M.; Al-Anber, M.A. Addressing the Persistent Threat of Emerging Micropollutants: Innovative Treatment Technologies for Protecting Human Health and Ecosystem Stability. Water Air Soil Pollut. 2026, 237, 247. [Google Scholar] [CrossRef]
  13. Mushtaq, Q.; Akhtar, M.; Fatima, D.; Hedar, M.; Anwar, A.; Intisar, A. Carbon nanotubes: Conventional and green methods of synthesis and adsorptive mitigation of pharmaceuticals from water. Int. J. Environ. Sci. Technol. 2026, 23, 271. [Google Scholar] [CrossRef]
  14. Hamdy, A.M.; Abu-Bakr, R.I.; El-Hay, S.S.A.; Sayed, R.A. Simultaneous spectrophotometric eco-friendly analysis of triple-drug H. pylori regimen (Vonoprazan, Amoxicillin, Metronidazole) for quality control and in vitro dissolution testing. Sci. Rep. 2026, 16, 12793. [Google Scholar] [CrossRef] [PubMed]
  15. Suvarna, V.; Murahari, M.; Pawar, S. Metronidazole—An Old Drug for Structure Optimization and Repurposing. Chem. Biodivers. 2025, 22, e03389. [Google Scholar] [CrossRef] [PubMed]
  16. Chua, K.Y. Metronidazole. In Kucers’ the Use of Antibiotics; CRC Press: Boca Raton, FL, USA, 2017; pp. 1807–1849. [Google Scholar] [CrossRef] [PubMed]
  17. Slaouti, H.; Djellouli, F.; Chaib, B.; Saada, Z. Influence of metal complex formation on the biological activity of metronidazole: Spectroscopic, DFT calculation, in vitro and in silico biological activity. Pure Appl. Chem. 2026, 98, 881–899. [Google Scholar]
  18. Bbumba, S.; Karume, I.; Nsamba, H.K.; Kigozi, M.; Kato, M. An Insight into Isotherm Models in Physical Characterization of Adsorption Studies. Eur. J. Appl. Sci. 2024, 12, 115–134. [Google Scholar] [CrossRef]
  19. Karume, I.; Bbumba, S.; Tewolde, S.; Mukasa, I.H.Z.T.; Ntale, Z.T. Impact of carbonization conditions and adsorbate nature on the performance of activated carbon in water treatment. BMC Chem. 2023, 17, 162. [Google Scholar] [CrossRef] [PubMed]
  20. Danu, B.Y.; Bandoh, C.K.; Adusei, J.K.; Haruna, M.; Kangmennaa, A.; Yeboah, P.; Ampong, F.K.; Agorku, E. Carbon-based materials for the removal of organic dyes from wastewater. Discov. Nano 2026, 21, 29. [Google Scholar] [CrossRef] [PubMed]
  21. Tokinova, R.; Rozhin, A.; Rozhina, E. Sustainable Clay-Based Nanocomposites for Algal Toxin Remediation. J. Compos. Sci. 2026, 10, 259. [Google Scholar] [CrossRef]
  22. Chen, H.; Hu, Q.; Huang, H.; Chen, L.; Zhang, C.; Jin, Y.; Zhang, W. Adsorption and Removal of Emerging Pollutants from Water by Activated Carbon and Its Composites: Research Hotspots, Recent Advances, and Future Prospects. Water 2026, 18, 300. [Google Scholar] [CrossRef]
  23. Wang, B.; Liu, Y.; Hou, B.; Li, Q.; Mao, D.; Li, X.; Feng, S.; Tan, Y.; Zhao, D.; Yu, H.; et al. Pore size-matched adsorption of organic pollutants and its pilot application in advanced wastewater treatment. Water Res. 2026, 300, 126009. [Google Scholar] [CrossRef] [PubMed]
  24. Hossen, M.S.; Islam, T.; Hasan, M.Z.; Bashar, M.M.; Luo, L.; Narita, F. Biomass-Derived Activated Carbon: A Promising Candidate for Multifunctional Approach Toward Sustainable Advanced Materials. Adv. Sustain. Syst. 2026, 10, e01559. [Google Scholar] [CrossRef]
  25. Cansado, I.P.d.P.; Mourão, P.A.M.; Castanheiro, J.E.F.; Geraldo, P.F.; Suhas; Suero, S.R.; Cano, B. Review on Treatment Pathways and Adsorptive Approaches for Dye-Contaminated Wastewater. Processes 2026, 14, 898. [Google Scholar] [CrossRef]
  26. Bbumba, S.; Karume, I. Comparative analysis of ANFIS, ANN, and BBD for enhanced prediction of methyl orange adsorption in water treatment. Sci. Rep. 2026, 16, 12822. [Google Scholar] [CrossRef] [PubMed]
  27. Cachola Maldito Lowden, V.M.; Alexandre-Franco, M.F.; Garrido-Zoido, J.M.; Cuerda-Correa, E.M.; Gómez-Serrano, V. Coconut shell-derived activated carbons: Preparation, physicochemical properties, and dye removal from water. Molecules 2026, 31, 263. [Google Scholar] [CrossRef] [PubMed]
  28. Bernal, V.; Goulart de Araujo, L.; Castro-Gutiérrez, J.; Moreno-Piraján, J.C.; Giraldo, L.; Celzard, A.; Fierro, V. Effective removal of the anticancer drug 5-fluorouracil from water using a sustainable tannin-derived carbon. J. Environ. Manag. 2026, 403, 129068. [Google Scholar] [CrossRef] [PubMed]
  29. Yu, S.; Li, S.; Hu, H.; Gao, L.; Huang, Y.; Pu, F.; Yao, H. Enhanced VOCs adsorption mechanism on biochar synthesized by one-step molten salt thermal treatment: Experimental and DFT insights. J. Environ. Manag. 2026, 397, 128310. [Google Scholar] [CrossRef] [PubMed]
  30. Kigozi, M.; Koech, R.K.; Kingsley, O.; Ojeaga, I.; Tebandeke, E.; Kasozi, G.N.; Onwualu, A.P. Synthesis and characterization of graphene oxide from locally mined graphite flakes and its supercapacitor applications. Results Mater. 2020, 7, 100113. [Google Scholar] [CrossRef]
  31. Bbumba, S.; Kigozi, M.; Nabatanzi, J.; Karume, I.; Arum, C.T.; Nsamba, H.K.; Kiganda, I.; Murungi, M.; Ssekatawa, J.; Nazziwa, R.A. Response Surface Methodology: A Review on Optimization of Adsorption Studies. Asian J. Chem. Sci. 2024, 14, 106–113. [Google Scholar] [CrossRef]
  32. Bbumba, S.; Kigozi, M.; Karume, I.; Arum, C.T.; Murungi, M.; Babirye, P.M.; Kirabo, S. Prediction and Optimization of Process Parameters Using Artificial Intelligence and Machine Learning Models. Asian J. Appl. Chem. Res. 2025, 16, 11–33. [Google Scholar] [CrossRef]
  33. Eraslan, Y.; Şengün, E. Parametric Optimization of VLM Panel Discretization Using Bio-Inspired Crayfish and Aquila Algorithms Coupled with Hybrid RSM-Based Ensemble Machine Learning Surrogate Models: A Case Study. Biomimetics 2026, 11, 204. [Google Scholar] [CrossRef] [PubMed]
  34. Das, A.; Gupta, D.; Uppaluri, R.V.S.; Mitra, S. Application of RSM-DF and RSM-ANN-TLBO optimization techniques for enhancing the performance of nanozyme derived from spent mushroom substrate biochar. Biomass Bioenergy 2026, 211, 109154. [Google Scholar] [CrossRef]
  35. Kigozi, M.; Koech, R.K.; Orisekeh, K.; Kali, R.; Kamoga, O.L.M.; Padya, B.; Bello, A.; Kasozi, G.N.; Jain, P.K.; Kirabira, J.B. Cobs Porous Carbon-Based Materials With High Energy And Excellent Cycle Stability For Supercapacitor Applications. Res. Sq. 2021. [Google Scholar] [CrossRef] [PubMed]
  36. Yusuf, M.O. Bond characterization in cementitious material binders using Fourier-transform infrared spectroscopy. Appl. Sci. 2023, 13, 3353. [Google Scholar] [CrossRef]
  37. Sonibare, O.O.; Haeger, T.; Foley, S.F. Structural characterization of Nigerian coals by X-ray diffraction, Raman and FTIR spectroscopy. Energy 2010, 35, 5347–5353. [Google Scholar] [CrossRef]
  38. Rane, A.V.; Kanny, K.; Abitha, V.K.; Thomas, S. Methods for Synthesis of Nanoparticles and Fabrication of Nanocomposites. In Synthesis of Inorganic Nanomaterials: Advances and Key Technologies; Woodhead Publishing: Cambridge, UK, 2018; pp. 121–139. [Google Scholar] [CrossRef]
  39. Munir, K.S.; Li, Y.; Liang, D.; Qian, M.; Xu, W.; Wen, C. Effect of dispersion method on the deterioration, interfacial interactions and re-agglomeration of carbon nanotubes in titanium metal matrix composites. Mater. Des. 2015, 88, 138–148. [Google Scholar] [CrossRef]
  40. Moses, K.; Karume, I.; Bbumba, S.; Parvathalu, K.; Kasozi, G.; Tebandeke, E. None-emission carbon nanomaterial derived from polystyrene plastic waste for the adsorption of carbon dioxide. Results Mater. 2025, 26, 100671. [Google Scholar] [CrossRef]
  41. Sangeetha, D.N.; Selvakumar, M. Active-defective activated carbon/MoS2 composites for supercapacitor and hydrogen evolution reactions. Appl. Surf. Sci. 2018, 453, 132–140. [Google Scholar] [CrossRef]
  42. Eleri, O.E.; Azuatalam, K.U.; Minde, M.W.; Trindade, A.M.; Muthuswamy, N.; Lou, F.; Yu, Z. Towards high-energy-density supercapacitors via less-defects activated carbon from sawdust. Electrochim. Acta 2020, 362, 137152. [Google Scholar] [CrossRef]
  43. Sinha, P.; Datar, A.; Jeong, C.; Deng, X.; Chung, Y.G.; Lin, L.-C. Surface area determination of porous materials using the Brunauer–Emmett–Teller (BET) method: Limitations and improvements. J. Phys. Chem. C 2019, 123, 20195–20209. [Google Scholar] [CrossRef]
  44. Mohan, V.B.; Jayaraman, K.; Bhattacharyya, D. Brunauer–Emmett–Teller (BET) specific surface area analysis of different graphene materials: A comparison to their structural regularity and electrical properties. Solid State Commun. 2020, 320, 114004. [Google Scholar] [CrossRef]
  45. Sözcü, Ş.; Wiener, J.; Frajová, J.; Venkataraman, M.; Tomková, B.; Kalmár, J.; Forgács, A.; Militký, J. Effect of drying methods on Acetobacter xylinum bacterial cellulose aerogels and cryogels. Sci. Rep. 2026, 16, 12264. [Google Scholar] [CrossRef] [PubMed]
  46. Ezati, S.; Ganjidoust, H.; Ayati, B. Hybrid Application of Response Surface Methodology (RSM) and Machine Learning for Multi-objective Optimization of Heterogeneous Electro-Fenton Process in Pharmaceutical Wastewater Treatment. Results Eng. 2026, 30, 109818. [Google Scholar] [CrossRef]
  47. Bian, H.; Xi, T.; Feng, Y.; Chen, J.; Wang, W.; Zhao, Z.; Wang, S.; Wei, W.; Zhou, X. Highly efficient Ag@β-FeOOH/cellulose nanofibril composite hydrogel for rapid photocatalytic degradation of tetracycline under visible light. Carbon Resour. Convers. 2026, 9, 100434. [Google Scholar] [CrossRef]
  48. Zhu, S.; Wen, M.; Lv, Z.; Chen, L.; Liu, T.; Hou, X. Predicting the properties of metamaterials consisting of curved-wall triangles using ensemble neural networks with interpretability. Eng. Appl. Artif. Intell. 2024, 138, 109408. [Google Scholar] [CrossRef]
  49. Tognan, A.; Laurenti, L.; Salvati, E. Contour method with uncertainty quantification: A robust and optimised framework via gaussian process regression. Exp. Mech. 2022, 62, 1305–1317. [Google Scholar] [CrossRef]
  50. Selim, M.M.; Tounsi, A.; Gomaa, H.; Hu, N.; Shenashen, M. Addressing emerging contaminants in wastewater: Insights from adsorption isotherms and adsorbents: A comprehensive review. Alex. Eng. J. 2024, 100, 61–71. [Google Scholar] [CrossRef]
  51. Aarab, N.; Hsini, A.; Essekri, A.; Laabd, M.; Lakhmiri, R.; Albourine, A. Removal of an emerging pharmaceutical pollutant (metronidazole) using PPY-PANi copolymer: Kinetics, equilibrium and DFT identification of adsorption mechanism. Groundw. Sustain. Dev. 2020, 11, 100416. [Google Scholar] [CrossRef]
  52. Nasseh, N.; Barikbin, B.; Taghavi, L.; Nasseri, M.A. Adsorption of metronidazole antibiotic using a new magnetic nanocomposite from simulated wastewater (isotherm, kinetic and thermodynamic studies). Compos. B Eng. 2019, 159, 146–156. [Google Scholar] [CrossRef]
  53. Inglis, A.; Parnell, A.; Hurley, C. Visualizing variable importance and variable interaction effects in machine learning models. J. Comput. Graph. Stat. 2022, 31, 766–778. [Google Scholar] [CrossRef]
  54. Cross, M.C.; Newell, A.C. Convection patterns in large aspect ratio systems. Phys. D Nonlinear Phenom. 1984, 10, 299–328. [Google Scholar] [CrossRef]
  55. Qiu, H.; Li, Y.; Cheng, K.; Li, Y. A practical evaluation approach towards form deviation for two-dimensional contours based on coordinate measurement data. Int. J. Mach. Tools Manuf. 2000, 40, 259–275. [Google Scholar] [CrossRef]
  56. Dritschel, D.G. Contour dynamics and contour surgery: Numerical algorithms for extended, high-resolution modelling of vortex dynamics in two-dimensional, inviscid, incompressible flows. Comput. Phys. Rep. 1989, 10, 77–146. [Google Scholar] [CrossRef]
  57. Lehmann, R. Improved critical values for extreme normalized and studentized residuals in Gauss–Markov models. J. Geod. 2012, 86, 1137–1146. [Google Scholar] [CrossRef]
  58. Zhang, L.; Gove, J.H.; Heath, L. Spatial residual analysis of six modeling techniques. Ecol. Modell. 2005, 186, 154–177. [Google Scholar] [CrossRef]
  59. Jamrozik, J.; Strandén, I.; Schaeffer, L.R. Random regression test-day models with residuals following a Student’s-t distribution. J. Dairy Sci. 2004, 87, 699–705. [Google Scholar] [CrossRef] [PubMed]
  60. Rigby, R.A.; Stasinopoulos, D.M. Generalized additive models for location, scale and shape. J. R. Stat. Soc. Ser. C Appl. Stat. 2005, 54, 507–554. [Google Scholar] [CrossRef]
  61. Ishak, N.A.M.; Ahmad, S. Estimating optimal parameter of Box-Cox transformation in multiple regression with non-normal data. In Regional Conference on Science, Technology and Social Sciences (RCSTSS 2016) Theoretical and Applied Sciences; Springer: Berlin/Heidelberg, Germany, 2018; pp. 1039–1046. [Google Scholar] [CrossRef]
  62. Atkinson, A.C.; Riani, M.; Corbellini, A. The box–cox transformation: Review and extensions. Stat. Sci. 2021, 36, 239–255. [Google Scholar] [CrossRef]
  63. Marimuthu, S.; Mani, T.; Sudarsanam, T.D.; George, S.; Jeyaseelan, L. Preferring Box-Cox transformation, instead of log transformation to convert skewed distribution of outcomes to normal in medical research. Clin. Epidemiol. Glob. Health 2022, 15, 101043. [Google Scholar] [CrossRef]
  64. Miller, J.N. Basic statistical methods for analytical chemistry. Part 2. Calibration and regression methods. A review. Analyst 1991, 116, 3–14. [Google Scholar] [CrossRef]
  65. Hocking, R.R. Methods and Applications of Linear Models: Regression and the Analysis of Variance; John Wiley & Sons: Hoboken, NJ, USA, 2013. [Google Scholar]
  66. Bbumba, S.; Karume, I.; Talibawo, J.; Ntale, M.; Kaddu, G.; Yikii, C.L.; Kigozi, M. Insights into predictive modeling, isotherms and kinetic studies in the removal of methylene blue from water using pineapple Peel activated carbon. Discov. Water 2026, 6, 38. [Google Scholar] [CrossRef]
  67. Peng, Y.; Khaled, U.; Al-Rashed, A.A.A.A.; Meer, R.; Goodarzi, M.; Sarafraz, M.M. Potential application of Response Surface Methodology (RSM) for the prediction and optimization of thermal conductivity of aqueous CuO (II) nanofluid: A statistical approach and experimental validation. Phys. A Stat. Mech. Its Appl. 2020, 554, 124353. [Google Scholar] [CrossRef]
  68. Bbumba, S.; Karume, I.; Talibawo, J.; Kasozi, G.; Nyakairu, G.W.; Ntale, M.; Kaddu, G.; Kiganda, I.; Mbabazi, R.; Kigozi, M. Modeling of tetracycline removal from water using plastic waste-carbon nanomaterial: A study based on machine learning and mathematical models. Discov. Chem. Eng. 2026, 6, 7. [Google Scholar] [CrossRef]
  69. Kariim, I.; Abdulkareem, A.S.; Abubakre, O.K. Development and characterization of MWCNTs from activated carbon as adsorbent for metronidazole and levofloxacin sorption from pharmaceutical wastewater: Kinetics, isotherms and thermodynamic studies. Sci. Afr. 2020, 7, e00242. [Google Scholar] [CrossRef]
  70. Sheikhmohammadi, A.; Asgari, E.; Yeganeh, J. Application of Fe3O4@activated carbon magnetic nanoparticles for the adsorption of metronidazole from wastewater: Optimization, kinetics, thermodynamics and equilibrium studies. Desalin. Water Treat. 2021, 222, 354–365. [Google Scholar] [CrossRef]
  71. El Farissi, H.; Beraich, A.; Lamsayah, M.; Talhaoui, A.; El Bachiri, A. The efficiency of carbon modified by phosphoric acid (H3PO4) used in the removal of two antibiotics amoxicillin and metronidazole from polluted water: Experimental and theoretical investigation. J. Mol. Liq. 2023, 391, 123237. [Google Scholar] [CrossRef]
  72. Schneider, L.T.; Módenes, A.N.; Scheufele, F.B.; Borba, C.E.; Trigueros, D.E.G.; Alves, H.J. Soybean hulls activated carbon for metronidazole adsorption: Thermochemical conditions optimization for tailored and enhanced meso/microporosity. J. Anal. Appl. Pyrolysis. 2024, 177, 106339. [Google Scholar] [CrossRef]
  73. Kiguli, C.; Lubwama, M.; Turyasingura, M.; Jjagwe, J.; Olupot, P.W. Optimization of ciprofloxacin and metronidazole removal from wastewater using modified zeolite-iron oxide nanocomposites. Results Mater. 2026, 29, 100900. [Google Scholar] [CrossRef]
  74. Rasheed-Adeleke, A.A.; Oyewo, O.A.; Ogunjinmi, O.E.; Seheri, N.H.; Onwudiwe, D. The removal of tetracycline and metronidazole from water using zinc ferrite nanomaterials. Discov. Appl. Sci. 2026, 8, 669. [Google Scholar] [CrossRef]
Figure 1. The molecular structure of metronidazole.
Environments 13 00393 g001
Figure 2. A schematic representation of the overall adsorption studies.
Environments 13 00393 g002
Figure 3. FTIR spectrum of maize cob-activated carbon.
Environments 13 00393 g003
Figure 4. A schematic representation of MC-AC using SEM with (A) 2000, (B) 10,000, (C) 200, and (D) 300 nm scales.
Environments 13 00393 g004
Figure 5. HRTEM images of activated carbon from maize cob with (a) 50, (b) 100, (c) 200, and (d) 500 nm scales.
Environments 13 00393 g005
Figure 6. PXRD spectra of the synthesized MC-AC.
Environments 13 00393 g006
Figure 7. BET surface plot showing the (A) adsorption–desorption profile and (B) pore size distribution of MC-AC.
Environments 13 00393 g007
Figure 8. Surface plots of the interaction between the input and output variables. (A) concentration versus dosage, (B) time versus dosage, (C) pH versus dosage, (D) time versus concentration, (E) pH versus concentration, and (F) pH versus time with the removal percentage.
Environments 13 00393 g008
Figure 9. Contour plots showing the relationship between the input parameters (A) concentration versus dosage, (B) time versus dosage, (C) pH versus dosage, (D) time versus concentration, (E) pH versus concentration, and (F) pH versus time with the removal percentage.
Environments 13 00393 g009
Figure 10. A representation of (A) normal plot of residuals, (B) residuals versus run, (C) predicted versus actual, and (D) Box–Cox plot for power transforms.
Environments 13 00393 g010
Figure 11. A representation of (A) residuals, (B) Cook’s distance, (C) DFFITS, and (D) leverage versus the run number.
Environments 13 00393 g011
Figure 12. The linear plot of both the (A) pseudo-first-order and (B) pseudo-second-order models.
Environments 13 00393 g012
Figure 13. The non-linear kinetic models for the adsorption of MNZ.
Environments 13 00393 g013
Figure 14. The linear plots of the (A) Langmuir and the (B) Freundlich isotherm models.
Environments 13 00393 g014
Figure 17. A representation of the effect of cycles on the removal of MNZ.
Environments 13 00393 g017
Table 1. The BBD combination of the input parameters and the response.
ParameterSymbol−10+1
Dosage (g/L)A0.51.01.5
Concentration (mg/L)B102540
Time (mins)C15.510
pHD3711
EXPERIMENTAL RUNS
RunA: Dosage (g/L)B: Concentration (mg/L)C: Time (mins)D: pHRemoval (%)
11105.51197.11
21405.51128.99
31.5251798.13
412511198.89
51.52510748.99
60.52510720.22
70.5255.51139.9
81255.5770.11
91255.5768.99
101.5255.51175.65
111255.5771.77
1214010721.22
131.5405.5760.12
141255.5772.44
151105.5332.56
1611010743.66
171.5105.5790.92
180.5405.5720
191.5255.5336.78
201401763.32
21125101149.11
220.5105.5743.78
230.5255.5320.45
241405.5360.77
250.5251735.22
2612510333.51
271251335.12
281101797.66
291255.5770.91
Table 2. Error analysis functions used in the removal of MNZ.
EntryFunctionExpressions
1Sum squared errors (SSE) i = 1 n q e , e x p q e , c a l c i 2
2Sum of absolute error (SAE) i = 1 n q e , e x p q e ,   c a l c
3Spearman’s correlation coefficient r s = 1 6 d i 2 n n 2 1
4Mean squared error (MSE) 1 n i = 1 N q e , e x p q e , c a l c 2
5Root mean square error (RMSE) 1 n i = 1 N q e , e x p q e , c a l c 2
6Average relative error (ARE) 1 n i = 1 n A i F i A i
Table 3. The N2 adsorption/desorption parameters for MC-AC.
Parameter (s)Value
BET surface area (m2/g)294.7
Mean pore diameter (nm)2.6
Total pore volume (cm3/g)0.17
Langmuir surface area (m2/g)553.2
Table 4. Model optimization based on statistical functions.
SourceSequential p-ValueLack of Fit p-ValueAdjusted R2Predicted R2
Linear<0.0001<0.00010.61930.5207
2FI0.01470.00020.77170.6582
Quadratic<0.0001<0.00010.90370.7244Suggested
Cubic0.01110.00880.98020.4464Aliased
Table 5. The ANOVA studies on the relationship between variables.
SourceSum of SquaresdfMean SquareF-Valuep-Value
Model 17,672.55141262.3219.77<0.0001significant
A—Dosage4447.5214447.5269.67<0.0001
B—Concentration1906.8811906.8829.87<0.0001
C—Time3732.2713732.2758.47<0.0001
D—pH2421.3812421.3837.93<0.0001
AB12.32112.320.19300.6671
AC291.381291.384.560.0508
AD94.28194.281.480.2444
BC35.40135.400.55460.4688
BD2319.8712319.8736.34<0.0001
CD580.091580.099.090.0093
A21239.2311239.2319.410.0006
B2167.281167.282.620.1278
C2314.281314.284.920.0435
D2855.901855.9013.410.0026
Residual893.721463.84
Lack of Fit8.86100.88630.48010.9383not significant
Pure Error7.3941.85
Cor Total18,566.2728
Table 6. The kinetic parameters of the adsorption of metronidazole.
Metronidazole
KineticsParametersError Functions
R2SAESSEAREMSERMSE
PFOLinearqe = 1.4507 ± 0.02343
K1 = 0.0204 ± 0.00121
0.99594.210.0893.450.00790.089
Non-Linearqe = 88.7539 ± 3.6312
K1 = 0.0534 ± 0.00352
0.99485.180.1124.120.01250.112
PSOLinearqe = 5.0981
K2 = 0.4898–0.00214
0.99930.870.0230.940.00050.023
Non-Linearqe = 233.2836 ± 3.5615
K2 = 0.0002363 ± 0.00001505
0.99891.940.0511.560.00260.051
Table 7. A comparative analysis of Langmuir and Freundlich using performance measures.
Metronidazole
IsothermParametersError Functions
R2SAESSEAREMSERMSE
LangmuirLinearqmax = 155.9164 ± 13.6682
KL = 0.000641
0.99297.533575.289015.389223.083811.5419
Non-Linearqmax = 218.5128 ± 7.8348
KL = 0.2668 ± 0.00441
0.97751.91794.62871.408835.210917.6098
FreundlichLinearn = 0.31138 ± 0.01367
Kf = 3.1749 ± 0.01367
0.99886.84365.35613.06319.5959.798
Non-LinearKf = 72.4403 ± 4.2367
1/n = 0.2667 ± 0.01681
0.98250.07020.14540.03260.8140.407
Table 8. The physicochemical characteristics of the water sample.
EntryParameterIndustrial WaterFiltered WaterWHO (2022)
1pH7.47 ± 0.0226.63 ± 0.0336.5–8.5
2Turbidity (NTU)4.214 ± 0.0522.11 ± 0.0140.5–5.0
3TDS (mg/L)841 ± 2.07509 ± 0.6991500
Table 9. Performance of the adsorbent compared with previous studies.
EntryAdsorbentsqmax (mg/g)ConditionsReference
1MWCNTs-ACs0.2pH 7, 25 ° C [69]
2Fe3O4-AC95.1 pH 7, 25 ° C [70]
3H3PO4-AC769.2pH 7, 25 ° C [71]
4Soybean hulls activated carbon51.3 pH 7, 25 ° C [72]
5Modified zeolite-iron oxide nanocomposites50.2pH 7, 25 ° C [73]
6Zinc ferrite nanomaterials14.7pH 7, 25 ° C [74]
7MC-AC72.4pH 7.5, 25 ° C This study
qmax: maximum adsorption capacity, MWCNTs-ACs: multiwalled carbon nanotube-activated carbon, Fe3O4-AC: magnetite-activated carbon, H3PO4-AC: phosphoric acid-activated carbon, MC-AC: maize cob-activated carbon, pH (7–7.5), and temperature: 25 ° C .
Disclaimer/Publisher’s Note: The statements, opinions and data contained in all publications are solely those of the individual author(s) and contributor(s) and not of MDPI and/or the editor(s). MDPI and/or the editor(s) disclaim responsibility for any injury to people or property resulting from any ideas, methods, instructions or products referred to in the content.