Article

Plastic-Free Alternatives for Oyster Reef Restoration: Laboratory and Field Trials to Determine Efficacy and Environmental Impacts of Novel Restoration Materials

1
Department of Biology, University of Central Florida, 4000 Central Florida Blvd., Orlando, FL 32816, USA
2
Center for Integrated Coastal Research, University of Central Florida, 4000 Central Florida Blvd., Orlando, FL 32816, USA
*
Author to whom correspondence should be addressed.
Environments 2026, 13(7), 386; https://doi.org/10.3390/environments13070386
Submission received: 20 May 2026 / Revised: 26 June 2026 / Accepted: 3 July 2026 / Published: 7 July 2026

Abstract

Community-based oyster reef restoration historically involved deploying plastic-based restoration units. However, many practitioners now seek to eliminate plastic usage due to environmental concerns. Scientific investigation into the efficacy and environmental safety of novel, non-plastic restoration products is limited. Four non-plastic shell bag materials (three biopolymers, one basalt fiber) were tested in field and laboratory studies, using plastic controls. In Mosquito Lagoon, FL, USA, a subtropical estuary, units at four restored reefs were monitored quarterly for one year. A 12-month laboratory study examined these same materials and their potential to shed microparticles. In the field, all biopolymers exhibited low persistence (≤17% remaining after 12 months). Basalt had high persistence (96%), but developed large rips by the end of the study. Oyster recruitment was negatively associated with damage to shell bags due to substrate loss. In the laboratory, basalt fiber shed high numbers of thin, rod-like microparticles (1987.4 microparticles/year ± 256.4 SE). Other materials shed <5 microparticles/year on average. Low durability of experimental materials emphasizes the need for more resilient restoration products that can withstand conditions in subtropical marine ecosystems. It is unknown if basalt microparticles impact marine environments, but further study is imperative given the high volume that was shed.

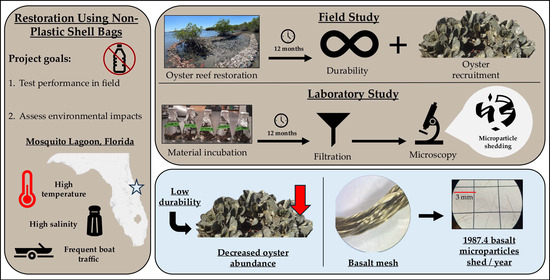
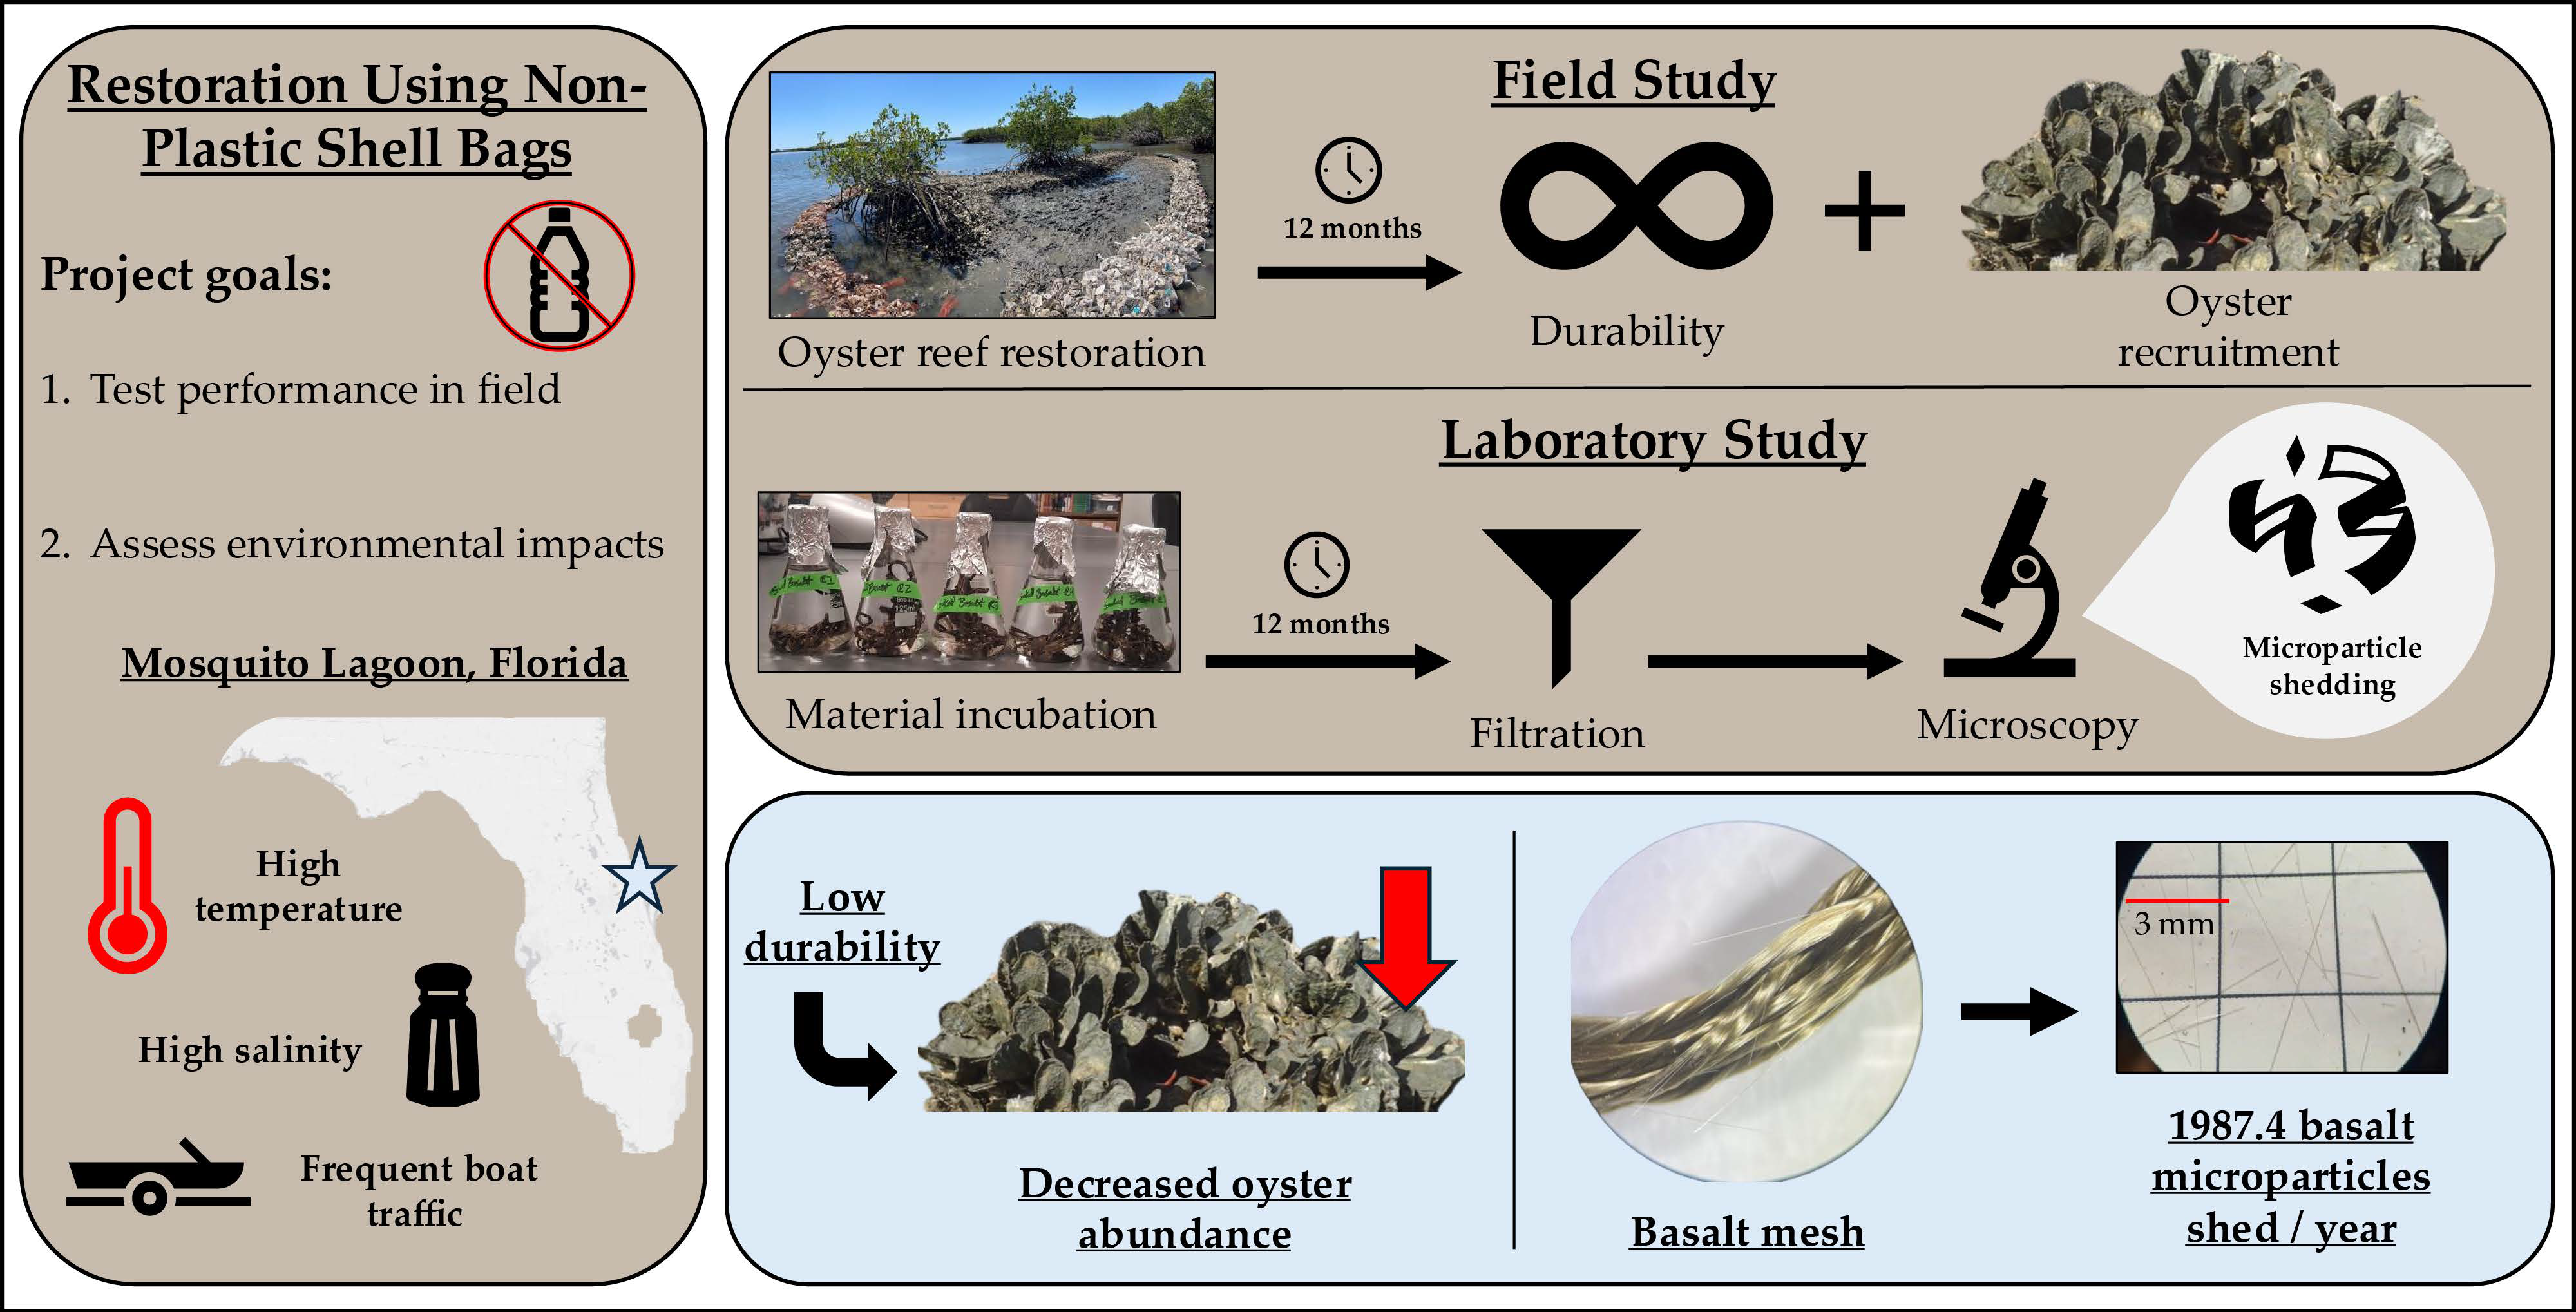
Graphical Abstract

1. Introduction

The eastern oyster, Crassostrea virginica, is a reef-forming bivalve that is found in estuaries along the Atlantic coast of the Americas from the Gulf of St. Lawrence to Argentina [1]. Oysters provide many valuable ecosystem services such as nutrient cycling, water–benthic coupling, shoreline protection, and habitat creation, as well as acting as a food source for many organisms, including humans [2,3]. As a result of overharvest and habitat degradation, it is estimated that 85% of oyster reefs have been lost worldwide, with oysters considered functionally extinct in some areas [4]. The decline of this economically and environmentally valuable species has inspired global conservation efforts, with oyster reef restoration being a common strategy to combat oyster decline.
Oyster reef restoration techniques vary depending on environmental factors and drivers of oyster loss. For example, spat-on-shell is a method in which oyster larvae are allowed to settle onto recycled oyster shells in an aquaculture setting before the shells are relocated to a restoration site. The spat-on-shell technique is often utilized in areas with limited oyster recruitment [5], while substrate supplementation or breakwaters suffice in areas with adequate spat availability [6,7]. In many large-scale projects, loose mollusk shell is deposited in piles at restoration sites [5,8], while small-scale projects or those in locations with high wave energy utilize individual restoration units such as shell bags (mesh material filled with recycled oyster shell), concrete structures (e.g., ReefBalls™), or cement mixed with natural material [9,10]. In general, oyster reef restoration is a well-studied conservation strategy that often yields successful results, i.e., [11,12]. However, there has been a recent increase in novel oyster restoration products on the market for which efficacy has not been scientifically tested.
Many new restoration products have been developed in response to concerns about the use of plastic materials in restoration [10,13]. Historically, shell bags and oyster mats (flat mesh mats with attached recycled oyster shell) were made of polyethylene (PE) plastic, but heightened attention to marine debris and microplastic (MP) pollution has encouraged a shift away from plastic-based restoration materials [10,13]. Marine organisms may ingest or become entangled in plastic debris [14], and this debris eventually breaks down through photodegradation and mechanical stress into micro- (1 µm–5 mm) and nano- (<1 µm) plastics [15,16]. Many laboratory studies have linked MP exposure in marine invertebrates to altered reproduction and mortality [17,18,19]. Chambers et al. (2026) [16] estimated that a 500-foot (152.4 m) restoration project that utilizes 1200 PE plastic shell bags would release an average of 20 million MPs in its first year post-deployment.
While there is a trend in the oyster restoration community of moving away from plastic restoration materials [10], scientific study into the overall success of novel materials deployed in the field is still emerging (Table 1). The literature that does exist raises questions about the longevity of many non-plastic restoration materials. For example, Comba et al. (2023) [20] report total failure of shell bags made of natural fiber only two months post-deployment in a Texas, USA, estuary. Similarly, restoration units made of galvanized steel wire fully disintegrated after three years in Florida, USA [16]. Our understanding of the longevity of many non-plastic restoration materials is limited by the relatively short time that they have been available on the market [10].
The environmental impacts of novel restoration materials should also be carefully considered. Plastics are considered harmful due to their proclivity to shed micro- and nanoparticles, absorb or leach chemical pollutants, and act as vectors for invasive species and disease [15,29,30,31]. Novel restoration materials should also be investigated for their potential to shed microparticles, cause physical or chemical pollution, or alter biogeochemical cycling. For example, studies have documented heavy metal pollution from galvanized steel restoration products [16], and high amounts of nutrient leaching from natural fiber and biopolymer products [16,22]. Additionally, the biodegradation products of popular biodegradable polymers such as (poly)lactic acid (PLA) and (poly)butylene adipate terephthalate (PBAT) are documented to be potentially toxic in the marine environment [32,33,34]. The results of these studies emphasize that novel, non-plastic restoration materials should be examined more thoroughly before they are widely adopted by restoration practitioners.
The goal of this study is to fill knowledge gaps related to material durability and environmental impacts of four novel restoration materials. We focus on four non-plastic shell bag materials that are becoming popular among restoration practitioners, using traditional PE shell bags as controls. Regarding durability, we hypothesize that non-plastic materials will degrade more quickly than PE controls in a field setting. We will assess this relationship by monitoring persistence and damage to restoration units in a 12-month field study. We will also document live oyster abundance and shell heights in experimental units at the end of this study. Environmental impacts will be examined in the context of microparticle shedding in a 12-month laboratory experiment. We hypothesize that basalt fiber will shed more microparticles than plastic mesh due to its composition of many small, loosely woven fibers. We additionally hypothesize that biopolymers will shed an equal number of microparticles as plastic mesh.

2. Materials and Methods

2.1. Experimental Materials

This study examines four non-plastic mesh materials that are advertised for use as oyster shell bags, using DelStar Technologies (Middletown, DE, USA) Naltex® aquaculture-grade polyethylene (PE) plastic mesh as a control (Table 2). These aquaculture-grade plastic mesh bags have been used in coastal restoration for decades and were historically the standard material used to make shell bags [35,36,37]. Three experimental materials are biopolymer products from Biodegradable EcoSystem Engineering (BESE®; Culemborg, The Netherlands; https://www.bese-products.com/ accessed on 15 May 2026). BESE® products are certified biodegradable by TÜV AUSTRIA OK compost (Vienna, Austria) and are advertised by the company to persist in the natural environment for 1–20 years depending on environmental conditions [38]. These materials have a mesh size of 1 cm and are primarily composed of either PLA or PBAT, with various fillers that make each biopolymer distinct (Table 2). Hereafter, these materials will be referred to as orange mesh #1, orange mesh #2, and white mesh, respectively (Table 2). Natrx® ExoFlex oyster bags (Raleigh, NC, USA; https://natrx.io/natrx-exoflex-oyster-bags accessed on 15 May 2026), hereafter referred to as basalt mesh, were also tested in this study. Basalt mesh is knitted from yarn made with uncoated basalt fibers, which are formed by heating basalt rock to between 1500 and 1700 °C, then drawing out thin filaments that are spun into yarn [39]. Basalt mesh is advertised to be UV stable and non-toxic [40].
All restoration units were made at community volunteer events at Marine Discovery Center (MDC), a non-profit organization in New Smyrna Beach, FL, USA, on 29 May and 8 June 2024. Each bag was filled with approximately 5 gallons (18.9 L) of oyster shell (C. virginica) that was recycled from local restaurants and kept outdoors on a paved surface under full sun for a minimum of six months before use in restoration. Because bags are sold in different forms, the process of filling restoration units differed between materials. Plastic mesh, white mesh, and each orange mesh are manufactured as sleeves in rolls of up to 500 m in length. To make a restoration unit with these materials, they were cut into 1.25 m sections with one knotted end. The unit was filled with oyster shell, then tied at the other end with a final length of approximately 1 m. Basalt mesh is sold as individual bags, and after being filled with shell they were closed using a 12-inch (30.5 cm) stainless-steel zip tie.

2.2. Field Study Methods

2.2.1. Study Location

Field trials took place in Mosquito Lagoon (ML), the northernmost basin of the Indian River Lagoon (IRL) system in East–Central Florida (Figure 1). The IRL hosts high biodiversity, with over 4000 plant and animal species recorded to date within its bounds [41]. ML is a subtropical, microtidal estuary with an estimated mean water half-life of 76 days [42]. It is connected to the IRL through Haulover Canal on its southern end, and to the Atlantic Ocean at Ponce de Leon Inlet at its northern end. Water circulation within ML is driven primarily by wind and thus changes in directionality with varying atmospheric conditions [43]. Water temperatures in ML regularly exceed 30 °C in the summer and drop to between 10 °C and 15 °C in the winter [42]. Its long water residence time and limited connection to outside water bodies make it susceptible to fluctuations in salinity, with values ranging from 22.6 to 45.2 psu throughout the year [42].
Mosquito Lagoon is characterized by intertidal oyster reefs and shorelines dominated by red (Rhizophora mangle) and black (Avicennia germinans) mangroves. Historically, oyster reefs covered 61.07 hectares of shoreline in the lagoon, but their area has declined, especially in the past decade. As of 2021, it was estimated that 25.96 hectares of live reefs remain in ML [11]. ML is a popular tourist destination for recreational boating and fishing. Wake energy associated with high boat traffic is linked with oyster decline in ML [7]. On average, oyster reefs in ML are passed by 11.26 boats/h, with resulting wake heights ranging from 0.1 cm to 20.8 cm [7]. Restoration efforts have been underway in ML since 2007 to stabilize disarticulated oyster shells to make reefs more resilient to wave energy [7]. Approximately 75% of oyster reef restoration in ML has been considered to be successful over the long term (≥5 years), supporting that ML restoration methods are effective for this highly trafficked region [11].

2.2.2. Reef Restoration

On 30 May 2024, the margins of three dead oyster reefs in ML (reefs 1–3) were restored by raking down mounds of dead shell to the mean low water level and restabilizing the sediment and loose shell (Figure 1). The seaward edge of each reef was stabilized by a breakwater of experimental restoration units. At reefs 1–3, each material treatment was arranged in blocks of five restoration units of a single treatment, with five spacer bags made of plastic mesh between each experimental group for a total of 30 experimental units and 45 spacer bags at each reef (Figures S1 and S2). Spacer bags were identical to control plastic mesh bags, but were not monitored. At reef 4, which was restored using the same methods as above on 10 July 2024, there were no spacer bags (Figure S1). The purpose of using spacer bags was to ensure that each experimental block was bordered by the same material, thus mitigating edge effects. Since only one material was present at reef 4, spacer bags were not deemed necessary. Breakwaters at reefs 1, 2, and 3 were composed of orange mesh #1 (n = 10), orange mesh #2 (n = 10), and white mesh (n = 10), with experimental plastic mesh (n = 10) as a control. The breakwater at reef 4 was composed of only basalt mesh restoration units (n = 25). The later deployment and smaller sample size of basalt mesh was due to limitations of product availability from the manufacturer.

2.2.3. Monitoring

Salinity and water temperature data for the duration of the experiment were obtained from public data made available by the St. Johns River Water Management District (https://www.sjrwmd.com/data/ accessed on 27 March 2026). Data from station IRLML02 was used because it was the nearest continuous monitoring station to the restored reefs.
After restoration unit deployment, quarterly monitoring began at reefs 1, 2, and 3 in July 2024. Quarterly monitoring continued at all four reefs in winter, spring, and summer of 2025. At each monitoring event, it was noted what restoration units were missing, if any, and units that had degraded and no longer had the structural integrity to contain oyster shell were recorded and removed. Every remaining experimental restoration unit was examined for visible rips in the mesh. The length and width of each rip was measured to the nearest millimeter using a ruler, and the total count of rips in each bag was recorded. Rip dimensions were used to calculate damaged area, which was summed to obtain total damaged area per restoration unit.
At the end of one year, all experimental restoration units were removed from the reef to quantify oyster settlement. Each restoration unit was transferred to a plastic tub by teams of two to three people to prevent the loss of oyster shell. Once in a tub, the restoration units were cut open and the oyster shell inside them was examined for live C. virginica. Loose oyster shells were sorted haphazardly, and shell height was recorded for the first 50 live C. virginica that were encountered in each bag, after which all remaining live C. virginica were tallied to obtain a total abundance [44]. After monitoring concluded, all oyster shell from inside the restoration units was returned to the lagoon.

2.3. Laboratory Study Methods

2.3.1. Experimental Setup

In order to detect potential microparticle shedding from all restoration materials, laboratory trials were conducted using vacuum filtration and microscopy. Six material treatments were tested: (1) orange mesh #1, (2) orange mesh #2, (3) white mesh, (4) basalt mesh, (5) pre-soaked basalt mesh, and (6) plastic (PE) mesh. In the pre-soaked basalt treatment, basalt mesh was soaked in filtered DI water for 24 h prior to the experiment and was then transferred to a new flask to begin the experiment. This treatment was added to determine if a pre-soaking period would reduce or eliminate microparticle shedding. Control flasks were prepared that contained only 0.45 µm filtered artificial seawater (30 ppt) made with InstantOcean™ salts (Blacksburg, VA, USA).
For each replicate, a 5 × 5 cm section of material was placed into a glass Erlenmeyer flask containing 125 mL of filtered artificial seawater. Each treatment, including controls, had five replicates for a total of 40 flasks. Each flask was tightly capped with aluminum foil after the material was placed inside. Flasks were randomly placed across three shaker tables with their position determined by drawing numbers out of a hat. Shaker tables were kept at ~23 °C, revolving at 60 rpm to simulate gentle wave action. Throughout the 12-month study, all shaker tables were kept in a room with fluorescent lights that were turned on ~8 h per day. Natural light was limited to one partially obstructed window located approximately 6 m from the shaker tables.

2.3.2. Protocols to Avoid Contamination

Contamination from aerial and waterborne microparticles can negatively impact the reliability of microparticle data [45]. In this study, protocols were followed to avoid and account for microparticle contamination from outside sources. All artificial seawater was prepared to a salinity of 30 ppt using InstantOcean™ sea salt and was then filtered through 0.45 µm filter paper to remove undissolved particles and contaminants. All DI water was also filtered through 0.45 µm filter paper before being introduced to the experiment. In addition, all equipment, tools, and containers were triple-rinsed with 0.45 µm filtered DI water prior to and between handling each replicate [46].
In order to account for aerial contamination during microscopy, five blank Petri dishes were placed around the work area [47]. Blanks were prepared by placing a 0.45 µm gridded cellulose filter paper in a triple-rinsed Petri dish and dampening it with approximately 1.5 mL of filtered DI water. Blanks were kept open while samples underwent microscopy. At the end of each microscopy session, blanks were examined under the microscope to enumerate microparticles that had settled onto the filter paper. Data from the blanks will be used to calculate the rate of aerial contamination in the laboratory.

2.3.3. Sample Processing

Once every four weeks for one year (13 times total), the contents of each flask were vacuum-filtered through 0.45 µm gridded cellulose filter paper. To accomplish this, each flask was gently swirled, then the liquid contents were poured into a vacuum filter, taking care that the 5 × 5 cm piece of material stayed inside the flask. To ensure that no loose microparticles remained adhered to the glassware, the interior of the flask was then rinsed three times with 50 mL of filtered DI water, and each rinse was poured into the vacuum filter [46]. After this, the flask was refilled with 125 mL of filtered artificial seawater and replaced in its position on the shaker table. The filter paper was transferred to a triple-rinsed Petri dish and sealed until further processing.
Filter papers were examined under a Leica EZ4 (Wetzlar, Germany) stereo microscope at 40× magnification to enumerate and measure microparticles. For each sample, the following information was recorded: start and end time, microparticle number, microparticle type (e.g., microplastic fiber, natural fiber, fragment, film, and basalt fiber), color, and size. Size measurements were made using 3 × 3 mm grids on the filter paper, and were rounded to the nearest 0.25 mm. Because woven basalt is a novel material in this experiment, portions of the virgin material were examined under a microscope to determine the appearance of fibers prior to the beginning of the trial. Basalt fibers were defined as straight, rigid, brittle fibers with a transparent, tan coloration. Thus, these microparticles were very easy to differentiate from MPs or natural fibers. The other materials were morphologically distinct based on color (e.g., orange mesh) or microparticle type (microplastic fiber vs. natural fiber). Because each material had a distinct appearance that would not be easily confused with outside contaminants, we did not perform Fourier Transform Infrared spectroscopy (FTIR) on microparticles in this study.

2.3.4. Mass Change

In order to quantify mass change in materials, each section of material, excluding the soaked basalt, was weighed on a Fisher Science Education ALF64 analytical balance prior to the start of the experiment, and again at the end of the experiment. Before taking final measurements, materials were placed in a Fisher Scientific Isotemp Oven (Waltham, MA, USA) at 50 °C for 48 to 92 h to ensure that they were fully dry.

2.4. Statistical Analyses

All statistical analyses were performed using R version 4.5.2 [48]. All generalized linear mixed effects models (GLMMs) were run using the packages glmmTMB [49] or lme4 [50]. Pairwise comparisons were made using emmeans [51]. Model fit was assessed using diagnostic plots and tests from packages DHARMa [52] and performance [53].

2.4.1. Field Study Analysis

In order to analyze the effect of material on restoration unit persistence, a Cox proportional hazards model with Firth’s penalized likelihood was used due to complete separation of some treatment levels [54]. A test of the proportional hazards assumption was not significant (p = 0.15), but visualization of the residuals showed clear temporal trends. To account for this, a piecewise proportional hazard was applied to the model with breaks at three-month intervals [55]. Pairwise comparisons of each material treatment were performed using the Wald test and p-values were adjusted for multiple comparisons using the Benjamini–Hochberg procedure. A custom function to perform these pairwise comparisons was written in R with the assistance of M365 Copilot (based on GPT-5 chat model, https://www.microsoft.com/microsoft-365/copilot, accessed on 3 January 2026), the output of which was carefully reviewed and edited by the authors [56].
Damage area per restoration unit was calculated using the following formula:
D a m a g e = 1 n ( r i p   l e n g t h   ×   r i p   w i d t h )
Damaged area in restoration units was analyzed using a gamma generalized linear model (GLM) with a fourth-order polynomial fit with damaged area as a function of time. Material treatment was not included in the model due to differences in replication number over time, as some materials did not persist to the end of the study. Mean and standard error of tear number and damaged area per restoration unit were calculated for each material type at each quarter.
Live oyster abundance was analyzed using a zero-inflated negative binomial GLMM with oyster abundance as a function of material treatment and reef as a random effect. Restoration units that did not persist to the end of the study were included in this analysis with a live oyster abundance equal to zero. However, the performance of white mesh could not be modeled due to the fact that all white mesh restoration units were non-functional by the end of the study. Average shell height of live oysters was analyzed using an identity-linked gamma GLMM with shell height as a function of material treatment and a random effect of reef.
We used a two-part model to examine the impacts of restoration unit damage on oyster recruitment [57]. If a restoration unit did not persist to the end of the study, its most recent damaged area measurement was used for this analysis. Basalt mesh units did not have individual tag numbers, and as a result damaged area measurements could not be linked to specific oyster abundances. Thus, basalt mesh was not included in these analyses. In the first model, oyster abundance was converted to a binary presence/absence variable. A logistic regression was run with oyster presence as a function of damaged area. In the next model, only oyster abundance from units that persisted to the end of the study were included. We analyzed this data using a negative binomial GLMM with oyster abundance as a function of damaged area and reef as a random effect.

2.4.2. Laboratory Study Analysis

Contamination rates in control samples were calculated by finding the average number of microparticles per flask over the course of the study. Only microparticles that could potentially be confused for the experimental materials were counted. Criteria for microparticles to include were as follows: black MP fiber or fragment, orange MP fiber or fragment, white MP fiber or fragment, or tan, rod-like microparticle. Aerial contamination was calculated by finding the average number of microparticles on blanks per minute of exposure time. Only microparticles that fit the above criteria were included for this calculation.
The relationship between microparticle shedding and material treatment over time was analyzed using a negative binomial GLMM. Microparticle count was used as a response, with time and material type as predictors. Replicate was treated as a random effect to account for any variation between individual flasks. Microparticle size was analyzed as a function of time and material treatment using a negative binomial GLMM. Replicate was treated as a random effect.
Mass change in materials was analyzed using a gamma GLMM with an identity link function. Proportion of mass remaining was calculated for each replicate using the following formula:
p r o p o r t i o n = f i n a l   m a s s i n i t i a l   m a s s
Proportion was modeled as a function of material treatment with replicate as a random effect.

3. Results

3.1. Field Study Results

Average water temperature over the course of the field study was 25.25 °C (± 0.05 SE), with a maximum value of 33.29 °C and a minimum value of 9.06 °C. The salinity monitoring station sustained damage from a hurricane in August 2024 and had several days of anomalous readings before being fixed. Because of this, data from 28 August through 2 September 2024 were excluded from the dataset. Average salinity was 31.10 ppt (± 0.03 SE), with a maximum value of 36.95 ppt and a minimum of 23.18 ppt.
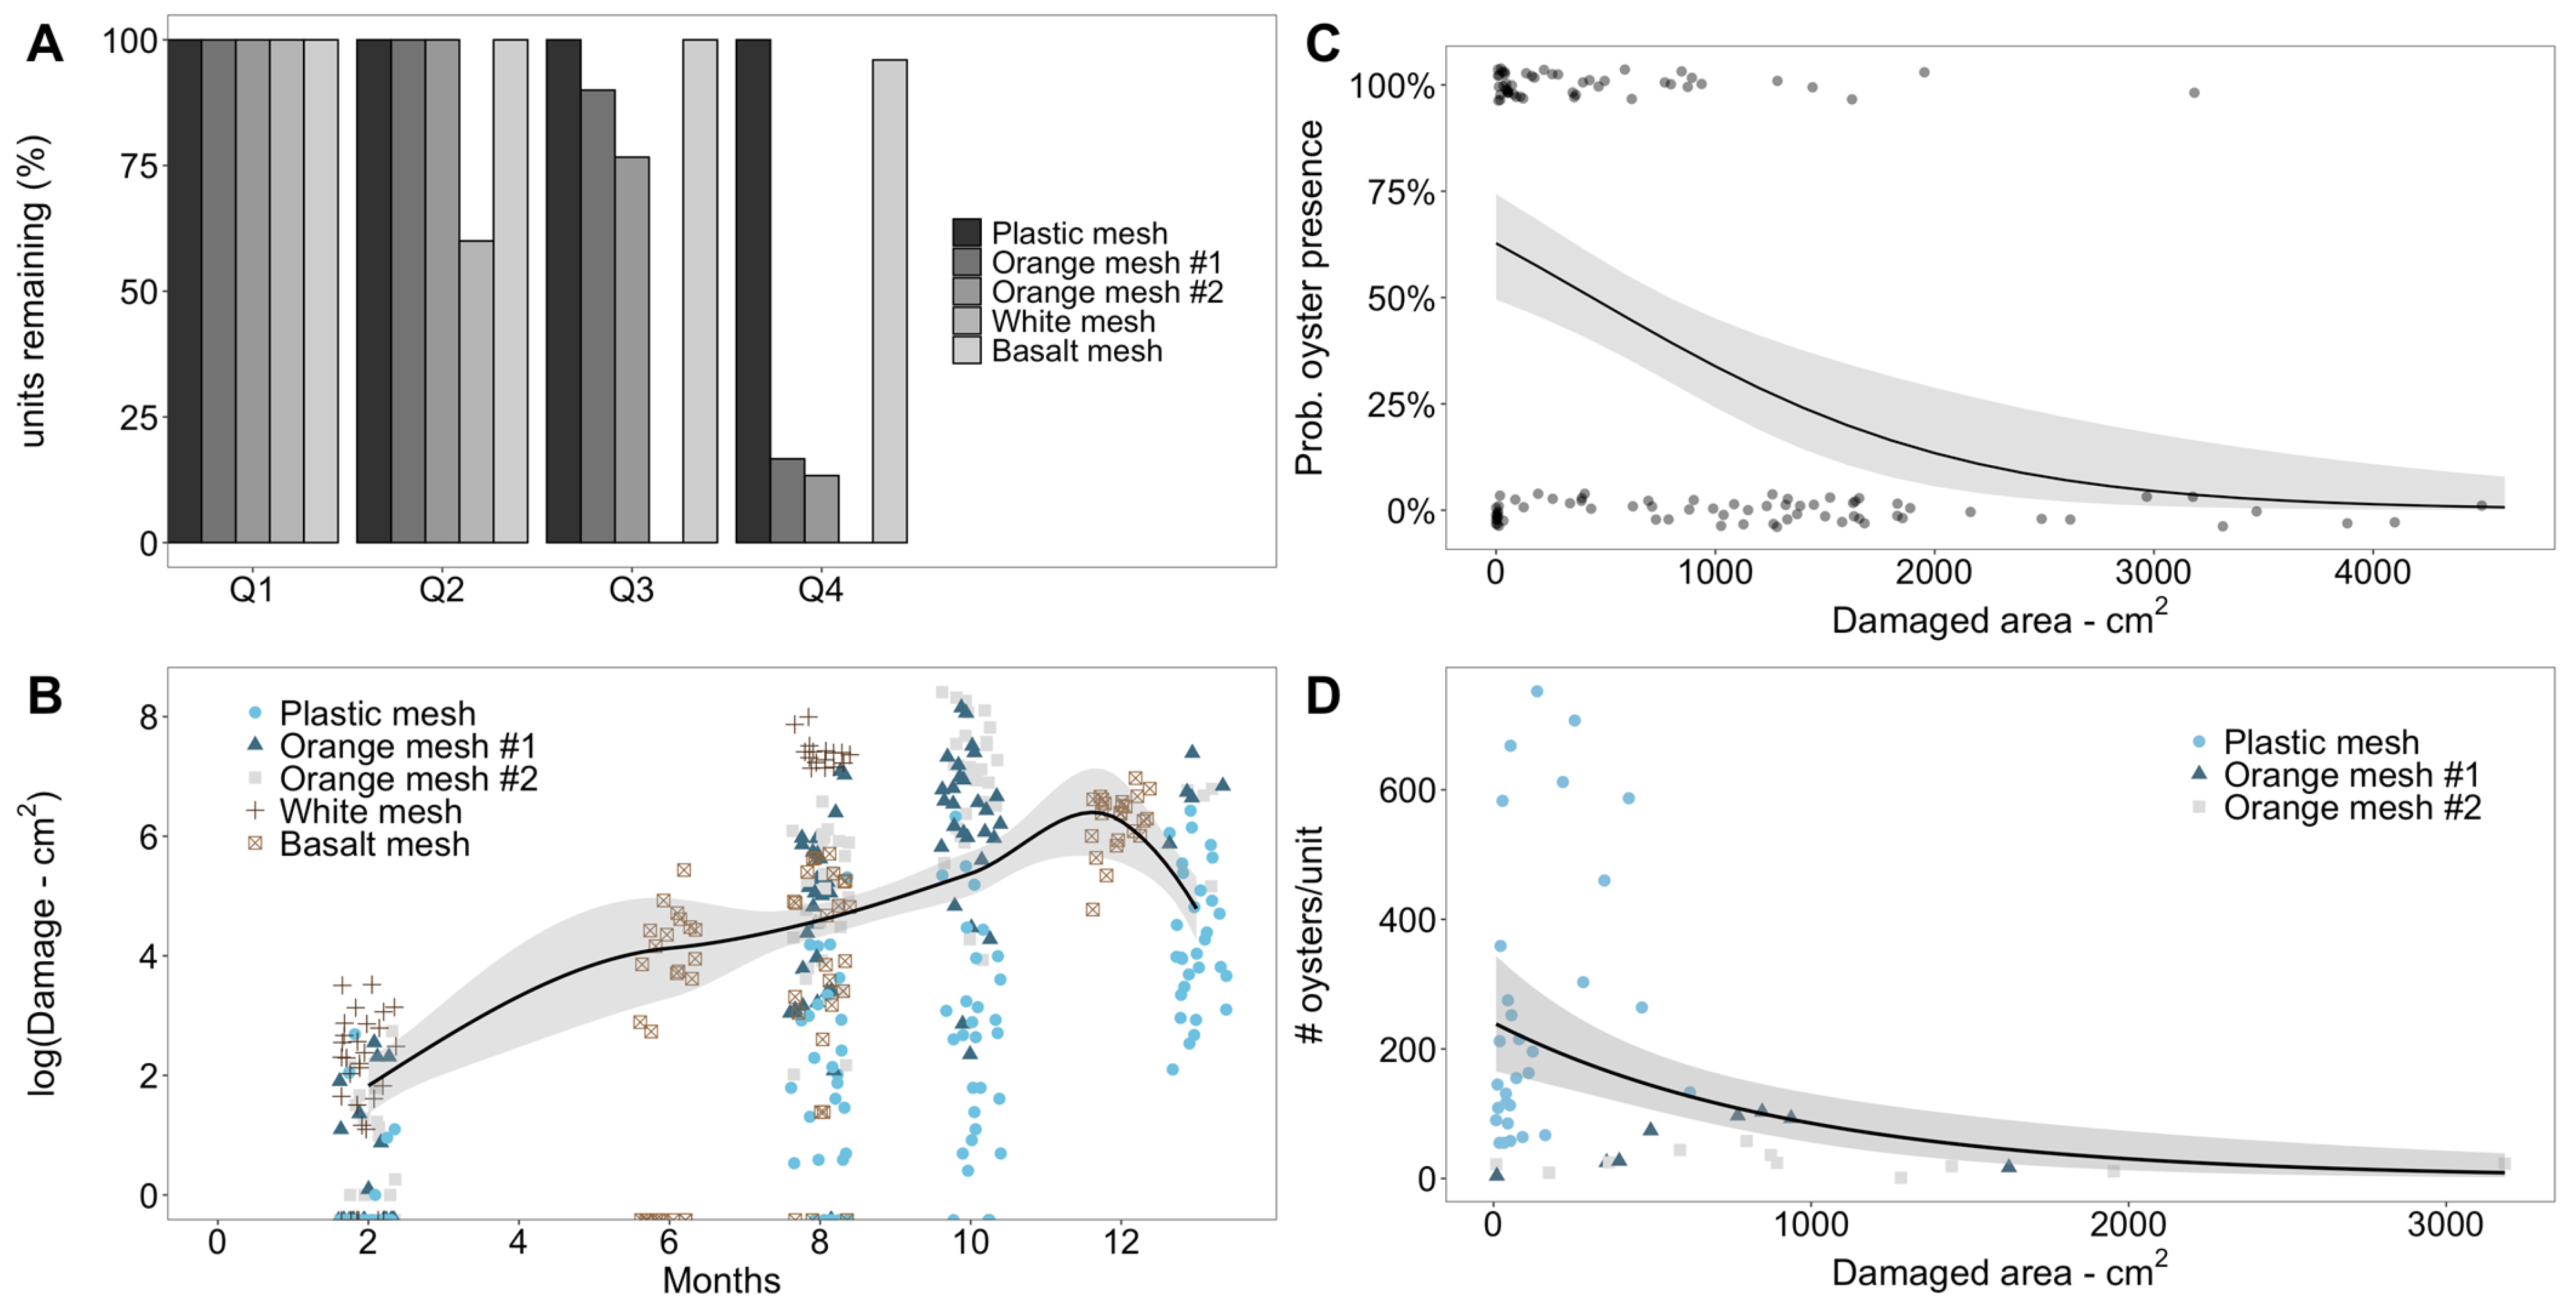
Restoration unit persistence varied significantly across material type (Firth-adjusted Cox proportional hazards model: p < 0.05). Plastic mesh and basalt mesh had the highest persistence with 100% and 96% of units remaining at the end of the study period, respectively (Figure 2A). Orange mesh #1 (16.7%) and orange mesh #2 (13.3%) persistence was significantly lower. All white mesh restoration units became non-functional between eight and ten months post-deployment.
Time significantly impacted damaged area in all restoration units regardless of material treatment (gamma GLM: p < 0.001; Figure 2B and Figure 3). Damaged area increased through the third quarter, after which it leveled off in the fourth quarter. This pattern in the fourth quarter followed a large loss of experimental units (n = 42). The number of tears per unit increased over time for all material treatments except white mesh, likely due to the fact that numerous small tears coalesced into fewer, larger tears over time. Mean damaged area per restoration unit increased by several orders of magnitude between the first and second quarter (Table 3).
Oysters successfully recruited to all remaining material treatments, but recruitment varied significantly across material types (negative binomial GLMM: p < 0.05; Table 4). Plastic mesh units had the highest recruitment (266.2 oysters/unit ± 40.0 SE), followed by basalt mesh (114.3 oysters/unit ± 14.7 SE), orange mesh #1 (14.7 oysters/unit ± 5.8 SE), and orange mesh #2 (9.9 oysters/unit ± 2.8 SE). Oyster shell height was significantly lower in plastic mesh units than in orange mesh #1 or orange mesh #2 units (gamma GLMM: p < 0.001), but otherwise there were no significant differences in shell height between treatments (Table 4).
The probability of oyster presence in a restoration unit decreased significantly with damaged area (binomial GLM, p = 0.0002), with less than a 20% chance of finding live oysters in a restoration unit with damage greater than 2000 cm2 (Figure 2C). In restoration units that contained live oysters, greater damage was associated with decreased oyster abundance (Figure 2D; negative binomial GLMM, p = 0.0006).

3.2. Laboratory Study Results

Average microparticle contamination in control flasks was 10 (± 2.5 SE) microparticles/flask/year. In microscopy blanks, average aerial microparticle contamination was 0.001 (± 0.000 SE) microparticles/minute/blank. Following examples in the literature, no correction factor was applied to the data due to the low amounts of contamination that were present [16,58]. Mean microscopy time for each sample was 9.9 (± 0.5 SE) minutes.
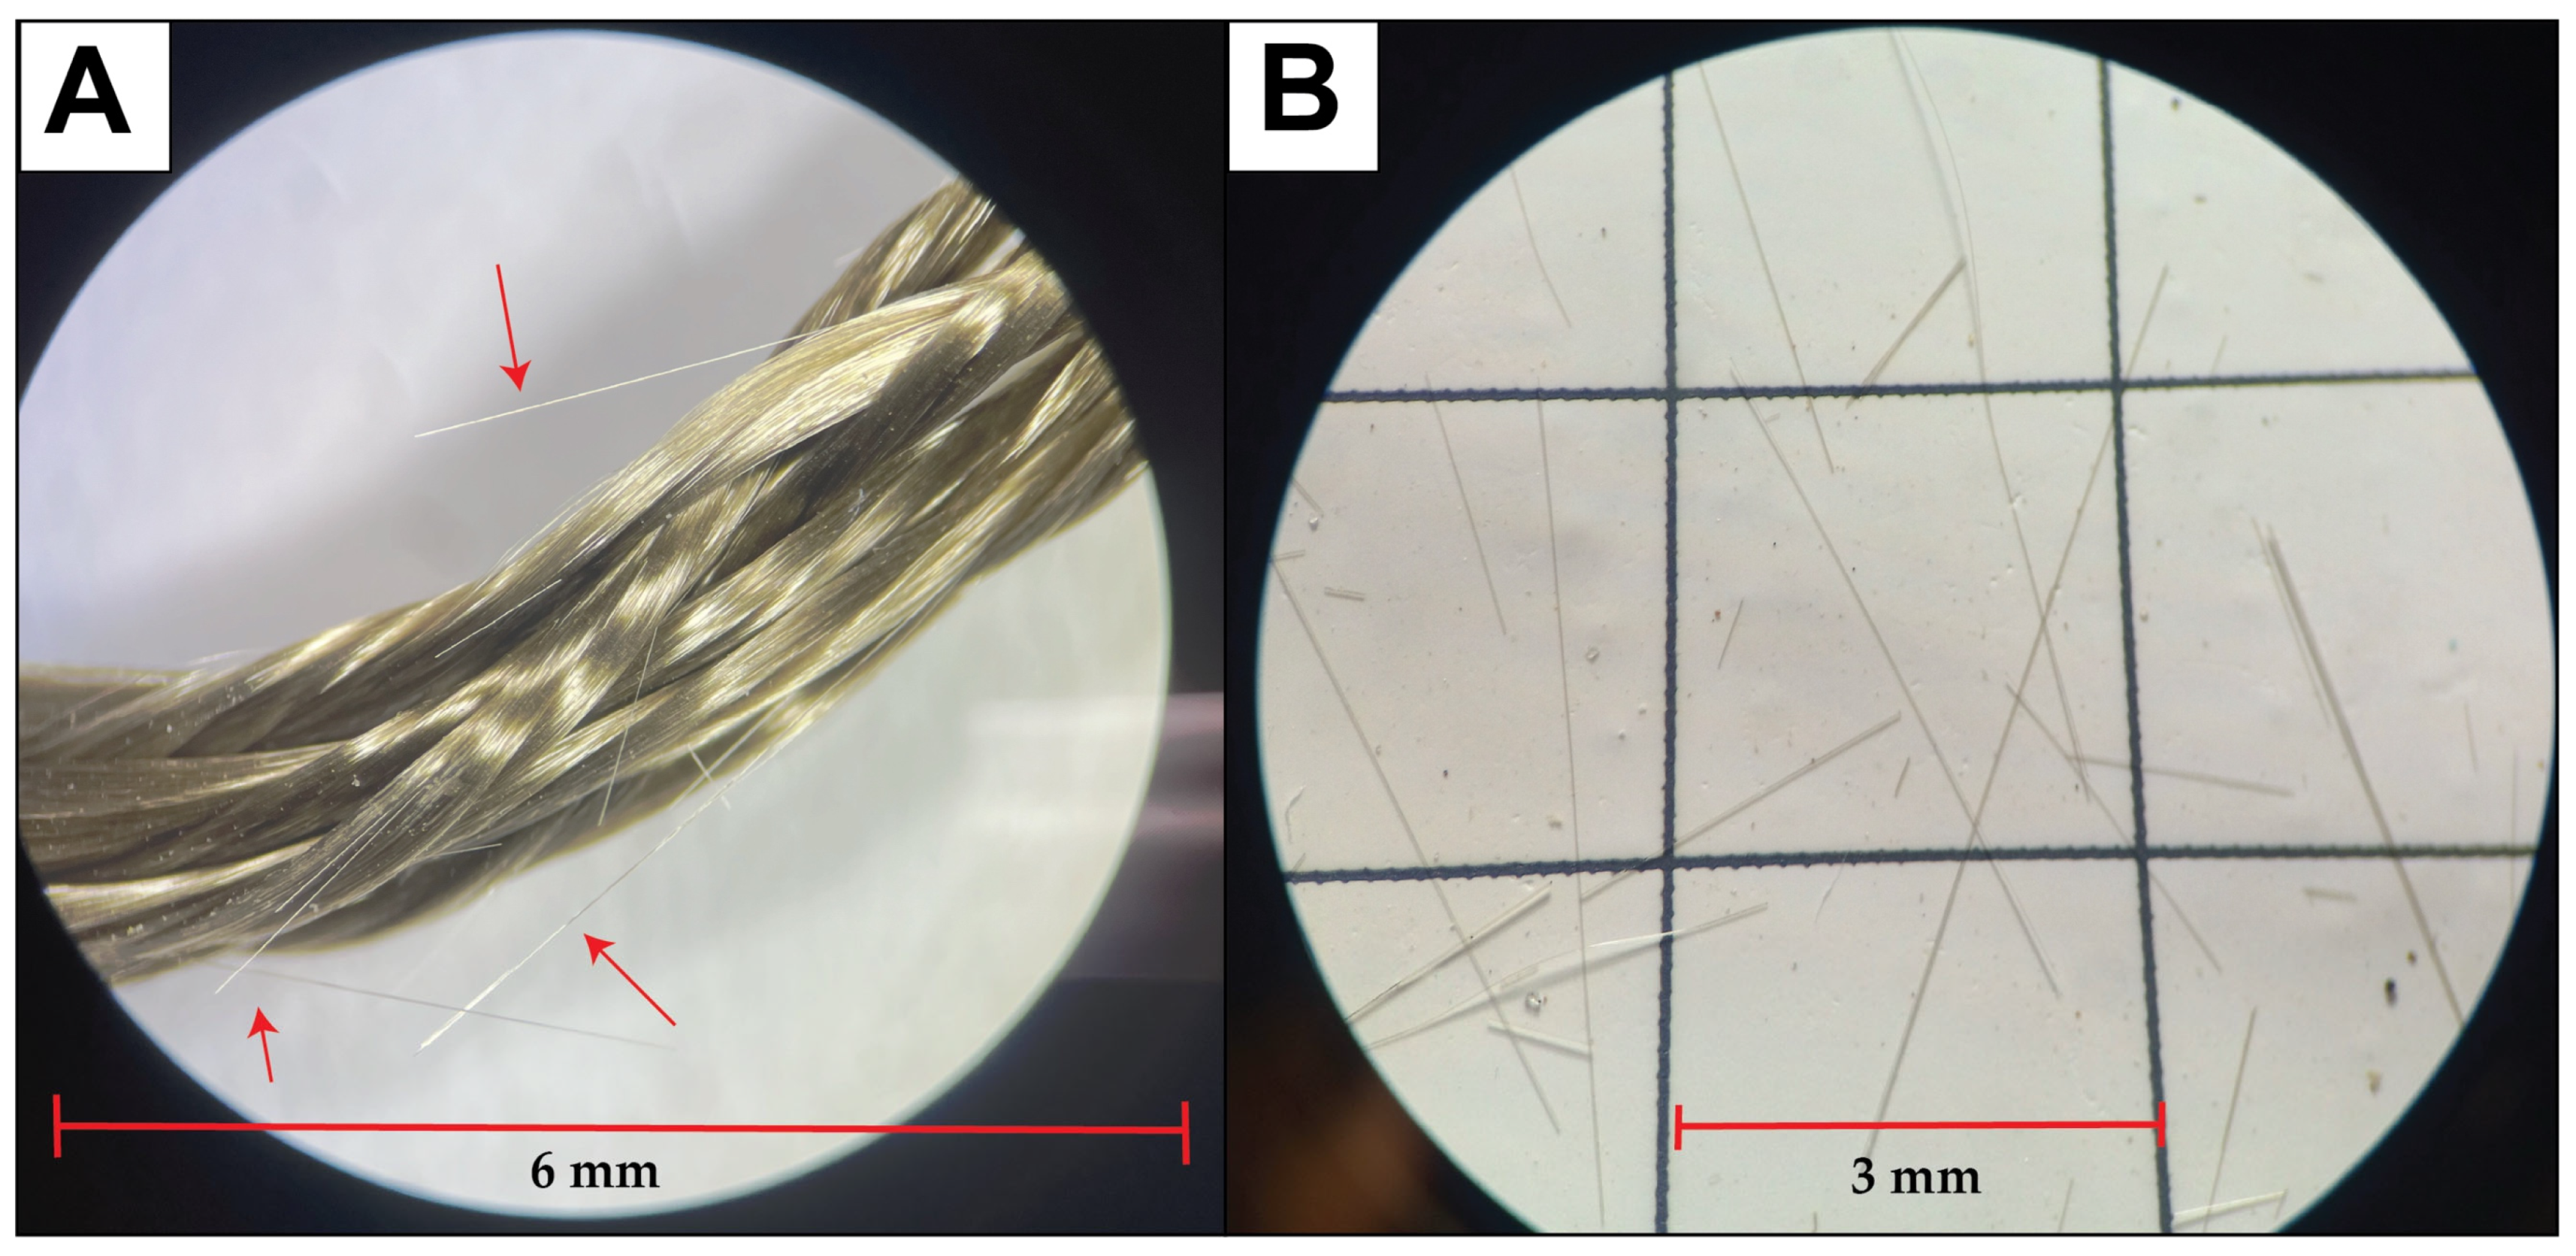
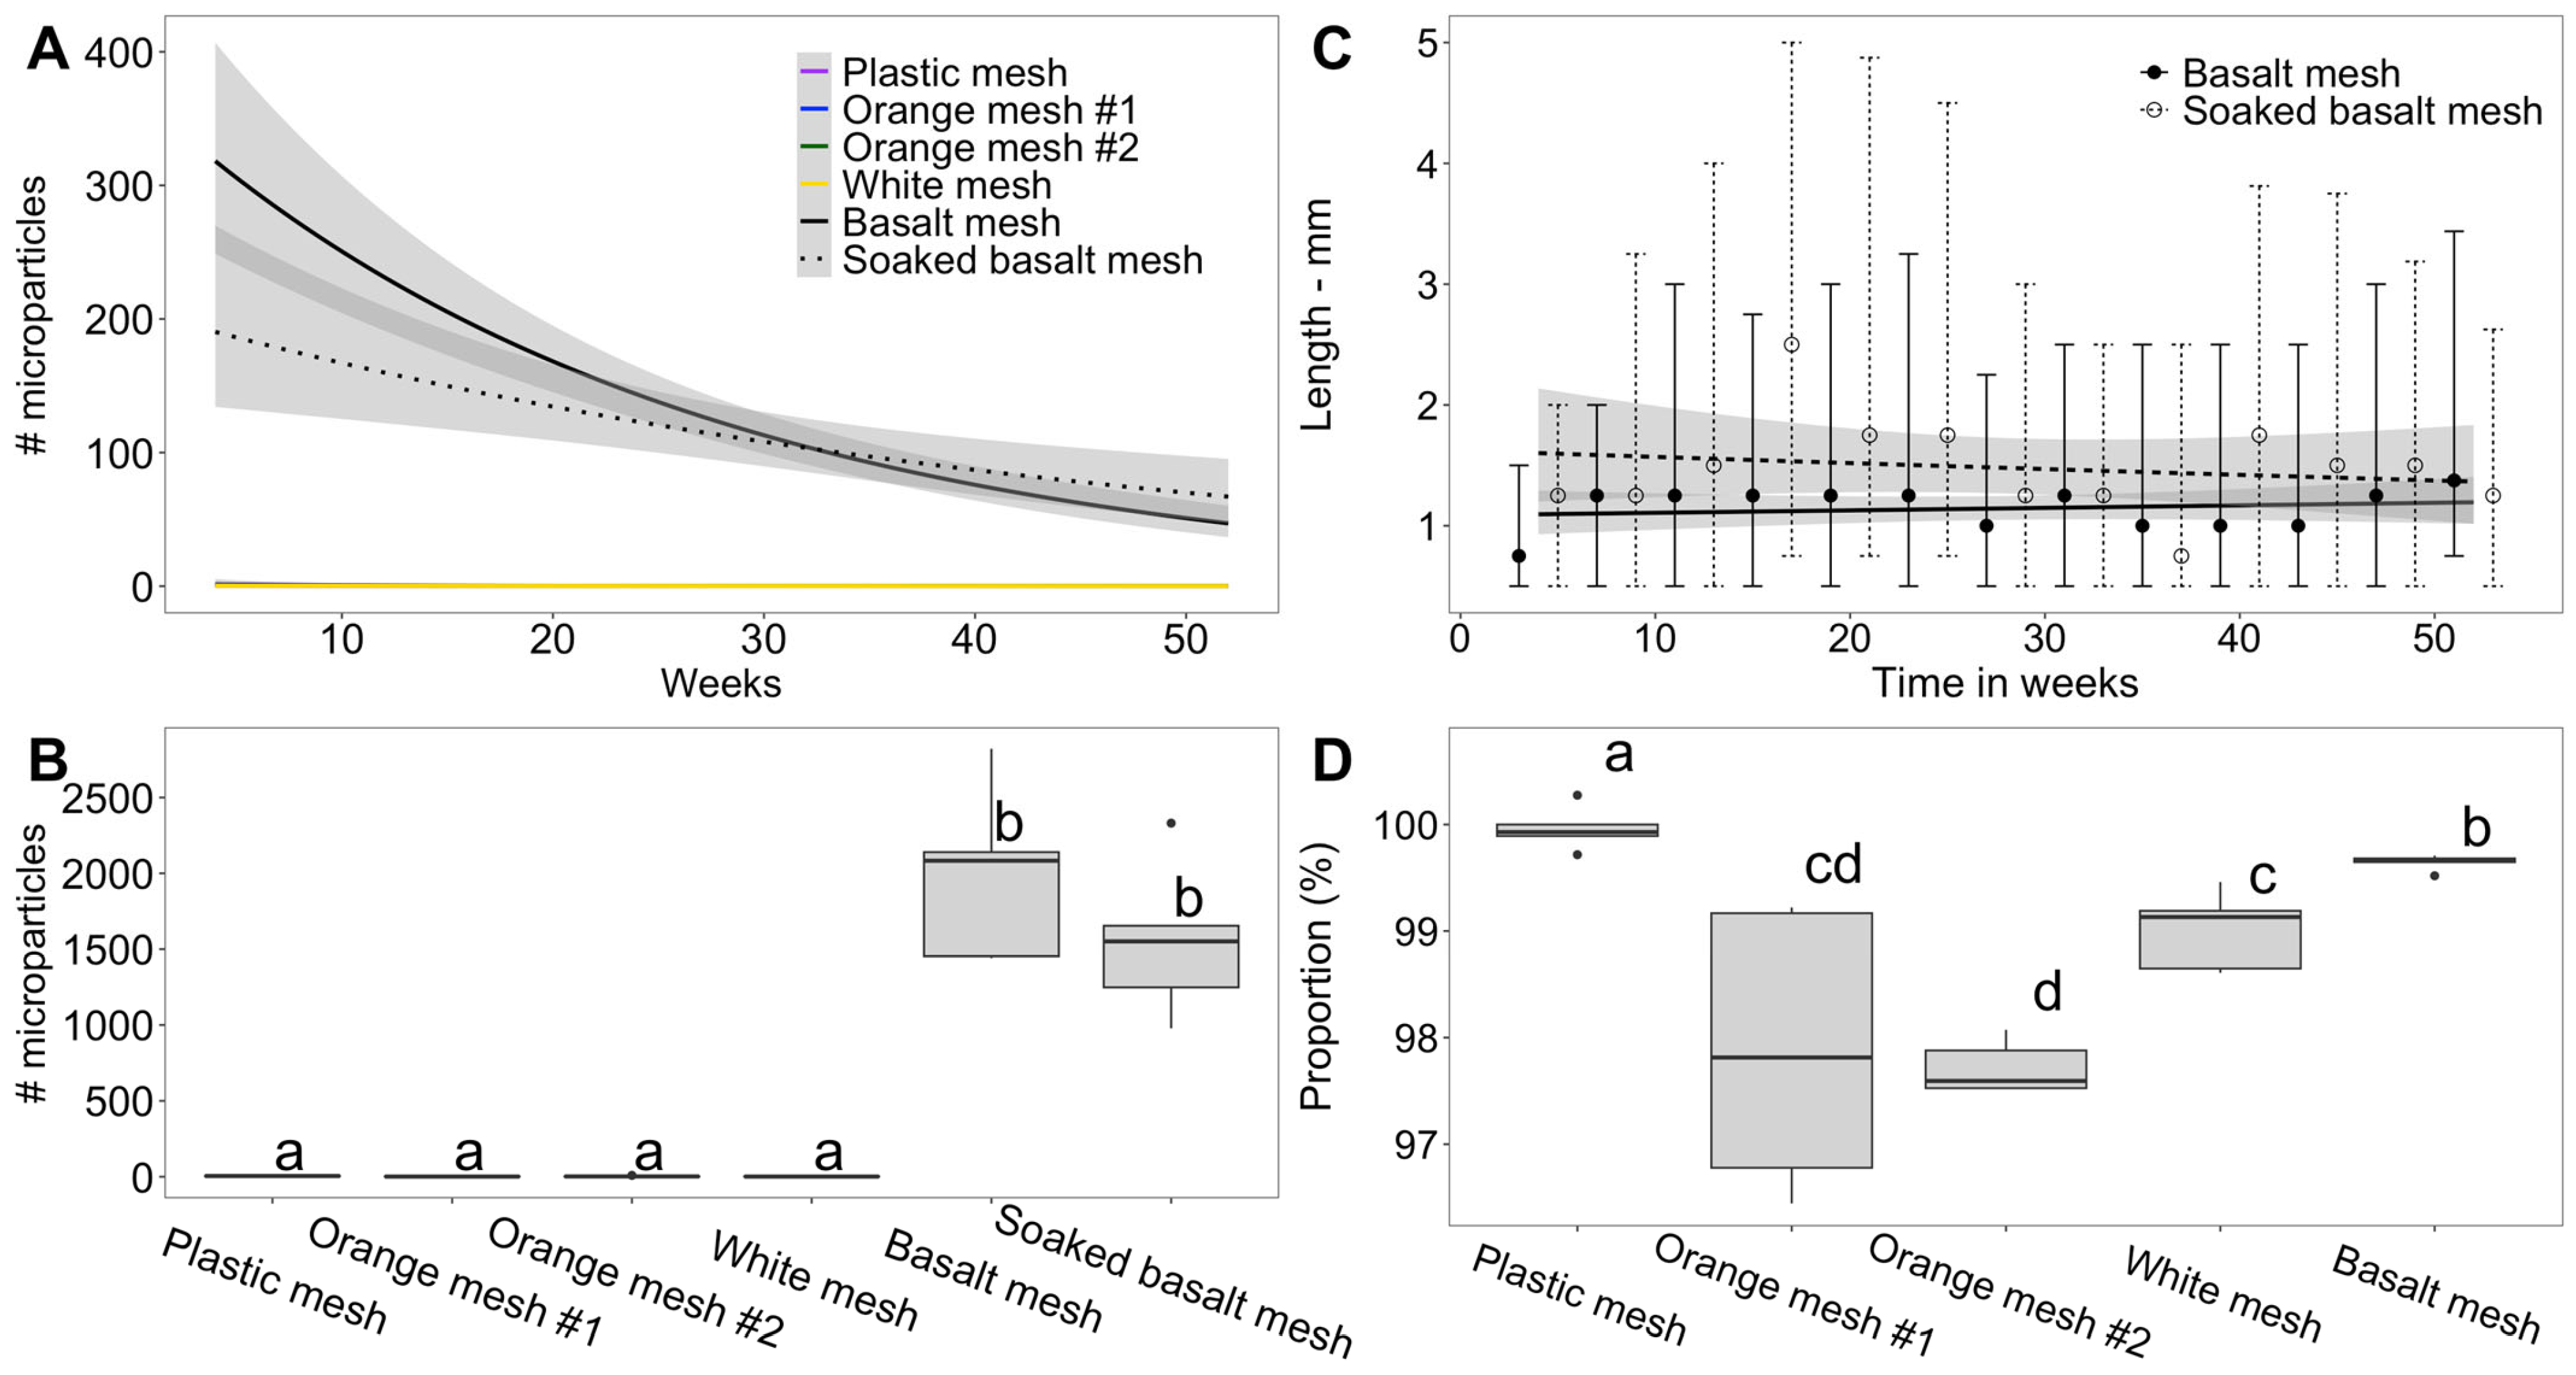
Across the course of the 12-month study, basalt mesh shed an average of 1987.4 (± 256.4 SE) microparticles/replicate, while soaked basalt mesh shed an average of 1552.4 (± 227.9 SE) microparticles/replicate. All other treatments shed less than 5.0 microparticles/replicate on average (Figure 4B and Figure 5). The basalt treatments were not statistically different from each other (negative binomial GLMM: p = 0.97), but they shed significantly more microparticles than all other treatments (negative binomial GLMM: p < 0.0001). Microparticle shedding decreased over time for all material treatments (negative binomial GLMM: p < 0.0001), but basalt treatments continued to consistently shed microparticles throughout the year (Figure 4A).
Because most material treatments shed such a low number of microparticles, only basalt and soaked basalt treatments were analyzed for temporal trends in microparticle size. Overall, the soaked basalt treatment (mean: 2.9 mm ± 0.1 SE) shed larger microparticles than the basalt treatment (mean: 2.7 mm ± 0.1 SE; negative binomial GLMM: p < 0.0001). The interaction between treatment and time was significant (p < 0.0001). Over time, microparticle size increased for the basalt treatment (negative binomial GLMM: p < 0.0001), but remained constant in the soaked basalt treatment (negative binomial GLMM: p = 0.15; Figure 4C).
Despite shedding a high number of microparticles, basalt mesh had a relatively high average remaining proportion of 0.996 ± 0.000 SE (Table 5; Figure 4D). On average, plastic mesh maintained the same mass over the course of the study, with small variation around the mean. Orange mesh #1 had an average final proportion of 0.979 (± 0.006 SE), with a wide spread of individual values (Figure 4D). The remaining proportion of mass was statistically different for all material treatments (gamma GLMM: p < 0.01) except for the biopolymers, which all overlapped with orange mesh #1 (gamma GLMM: p > 0.2).

4. Discussion

Material persistence was the greatest barrier to success in the field trial of this study. The three biopolymer treatments (orange mesh #1, orange mesh #2, white mesh) experienced high rates of degradation across the course of the year-long field study in ML, a subtropical, high-salinity estuary. BESE® shell bag materials degraded at a similar rate when used for oyster garden applications [59]. The restoration units in our study persisted longer than a similar trial of natural fiber shell bags in St. Charles Bay, TX, where all shell bags fully disintegrated within two months of deployment [20]. In contrast to that study, which reported that loose shell from degraded bags remained in place and provided habitat to macrofaunal communities that were equivalent to those in intact shell bags, loose shell in the present study was quickly pushed into the interior of restored reefs by the wakes of passing vessels [7]. Thus, this loose shell was spread out across the reef, where it buried restoration units in the reef interior. Basalt mesh shell bags showed the highest persistence of non-plastic experimental materials, with only one unit that lost functionality during the experiment. The length of time that a restoration unit must persist in order to successfully restore a reef varies depending on local environmental and biotic factors. Several hurricanes made landfall in Florida in 2024, but their arrival coincided with annual fall high-water season, when ML oyster reefs are continuously inundated for several months. Previous studies have found minimal impact of hurricanes on ML oyster reef profiles, presumably due to these elevated water levels [60]. Based on our observation of the instability of loose shell left behind by degraded shell bags, none of the biopolymer materials that were tested in this study could successfully replace plastic products in Mosquito Lagoon.
In addition to total material failure of some restoration units, damage to existing units typically increased over time. The exception to this was in quarter 4, at which point most highly damaged, non-functional units had already been removed from the study. Shell bags with large tears in the mesh lose shell over time, leading to decreased settlement substrate for oysters and less habitat for macrofauna. We observed an inverse relationship between oyster abundance and damaged area on restoration units, demonstrating that damage compromises restoration unit performance even before total unit failure. While basalt shell bags had relatively high persistence throughout the year-long field study, they began to exhibit large tears in the mesh by the end of the study. It would be beneficial to study this product over a longer time span to better understand its durability in the field. A recent study of basalt shell bags in Galveston Bay, TX, USA, reported that 50% of basalt bags lost functionality due to the loss of their oyster shell substrate after 11 months of deployment [27]. The degradability of a material is influenced by environmental variables as well as material composition [61]. Thus, the differences in basalt performance between our study and Hanke et al. (2026) [27] may be due to various local factors such as boat traffic, salinity, or water temperature.
While care was taken to ensure comparability between material types and field sites, there were certain unavoidable limitations to the field study. First, due to the novelty of basalt shell bags at the time this project started, they were not available for purchase until several weeks after reefs 1, 2, and 3 were restored. This resulted in a slightly delayed deployment at a separate location from other experimental materials. There were also no plastic spacer bags at reef 4. Spacer bags were not considered necessary at this site because their primary purpose was to mitigate edge effects. However, it is possible that the presence of spacer bags had other, unknown effects on the durability and oyster recruitment of adjacent experimental units. Second, as certain restoration units degraded and lost functionality over time, they left openings in the breakwater where the reef interior was not protected. We observed some burial in the interior portions of the reef behind these gaps. There was no readily apparent impact on neighboring experimental units, but it is possible they were exposed to greater wake energy due to the weakening of the breakwater. Despite these challenges, the data from this study allow the comparison of degradation rates for several popular non-plastic restoration products and emphasize the consequences of premature degradation on oyster recruitment.
Both basalt treatments in the laboratory study shed high numbers of microparticles across the course of one year. While basalt microparticles increased in size over time, the length of microparticles in the soaked basalt treatment remained constant. Basalt microparticles were notably smaller at the four-week mark (median: 0.75 mm) compared to later time points. Pre-soaking may have pre-emptively removed these small, loose microparticles from the soaked basalt treatment. The shedding of these novel microparticles raises concerns about their potential impacts on organisms that encounter them in the environment. Basalt fibers are widely used in a variety of industries, including automotive, construction, and textile applications [62], but they have never been studied as a potential environmental pollutant. While basalt fiber products are generally considered safe for humans to handle, care in handling is still recommended [62]. Studies on basalt fiber exposure in rats have documented associated cases of peritoneal mesothelioma [63] and impaired phagocytic activity [64], although both studies documented that health effects were less severe than those in rats exposed to asbestos. While this study examined microparticle shedding in a laboratory environment, a field study documented basalt microfibers in water near oyster reefs restored with basalt mesh shell bags up to 9 months post-restoration [65]. Thus, both laboratory and field studies provide evidence of continuous and consistent microparticle shedding from this product. The potential impacts of basalt microparticles in waterways are of increased concern for filter feeders such as oysters, which are known to bioaccumulate microparticles in their tissues [66,67,68]. Fiberglass microparticles, which share a similar morphology with basalt fibers, are a documented pollutant in English harbors [68]. Bioaccumulation of these microfibers in the mussel Mytilus edulis is associated with inflammation of gills and the digestive gland [69]. In a laboratory setting, oysters will consume suspended basalt microparticles [70], but impacts to tissue are unknown. Greater research into impacts of basalt microparticles in the marine environment is essential before this product is widely adopted by oyster restoration practitioners.
A recent study documented 526 ± 132 MP shed from Naltex® PE mesh over the course of a year [16]. Thus, the low amount of MP shedding from the same material in the present study was surprising. Several differences in methodology may explain the differences. In Chambers et al. (2026) [16], flasks were filled with filtered site water (vs. artificial seawater in the present study) and shaken at 170 rpm (vs. 60 rpm). Thus, samples were exposed to microbial activity and greater physical energy, both of which can contribute to formation of secondary MPs [15]. An additional factor that may have contributed to our result of low microparticle shedding from plastic mesh as well as biopolymer treatments was a lack of UV exposure in the experiment. In marine environments, photooxidation is considered an important plastic degradation pathway that can increase fragmentation, leading to the formation of micro- and nanoparticles [71,72]. Thus, it is possible that microparticle shedding from the plastic mesh and biopolymer mesh treatments would be greater in a field setting.
In spite of shedding few microparticles in the laboratory experiment, all three biopolymers lost significantly more mass at the end of the year than the basalt or plastic mesh treatments. This could be the result of breakdown into nanoparticles, which were not detectable by the laboratory methods used, or through another degradation process. Studies of BESE-elements®, a starch-based biopolymer restoration product from BESE®, have documented substantial releases of dissolved organic carbon, soluble reactive phosphorous, and mineralization of carbon into CO2 in both laboratory and field experiments [16,22]. The biopolymers in this study may have lost mass due to similar processes, and it is possible that this resulted in the increased brittleness and loss of integrity that was observed in the field study. Studies of other PBAT and PLA-based biopolymers have documented toxicity of degradation products over short-term (days) and long-term (months) time scales [32,33]. PLA microparticles in particular have been linked to suppressed gene expression in the mussel Mytilus coruscus [34]. Future studies into the degradation pathways of biopolymers marketed specifically for restoration would be beneficial for understanding their potential impacts to biogeochemical cycles or the toxicity of their degradation products.

5. Conclusions

The data presented here document low rates of persistence and high damaged area in several popular restoration materials when deployed in a warm, high-salinity estuary impacted by frequent boat wakes. Both material properties and environmental conditions interact to determine the longevity of restoration units in the field. Damaged shell bags slowly lost shell substrate, resulting in lower oyster recruitment. Of note, unit failure in this study was typically observed as a shell bag that had lost all its contents and been washed onto the interior of the reef or nearby shoreline, rather than the material fully disintegrating. This brings with it an additional concern, namely the semblance of litter in restored reef areas. Public support is essential for the success of restoration programs which often rely on volunteers or funding from local government or community groups. When members of the public see failed restoration units in public waterways, they may form a negative opinion of restoration efforts. Thus, more durable restoration units would both improve ecological outcomes and help to guard against negative community perceptions. Based on our data, companies that produce non-plastic shell bags should focus on developing materials that are able to withstand environmental conditions in the warm, salty waters of subtropical and tropical marine ecosystems.
Novel restoration materials may bring with them novel impacts to the environment. Basalt mesh shell bags were found to shed high numbers of thin, rod-like microparticles into the water under laboratory conditions. These microparticles have a similar morphology to fiberglass and may have similar environmental impacts. In conjunction with numerous studies that document unintended consequences of novel restoration materials such as altered biogeochemical cycles [16,22], heavy metal pollution [16], and microparticle shedding in the field [65], the present study highlights the necessity of fully understanding how a material may interact with the environment before using it widely in sensitive restored habitats.

Supplementary Materials

The following supporting information can be downloaded at: https://www.mdpi.com/article/10.3390/environments13070386/s1, Figure S1: Diagram of experimental arrangement at four field sites. Figure S2: Photos of reef 3 during restoration, with experimental units labeled.

Author Contributions

Conceptualization, C.H.W., L.J.W. and P.E.S.; methodology, C.H.W. and L.J.W.; software, C.H.W. and M.T.; validation, C.H.W.; formal analysis, C.H.W. and M.T.; investigation, C.H.W.; resources, L.J.W.; data curation, C.H.W.; writing—original draft preparation, C.H.W.; writing—review and editing, C.H.W., P.E.S., M.T. and L.J.W.; visualization, C.H.W. and M.T.; supervision, L.J.W. and M.T.; project administration, L.J.W.; funding acquisition, L.J.W. All authors have read and agreed to the published version of the manuscript.

Funding

This research was funded by NOAA Marine Debris Challenge grant NA24OARX417C0388-T1-01, a donation from Florida Coastal Conservation Association, Disney Conservation Fund grant 7699676, Florida Fish and Wildlife Conservation Commission grant 21359, and a donation from Central Florida Saltwater Anglers.

Data Availability Statement

Data will be publicly available within 6 months of publication on the UCF STARS Digital Repository.

Acknowledgments

We are grateful to our partners at Florida Coastal Conservation Association, Marine Discovery Center, and Florida Fish and Wildlife Conservation Commission for assisting in reef restoration, as well as to the many community members who volunteered to make and deploy restoration units. We thank A. Roddenberry (FL FWCC) as well as the UCF undergraduate and graduate students who assisted with data collection in the field. Finally, we thank the UCF Biology Department for providing access to equipment used in the laboratory study. During the preparation of this manuscript, the authors used Microsoft Copilot built on the GPT-5 chat model for assistance in writing a custom statistical function. The authors have reviewed and edited the output and take full responsibility for the content of this publication.

Conflicts of Interest

The authors declare no conflicts of interest. The funders had no role in the design of the study; in the collection, analyses, or interpretation of data; in the writing of the manuscript; or in the decision to publish the results.

References

  1. Kennedy, V.S.; Newell, R.I.; Eble, A.F. The Eastern Oyster: Crassostrea virginica; Maryland Sea Grant College: College Park, MD, USA, 1996; ISBN 0-943676-61-4. [Google Scholar]
  2. Grabowski, J.H.; Brumbaugh, R.D.; Conrad, R.F.; Keeler, A.G.; Opaluch, J.J.; Peterson, C.H.; Piehler, M.F.; Powers, S.P.; Smyth, A.R. Economic valuation of ecosystem services provided by oyster reefs. BioScience 2012, 62, 900–909. [Google Scholar] [CrossRef]
  3. Vaughn, C.C.; Hoellein, T.J. Bivalve impacts in freshwater and marine ecosystems. Annu. Rev. Ecol. Evol. Syst. 2018, 49, 183–208. [Google Scholar] [CrossRef]
  4. Beck, M.W.; Brumbaugh, R.D.; Airoldi, L.; Carranza, A.; Coen, L.D.; Crawford, C.; Defeo, O.; Edgar, G.J.; Hancock, B.; Kay, M.C.; et al. Oyster reefs at risk and recommendations for conservation, restoration, and management. BioScience 2011, 61, 107–116. [Google Scholar] [CrossRef]
  5. Grizzle, R.E.; Ward, K.M. Assessment of recent eastern oyster (Crassostrea virginica) reef restoration projects in the great bay estuary, New Hampshire: Planning for the future. PREP. Rep. Publ. 2016, 353. [Google Scholar]
  6. Pine, W.E.; Walters, C.J.; Camp, E.V.; Bouchillon, R.; Ahrens, R.; Sturmer, L.; Berrigan, M.E. The curious case of eastern oyster Crassostrea virginica stock status in Apalachicola Bay, Florida. Ecol. Soc. 2015, 20, 46. [Google Scholar] [CrossRef]
  7. Walters, L.J.; Sacks, P.E.; Campbell, D.E. Boating impacts and boat-wake resilient restoration of the eastern oyster Crassostrea virginica in Mosquito Lagoon, Florida, USA. Fla. Sci. 2021, 84, 173–199. [Google Scholar]
  8. Fodrie, F.J.; Rodriguez, A.B.; Baillie, C.J.; Brodeur, M.C.; Coleman, S.E.; Gittman, R.K.; Keller, D.A.; Kenworthy, M.D.; Poray, A.K.; Ridge, J.T.; et al. Classic Paradigms in a Novel Environment: Inserting Food Web and Productivity Lessons from Rocky Shores and Saltmarshes into Biogenic Reef Restoration. J. Appl. Ecol. 2014, 51, 1314–1325. [Google Scholar] [CrossRef]
  9. Hernández, A.B.; Brumbaugh, R.D.; Frederick, P.; Grizzle, R.; Luckenbach, M.W.; Peterson, C.H.; Angelini, C. Restoring the eastern oyster: How much progress has been made in 53 years? Front. Ecol. Environ. 2018, 16, 463–471. [Google Scholar]
  10. Walters, L.J.; Roddenberry, A.; Crandall, C.; Wayles, J.; Donnelly, M.; Barry, S.C.; Clark, M.W.; Escandell, O.; Hansen, J.C.; Laakkonen, K.; et al. The use of non-plastic materials for oyster reef and shoreline restoration: Understanding what is needed and where the field is headed. Sustainability 2022, 14, 8055. [Google Scholar] [CrossRef]
  11. Benson, G.; Donnelly, M.; Sacks, P.; Walters, L. Documenting loss and fragmentation of intertidal oyster (Crassostrea virginica) reefs in a subtropical estuary. Environments 2023, 10, 133. [Google Scholar] [CrossRef]
  12. McAfee, D.; McLeod, L.D.; Carruthers, S.; Connell, S.D. Reversing runctional extinction: Successful restoration of eradicated oyster reefs. Restor. Ecol. 2024, 32, e14169. [Google Scholar] [CrossRef]
  13. Sakr, A.; Altieri, A.H. Living in a material world: Support for the use of natural and alternative materials in coastal restoration and living shorelines. Ecol. Eng. 2025, 211, 107462. [Google Scholar] [CrossRef]
  14. Gall, S.C.; Thompson, R.C. The impact of debris on marine life. Mar. Pollut. Bull. 2015, 92, 170–179. [Google Scholar] [CrossRef] [PubMed]
  15. Wayman, C.; Niemann, H. The fate of plastic in the ocean environment—A minireview. Environ. Sci. Process. Impacts 2021, 23, 198–212. [Google Scholar] [CrossRef] [PubMed]
  16. Chambers, L.G.; Gay, S.; Cheek, N.; Barnes, C.; Jensik, M.; Donnelly, M.; Sacks, P.E.; Beazley, M.; Walters, L.J. Microplastic and biogeochemical releases from plastic, metal, cement, and fiber coastal restoration materials. Mar. Pollut. Bull. 2026, 226, 119329. [Google Scholar] [CrossRef] [PubMed]
  17. Sussarellu, R.; Suquet, M.; Thomas, Y.; Lambert, C.; Fabioux, C.; Pernet, M.E.J.; Le Goïc, N.; Quillien, V.; Mingant, C.; Epelboin, Y.; et al. Oyster reproduction is affected by exposure to polystyrene microplastics. Proc. Natl. Acad. Sci. USA 2016, 113, 2430–2435. [Google Scholar] [CrossRef] [PubMed]
  18. Sorini, R.; Kordal, M.; Apuzza, B.; Eierman, L.E. Skewed sex ratio and gametogenesis gene expression in eastern oysters (Crassostrea virginica) exposed to plastic pollution. J. Exp. Mar. Biol. Ecol. 2021, 544, 151605. [Google Scholar] [CrossRef]
  19. Takahashi, K.; Teh, J.C. A hidden lethal effect of long microplastic fibres on the coastal copepod Acartia erythraea. Mar. Pollut. Bull. 2024, 208, 117018. [Google Scholar] [CrossRef] [PubMed]
  20. Comba, D.; Palmer, T.A.; Breaux, N.J.; Pollack, J.B. Evaluating biodegradable alternatives to plastic mesh for small-scale oyster reef restoration. Restor. Ecol. 2023, 31, e13762. [Google Scholar] [CrossRef]
  21. Marin-Diaz, B.; Fivash, G.S.; Nauta, J.; Temmink, R.J.M.; Hijner, N.; Reijers, V.C.; Cruijsen, P.P.M.J.M.; Didderen, K.; Heusinkveld, J.H.T.; Penning, E.; et al. On the use of large-scale biodegradable artificial reefs for intertidal foreshore stabilization. Ecol. Eng. 2021, 170, 106354. [Google Scholar] [CrossRef]
  22. Nitsch, C.K.; Walters, L.J.; Sacks, J.S.; Sacks, P.E.; Chambers, L.G. Biodegradable material for oyster reef restoration: First-year performance and biogeochemical considerations in a coastal lagoon. Sustainability 2021, 13, 7415. [Google Scholar] [CrossRef]
  23. Temmink, R.J.M.; Angelini, C.; Fivash, G.S.; Swart, L.; Nouta, R.; Teunis, M.; Lengkeek, W.; Didderen, K.; Lamers, L.P.M.; Bouma, T.J.; et al. Life cycle informed restoration: Engineering settlement substrate material characteristics and structural complexity for reef formation. J. Appl. Ecol. 2021, 58, 2158–2170. [Google Scholar] [CrossRef]
  24. Mathews, H.; Uddin, M.J.; Hargis, C.W.; Smith, K.J. First-year performance of the pervious oyster shell habitat (POSH) along two energetic shorelines in northeast Florida. Sustainability 2023, 15, 7028. [Google Scholar] [CrossRef]
  25. Blanchard, T.L.; Sacks, P.E.; Donnelly, M.J.; Walters, L.J. Monitoring faunal responses to biodegradable oyster reef restoration materials with camera rraps in a subtropical estuary. Restor. Ecol. 2025, 33, e70186. [Google Scholar] [CrossRef]
  26. Nuyts, S.; Macreadie, P.I.; Trevathan-Tackett, S.M. Field assessment of wave attenuation by BESE-elements in a mangrove environment. Ecol. Eng. 2025, 212, 107507. [Google Scholar] [CrossRef]
  27. Hanke, M.H.; Batte, S.; Goebel, R.C. Balancing durability and sustainability: Field performance of plastic and biodegradable materials in eastern oyster breakwater reef restoration. Environments 2026, 13, 42. [Google Scholar] [CrossRef]
  28. Mathews, H.; Nelson, G.; Smith, K.J. Utilizing complex pervious oyster shell habitats for oyster reef habitat provision in northeast Florida. Sustainability 2026, 18, 3837. [Google Scholar] [CrossRef]
  29. Bach, C.; Dauchy, X.; Severin, I.; Munoz, J.-F.; Etienne, S.; Chagnon, M.-C. Effect of temperature on the release of intentionally and non-intentionally added substances from polyethylene terephthalate (PET) bottles into water: Chemical analysis and potential toxicity. Food Chem. 2013, 139, 672–680. [Google Scholar] [CrossRef] [PubMed]
  30. Agamuthu, P.; Mehran, S.; Norkhairah, A.; Norkhairiyah, A. Marine debris: A review of impacts and global initiatives. Waste Manag. Res. 2019, 37, 987–1002. [Google Scholar] [CrossRef] [PubMed]
  31. Zhao, H.; Federigi, I.; Verani, M.; Carducci, A. Organic pollutants associated with plastic debris in marine environment: A systematic review of analytical methods, occurrence, and characteristics. Int. J. Environ. Res. Public Health 2023, 20, 4892. [Google Scholar] [CrossRef] [PubMed]
  32. Quade, J.; López-Ibáñez, S.; Beiras, R. Mesocosm trials reveal the potential toxic risk of degrading bioplastics to marine life. Mar. Pollut. Bull. 2022, 179, 113673. [Google Scholar] [CrossRef] [PubMed]
  33. Martínez, A.; Perez-Sanchez, E.; Caballero, A.; Ramírez, R.; Quevedo, E.; Salvador-García, D. PBAT is biodegradable but what about the toxicity of its biodegradation products? J. Mol. Model. 2024, 30, 273. [Google Scholar] [CrossRef] [PubMed]
  34. Li, L.; Hu, D.; Zhong, Z.; Fang, J.K.-H.; Hu, M.; Shang, Y.; Wang, Y. The combined effects of aging polylactic acid microplastics and TCPP on the byssus genes of the mussel Mytilus coruscus. Mar. Pollut. Bull. 2025, 221, 118466. [Google Scholar] [CrossRef] [PubMed]
  35. Fillyaw, R.M.; Donnelly, M.J.; Litwak, J.W.; Rifenberg, J.L.; Walters, L.J. Strategies for successful mangrove living shoreline stabilizations in shallow water subtropical estuaries. Sustainability 2021, 13, 11704. [Google Scholar] [CrossRef]
  36. Spiering, D.W.; Kibler, K.M.; Kitsikoudis, V.; Donnelly, M.J.; Walters, L.J. Detecting hydrodynamicchanges after living shoreline restoration and through an extreme event using a before-after-control-impact experiment. Ecol. Eng. 2021, 169, 106306. [Google Scholar] [CrossRef]
  37. Hanke, M.H.; Leija, H.; Laroche, R.A.S.; Modi, S.; Culver-Miller, E.; Sanchez, R.; Bobby, N. Localized placement of breakwater reefs influences oyster populations and their resilience after Hurricane Harvey. Ecologies 2022, 3, 422–434. [Google Scholar] [CrossRef]
  38. BESE Biodegradable Mesh for Oyster Reef Restoration. Available online: https://www.bese-products.com/biodegradable-products/biodegradable-mesh/ (accessed on 27 April 2026).
  39. Wang, W.; Zhang, Y.; Mo, Z.; Chouw, N.; Jayaraman, K.; Xu, Z. A critical review on the properties of natural fibre reinforced concrete composites subjected to impact loading. J. Build. Eng. 2023, 77, 107497. [Google Scholar] [CrossRef]
  40. Natrx ExoFlex Oyster Bags|Durable & Eco-Friendly Shoreline Protection. Available online: https://natrx.io/natrx-exoflex-oyster-bags (accessed on 27 April 2026).
  41. Indian River Lagoon Species Inventory Home. Available online: https://irlspecies.org/index.php (accessed on 27 April 2026).
  42. Phlips, E.J.; Badylak, S.; Lasi, M.A.; Chamberlain, R.; Green, W.C.; Hall, L.M.; Hart, J.A.; Lockwood, J.C.; Miller, J.D.; Morris, L.J.; et al. From red tides to green and brown tides: Bloom dynamics in a restricted subtropical lagoon under shifting climatic conditions. Estuaries Coasts 2015, 38, 886–904. [Google Scholar] [CrossRef]
  43. Smith, N.P. The rise and fall of the estuarine intertidal zone. Estuaries 1986, 9, 95. [Google Scholar] [CrossRef] [PubMed]
  44. Baggett, L.P.; Powers, S.P.; Brumbaugh, R.D.; Coen, L.D.; DeAngelis, B.M.; Greene, J.K.; Hancock, B.T.; Morlock, S.M.; Allen, B.L.; Breitburg, D.L.; et al. Guidelines for evaluating performance of oyster habitat restoration. Restor. Ecol. 2015, 23, 737–745. [Google Scholar] [CrossRef]
  45. Wesch, C.; Elert, A.M.; Wörner, M.; Braun, U.; Klein, R.; Paulus, M. Assuring quality in microplastic monitoring: About the value of clean-air devices as essentials for verified data. Sci. Rep. 2017, 7, 5424. [Google Scholar] [CrossRef] [PubMed]
  46. Zobkov, M.B.; Esiukova, E.E. Microplastics in a marine environment: Review of methods for sampling, processing, and analyzing microplastics in water, bottom sediments, and coastal deposits. Oceanology 2018, 58, 137–143. [Google Scholar] [CrossRef]
  47. Craig, C.A.; Fox, D.W.; Zhai, L.; Walters, L.J. In-situ microplastic egestion efficiency of the eastern oyster Crassostrea virginica. Mar. Pollut. Bull. 2022, 178, 113653. [Google Scholar] [CrossRef] [PubMed]
  48. R Core Team. R: A Language and Environment for Statistical Computing; R Foundation for Statistical Computing: Vienna, Austria, 2025; Available online: https://www.R-project.org/ (accessed on 27 April 2026).
  49. Brooks, M.; Kristensen, E.; Benthem, K.J.; Magnusson, A.; Berg, C.; Nielsen, W.; Skaug, A.; Mächler, J.; Bolker, M. glmmTMB balances speed and flexibility among packages for zero-inflated generalized linear mixed modeling. R J. 2017, 9, 378. [Google Scholar] [CrossRef]
  50. Bates, D.; Mächler, M.; Bolker, B.; Walker, S. Fitting linear mixed-effects models using lme4. J. Stat. Softw. 2015, 67, 1–48. [Google Scholar] [CrossRef]
  51. Lenth, R.; Piaskowski, J. Emmeans: Estimated Marginal Means, Aka Least-Squared Means. R Package Version 2.0.3. 2025. Available online: https://rvlenth.github.io/emmeans/ (accessed on 15 May 2026).
  52. Hartig, F. DHARMa: Residual Diagnostics for Hierarchical (Multi-Level/Mixed) Regression Models. R Package Version 0.5.0. 2026. Available online: http://florianhartig.github.io/DHARMa/ (accessed on 15 May 2026).
  53. Lüdecke, D.; Ben-Shachar, M.; Patil, I.; Waggoner, P.; Makowski, D. Performance: An R package for assessment, comparison and testing of statistical models. J. Open Source Softw. 2021, 6, 3139. [Google Scholar] [CrossRef]
  54. Heinze, G.; Schemper, M. A solution to the problem of monotone likelihood in cox regression. Biometrics 2001, 57, 114–119. [Google Scholar] [CrossRef] [PubMed]
  55. Fox, J.; Weisberg, S. Cox proportional-hazards regression for survival data in R. In An R Companion to Applied Regression; SAGE Publications Ltd.: Thousand Oaks, CA, USA, 2011. [Google Scholar]
  56. Microsoft. Microsoft 365 Copilot (GPT-5 Chat Model). 2025. Available online: https://www.microsoft.com/microsoft-365/copilot (accessed on 3 January 2026).
  57. Welsh, A.H.; Cunningham, R.B.; Donnelly, C.F.; Lindenmayer, D.B. Modelling the abundance of rare species: Statistical models for counts with extra zeros. Ecol. Model. 1996, 88, 297–308. [Google Scholar] [CrossRef]
  58. Walters, L.J.; Serrate, M.; Blanchard, T.; Sacks, P.; Joshua, F.; Zhai, L. Raining plastics: Quantification of atmospheric deposition of plastic and anthropogenic particles into an estuary of national significance with the assistance of citizen scientists. Environments 2025, 12, 424. [Google Scholar] [CrossRef]
  59. Sakr, A.; Mazor, L.D.; Milbrandt, E.C.; Morton, J.P.; Altieri, A.H. A changing of the garden: Evaluating the performance and ecosystem functionality of alternative oyster garden structures in residential waterways. Front. Ecol. Evol. 2025, 13, 1576407. [Google Scholar] [CrossRef]
  60. Walters, L.J.; Sacks, P.E.; Bobo, M.Y.; Richardson, D.L.; Coen, L.D. Impact of Hurricanes and Boat Wakes on the Intertidal Oyster Reefs in the Indian River Lagoon: Reef Profiles and Disease Prevalence. Environ. Restor. 2007, 70, 506–521. [Google Scholar]
  61. Schmidt, M.W.I.; Torn, M.S.; Abiven, S.; Dittmar, T.; Guggenberger, G.; Janssens, I.A.; Kleber, M.; Kögel-Knabner, I.; Lehmann, J.; Manning, D.A.C.; et al. Persistence of soil organic matter as an ecosystem property. Nature 2011, 478, 49–56. [Google Scholar] [CrossRef] [PubMed]
  62. Jamshaid, H.; Mishra, R. A green material from rock: Basalt fiber—A review. J. Text. Inst. 2016, 107, 923–937. [Google Scholar] [CrossRef]
  63. Kogan, F.M.; Nikitina, O.V. Solubility of chrysotile asbestos and basalt fibers in relation to their fibrogenic and carcinogenic action. Environ. Health Perspect. 1994, 102, 205–206. [Google Scholar] [CrossRef]
  64. Hurbánková, M. One-year follow-up of the phagocytic activity of leukocytes after exposure of rats to asbestos and basalt fibers. Environ. Health Perspect. 1994, 102, 201–203. [Google Scholar] [CrossRef] [PubMed][Green Version]
  65. Dolan, L.M. Analyzing the Loss of Material from a Non-Plastic Oyster Reef Restoration Alternative. Honors Undergraduate Theses, University of Central Florida, Orlando, FL, USA, 2026. Available online: https://stars.library.ucf.edu/hut2024/536 (accessed on 27 April 2026).
  66. Wright, S.L.; Thompson, R.C.; Galloway, T.S. The physical impacts of microplastics on marine organisms: A review. Environ. Pollut. 2013, 178, 483–492. [Google Scholar] [CrossRef] [PubMed]
  67. Ribeiro, V.V.; Nobre, C.R.; Moreno, B.B.; Semensatto, D.; Sanz-Lazaro, C.; Moreira, L.B.; Castro, Í.B. Oysters and mussels as equivalent sentinels of microplastics and natural particles in coastal environments. Sci. Total Environ. 2023, 874, 162468. [Google Scholar] [CrossRef] [PubMed]
  68. Ciocan, C.; Annels, C.; Fitzpatrick, M.; Couceiro, F.; Steyl, I.; Bray, S. Glass reinforced plastic (GRP) boats and the impact on coastal environment—Evidence of fibreglass ingestion by marine bivalves from natural populations. J. Hazard. Mater. 2024, 472, 134619. [Google Scholar] [CrossRef] [PubMed]
  69. Ciocan, C.; Kristova, P.; Annels, C.; Derjean, M.; Hopkinson, L. Glass reinforced plastic (GRP) a new emerging contaminant—First evidence of GRP impact on aquatic organisms. Mar. Pollut. Bull. 2020, 160, 111559. [Google Scholar] [CrossRef] [PubMed]
  70. Pollard, K.; McLean, J.; Harrington, G.; Chapman, L.; Delikat, J.; Milanes, K.; Groves, N.; Chin, R.; Vance, M.; Cherkaoul, G.; et al. Shards in the system: Tracing basalt through the oyster Crassostrea virginica. In Proceedings of the Oyster Integrated Monitoring and Mapping Program Oyster Workshop, Ponte Vedra Beach, FL, USA, 14–15 April 2026. [Google Scholar]
  71. Bergmann, M.; Gutow, L.; Klages, M. Marine Anthropogenic Litter; Springer International Publishing AG: Cham, Switzerland, 2015; ISBN 978-3-319-16509-7. [Google Scholar]
  72. Gewert, B.; Plassmann, M.M.; MacLeod, M. Pathways for degradation of plastic polymers floating in the marine environment. Environ. Sci. Process. Impacts 2015, 17, 1513–1521. [Google Scholar] [CrossRef] [PubMed]
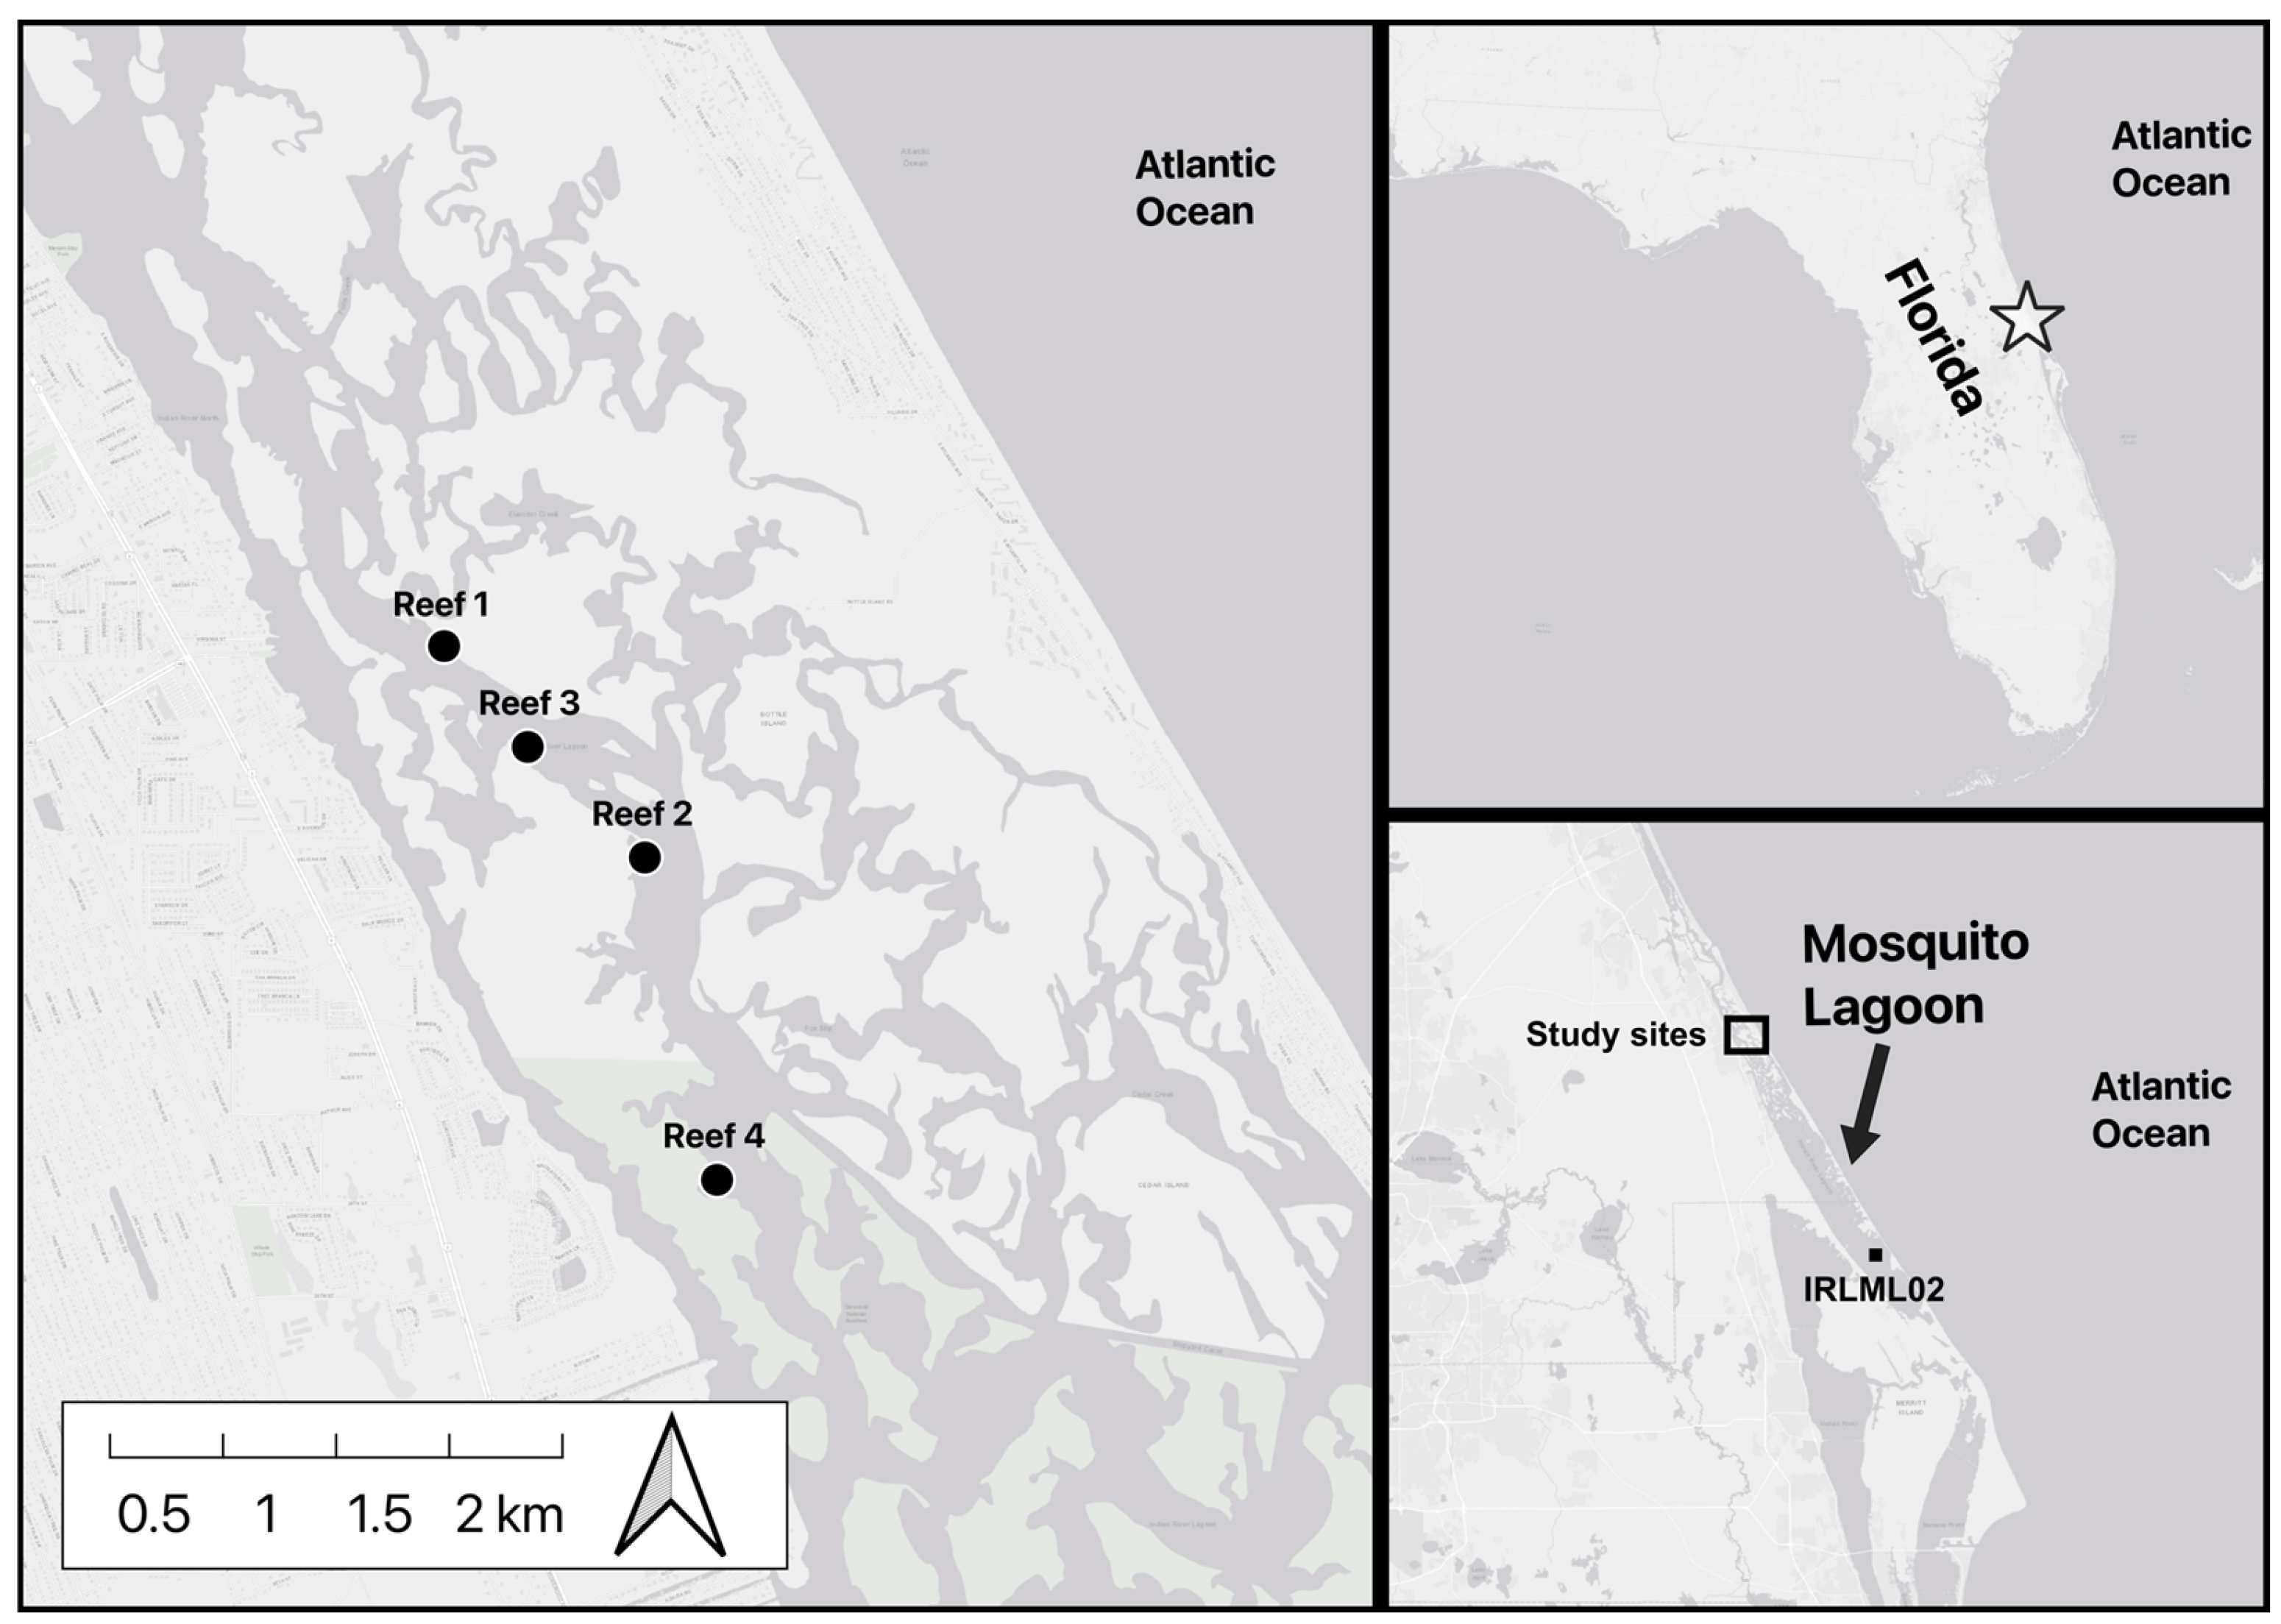
Figure 1. Map of four field study sites in Mosquito Lagoon, Florida. Reef 1: 28°58′20.32″ N, 80°52′57.23″ W; Reef 2: 28°57′53.13″ N, 80°52′29.86″ W; Reef 3: 28°58′07.02″ N, 80°52′49.77″ W; Reef 4: 28°57′04.85″ N, 80°52′15.88° W. Continuous monitoring data was obtained from IRLML02, the closest station maintained by St. Johns River Water Management District: 28°43′54.0″ N, 80°43′02.0″ W.
Environments 13 00386 g001
Figure 2. Performance of restoration materials in field experiment. (A) Percent of units remaining for each treatment at each sampling point. Q1 = quarter one, Q2 = quarter two, etc. (B) Log-transformed damaged area per restoration unit over time. Points indicate values of individual units, and line is fit to a smoothing function with confidence band showing 95% confidence interval. (C) Probability of oyster presence as a function of damage to restoration unit. Probability curve with 95% confidence band is based on logistic regression model. Points show raw data on oyster presence/absence from individual restoration units on which this model is based. (D) Oyster abundance per restoration unit as a function of damage to restoration unit. Points represent raw data from individual units that contained at least one live oyster, and line with 95% confidence band is fit to a negative binomial GLM.
Environments 13 00386 g002
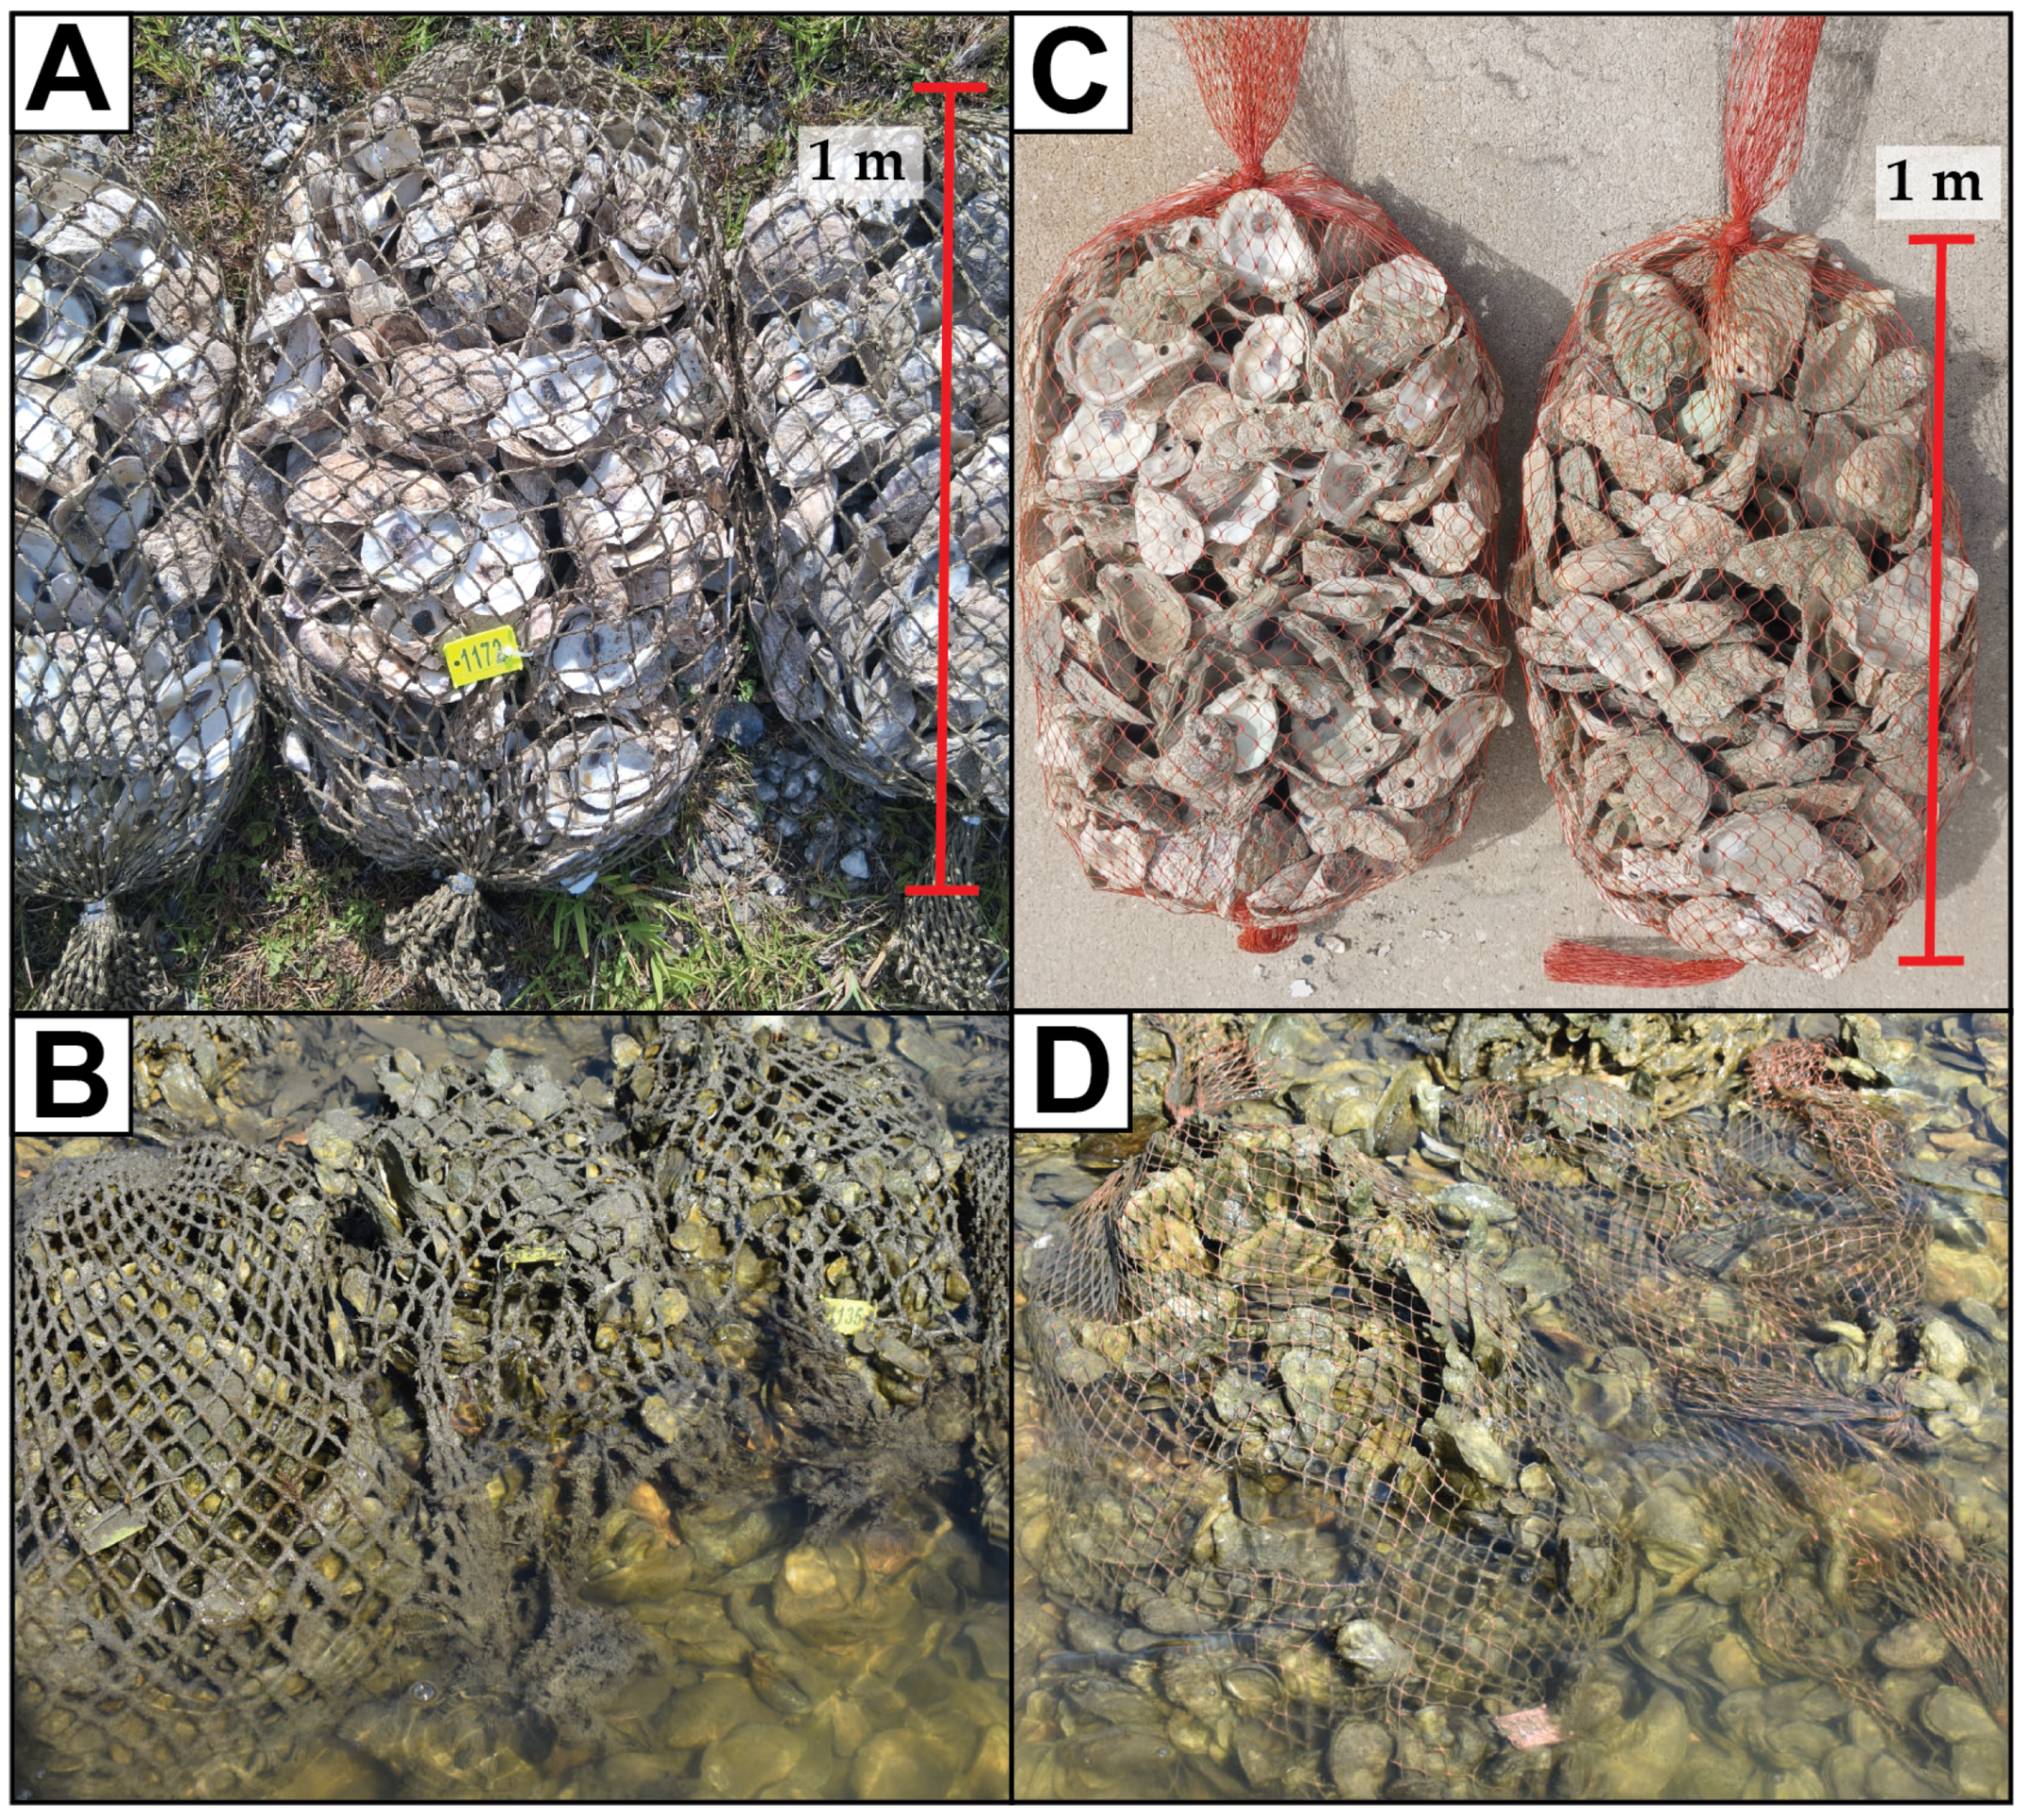
Figure 3. (A) Basalt mesh shell bags prior to deployment in the field. (B) Basalt mesh shell bags with large tears after one year in the field. (C) Orange mesh #2 shell bags prior to deployment in the field. (D) Orange mesh #2 shell bags after one year in the field. On the left a shell bag has large tears in the mesh. On the top right, a shell bag is almost fully empty of shell substrate and is non-functional.
Environments 13 00386 g003
Figure 4. Results of laboratory microparticle shedding study. (A) Number of microparticles shed by experimental treatments as a function of time. Lines are fit to a negative binomial GLM with 95% confidence bands. (B) Overall number of microparticles shed over the course of one year. Letters indicate treatments that are statistically different from each other (p < 0.05) based on a negative binomial GLMM. (C) Length of basalt and soaked basalt microparticles over time. Error bars give interquartile range, while points give median measure at each time point. Lines are fit to a negative binomial GLM with 95% confidence bands. (D) Proportion of remaining mass for materials at the end of the 12-month laboratory study. Letters indicate treatments that are statistically different from each other (p < 0.05) based on a gamma GLMM.
Environments 13 00386 g004
Figure 5. Photographs of basalt under a dissecting microscope. (A) Details of intact woven yarn from basalt mesh bag. Note broken ends of fibers sticking out from yarn (arrows). (B) Basalt microparticles that were shed during laboratory experiment.
Environments 13 00386 g005
Table 1. Published studies that examined field performance of non-plastic or biodegradable materials used in oyster reef restoration.
StudyProductLocationReef ZonationStudy
Duration (Months)
Marin-Diaz et al., 2021 [21]BESE-elements®Wadden Sea, The
Netherlands
Intertidal29
Nitsch et al., 2021 [22]BESE-elements®Mosquito
Lagoon, FL, USA
Intertidal12
Temmink et al., 2021 [23]BESE-elements®Cedar Key, FL, USA and
Wadden Sea, The
Netherlands
Intertidal20–22
Walters et al., 2022 [10]BESE-elements®,
Galvanized steel gabions
Mosquito
Lagoon, FL, USA
Intertidal24, 12
respectively
Reef prismsCedar Key, FL, USAIntertidal48
Reef ballsNaples Bay, FL, USAIntertidal24
Comba et al., 2023 [20]Cellulose, Cotton, Jute fiberSt. Charles Bay, TX, USASubtidal12
Mathews et al., 2023 [24]Pervious Oyster Shell Habitat (POSH)Jacksonville, FL, USAIntertidal13
Blanchard et al., 2025 [25]BESE-elements®, cement-juteMosquito
Lagoon, FL, USA
Intertidal12
Nuyts et al., 2025 [26]BESE-elements®Western Port, AustraliaIntertidal20
Chambers et al., 2026 [16]Galvanized steel gabionsMosquito
Lagoon, FL, USA
Intertidal36
Hanke et al., 2026 [27]Natrx® basalt mesh bagsGalveston Bay, TX, USASubtidal11
Mathews et al., 2026 [28]POSHNortheast Florida, USAIntertidal22
Table 2. Experimental material specifications.
NameCompanyPrimary ComponentMesh SizeModality
Orange mesh #1BESE®PBAT1 cmSleeve
Orange mesh #2BESE®PBAT1 cmSleeve
White meshBESE®PLA1 cmSleeve
Basalt meshNatrx®Basalt2.5 cmIndividual
Plastic meshNaltex®PE1 cmSleeve
Table 3. Durability metrics by restoration material and time. Values give mean ± SE (n), with units given in headers. Q1 = quarter 1, Q2 = quarter 2, etc. Note varying sample sizes. NA indicates that sampling did not occur.
Material Damage
MaterialQ1Q2Q3Q4
Tears per Remaining Restoration Unit
Plastic mesh0.2 ± 0.1 (30)1.8 ± 0.3 (30)2.6 ± 0.4 (30)4.7 ± 0.5 (30)
Basalt meshNA1.5 ± 0.3 (25)2.0 ± 0.3 (25)9.1 ± 0.6 (24)
Orange mesh #10.5 ± 0.2 (30)3.6 ± 0.4 (30)6.5 ± 0.7 (27)7.8 ± 1.4 (5)
Orange mesh #20.6 ± 0.2 (30)4.7 ± 0.5 (30)4.7 ± 0.5 (23)8.5 ± 3.0 (4)
White mesh2.6 ± 0.4 (30)1.2 ± 0.1 (18)NANA
Damaged Area (cm2 per Remaining Restoration Unit)
Plastic mesh1.0 ± 0.6 (30)21.3 ± 7.5 (30)56.9 ± 20.9 (30)131.2 ± 28.3 (30)
Basalt meshNA49.2 ± 11.3 (25)102.3 ± 20.0 (25)573.6 ± 47.5 (24)
Orange mesh #11.7 ± 0.6 (30)218.1 ± 54.2 (30)855.5 ± 160.5 (27)906.3 ± 204.9 (5)
Orange mesh #21.9 ± 0.6 (30)213.4 ± 31.5 (30)1564.1 ± 234.7 (23)684.5 ± 171.2 (4)
White mesh10.7 ± 1.7 (30)1672.5 ± 118.1 (18)NANA
Table 4. Oyster metrics by restoration material in summer 2025. Values given are mean ± SE per restoration unit.
Oyster Recruitment
MaterialAbundanceShell Height (mm)
Plastic mesh266.2 ± 40.026.3 ± 0.3
Basalt mesh114.3 ± 14.730.3 ± 0.3
Orange mesh #114.7 ± 5.830.6 ± 0.7
Orange mesh #29.9 ± 2.830.3 ± 0.7
White mesh0.0 ± 0.0NA
Table 5. Initial mass, final mass, and final proportion for experimental materials in laboratory study. Values given are mean ± SE.
Material Mass Change
MaterialInitial Mass (g)Final Mass (g)Final Proportion
Plastic mesh0.417 ± 0.0260.417 ± 0.0251.00 ± 0.001
Basalt mesh5.107 ± 0.3385.088 ± 0.3360.996 ± 0.000
Orange mesh #10.804 ± 0.0340.786 ± 0.0300.979 ± 0.006
Orange mesh #20.388 ± 0.0150.379 ± 0.0140.977 ± 0.001
White mesh0.399 ± 0.0180.395 ± 0.0170.990 ± 0.002
Disclaimer/Publisher’s Note: The statements, opinions and data contained in all publications are solely those of the individual author(s) and contributor(s) and not of MDPI and/or the editor(s). MDPI and/or the editor(s) disclaim responsibility for any injury to people or property resulting from any ideas, methods, instructions or products referred to in the content.