Article

Complementary Nozzle-Level Droplet and Downstream Airborne Aerosol Characterization of Oil-Based Ultra-Low-Volume Sprays


1
Department of Public Health, Brody School of Medicine, East Carolina University, Greenville, NC 27834, USA
2
North Carolina Agromedicine Institute, Greenville, NC 27858, USA
3
Center for Human Health and the Environment, NC State University, Raleigh, NC 27707, USA
4
Environmental Health Sciences Program, Department of Health Education and Promotion, College of Health and Human Performance, East Carolina University, Greenville, NC 27858, USA
5
Department of Coastal Studies, East Carolina University, Greenville, NC 27858, USA
*
Author to whom correspondence should be addressed.
Environments 2026, 13(7), 387; https://doi.org/10.3390/environments13070387
Submission received: 28 May 2026 / Revised: 29 June 2026 / Accepted: 4 July 2026 / Published: 8 July 2026
(This article belongs to the Special Issue Aerosols, Health, and Environmental Interactions)

Abstract

Vector-borne diseases remain a public health concern, and ultra-low-volume (ULV) systems generate adulticide droplets that must remain airborne long enough to contact flying mosquitoes. Accurate droplet and aerosol size characterization is essential for equipment calibration, interpretation of efficacy studies, and evaluation of the airborne fraction relevant to spray transport. This study evaluated complementary nozzle-level and downstream airborne measurements under controlled chamber conditions using a DC-IV droplet counter, TSI APS 3321, and GRIMM MiniWRAS 1.371. Mineral oil and kerosene were atomized at 1.0 to 10.5 bar and 0.20 to 1.00 mL/min. Mass median diameter (MMD), count median diameter (CMD), regression relationships, and size distributions were evaluated. Four MMD calculation methods were also assessed, including Hatch–Choate conversion and a Volume-Based method. For mineral oil, DC-IV reported a mean MMD of 30.78 µm, compared with 4.88 µm for APS and 3.15 µm for MiniWRAS. For kerosene, differences narrowed to 6.21, 6.45, and 4.09 µm, respectively. Hatch–Choate estimates were unstable when lognormal assumptions were violated, whereas the Volume-Based method reproduced reported APS and MiniWRAS MMD values within ±1%. These findings support continued DC-IV use for nozzle calibration and indicate that APS and MiniWRAS can provide complementary real-time characterization of the downstream airborne spray aerosols.

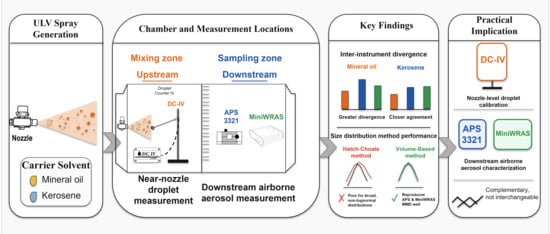
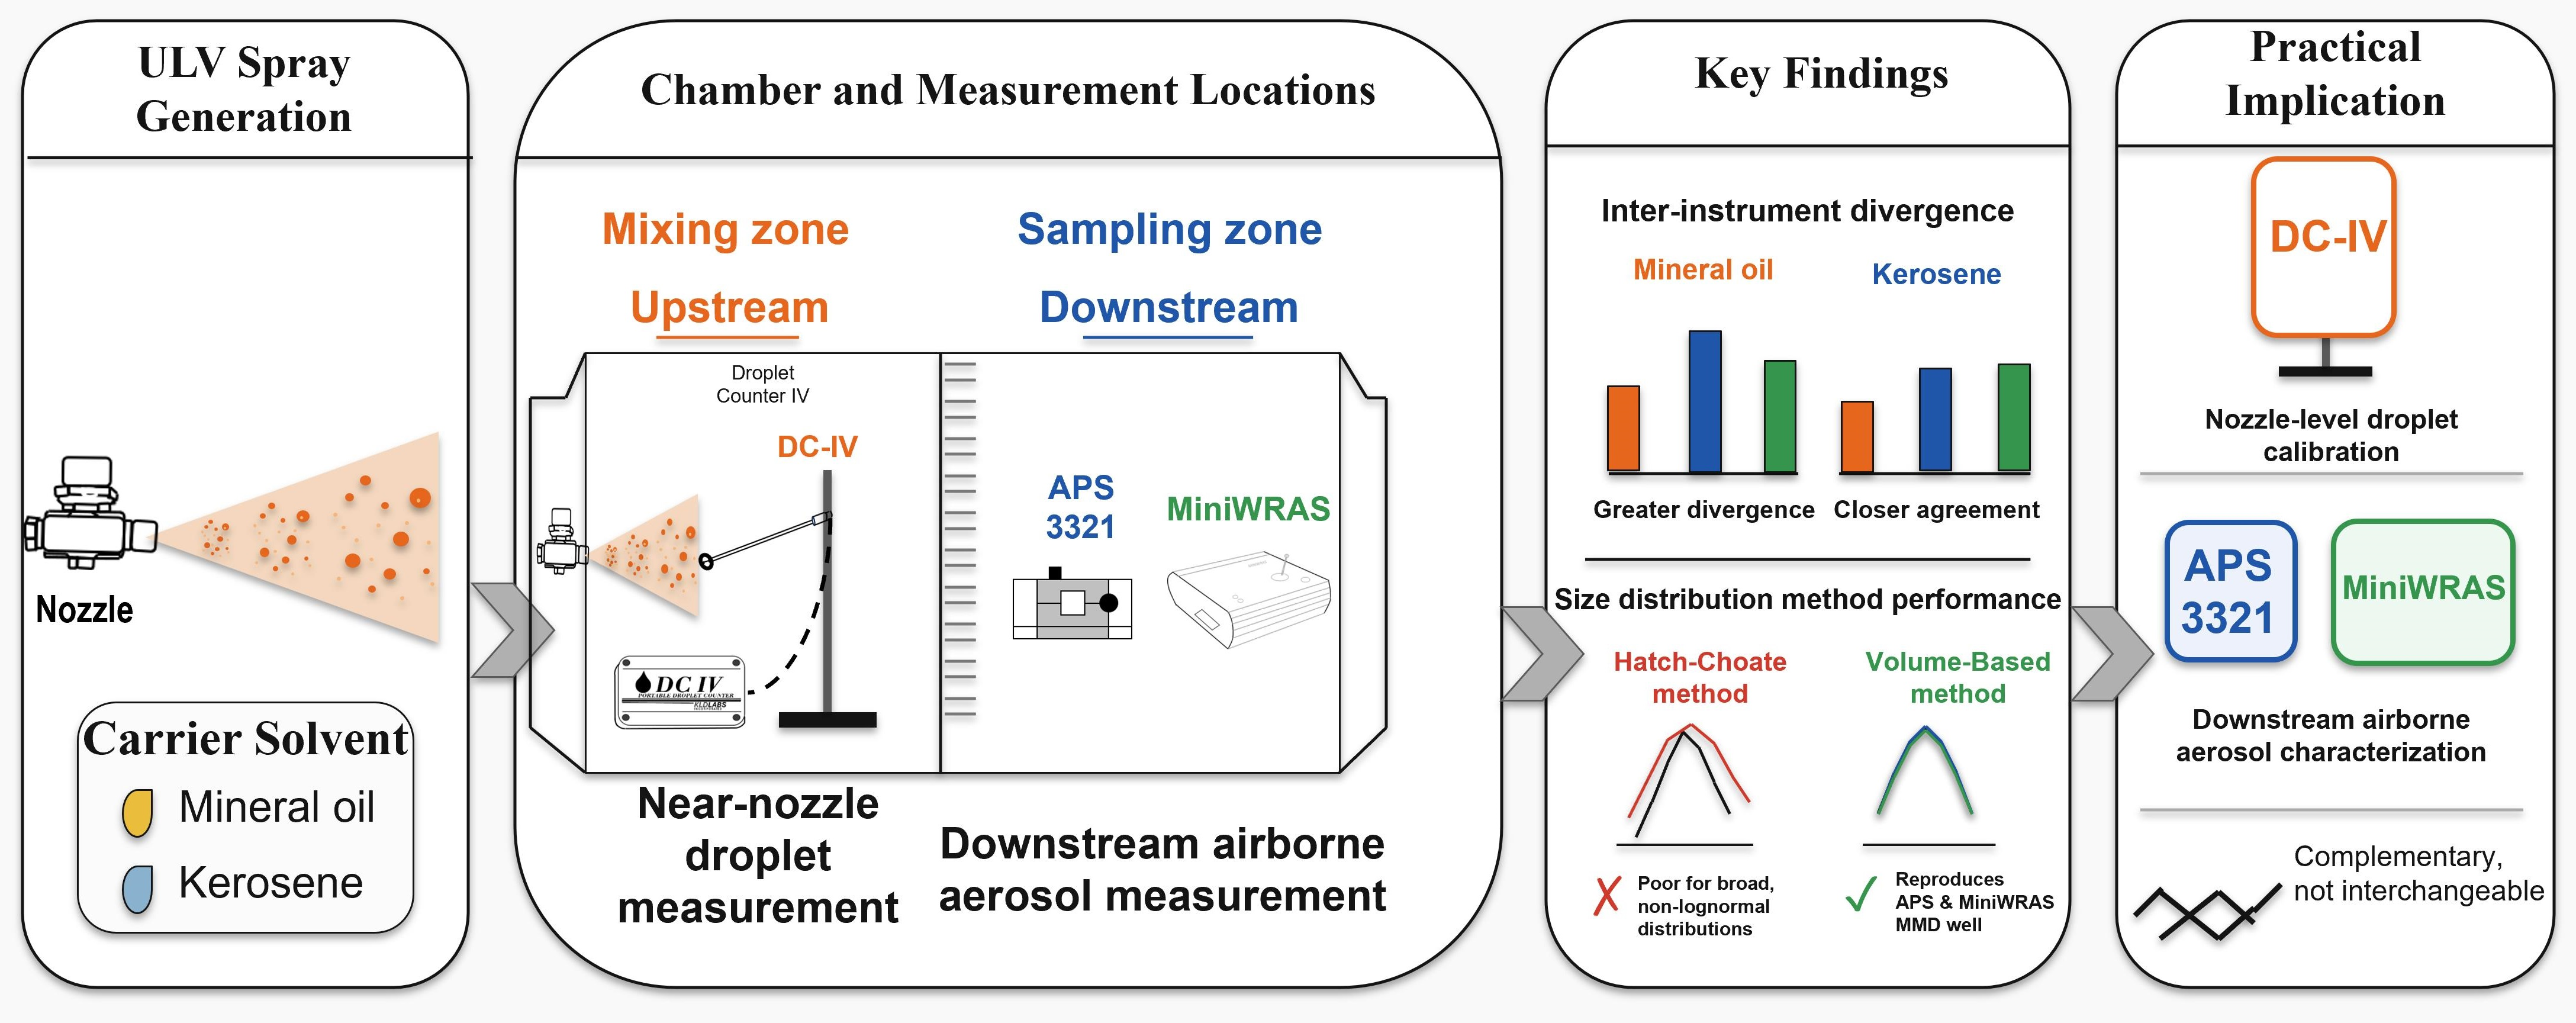
Graphical Abstract

1. Introduction

Vector-borne diseases remain a major public-health concern because mosquitoes, ticks, and other hematophagous arthropods can transmit viruses, bacteria, and parasites to humans [1]. The World Health Organization (WHO) reports that vector-borne diseases account for more than 17% of all infectious diseases and cause more than 700,000 deaths each year, with mosquito-borne illnesses such as malaria and dengue contributing substantially to that burden [2]. Globally, disease risk is influenced by interacting environmental and social drivers, including changing climate patterns, shifts in temperature and precipitation, travel, land-use change, and the expansion or seasonal persistence of vector habitats [3,4,5,6]. These dynamics increase the importance of evidence-based vector surveillance and control programs, particularly for workers and others with greater outdoor exposure.
Mosquito control programs typically operate within an integrated mosquito management framework that combines surveillance, source reduction, larval control, adult control when warranted, insecticide resistance testing, and public communication [7,8,9,10,11]. Both the Environmental Protection Agency (EPA) and the Centers for Disease Control and Prevention (CDC) emphasize that surveillance data should guide intervention decisions and that control programs are most effective when multiple strategies are used rather than relying on adulticide alone [8,12]. Source reduction remains a core long-term strategy because it targets larval habitat, whereas adult mosquito control may be needed when rapid population suppression is required to reduce immediate nuisance levels and/or public health risks. In North Carolina (NC), public health guidelines note that mosquito control spraying may be conducted to reduce disease risk, especially after flooding or when mosquito abundance becomes problematic [13].
Ultra-low-volume (ULV) adulticide systems are designed to generate small droplets, typically with a volume median diameter (VMD) in the range of 8–30 µm, that remain airborne long enough to contact flying mosquitoes while using relatively small amounts of active ingredients [14,15,16]. Field and semi-field studies often evaluate ULV performance by exposing caged mosquitoes at defined locations relative to the spray line and by measuring droplet size distributions to confirm that application systems are operating within an effective range [11,17,18]. In addition to biological endpoints such as mortality, droplet characterization is important because spray efficacy depends not only on formulation and dose but also on droplet size spectrum, transport behavior, and spatial distribution. Richards, et al. [19,20] further demonstrated how a controlled wind tunnel system can support standardized insecticide efficacy testing under reproducible conditions.
Several complementary approaches have been used to characterize ULV mosquito adulticide droplets in field and semi-field studies [15,21,22]. Rotating impactors and slide-based samplers are commonly used to collect deposited droplets for subsequent sizing and density analysis, and comparative work has shown that sampler design can substantially affect collection efficiency and the measured droplet spectrum [23,24]. In operational mosquito-control studies, Teflon-coated glass slides mounted on rotating samplers have been used to assess droplet number and size under defined field conditions, with digital image-analysis platforms such as DropVision® used to derive droplet size metrics from collected slides [15,25]. These field approaches have also incorporated fluorescent tracer dyes recovered from exposed slides to quantify spray deposition by fluorometric analysis [25]. In addition, Droplet Counter Version 4 (DC-IV) hot-wire measurements have been used at the nozzle before field deployment to verify droplet-size characteristics such as Dv50 and Dv90 during ULV machine calibration [18,25]. Dv50 is the droplet diameter below which 50% of the cumulative spray volume is contained, whereas Dv90 is the droplet diameter below which 90% of the cumulative spray volume is contained.
Spray-generated droplets are aerosol particles when suspended in air, but nozzle-level droplet measurements and downstream airborne aerosol measurements should not be interpreted as equivalent measurements [18,26,27,28]. Interpretation depends on the measurement location, sampled particle population, physical sizing principle, internal data processing method, reported equivalent diameter, and instrument size range. Nozzle-level methods characterize droplets close to the point of atomization and are commonly applied to evaluate spray quality, calibration, deposition potential, drift potential, and biological efficacy. Common approaches include collector-based methods with image analysis, laser diffraction, phase Doppler particle analysis, and high-speed imaging [29,30]. Aerosol instruments characterize particles suspended in air and report size according to the measurement principle used, such as optical, mobility, or aerodynamic diameter [26,27]. In this context, the GRIMM MiniWRAS is a wide-range aerosol spectrometer that combines electrical-mobility measurements for smaller particles with optical detection for larger particles, whereas the TSI APS 3321 measures the aerodynamic diameter of airborne particles using time-of-flight principles and is especially useful for micron particles [31,32,33]. Therefore, the APS and MiniWRAS should be interpreted as real-time airborne aerosol instruments rather than direct substitutes for slide-based droplet measurements or DC-IV nozzle calibration.
While the vector-control community has well-established methods for characterizing ULV spray droplets using instruments such as the DC-IV, rotating impactors, and slide-based samplers, the calculation of derived size metrics from these instruments sometimes draws on equations developed within the aerosol science literature. For example, the Hatch–Choate conversion equation, as described by Hinds and Zhu [34], for estimating mass median diameter (MMD) from count median diameter (CMD) and geometric standard deviation (GSD), has been applied to DC-IV droplet count data in published mosquito-control studies [18], despite the DC-IV reporting MMD directly. However, this equation assumes a lognormal size distribution, and its validity for the polydisperse or bimodal distributions commonly produced by ULV atomizers has not been systematically evaluated. Beyond the question of how size metrics are calculated, the instruments used to generate those metrics also differ fundamentally in what they measure. Although the DC-IV, APS, and MiniWRAS rely on different sizing principles and are not expected to yield identical absolute diameter measurements, their comparison is still warranted in ULV mosquito-control research because they interrogate different but related stages of spray behavior. The DC-IV is used to characterize droplets generated at the nozzle source, whereas the APS and MiniWRAS measure particles within the airborne spray plume in real time. Since operational success depends on both initial droplet generation and subsequent airborne behavior, a controlled comparison can clarify whether aerosol-based instruments capture trends consistent with conventional droplet-characterization methods and whether they offer complementary utility for spray assessment, calibration, and field monitoring. Accordingly, the objectives of this study were to (1) evaluate nozzle-level droplet characterization and downstream airborne aerosol measurement approaches for proxy ULV mosquito-control spray characterization under controlled testing conditions, with attention to calibration and standardization implications, and (2) assess agreement between commonly used MMD calculation and reconstruction methods.

2. Methods and Materials

2.1. Particle Size Measurement Instrumentation

Three complementary instruments were used to characterize the size distributions of spray droplets and airborne particles across a wide size range, as shown in Table 1. Each instrument operates on a different physical measurement principle and reports a distinct equivalent diameter type, which must be considered when comparing size distributions across instruments.

2.1.1. Droplet Counter Version 4 (DC-IV)

The DC-IV (KLD LABS, Inc., Hauppauge, NY, USA) measures the size and count of liquid droplets using a heated hot-wire probe as the sensing element [35]. Each droplet contacting the probe cools a length of wire proportional to its diameter, thereby reducing the probe’s electrical resistance by an amount proportional to the droplet’s size. The probe forms one leg of a Wheatstone bridge circuit; the resulting resistance change is conditioned, analyzed, and sorted electronically to yield the droplet size distribution. After each measurement, the wire is reheated to evaporate the droplet, allowing sampling rates of up to 500 droplets per second with a measurement cycle of less than 50 ms. The DC-IV measures water droplets from 1–600 µm and oil droplets from 1–200 µm. The device has a probe with an open-ring sensing element (wire) attached to a controller that must be operated via a Windows computer. The DC-IV is designed for direct droplet-contact measurement using a heated hot-wire probe. Therefore, it must be positioned near and facing the atomizer so droplets generated at the source can physically contact the sensing wire. The instrument uses a 30 s collection window that must be initiated by the user for each measurement, limiting its ability to provide continuous real-time monitoring. The DC-IV calculates a summary statistic after the 30 s collection window, which includes MMD, Sauter Mean Diameter, Volume Mean Diameter, Area Mean Diameter, Number Mean Diameter, VmeD 90th and 10th percentiles, VmeD Span, Number Median Diameter (NMD; referred to as CMD throughout this study to match the other instruments), total droplet count, droplet type, and collection time. The DC-IV also provides a binned size-distribution table, with one row for each integer diameter bin (1, 2, 3, … µm). Each row contains six columns: bin diameter (µm), droplet count in that bin, total volume contribution for that bin, percentage of total volume, cumulative volume, and cumulative percentage of total volume. The total droplet count reported by the DC-IV represents the number of droplet-contact events detected during the 30 s collection window, not a volumetric particle number concentration. Because detection requires droplet contact with the heated wire, the reported count and size distribution may be influenced by probe orientation, droplet trajectory, droplet size, and droplet-to-wire collection efficiency. Therefore, the DC-IV is best interpreted as a nozzle-level droplet sizing and counting instrument rather than an inlet-based concentration monitor equivalent to the APS or MiniWRAS.

2.1.2. Aerodynamic Particle Sizer (APS)

The TSI APS Model 3321 (TSI Inc., Shoreview, MN, USA) measures particle aerodynamic diameter in the range of 0.5 to 20 µm using the time-of-flight principle [36]. Particles are accelerated through a nozzle into a region of known velocity gradient, where larger particles take longer to accelerate due to their greater inertia and therefore arrive at the detection point later. The instrument uses a patented double-crest optical system with two partially overlapping laser beams (30 mW, 655 nm laser diode) positioned downstream of the nozzle to measure the transit time of each individual particle. As particles pass through the overlapping beams, they generate signals with two crests, and the time between crests provides aerodynamic particle size information. This double-crest design also enables coincidence detection when multiple particles are present simultaneously in the measurement volume. The instrument operates at sample flow rates of 1.0 L/min and sheath air flow rates of 4.0 L/min and classifies particles into 52 size channels with high resolution (0.02 µm at 1.0 µm, 0.03 µm at 10 µm). The maximum processing rate exceeds 200,000 particles/sec, with recommended maximum concentrations of 1000 particles/cm3 to maintain <5% coincidence at 0.5 µm. The APS can record at 1 s time resolution, but the measurements are best smoothed with 20 s or 1 min averages to obtain more reliable results.

2.1.3. Portable Wide-Range Aerosol Spectrometer (MiniWRAS)

The GRIMM Mini-WRAS 1.371 (GRIMM Aerosol Technik, Ainring, Germany) combines two complementary measurement technologies to characterize particle size distributions across the range of 10 nm to 35 µm in 41 size classes [37]. The two measurement channels address different size regimes and report different equivalent diameter types, which are merged into a single composite distribution by the instrument’s software (Mini-WRAS_V10-2, GRIMM Aerosol Technik, Ainring, Germany). Particles smaller than 200 nm, including nanoparticles, are measured using electrical mobility sizing. Particles are charged via corona discharge (3 kV), then classified by electrical mobility in a variable electric field (−2 to −320 V). Deposited particles generate a current proportional to particle number, resolving size distributions into 10 classes, reported as the electrical mobility diameter. Particles larger than or equal to 200 nm are detected via single-particle light scattering using a 655 nm laser diode. Light scattered at 90° is detected by a photodiode, with signal intensity proportional to particle size. The laser operates at two power levels (40 mW for 200 nm–2.5 µm; 0.5 mW for 2.5–25 µm) to optimize sensitivity. The instrument reports optical equivalent diameter and is calibrated using NIST-certified polystyrene latex particles. Based on personal email communication with the manufacturer, the two channels are merged into a composite distribution (10 nm–35 µm, 41 size classes), with optical sizing ≥200 nm and electrical mobility sizing <200 nm. The MiniWRAS records measurements at a 1 min time frequency.
The DC-IV was selected because it is commonly used for operational nozzle-level ULV droplet calibration in mosquito-control applications and provides direct measurement of droplets generated near the atomizer. The APS and MiniWRAS were selected because both instruments provide real-time measurements of the downstream airborne aerosol fraction, but they use different sizing principles and detectable size ranges, as summarized in Table 1. Including both aerosol instruments allowed comparison of downstream aerosol measurements obtained using different physical measurement approaches. Together, the three instruments represent complementary measurement roles in ULV spray evaluation, including nozzle-level droplet calibration and downstream airborne aerosol characterization. Laser diffraction and phase Doppler particle analysis are valuable reference methods for spray characterization and would strengthen future absolute sizing comparisons. However, they were not selected as the primary instruments because the objective of this study was not to establish absolute droplet-sizing accuracy against an optical reference method. Instead, the objective was to evaluate how an operational nozzle-level DC-IV measurement relates to downstream real-time aerosol measurements from the APS and MiniWRAS, and how the two downstream aerosol instruments compare when applied to the same ULV spray-generation conditions.

2.2. Experimental Design

2.2.1. Liquid Oil Material

Two different oils were selected to evaluate instrument performance across a range of spray characteristics relevant to operational mosquito control. Petroleum distillates are used in commercial insecticides, including widely used products such as Fyfanon® (some formulations), Duet®, Dibrom® Concentrate, and Zenivex® [38,39,40,41,42]. Mineral oil (UltraPro, UltraSource LLC, Kansas City, MO, USA) was selected, representing the highly refined mineral oil products commonly used as diluents in mosquito control operations [43]. Commercial mineral oil products such as ORCHEX® (ExxonMobil, Spring, TX, USA) and BVA 13 (BVA Inc., Wixom, MI, USA) are EPA-registered for use as solvents in mosquito control formulations and contain >99% unsulfonated residue with non-phytotoxic properties [43]. Companies such as Clarke Environmental Mosquito Management offer high-quality mineral oil diluents (Envirotech ULV Diluent Oil, Roselle, IL, USA) for use with oil-based mosquito control products where labels permit dilution with mineral oil [44,45]. Kerosene oil (Petroleum Distillate, CAS 80008-20-6, Spectrum Chemical Mfg. Corp., New Brunswick, NJ, USA) was selected as an oil product derived from petroleum products, with distinct physical properties. Pyrethrum extract products, such as those containing 2% pyrethrins, are routinely diluted with kerosene at a 1:19 ratio for space-spray applications in public health programs outside the United States (US) [46]. Kerosene serves as a traditional solvent in mosquito-control formulations, predominantly utilized in thermal fogging applications rather than modern ULV space spraying due to its physical properties and lower aromatic profile [43]. Therefore, Drakeol mineral oil (Calumet Refining, LLC, Indianapolis, IN, USA) and kerosene petroleum distillate (Fisher Scientific—Cat #18611159, Waltham, MA, USA) were used to generate droplets and particles.
For this comparative instrument evaluation, the carrier solvents were used without active insecticide ingredients to eliminate potential safety hazards associated with handling insecticide formulations within the confined 0.5 m3 test chamber described in the following section. The carrier fluids were used as formulation-relevant surrogates to isolate the effects of solvent properties on atomization and instrument response while avoiding the safety and waste-disposal requirements associated with complete insecticide formulations. This approach allowed extended measurement periods and repeated trials while minimizing occupational exposure risks, specialized ventilation requirements, and waste-disposal protocols that would be necessary when working with insecticidal formulations in an enclosed laboratory environment. The inclusion of both carrier fluids allows for assessment of how instrument measurement characteristics vary with fluid properties, providing insights relevant to the diverse range of carrier oils used in operational mosquito control programs, while maintaining the spray atomization characteristics typical of field applications.

2.2.2. Droplet and Aerosol Generator

The oil was supplied to the atomizer via a 60 mL syringe loaded onto a Model 1010 Syringe Pump (New Era Pump Systems, Inc., Farmingdale, NY, USA). The pump was configured to deliver the oil at a controlled dispensing rate (mL/min) through a dedicated feed line connected directly to the aerosol generator’s intake. This generator utilized a commercial-grade air atomizing body (Model 1/4J, Spraying Systems Co., Glendale Heights, IL, USA) equipped with an Air Atomizing Fluid Cap (PF100150-SS) and an Air Atomizing Air Cap (PA67147-SS). To facilitate atomization, particle-free air was introduced to the opposite side of the generator assembly from a five-stage desiccant system at different pressures described below.

2.2.3. Chamber Description

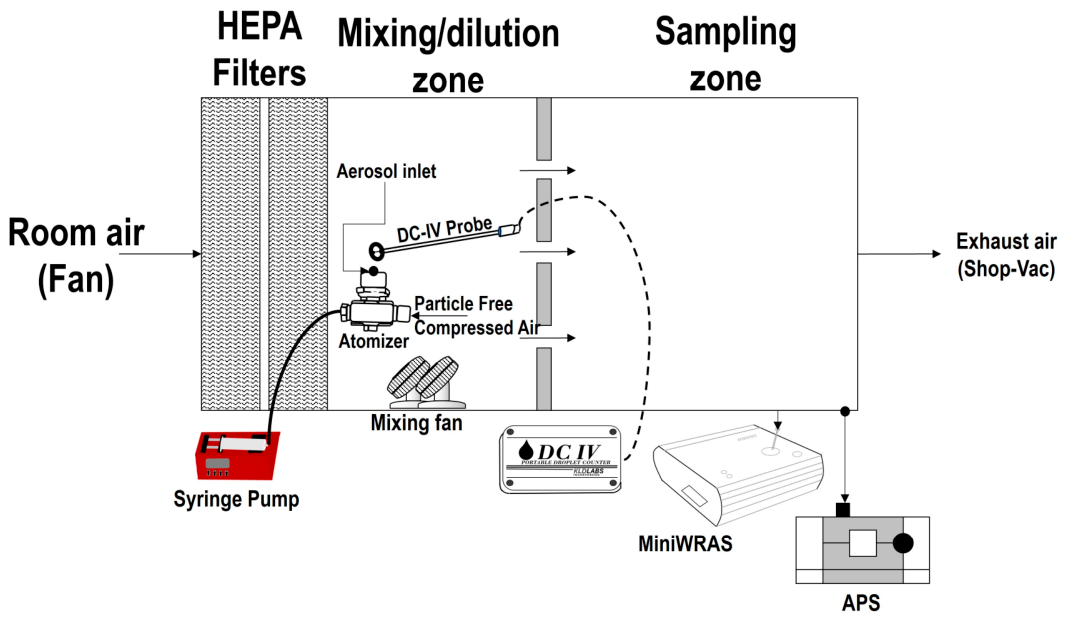
Experiments were conducted in an air-tight Plexiglass exposure chamber designed to control aerosol generation, as shown in Figure 1. The chamber is divided into two distinct sections: a mixing zone (0.25 m3) and a sampling zone (0.25 m3). The mixing zone serves as the primary area for droplet and particle generation from the atomizer. Within this zone, two small internal fans ensure the thorough mixing of the generated aerosol. Particle-free air was supplied to the mixing zone through two industrial-grade high-efficiency particulate air (HEPA) filters with a 99.99% efficiency rating. These two sections are separated by a honeycomb flow straightener (AS100, Ruskin, Grandview, MO, USA), which facilitates the development of a uniform airflow entering the sampling zone and improves reproducibility of downstream aerosol transport to the APS and MiniWRAS inlets. A detailed schematic of the chamber configuration is provided in Figure 1. The DC-IV probe was positioned within the mixing zone with the open-ring sensing element oriented directly toward the atomizer. The probe was placed on the atomizer-facing side of the fans so that fan-generated airflow was directed away from the sensing element, minimizing direct airflow interference with droplet-contact measurements. The APS and MiniWRAS were positioned outside the chamber while sampling directly from the sampling zone. Chamber temperature was maintained at 23 ± 2 °C and relative humidity at 35 ± 5% throughout all experiments, and between experiments, the chamber was purged with HEPA-filtered air.

2.2.4. Conceptual Comparison

The spatial arrangement of the instruments within the chamber was dictated by their operating requirements and reflects their intended measurement roles. The DC-IV was positioned near the atomizer because it is designed for direct droplet contact and nozzle-level spray characterization. Conversely, the APS and MiniWRAS were placed in the downstream chamber zone because they are inlet-based aerosol instruments and could not operate reliably in the mixing zone at the generated concentrations. This configuration allowed simultaneous measurement of related but different stages of the spray process, including near-source droplet generation and the downstream airborne aerosol fraction. Rather than a direct intercomparison of instruments measuring the same aerosol population, this study evaluates complementary measurement approaches applied at two operationally relevant stages of the spray process: droplets generated near the nozzle and the airborne aerosol fraction that remains suspended downstream. In effect, this design compares the droplet population as generated at the nozzle with the airborne aerosol fraction available to contact target mosquitoes downwind.

2.2.5. Operation Guidelines

The atomizer was operated under similar conditions for both oil products, where the mineral oil droplets and particles (density = 0.92 g/cm3) were generated at five liquid feed rates (Q = 0.20, 0.40, 0.60, 0.80, and 1.00 mL/min) across a range of nozzle pressures (P = 1.0–10.5 bar). The kerosene droplets and particles (density = 0.80 g/cm3) were generated at four liquid feed rates, identified here with the symbol Q, where Q = 0.40, 0.60, 0.80, and 1.00 mL/min across nozzle pressures, identified here with the symbol P, where P = 2.0–5.2 bar (13 conditions total, compared to 27 for mineral oil). The narrower kerosene operating range was selected based on the stable atomization window identified during prior mineral oil characterization runs, where conditions at the lowest pressures and flow rates exhibited high measurement variability during mineral oil testing, which informed the selection of the kerosene range. Because the mineral oil and kerosene matrices were not fully balanced in number of conditions or pressure range, solvent-dependent comparisons should be interpreted as descriptive and condition-specific rather than as a fully balanced solvent-effect experiment. In each flow rate and pressure combination, a steady state was established, and measurements were recorded for 5 min. The DC-IV recorded a 30 s measurement for each minute, while the APS and MiniWRAS collected 1 min measurements.

2.3. Data Analysis

2.3.1. Steady-State Selection and Condition-Level Data Aggregation

For each flow rate-pressure combination, a steady-state period was identified before instrument measurements were used for analysis. Steady state was operationally defined as the period during which the MiniWRAS total particle concentration remained within ±5% of the mean concentration for the selected analysis interval. The MiniWRAS was selected as the steady-state reference because it provided continuous downstream total particle concentration measurements across the broadest aerosol size range among the real-time downstream instruments. The DC-IV was not used for this purpose because it operates in discrete, manually triggered 30 s sampling windows and measures near-source droplets rather than the downstream airborne fraction. The APS was not selected as the primary steady-state reference because its narrower size range and concentration limitations made it less suitable for defining the overall downstream chamber stabilization period. Start and end times for the steady-state interval were recorded manually using the MiniWRAS time series and the predefined ±5% concentration-stability criterion. These time stamps were then used to select the corresponding APS and MiniWRAS data for analysis and to confirm that DC-IV measurements were collected during the stabilized operating period for each condition. Each steady-state window was associated with its target pressure, flow rate, and steady-state number for subsequent analysis.
To account for differing native sampling rates across the instruments (e.g., a 30 s measurement interval for the DC-IV versus a 1 min interval for the APS and MiniWRAS), each steady-state window was collapsed into a single mean value per instrument. All raw measurements recorded within a given steady-state window were used to calculate the representative 5 min steady-state mean and standard deviation. Utilizing these steady-state means improves comparability across diverse instrument platforms and prevents statistical overweighting of conditions sampled for longer durations.

2.3.2. Diameter Corrections

Because each instrument reports a different equivalent diameter type (Table 1), measured diameters were converted to geometric (volume-equivalent) diameter before inter-instrument comparison. The DC-IV reports geometric diameter directly and requires no correction. The physical parameters used for all conversions were: particle density = 0.92 g/cm3 (mineral oil) or 0.80 g/cm3 (kerosene), reference density = 1.00 g/cm3, dynamic shape factor χ = 1.0 (spherical droplets), and mean free path λ = 65.1 nm.
For the APS, both number-weighted (dN) and mass-weighted (dM) distributions report aerodynamic diameter, consistent with the instrument’s time-of-flight measurement principle. Aerodynamic diameters were converted to geometric (volume-equivalent) diameters using the analytical relation dgeo = dae/(ρp0)0.5, assuming spherical droplets (dynamic shape factor χ = 1.0), where dgeo is the geometric diameter, dae is the aerodynamic diameter, ρp is the particle or droplet density, and ρ0 is the unit reference density. For these conversions, ρp was set to 0.92 g/cm3 for mineral oil and 0.80 g/cm3 for kerosene, and ρ0 was set to 1.00 g/cm3. For the MiniWRAS, a size-dependent correction was applied based on the manufacturer-reported bin type. Bins below 200 nm were treated as electrical mobility diameter and converted to geometric diameter using the mobility-to-geometric correction described above. Bins at or above 200 nm were treated as optical equivalent diameter and were approximated as geometric diameter for the spherical oil droplets used in this study. The manufacturer-reported MiniWRAS size bins were used as the starting point for these conversions. This study did not independently modify the MiniWRAS inversion algorithm or apply additional corrections for charging efficiency or multiple charging beyond those included in the manufacturer-reported output.

2.3.3. DC-IV Comparative Particle Size Characterization

The DC-IV manual does not provide details on the droplet characterization method, with limited detail on the science [35]. Therefore, the study independently determined how the instrument calculates the MMD and CMD from reported count and volume values for different particle sizes and compared the calculated results with the reported values.
For the liquid droplet aerosols evaluated in this study, the volume median diameter (VMD) and MMD are equivalent because all droplets within a given test were generated from the same liquid and were therefore assumed to have uniform density. Under this condition, droplet mass is proportional to droplet volume, m = ρV, and multiplying each droplet volume by the same constant density does not change the cumulative distribution percentile. Therefore, the 50% cumulative volume diameter occurs at the same diameter as the 50% cumulative mass diameter. This equivalence has been stated explicitly in the aerosol and spray literature, where VMD and MMD are described as the same when particles or droplets have the same material or mass density [47,48]. Therefore, the DC-IV-reported MMD was used as the VMD/Dv50-equivalent median droplet diameter in this study.

2.3.4. MMD Validation

MMD was calculated by applying linear interpolation between bin midpoints on the cumulative volume distribution at the 50th percentile, using the instrument’s reported Volume column [34].
MMD/VMD = di + (di+1 − di) × (0.5 − Fi)/(Fi+1 − Fi)
where Fi is the cumulative volume fraction at diameter di, computed from the instrument’s Volume column.

2.3.5. CMD Validation

CMD was calculated by applying within-bin uniform interpolation to the cumulative count distribution at the 50th percentile. Each integer bin d is treated as a 1 µm wide interval spanning [d − 0.5, d + 0.5] µm, with bin 1 spanning [0, 1.5] µm:
CMD = lb + (0.50 × Ntotal − Ch)/nh
where lb is the lower bound of the bin containing the 50th percentile, Ntotal is the total particle count, Ch is the cumulative count below that bin, and nh is the count within that bin. This assumes particles are uniformly distributed within each 1 µm bin.
To validate the instrument’s internal calculations, a total of 30 DC-IV measurements were selected from the mineral oil exposure data, encompassing both steady-state and non-steady-state periods. The independently calculated MMD and CMD values were then compared with the instrument’s reported values, and the differences were calculated.

2.3.6. MMD Method Comparison

The different devices report MMD based on the manufacturer’s internal calculation. Therefore, we evaluated different methods for MMD comparison:
Method 1: Reported MMD: This method directly extracts each instrument’s internally calculated MMD from output files or statistics, serving as the reference standard for that instrument.
Method 2: Distribution-Free MMD: The approach assumes spherical particles and calculates Volume per bin as
Vi = ni × di3
where ni is particle count and di is bin diameter. MMD is then determined by linear interpolation at the 50th percentile of the cumulative volume distribution using Equation (1).
Method 3: Hatch–Choate Conversion MMD: This method assumes a lognormal particle size distribution [34]. This method is included to test the validity of the lognormal assumption for the aerosols generated in this study; because the Hatch–Choate equation is exponentially sensitive to GSD, departures from lognormality can produce large errors in the converted MMD.
For the Hatch–Choate conversion, CMD was first calculated using the validated within-bin interpolation approach. The GSD was then calculated as d84.13%/CMD, where d84.13% was determined using the same within-bin interpolation procedure at the 84.13th percentile. MMD was then calculated using the Hatch–Choate equation:
MMD = CMD × exp(3 × (ln GSD)2)
Method 4: Volume-Based MMD: This method uses the most appropriate volume or mass data source for each instrument. To ensure fair comparisons and validate the calculations against reported values, the interpolation technique applied to the cumulative distribution is tailored to match each instrument’s specific internal processing logic.
DC-IV Implementation: This method uses the instrument’s measured Volume column directly from the reported instrument Statistic Detail table. This preserves the instrument’s actual particle volume measurements without making assumptions about bin-label accuracy. While Method 2 recalculates volume using Vi = ni di3 from bin labels, Method 4 uses the instrument’s actual measured Volume column directly (which preserves measurement accuracy) and calculates MMD using linear interpolation between bin midpoints at the 50th percentile.
APS Implementation: This uses the dM (mass) distribution data since APS dM output represents mass-weighted measurements (equivalent to volume-weighted measurements for constant-density particles). Crucially, to accurately mirror the APS’s internal processing, the cumulative mass fraction is assigned to the upper boundary (high edge) of each size bin. MMD is then determined by log–log interpolation (log of the cumulative fraction vs. log of the diameter) at the 50th percentile of the cumulative mass distribution.
MiniWRAS Implementation: This uses the dM distribution data converted to mass per bin. However, unlike the APS, the MMD is determined via linear interpolation between bin midpoints on the cumulative mass distribution, as this approach best aligns with the MiniWRAS internal reporting logic [37].
Method 4 uses instrument-specific mass- or volume-weighted distributions, reducing the mismatch between number- and mass-weighted metrics that affects other calculation methods. Tailoring the interpolation bounds (midpoint vs. upper edge) was intended to reproduce manufacturer-reported MMD values, but performance was evaluated empirically by comparing calculated values with reported MMD values.
MMD Comparison Approach: The reported MMD values were compared between devices, and the effects of pressure and liquid feed rate on MMD were evaluated for each device for both mineral oil and kerosene. For the comparison of Methods 1 through 4, both mineral oil and kerosene data were evaluated. Condition-level calculated MMD values are presented separately for mineral oil and kerosene in Tables S3 and S4, respectively, and percent differences from reported MMD values are summarized in Table S5.

2.3.7. CMD Comparison

The reported CMD values were compared between devices, and the effects of pressure and flow rate on CMD were evaluated for each device for both mineral oil and kerosene oil.

2.3.8. Statistical Analysis

CMD and MMD values were reported as the mean (standard deviation) and median (minimum–maximum) for each solvent (kerosene and mineral oil) and instrument (DC-IV, APS, and MiniWRAS). Because the sample sizes were small and the data exhibited substantial variability, particularly for the DC-IV, non-parametric methods were used for inferential comparisons. Wilcoxon signed-rank tests were used to compare CMD and MMD values between instrument pairs within each solvent using matched operating conditions available for both instruments in each pairwise comparison. The percent differences between the three MMD calculation methods (Distribution-Free, Hatch–Choate, and Volume-Based) and the reported MMD values were summarized as the mean (standard deviation) and median (minimum–maximum). A descriptive ±1% threshold was used to classify whether each method reproduced the reported MMD values. Wilcoxon signed-rank tests were used to assess whether percent differences differed from zero. Linear regression models were fitted to predict CMD and MMD values as a function of atomization pressure and liquid feed rate for each instrument and solvent combination. Statistical analyses were performed using SAS Version 9.4 (SAS Institute Inc., Cary, NC, USA). A significance level of 0.05 was used for all tests.

2.3.9. Regression Analysis

To quantify the relationships between instrument MMD and CMD measurements and operating conditions, and to evaluate the association between measurements from different instruments, a three-step analytical approach was applied to the reported MMD and CMD values for both mineral oil and kerosene.
Step 1: Individual Device Regression. The reported MMD and CMD were each modeled as a function of atomization pressure and liquid feed rate, including their interaction, for each separate instrument:
MMD = β0 + β1 (Pressure) + β2 (Flow Rate) + β3 (Pressure × Flow Rate) + ε
where β0 is the intercept; β1, β2 and β3 are regression coefficients (for pressure, flow rate, and their interaction, respectively); and ε is the residual error term. All regression models were fitted using ordinary least squares (OLS), and model performance was evaluated using the coefficient of determination (R2). Individual predictor significance was assessed using t-statistics and p-values for each coefficient.
Step 2: Inter-Device Correlation. To evaluate the degree of association between the reported MMD and CMD values of different instruments, Pearson’s correlation coefficients were calculated for all three pairwise combinations: APS vs. DC-IV, MiniWRAS vs. DC-IV, and MiniWRAS vs. APS. This step assessed the feasibility of inter-instrument conversions for operational mosquito control settings where only a single instrument may be available.
Step 3: Inter-Device Correlation Conditional on Operating Conditions. To determine whether accounting for operating conditions improves inter-device association, partial Pearson’s correlations were calculated for the three pairwise combinations. This step addressed the observation that inter-instrument agreement varied substantially across the tested range of operating conditions.
Regression and correlation data were analyzed using SAS Version 9.4. A significance level of 0.05 was used for all statistical tests.

2.3.10. Size Distribution Analysis

To examine how the size distributions compared across the three instruments for mineral oil and kerosene oil under contrasting operating conditions, a subset of representative pressure and flow-rate combinations was selected from the full dataset for detailed distribution analysis. Rather than plotting all steady-state conditions, certain conditions were chosen to span the full range of inter-instrument agreement observed in the MMD comparison. The selected conditions were intended to capture the best agreement, moderate disagreement, near-maximum disagreement, and the transitional regime between agreement and divergence. For each selected condition, the mean dM/dlogDp (mass-weighted) and dN/dlogDp (number-weighted) distributions were computed from the steady-state aggregated data. The mean distribution with ±1 standard deviation shading was plotted for all three instruments on a common geometric diameter axis. Size-distribution figures were generated using MATLAB R2026a (The MathWorks Inc., Natick, MA, USA).

3. Results

3.1. DC-IV Comparative Particle Size Characterization

The independently calculated MMD and CMD values were compared to the DC-IV’s reported values across 30 measurements (Table 2). The MMD values ranged from 1.000 to 97.164 µm, with a mean of 16.284 µm, and CMD values ranged from 0.586 to 0.711 µm, with a mean of 0.637 µm. Differences between calculated and reported values were consistently small (~0.01 µm or less), confirming that the DC-IV uses linear interpolation between bin midpoints on the cumulative volume distribution for MMD and within-bin uniform interpolation on the cumulative count distribution for CMD.

3.2. MMD Comparison

3.2.1. Measured (Reported) MMD—Method 1

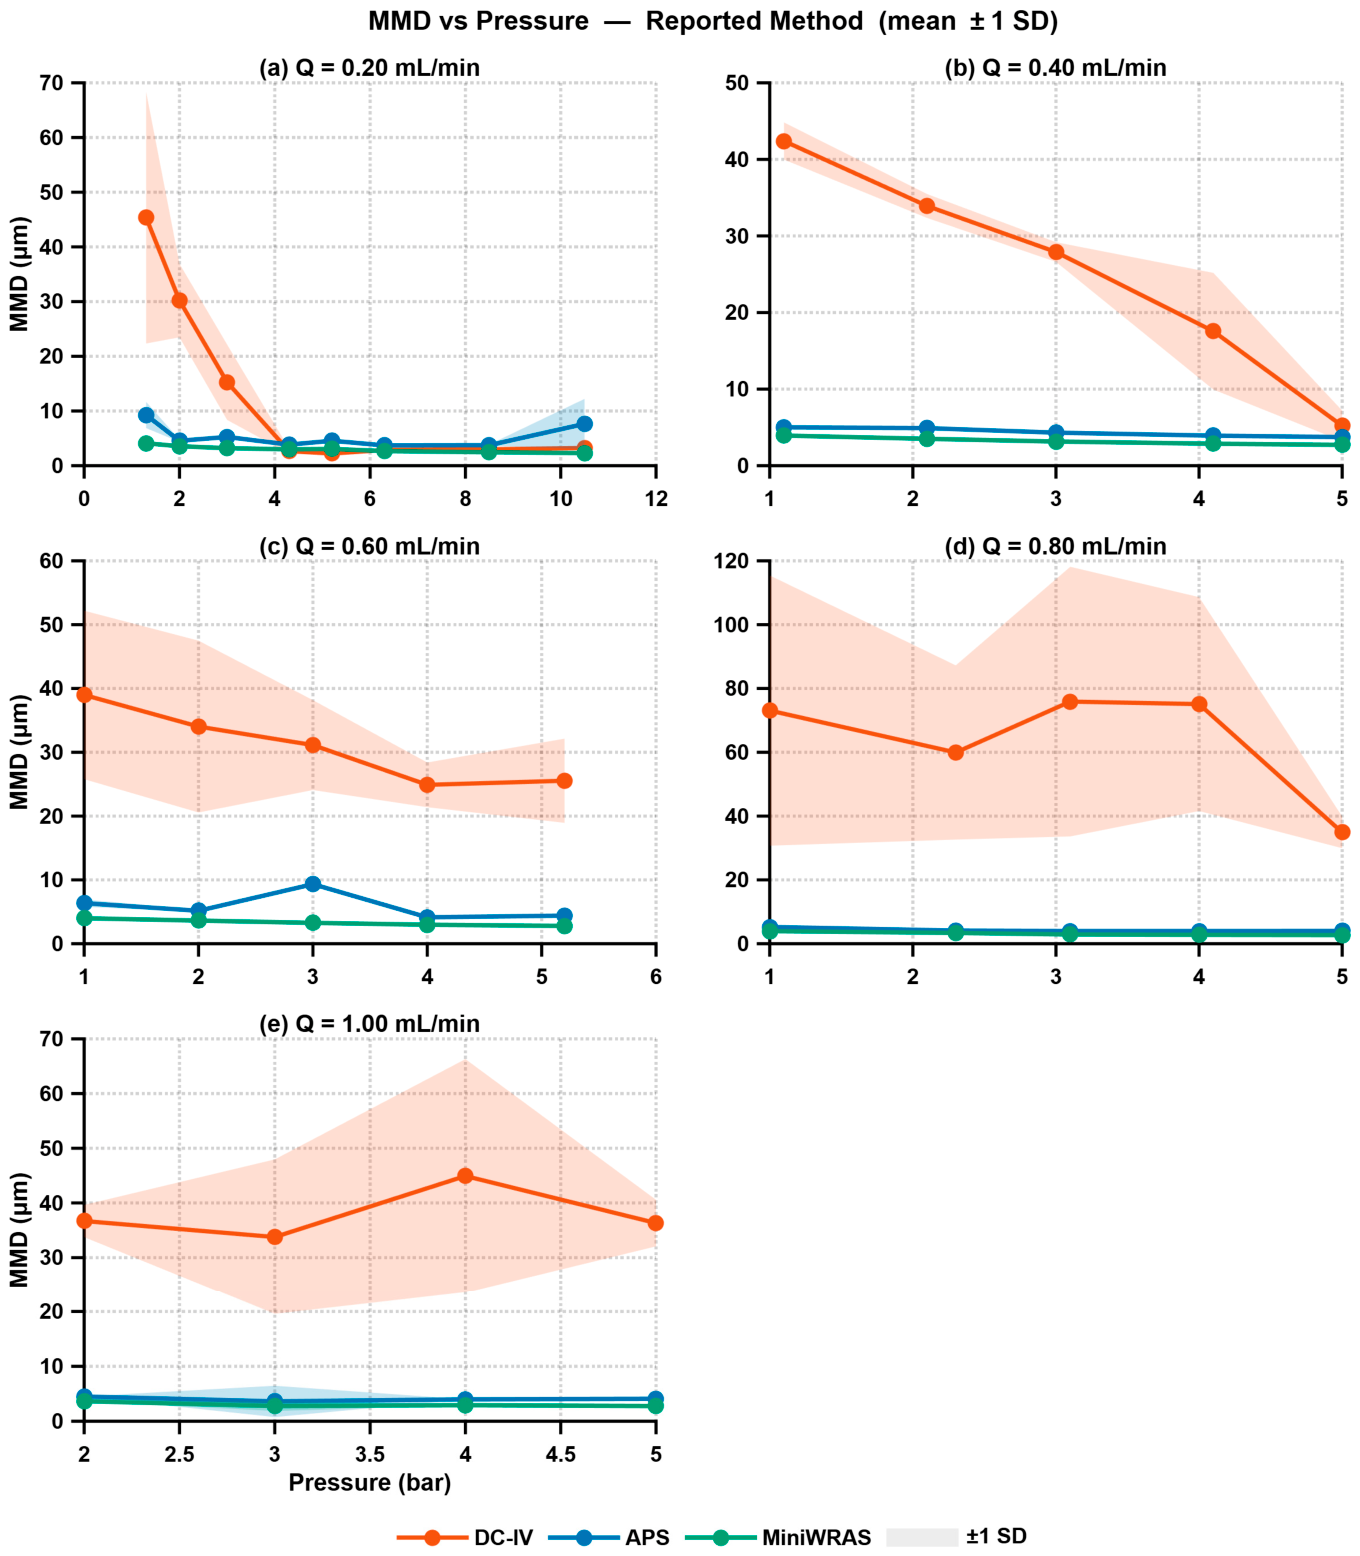
Mineral Oil: The measured MMDs for the DC-IV, APS, and MiniWRAS during mineral oil exposure at different pressures and flow rates are shown in Figure 2. The three instruments reported distinct MMD ranges: The MiniWRAS consistently reported the smallest and most stable values, with a mean of 3.15 µm (range: 2.30–4.11 µm), followed by the APS with a mean of 4.88 µm (range: 3.61–9.84 µm), while the DC-IV exhibited substantial variability with a mean of 30.78 µm (range: 2.20–70.87 µm, based on the reported values from the raw data). All pairwise differences were statistically significant (Wilcoxon signed-rank test, p < 0.001; Table 3), indicating significant differences across all three instruments under mineral oil exposure.
Operating pressure (1.0 to 10.5 bar) demonstrated an inverse relationship with MMD as shown in Figure 2. Linear regression confirmed that pressure (β = −4.36, p = 0.001) and liquid feed rate (β = 33.5, p = 0.001) were both significant predictors of DC-IV MMD (R2 = 0.61), while the MiniWRAS model achieved the highest fit (R2 = 0.815; pressure β = −0.209, p < 0.001; Table S1). Neither pressure nor liquid feed rate was a significant predictor of APS MMD (R2 = 0.098; Table S1). For mineral oil, increasing atomization pressure was generally associated with lower MMD for the DC-IV and MiniWRAS, whereas APS MMD was comparatively insensitive to pressure. In the interaction models, the DC-IV pressure coefficient was negative but marginally non-significant (β = −4.397, p = 0.054), while flow rate (β = 33.15, p = 0.133) and the pressure × flow rate interaction (β = 0.100, p = 0.985) were not significant (R2 = 0.610). The MiniWRAS model achieved the highest fit and showed a significant negative pressure coefficient (R2 = 0.858; pressure β = −0.138, p < 0.001; pressure × flow rate interaction β = −0.205, p = 0.015). Neither pressure, flow rate, nor their interaction was a significant predictor of APS MMD (R2 = 0.112; Table S1).
The data showed that the DC-IV pressure response varied with liquid feed rate. Under low-pressure and higher-flow conditions, the DC-IV reported larger and more variable MMD values, including values exceeding 70 µm. In contrast, convergence to fine droplets near 2 to 3 µm occurred only under high-pressure, low-liquid-feed-rate conditions, particularly at 0.2 mL/min and pressures of approximately 4.3 to 8.5 bar. At higher liquid feed rates, DC-IV MMD remained elevated despite increased pressure, indicating that pressure alone did not fully determine source droplet size. The APS did not show significant pressure, flow rate or pressure × flow rate effects, whereas the MiniWRAS showed a smaller but statistically significant pressure × flow rate interaction. However, neither aerosol instrument exhibited the large condition-dependent MMD shifts observed with the DC-IV. The DC-IV aligned with the aerosol spectrometers only under high-pressure, low-liquid-feed-rate conditions, specifically at 0.2 mL/min and pressures between 4.3 and 8.5 bar, where MMDs converged at 2.22 to 3.00 µm. A critical transition zone was identified in the Q = 0.2, 0.4, and 0.6 mL/min panels of Figure 2, where the DC-IV measured intermediate MMDs between 15 and 28 µm at five pressure and flow-rate combinations. During these same conditions, the APS (3.92 to 5.25 µm) and MiniWRAS (2.79 to 3.20 µm) reported stable, fine-aerosol distributions. The DC-IV and MiniWRAS showed a moderate positive inter-instrument correlation for MMD during mineral oil exposure (Pearson r = 0.50, p = 0.008; Table S2). Across all mineral oil conditions, the mean APS-to-MiniWRAS MMD ratio was 1.56 (SD = 0.50, median = 1.39).
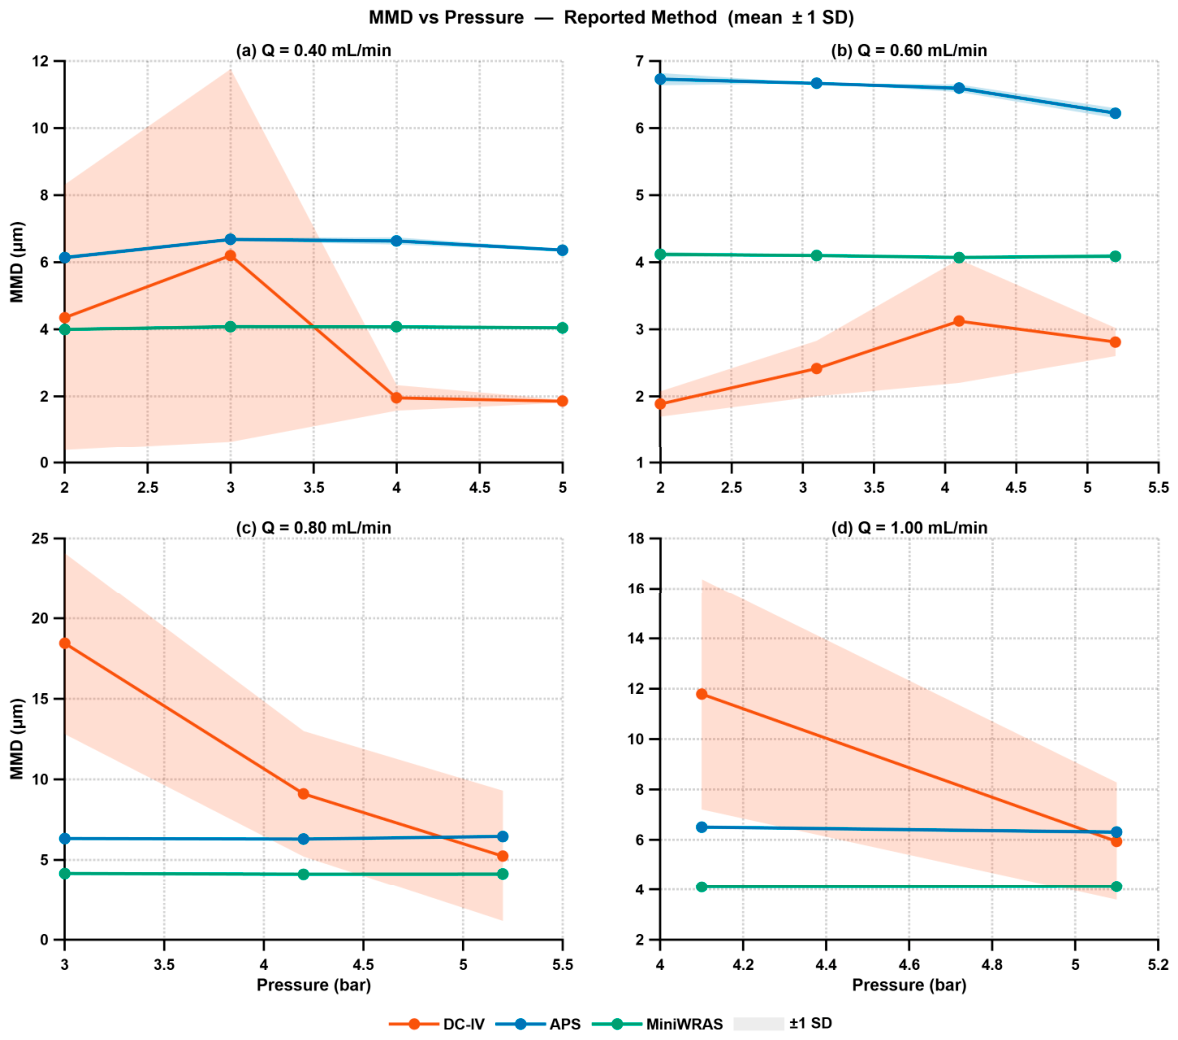
Kerosene: The measured MMDs for the DC-IV, APS, and MiniWRAS under kerosene exposure at different pressures and flow rates are shown in Figure 3. Compared with mineral oil, inter-instrument differences narrowed substantially. The MiniWRAS reported the most stable values with a mean MMD of 4.09 µm (range: 4.00–4.16 µm), the APS yielded a mean of 6.45 µm (range: 6.14–6.70 µm), and the DC-IV reported a mean of 6.21 µm (range: 1.86–19.50 µm). In contrast to mineral oil, the DC-IV MMD was not significantly different from either the APS (p = 0.497) or MiniWRAS (p = 0.455), although the APS remained significantly larger than the MiniWRAS (p < 0.001) (Table 3). The APS-to-MiniWRAS MMD ratio was more stable for kerosene (mean = 1.58, SD = 0.05, median = 1.57) than for mineral oil (mean = 1.56, SD = 0.50, median = 1.39), where a few high-disagreement conditions produced elevated ratios.
Pressure and liquid-feed-rate effects on MMD were generally weaker for kerosene than for mineral oil. Regression models for kerosene oil with interaction terms showed that for DC-IV MMD, pressure (β = 2.700, p = 0.512), flow rate (β = 47.37, p = 0.122), and the pressure × flow rate interaction (β = −7.497, p = 0.277) were not significant (R2 = 0.486; Table S1). For MiniWRAS MMD, flow rate was a significant predictor (β = 0.484, p = 0.020), while pressure (β = 0.045, p = 0.100) and the pressure × flow rate interaction (β = −0.082, p = 0.072) were not significant, although the interaction approached significance (R2 = 0.683; Table S1). Neither pressure, flow rate, nor their interaction was significant for APS MMD with kerosene (R2 = 0.135; Table S1). The DC-IV showed a condition-dependent response with kerosene: at 3.0 bar, increasing flow rate from 0.4 to 0.8 mL/min increased MMD from 7.84 to 19.50 µm, whereas at the tested pressures ≥5.0 bar, DC-IV MMD remained below 6.0 µm across the evaluated flow rates.
The DC-IV aligned most closely with the aerosol spectrometers at lower liquid feed rates; at 0.4 mL/min and 2.0 bar, the DC-IV (4.97 µm) and MiniWRAS (4.00 µm) showed close agreement, while at 3.0 bar, the DC-IV (7.84 µm) was closer to the APS (6.65 µm). A transition zone was identified at three pressure and flow-rate combinations: 0.8 mL/min at 3.0 bar, 0.8 mL/min at 4.2 bar, and 1.0 mL/min at 4.1 bar. Under these conditions, the DC-IV measured intermediate MMDs between 9.74 and 19.50 µm, while the APS (6.30 to 6.50 µm) and MiniWRAS (4.11 to 4.16 µm) continued to report stable fine-aerosol distributions (Figure 3).
Mineral Oil vs. Kerosene Oil: Comparing the two fluids, the DC-IV mean MMD for mineral oil (30.78 µm) was approximately five times larger than for kerosene (6.21 µm), whereas the aerosol spectrometers showed the opposite trend, with kerosene yielding larger MMDs in both the APS (6.45 vs. 4.88 µm) and MiniWRAS (4.09 vs. 3.15 µm). The mineral oil transition zone extended to higher pressures, up to 5.2 bar, whereas kerosene showed closer agreement between the DC-IV and aerosol spectrometers at lower pressures and lower liquid feed rates. This pattern is consistent with differences in fluid properties, including kerosene’s lower viscosity, lower surface tension, and higher volatility, which likely promoted finer atomization and fewer large source droplets.

3.2.2. MMD Calculation—Methods 2, 3 and 4

The calculated MMD values for Methods 2–4 across the three instruments are presented separately for mineral oil and kerosene in Tables S3 and S4, respectively. Percent differences between each calculated method and the reported MMD values are summarized in Table S5. Because MMD is a percentile-based metric, values calculated from aggregated or condition-level distributions may differ from the mean of instrument-reported MMD values, particularly for broad or coarse-droplet distributions.
Method 2 (Distribution-Free) did not reproduce reported MMD values for the DC-IV or APS but remained close to the MiniWRAS-reported values for both solvents. Method 3 (Hatch–Choate) failed for all three instruments and was particularly unstable for the DC-IV mineral oil distributions, where departures from lognormality produced nonphysical or divergent estimates. Method 4 (Volume-Based) reproduced the APS- and MiniWRAS-reported MMD values within approximately ±1%, but it did not reproduce the DC-IV-reported MMD values in the condition-level method-comparison analysis. This difference indicates that DC-IV-derived MMD is sensitive to whether MMD is calculated from individual measurement files or from aggregated condition-level volume distributions. Therefore, the DC-IV-reported MMD, or the DC-IV-specific internal calculation validation shown in Table 2, should be used for nozzle-calibration interpretation, whereas the Volume-Based method is most appropriate for reproducing APS- and MiniWRAS-reported MMD values (Table 4).

3.3. CMD Comparison

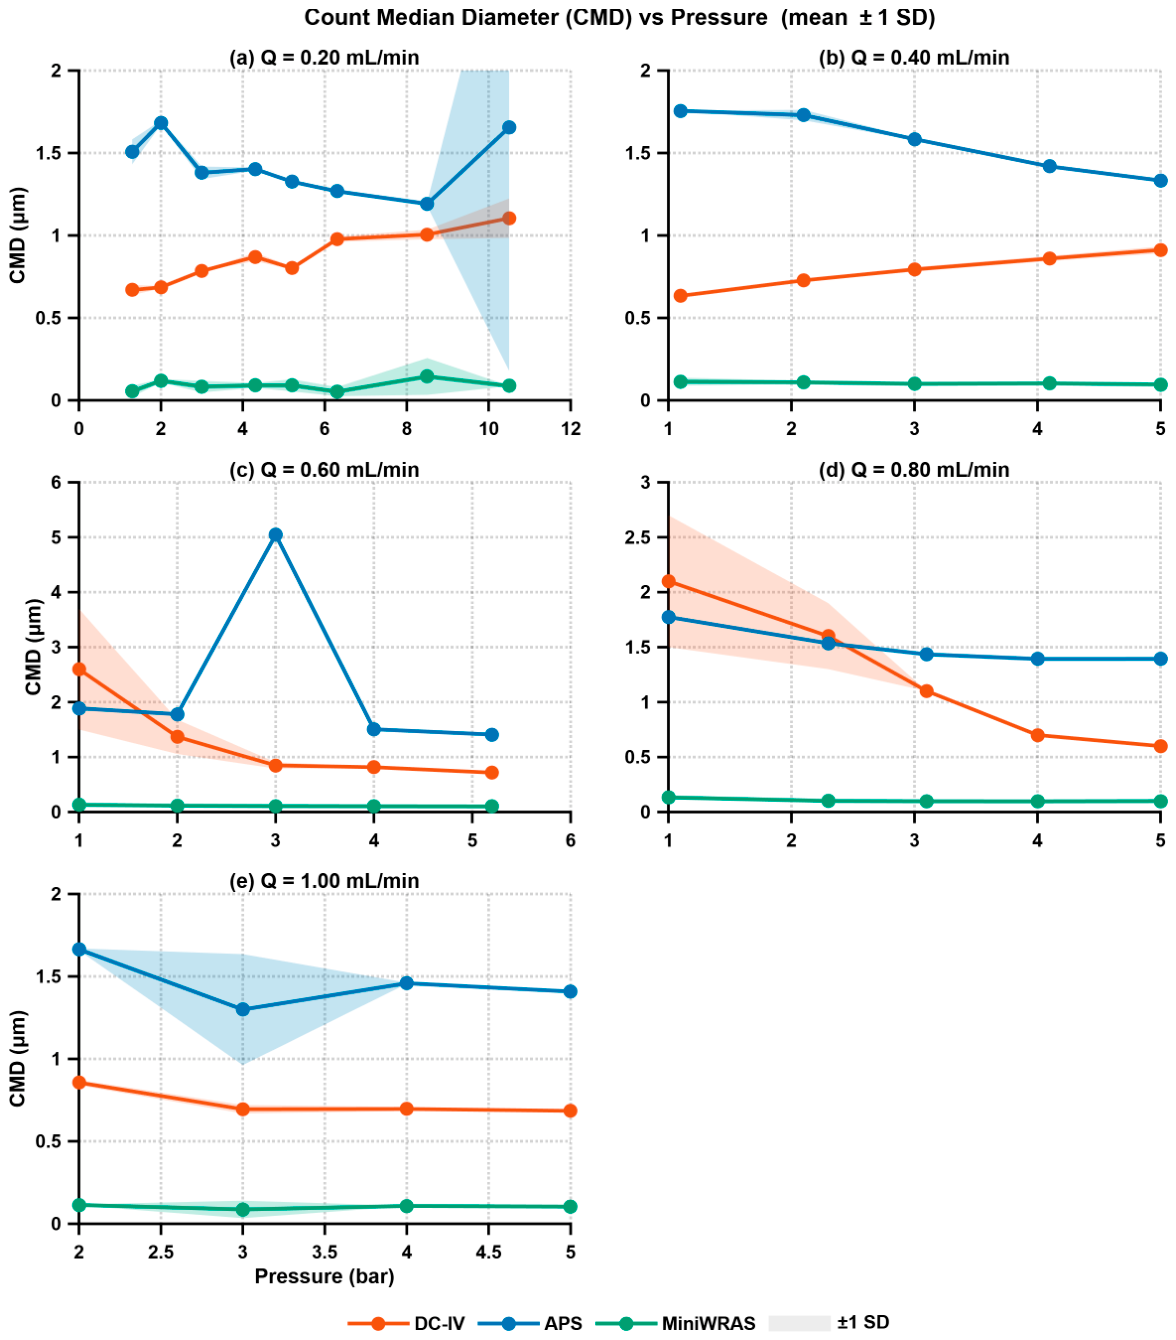
Mineral Oil: The measured CMDs for the DC-IV, APS, and MiniWRAS during mineral oil exposure at different pressures and flow rates are shown in Figure 4. The three instruments reported distinct CMD ranges: the MiniWRAS reported a mean of 0.10 µm (range: 0.06 to 0.15 µm), the DC-IV reported a mean of 0.97 µm (range: 0.63 to 2.33 µm), and the APS reported a mean of 1.65 µm (range: 1.19 to 5.16 µm). All pairwise differences were statistically significant (p < 0.001; Table 3). The CMD ordering (MiniWRAS < DC-IV < APS) differed from the MMD ordering (MiniWRAS < APS < DC-IV), underscoring the distinction between number-weighted and mass-weighted size metrics. For mineral oil CMD, the DC-IV model showed significant associations with pressure (β = 0.143, p = 0.015), flow rate (β = 2.091, p = 0.001), and the pressure × flow rate interaction (β = −0.543, p < 0.001; R2 = 0.467). In contrast, the APS and MiniWRAS CMD models did not show significant pressure, flow rate, or interaction effects (Table S1). Inter-instrument CMD agreement was poor overall: the DC-IV and MiniWRAS showed a moderate positive correlation (r = 0.41, p = 0.034), whereas the DC-IV and APS (r = 0.07, p = 0.754) and APS and MiniWRAS (r = 0.13, p = 0.528) were not significantly correlated (Table S2).
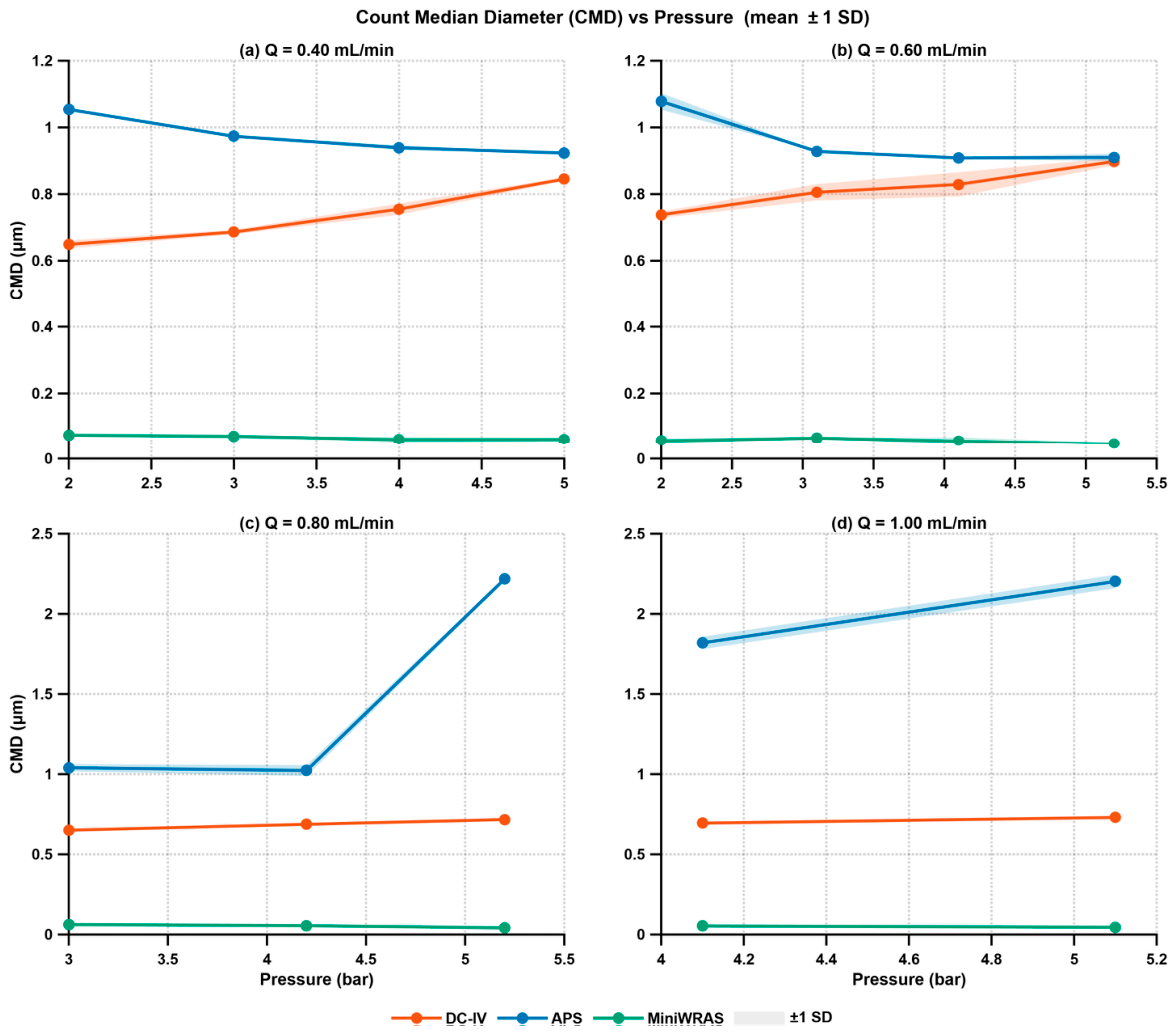
Kerosene Oil: The measured CMDs for the DC-IV, APS, and MiniWRAS during kerosene exposure are shown in Figure 5. The instrument ordering was consistent with mineral oil (MiniWRAS < DC-IV < APS), although kerosene CMD values were generally smaller: MiniWRAS had a mean diameter of 0.06 µm (range: 0.04 to 0.07 µm), DC-IV had a mean diameter of 0.75 µm (range: 0.65 to 0.90 µm), and APS had a mean diameter of 1.23 µm (range: 0.91 to 2.22 µm). All pairwise differences were statistically significant (p < 0.001; Table 3). For kerosene CMD, the strongest operating-condition effects were observed for the APS model (R2 = 0.786). APS CMD was significantly associated with pressure (β = −0.614, p = 0.032) and the pressure × flow-rate interaction (β = 1.198, p = 0.014), while flow rate approached significance (β = −3.506, p = 0.068). For DC-IV CMD, pressure (β = 0.110, p = 0.088), flow rate (β = 0.287, p = 0.494), and the interaction (β = −0.111, p = 0.269) were not significant (R2 = 0.520). For MiniWRAS CMD, none of the predictors were significant (pressure β = −0.004, p = 0.434; flow rate β = −0.016, p = 0.672; interaction β = −0.001, p = 0.860; R2 = 0.765; Table S1). The DC-IV CMD was notably more stable during kerosene exposure (CV = 10.6%) than during mineral oil exposure (CV = 44.1%). Inter-instrument CMD agreement was poor. No significant positive correlations were observed between the DC-IV and either aerosol instrument, while the APS and MiniWRAS showed a significant negative correlation (r = −0.66, p = 0.014; Table S2), indicating that the two aerosol instruments captured different portions of the kerosene number-size distribution.

3.4. Size Distribution Analysis

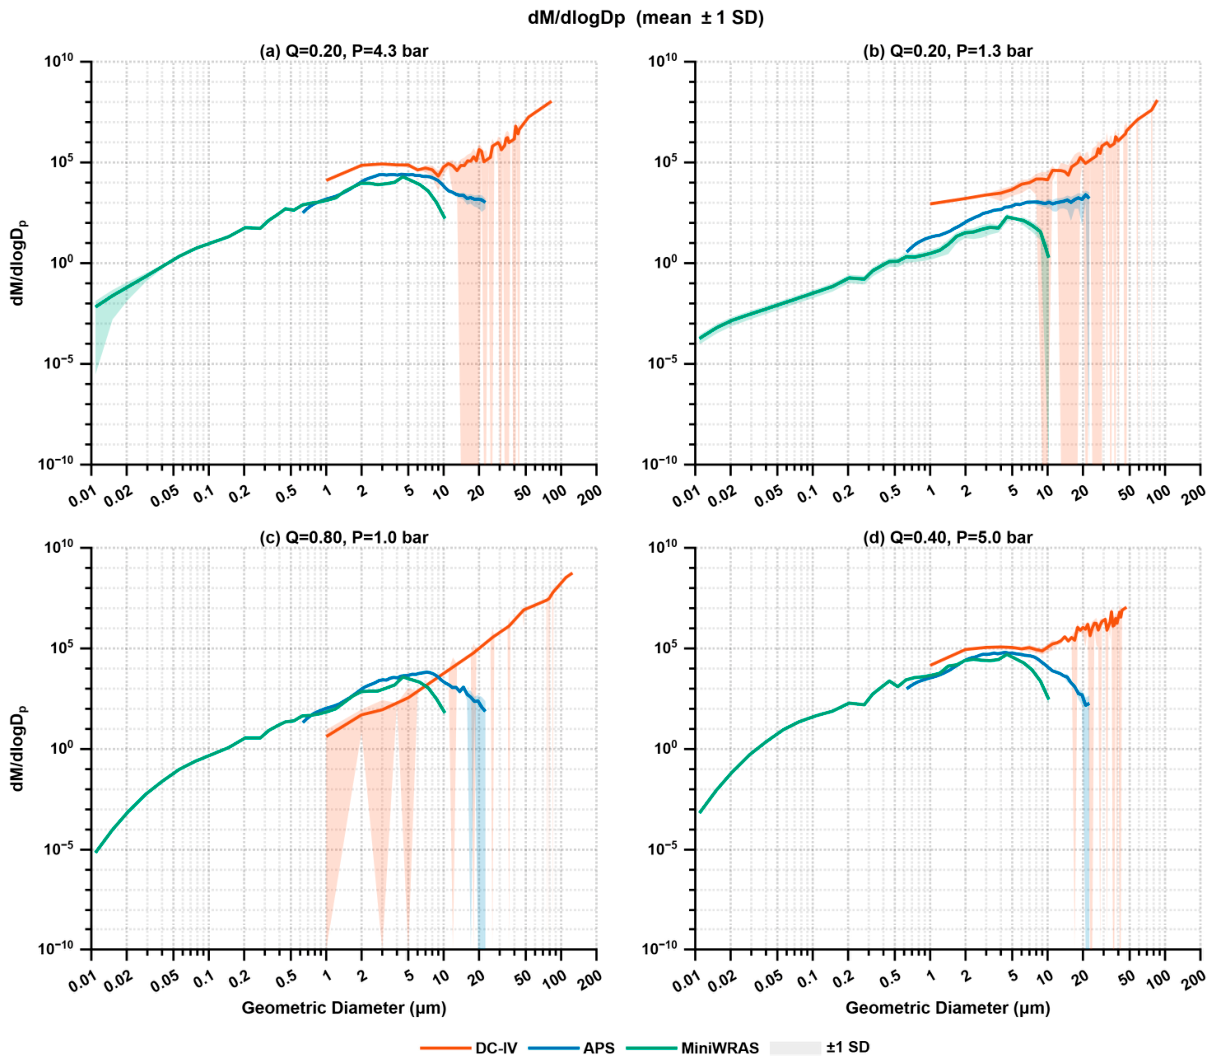
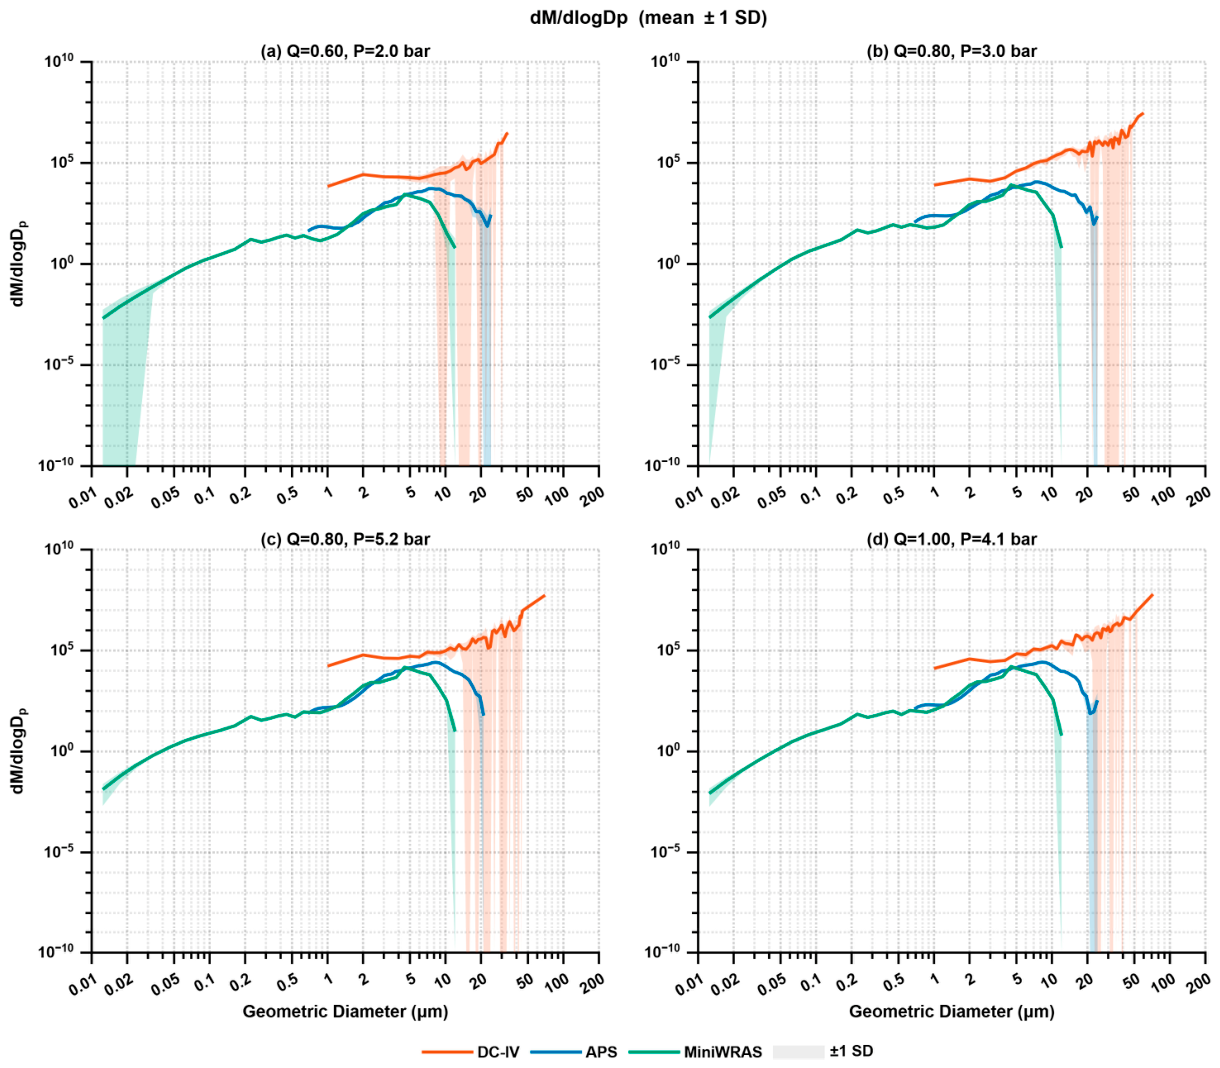
Mineral oil. To visualize how the underlying size distributions differed across instruments, four conditions were selected from the mineral oil data to represent distinct regimes of inter-instrument convergence, guided by the DC-IV/APS MMD ratio, which ranged from approximately 0.42 to 17.69 across all conditions. The dM/dlogDp distributions (Figure 6) showed that under the best-convergence condition (DC-IV/APS = 0.73; Figure 6a), all three instruments produced overlapping distributions peaking between 2 and 10 µm. As disagreement increased, the DC-IV distribution progressively shifted toward larger diameters. Under the high-disagreement condition (DC-IV/APS = 13.58; Figure 6c), the DC-IV distribution rose steeply above 10 µm, with much of its mass concentrated beyond 50 µm, whereas the APS and MiniWRAS remained centered near 5 µm. In the transition condition (DC-IV/APS = 1.37; Figure 6d), the DC-IV showed an intermediate pattern, with a mode near 5 µm overlapping the aerosol instruments but a long tail extending beyond 50 µm. Across all selected conditions, the APS and MiniWRAS showed similar distributions and overlapping size ranges.
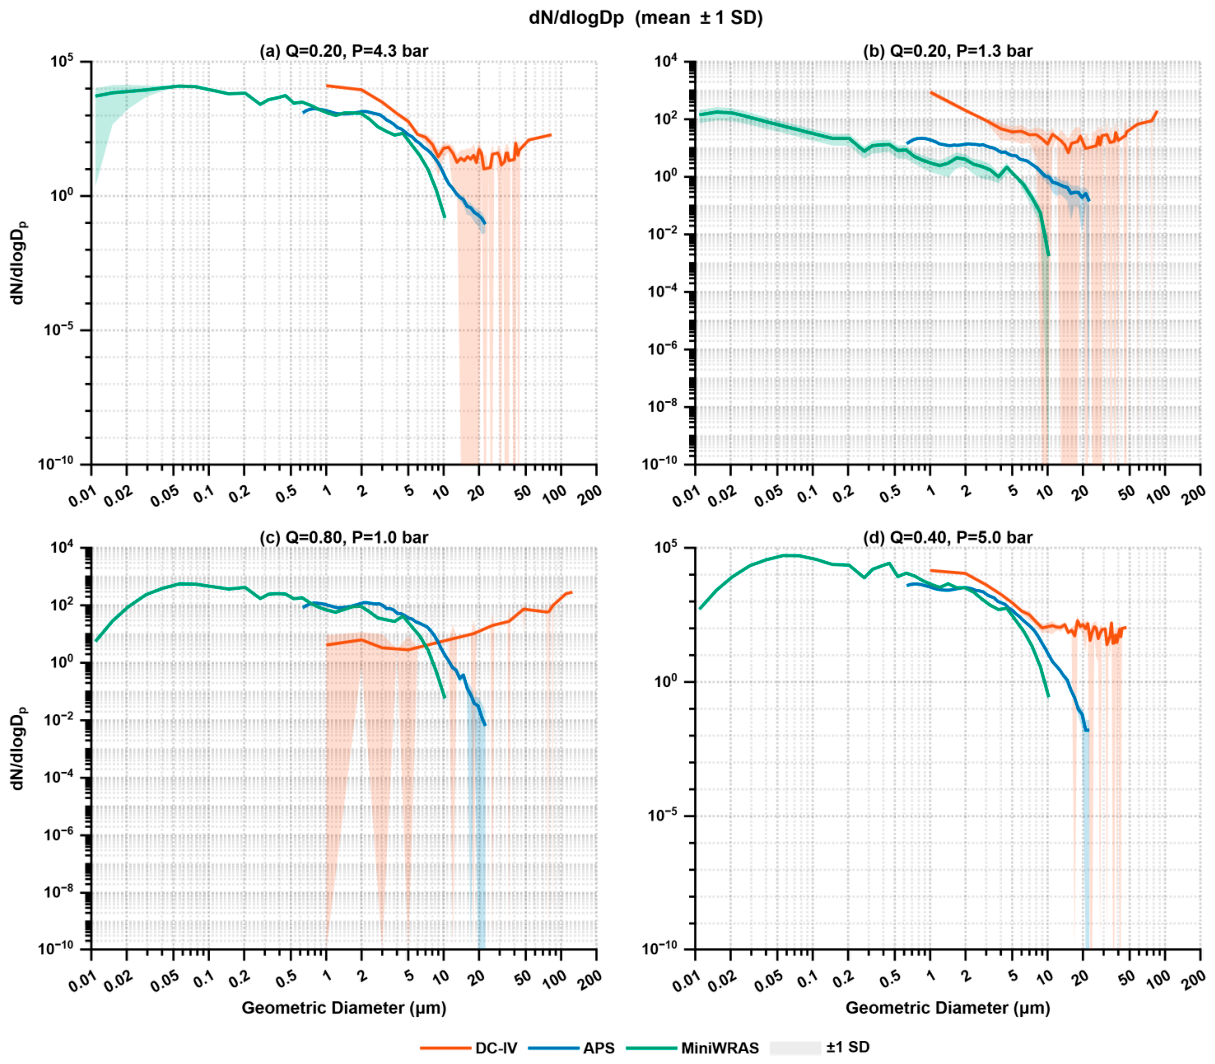
The dN/dlogDp distributions (Figure 7) revealed a fundamentally different pattern from the mass-weighted distributions. Under the best-convergence condition (Figure 7a), all three instruments showed overlapping number distributions peaking between 1 and 5 µm, with the MiniWRAS extending below 0.1 µm because of its broader detection range. As disagreement increased, the DC-IV number concentrations fell 2 to 4 orders of magnitude below the APS and MiniWRAS across the 1 to 20 µm range, consistent with a source distribution in which relatively few large droplets contributed disproportionately to the mass distribution. In contrast, the APS and MiniWRAS number distributions remained comparatively consistent across the selected conditions, suggesting that the downstream fine-aerosol fraction was less sensitive to the operating-condition changes that strongly affected the DC-IV source measurements.
Kerosene Oil: The DC-IV/APS MMD ratio for kerosene ranged from approximately 0.29 to 3.08, considerably narrower than for mineral oil, which ranged from approximately 0.42 to 17.69, reflecting closer overall inter-instrument convergence. Four conditions were selected to represent the observed spectrum of agreement and disagreement. The dM/dlogDp distributions (Figure 8) showed more uniform behavior across conditions than mineral oil. In Figure 8a, the APS and MiniWRAS produced overlapping distributions peaking between 2 and 10 µm, while the DC-IV retained partial overlap with the aerosol instruments despite a lower DC-IV/APS MMD ratio. As disagreement increased, the DC-IV distribution developed a rising tail extending beyond 20 µm. However, unlike mineral oil, where the DC-IV distribution shifted strongly toward the coarse-droplet range, the kerosene DC-IV distribution retained substantial overlap with the aerosol instruments below 10 µm even under the maximum-disagreement condition (DC-IV/APS = 3.08; Figure 8d). The APS and MiniWRAS maintained consistent distribution shapes across the selected conditions.
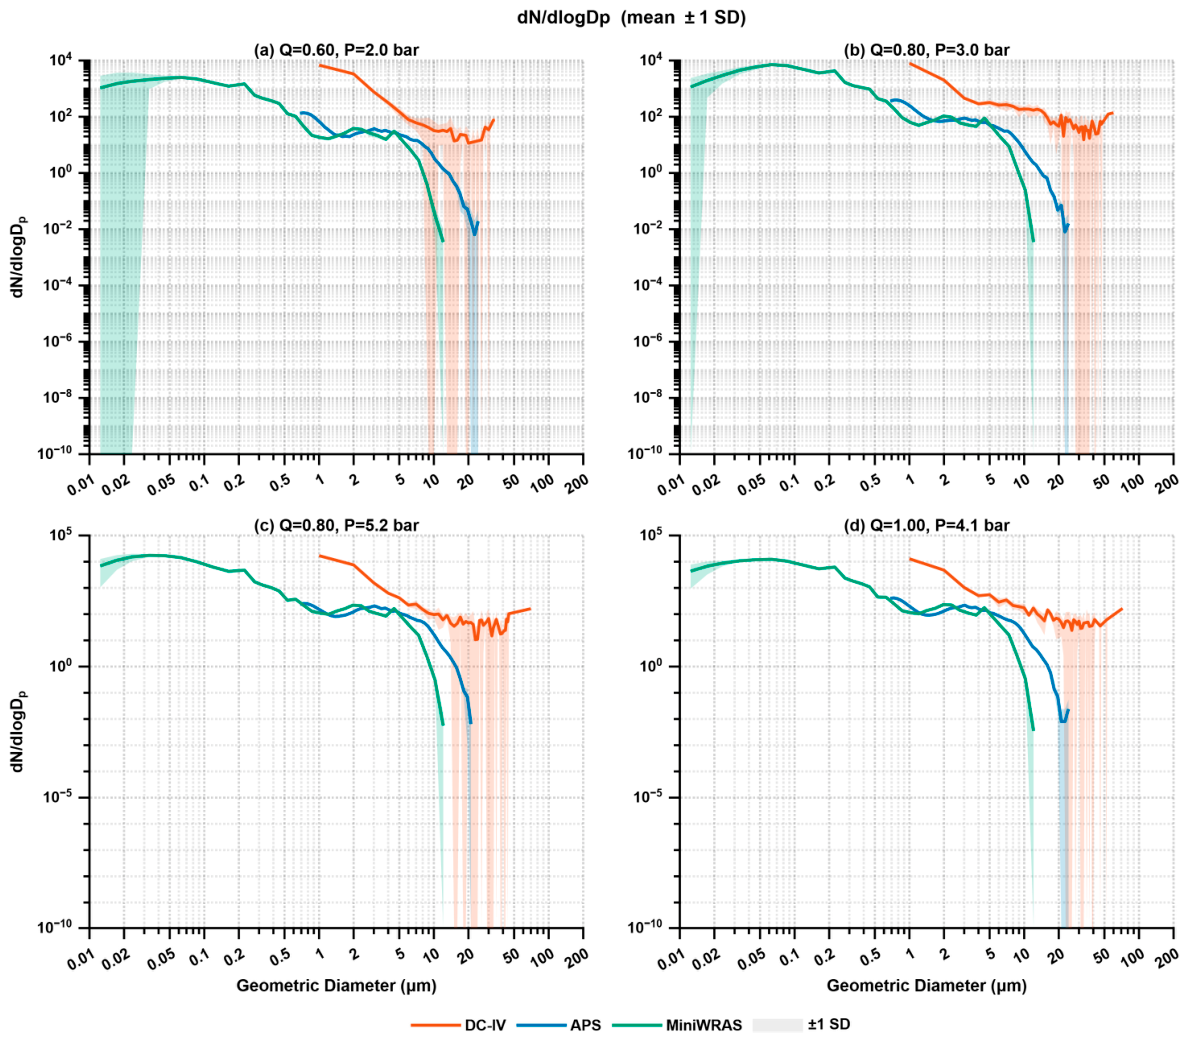
The dN/dlogDp distributions (Figure 9) showed that the kerosene number distributions were more consistent across instruments than the mineral oil distributions shown in Figure 7. The DC-IV number concentrations remained within approximately 1 to 2 orders of magnitude of the APS across the overlapping size range, in contrast to mineral oil, where DC-IV counts dropped 2 to 4 orders of magnitude below the aerosol instruments under high-disagreement conditions. Even under the maximum-disagreement condition (Figure 9d), the DC-IV retained similar distribution shapes and magnitudes to the aerosol instruments across much of the overlapping size range, with differences mainly appearing as flattening of the DC-IV curve above 10 µm. The MiniWRAS number distribution was dominated by submicrometer particles across the selected kerosene conditions, consistent with the lower CMD values reported for the MiniWRAS.

4. Discussion

4.1. DC-IV Comparative Particle Size Characterization

This validation confirmed that the DC-IV-reported MMD and CMD values could be accurately reconstructed from the instrument’s raw binned output across the 30 measurement files evaluated. The two metrics required different interpolation approaches because they are derived from different cumulative distributions. MMD was reproduced using linear interpolation between bin midpoints on the cumulative volume distribution at the 50th percentile, using the instrument-reported Volume column. CMD was reproduced using within-bin uniform interpolation on the cumulative count distribution at the 50th percentile. These results indicate that the DC-IV internally calculates MMD and CMD using distinct volume-based and count-based percentile methods.

4.2. MMD Measured Comparison

4.2.1. Physical Basis for Inter-Instrument MMD Differences

The systematic differences in MMD among the three instruments during mineral oil testing (all pairwise p < 0.001; Table 3) are consistent with established aerosol-evolution mechanisms and with fundamental differences in the particle populations measured by each device, particularly differences in instrument size range and sampling location rather than measurement approach alone. After atomization, the airborne spray size distribution can change as droplets move away from the nozzle through size-dependent gravitational settling, surface deposition, dilution, evaporation, inlet sampling effects, and, under sufficiently high concentrations, particle interactions such as coagulation. These processes can produce a downstream airborne aerosol spectrum that differs from the near-source droplet distribution. In this study, the DC-IV measured the source-region droplet population near the atomizer, including larger droplets generated close to the nozzle and within its broader oil-droplet size range. In contrast, the APS and MiniWRAS measured the downstream airborne fraction that remained suspended, reached the sampling zone, and entered each instrument inlet. Therefore, differences between DC-IV and APS/MiniWRAS MMD values should be interpreted as expected consequences of instrument size range, measurement location, sampled particle population, and aerosol evolution, rather than as consequences of measurement approach alone or as evidence that one instrument was inherently inaccurate. Despite these differences in absolute MMD, positive associations were observed between DC-IV and MiniWRAS MMD using Pearson correlation (r = 0.50, p = 0.008) and between APS and MiniWRAS MMD after conditioning on pressure and flow rate using partial correlation (partial r = 0.53, p = 0.007) for mineral oil (Table S2). These results show that the instruments captured some shared operating condition trends in mineral oil spray behavior while measuring different stages of the droplet/aerosol population. The condition-specific convergence observed under high-pressure, low-liquid-feed-rate conditions indicates when nozzle-level and downstream measurements were most consistent within this chamber system, while the divergence observed under other operating conditions supports the need for downstream aerosol characterization when the airborne fraction is the measurement target.
Residual APS-to-MiniWRAS MMD differences persisted after diameter conversion, particularly for kerosene, indicating that the applied conversions did not eliminate all instrument-level differences. These differences likely reflect the combined effects of sizing principle, effective sampling population, internal MMD calculation approach, inlet behavior, and particle losses that varied between different types of liquids that were being measured. Therefore, APS and MiniWRAS MMD values should be interpreted as instrument-reported summaries rather than interchangeable estimates of the same downstream aerosol population.

4.2.2. Interpretation of the Pressure Threshold

The convergence of DC-IV and aerosol-instrument MMD values under high-pressure, low-liquid-feed-rate conditions has a clear physical interpretation. Under lower-atomization-energy conditions, the spray can include a substantial fraction of larger droplets (>20 µm) that contribute disproportionately to the mass distribution. These large droplets are captured by the near-source DC-IV but may settle or be otherwise lost before reaching the APS or MiniWRAS inlets, resulting in elevated DC-IV-to-aerosol MMD ratios. As atomization pressure increases and liquid feed rate remains low, the droplet size distribution shifts toward smaller diameters, allowing the DC-IV, APS, and MiniWRAS MMD values to converge. This dependence on atomization pressure and liquid feed rate is consistent with atomization theory, in which characteristic droplet size generally decreases as Weber number increases, although the exact relationship depends on nozzle type, fluid properties, and operating conditions.
Regression models including interaction terms showed that for DC-IV MMD with mineral oil, pressure was marginally non-significant (β = −4.397, p = 0.054), flow rate was not significant (β = 33.15, p = 0.133), and the pressure × flow rate interaction was negligible (β = 0.100, p = 0.985; R2 = 0.610; Table S1). The MiniWRAS model achieved the highest fit and showed significant effects of pressure and the pressure × flow rate interaction (R2 = 0.858; pressure β = −0.138, p < 0.001; pressure × flow rate interaction β = −0.205, p = 0.015; Table S1), indicating that MiniWRAS MMD varied systematically with operating conditions. In contrast, the APS model explained little variance in MMD, and neither pressure, flow rate, nor their interaction was significant (R2 = 0.112; Table S1). This weaker APS response may reflect the relatively stable airborne size fraction captured within its 0.5 to 20 µm aerodynamic diameter range, whereas the MiniWRAS measures a broader size range and uses different optical and mobility-based detection and internal distribution-processing methods. Coincidence effects at elevated particle concentrations could also have influenced the APS response, although this should be interpreted cautiously unless supported by instrument diagnostic data.
For kerosene, DC-IV and aerosol-instrument MMD values showed closer agreement at lower-pressure, low-liquid-feed-rate conditions than was observed for mineral oil, consistent with fluid properties that may facilitate finer atomization. A notable finding was the reversed hierarchy under some low-flow conditions, where the DC-IV MMD was lower than the APS MMD, likely reflecting finer droplet generation at the nozzle and possible droplet evaporation or transport-related size reduction before the aerosol reached the APS and MiniWRAS inlets. Regression models with interaction terms showed that neither pressure, flow rate, nor their interaction significantly predicted DC-IV MMD for kerosene (all p > 0.05; Table S1).

4.2.3. MMD Calculation Methods

The comparison of MMD calculation methods showed that both the computational approach and the level of data aggregation affected the resulting size metrics. No single calculation approach reproduced the reported MMD values across all three instruments and both solvents. Method 2, the Distribution-Free method, recalculated volume from particle count and bin diameter using V = n × d3. This approach reproduced the reported MMD values only for the MiniWRAS but did not meet the ±1% agreement threshold for the APS or DC-IV. This indicates that recalculating volume from bin labels can introduce error when the bin diameter does not fully represent the instrument’s native volume- or mass-weighted output or internal calculation procedure. Method 3, the Hatch–Choate conversion, also failed for all three instruments because ULV sprays often produced broad or non-lognormal distributions that violate the assumptions required for this conversion.
Method 4 (Volume-Based) reproduced the APS- and MiniWRAS-reported MMD values within the ±1% agreement threshold, but it did not reproduce the DC-IV-reported MMD values in the condition-level method-comparison analysis. This finding does not contradict the separate DC-IV internal calculation validation in Table 2. Table 2 validation demonstrated that the DC-IV-reported MMD and CMD could be reconstructed from individual DC-IV measurement files using the instrument-reported volume and count distributions. In contrast, the method-comparison analysis summarized MMD performance at the condition level, where percentile-based metrics can differ depending on whether MMD is averaged from individual measurements or recalculated from aggregated condition-level volume distributions. This distinction is especially important for the DC-IV because coarse droplets can dominate the cumulative volume distribution and disproportionately shift the 50th percentile diameter when distributions are aggregated.
Alternative approaches to estimating MMD from DC-IV data have been used in the literature. Dennett et al. [18] estimated MMD from DC-IV count data using the conversion equation described by Hinds et al. [34], which corresponds to the Hatch–Choate method evaluated here as Method 3, and reported estimated MMDs of 17 to 19 µm for three adulticides. While this approach may yield reasonable estimates when the spray distribution approximates a lognormal distribution, our results demonstrate that the Hatch–Choate conversion can produce substantial errors when applied to polydisperse or bimodal distributions, as commonly encountered during atomizer calibration across a range of operating conditions. These findings support using the DC-IV-reported MMD for nozzle calibration decisions and using instrument-specific volume- or mass-weighted approaches when reproducing APS and MiniWRAS MMD values.

4.3. CMD Comparison

The CMD ordering (MiniWRAS < DC-IV < APS) differed from the mineral oil MMD ordering (MiniWRAS < APS < DC-IV), but matched the kerosene MMD ordering, underscoring that number-weighted and mass-weighted metrics describe different aspects of a particle population [34]. Although all pairwise CMD differences were statistically significant (Table 3), CMD agreement across instruments should be interpreted with caution because CMD is strongly affected by instrument size bounds, counting method, and sampling location. This interpretation is consistent with prior work showing that sampler design can affect collection efficiency and the measured droplet spectrum [23], and with controlled chamber work demonstrating the MiniWRAS’s ability to resolve submicron particle populations [49]. The significant negative APS-MiniWRAS CMD correlation for kerosene (r = −0.66, p = 0.014; Table S2) should therefore be interpreted as evidence of different sampled size ranges and particle populations rather than disagreement among equivalent measurements.

4.4. Size Distribution Analysis

MMD and CMD values should be interpreted as instrument-reported summary metrics rather than direct measures of the same underlying aerosol population, since the DC-IV, APS, and MiniWRAS measure different size ranges, report different equivalent diameter types, and sample different regions of the spray system. Size-resolved distributions therefore provide the most informative basis for evaluating how each instrument represents the spray. Under best-convergence conditions, the dM/dlogDp distributions overlapped and peaked between 2 and 10 µm (Figure 6), consistent with more comparable instrument characterization when the spray was more fully atomized. As pressure decreased and flow rate increased, the DC-IV distribution shifted toward larger diameters, consistent with increased generation of large droplets that may settle or be lost before reaching the downstream aerosol instruments. The dN/dlogDp distributions (Figure 7) showed that under high-disagreement mineral oil conditions, DC-IV number concentrations were 2 to 4 orders of magnitude lower than APS and MiniWRAS values in the 1 to 20 µm range, whereas APS and MiniWRAS number distributions remained comparatively consistent. Kerosene distributions (Figure 8 and Figure 9) showed less inter-instrument divergence than mineral oil, with substantial overlap below 10 µm even at maximum disagreement (DC-IV/APS ratio = 3.08) and dN/dlogDp distributions remaining within 1 to 2 orders of magnitude across instruments. This tighter agreement is consistent with kerosene’s physical properties, which likely promoted finer atomization and reduced the contribution of large droplets. For broad or multimodal distributions, median diameter metrics are sensitive to the measured size range. Therefore, differences in MMD or CMD across instruments are expected when one instrument includes larger near-source droplets and the other measures only the downstream airborne fraction. When direct distribution-shape comparisons are desired, normalized size distributions or comparisons restricted to the overlapping instrument size range are more appropriate than direct comparison of absolute total counts or full-range median diameters.

4.5. Practical Implications for Mosquito Control

These measurement approaches address different stages of ULV spray evaluation rather than a single interchangeable endpoint. The DC-IV is best suited for nozzle-level calibration and characterization of the initial droplet spectrum [15,16], whereas the APS and MiniWRAS provide real-time measurements of the downstream airborne fraction that remains suspended and reaches the sampling zone. The source-region DC-IV measurement should not be assumed to represent the droplet spectrum reaching mosquitoes under field conditions, and downstream aerosol measurements alone do not determine deposition or mosquito mortality. Deposition should be evaluated using slide-based samplers and/or droplet counts on mosquitoes, and biological efficacy should be assessed using caged-mosquito bioassays under laboratory (e.g., wind tunnel), field, or semi-field conditions. Because the present study used carrier oils without active insecticide ingredients and did not include deposition or bioassay measurements, the findings should be interpreted as measurement-characterization data, not as evidence of treatment effectiveness or mosquito kill. Britch et al. [21] demonstrated that finer spray technologies achieved substantially higher sentinel mosquito mortality than coarser ULV sprays at comparable deposition rates, attributing this to a dramatically higher droplet density. This aligns with our finding that the APS and MiniWRAS characterize the fine aerosol fraction that may be relevant to mosquito contact, pending validation against bioassay outcomes in future work. These aerosol instruments can supplement established slide-based methods used in field studies [15,23] by providing continuous or near-continuous real-time characterization of the airborne fraction rather than only time-integrated deposition measurements.
Programs comparing measurements across instrument platforms should use instrument-appropriate MMD approaches: the DC-IV-reported MMD for nozzle calibration and Method 4 (Volume-Based) for reproducing APS and MiniWRAS MMD values. Spray systems should be assessed using the actual carrier fluid intended for field application, because mineral oil and kerosene produced distinct atomization profiles under the tested conditions. Carrier oils, such as mineral oil, are widely used as diluents in commercial insecticides [13,43]. Their viscosity and surface tension directly influence atomization quality, underscoring that instrument-comparison results obtained with one fluid cannot be directly extrapolated to another.

4.6. Limitations and Future Directions

Several limitations should be acknowledged. The experiments were conducted in a controlled 0.5 m3 chamber that does not replicate the atmospheric transport, dilution, and meteorological influences present in field applications, where Britch et al. [21] showed that environmental conditions substantially affect spray performance across different environments. The mixing fans and honeycomb straightener between the two chamber zones could, in theory, alter particle size distributions or concentrations before they reach the aerosol instruments, although the chamber design and short transport distance were intended to minimize these effects. The carrier oils were used without active insecticide ingredients, and the DC-IV’s 30 s manual interval limited temporal resolution. In addition, diameter corrections were based on assumed spherical droplets and literature-based density values. No refractive-index-specific Mie correction was carried out for the MiniWRAS optical channel. Therefore, aerosol size-distribution interpretation may be affected by uncertainty in instrument response, particle density, shape, and refractive-index assumptions.
This study did not include an independent reference method such as laser diffraction or phase Doppler particle analysis. Therefore, the results should not be interpreted as determining which instrument is most accurate in an absolute sense. Instead, the results describe how instrument-reported size metrics and size distributions differ under controlled ULV spray generation conditions.
This study did not calculate droplet lifetime or evaporation kinetics as a function of droplet size, temperature, and relative humidity. Although chamber temperature and relative humidity were controlled to improve measurement reproducibility, droplet-lifetime calculations would require additional formulation-specific physicochemical properties, including active ingredients, surfactants, volatility, vapor pressure, surface tension, air movement, residence time, dilution, and field-scale environmental conditions. Future studies should combine size-distribution measurements with droplet-lifetime modeling, deposition sampling, and caged-mosquito bioassays to determine how airborne persistence relates to mosquito contact and mortality.
The experiments used mineral oil and kerosene without active insecticide ingredients, surfactants, emulsifiers, or other formulation additives. Therefore, the results should be interpreted as controlled carrier-fluid measurements rather than as direct measurements of complete mosquito-control formulations. Active ingredients and formulation additives can alter viscosity, surface tension, density, volatility, refractive index, and evaporation behavior, all of which may influence atomization, airborne persistence, droplet-size distributions, and instrument response. For example, viscosity and surface tension can affect the initial droplet spectrum generated at the nozzle, volatility and vapor pressure can affect evaporation and downstream size distributions, density can influence aerodynamic sizing, and refractive index can affect optical sizing. Future studies should repeat this instrument characterization work using a variety of complete formulated insecticide products to determine whether the convergence thresholds, inter-instrument relationships, and MMD calculation methods identified in this carrier-fluid study apply to commercial formulations.
Mineral oil and kerosene were evaluated over different numbers of conditions and pressure ranges, limiting balanced solvent comparisons. The kerosene pressure range was narrower than the mineral oil range. Therefore, direct comparison of solvent effects cannot distinguish between actual fluid-property differences and differences attributable to different operating ranges. A fully balanced solvent-effect experiment would require identical testing of both fluids across the same pressure and flow-rate conditions. Future studies should conduct fully balanced solvent comparisons by testing mineral oil, kerosene, and other carrier fluids across identical operating-condition ranges to isolate true fluid-property effects on atomization and instrument response.
Steady-state windows were selected using a standardized MiniWRAS total-concentration criterion, but the window-selection process involved manual identification of start and end times. Although the same criterion was applied across all operating conditions, alternative steady-state definitions were not evaluated. Future studies should compare multiple objective window-selection criteria, such as ±5%, ±10%, and fixed-duration post-stabilization intervals, to assess the sensitivity of reported size-distribution metrics to the steady-state definition.
Future work should deploy the APS and MiniWRAS alongside slide-based droplet samplers and caged mosquito bioassays under lab (e.g., wind tunnel) and/or field conditions with complete insecticide formulations, building on the study designs of Rinkevich et al. [25], to determine whether real-time airborne measurements improve prediction of mosquito mortality when used alone or in combination with deposition-based metrics. Development of standardized protocols for aerosol instruments in wind-tunnel systems and validation of the APS/MiniWRAS MMD ratio across a broader range of atomizer types, formulations, and environmental conditions would further support field-portable monitoring for ULV quality assurance. In addition, future studies should extend this work to field and semi-field settings using complete formulated products, deposition sampling, and caged-mosquito bioassays to link nozzle-level droplet measurements, downstream airborne aerosol size distributions, deposition, and mosquito mortality.

5. Conclusions

This study compared the DC-IV, APS, and MiniWRAS for characterizing ULV mosquito-control sprays using mineral oil and kerosene in a controlled chamber. Inter-instrument MMD agreement was strongly condition-dependent, converging under high atomization pressures but diverging under lower-pressure conditions, where the DC-IV detected larger source droplets that were not represented in the downstream airborne fraction measured by the aerosol instruments. This distinction has direct implications for mosquito-control interpretation. DC-IV measurements remain appropriate for ULV nozzle calibration, but the MMD measured at the source should not be assumed to represent the droplet spectrum reaching mosquitoes at field distances. The biologically relevant exposure is the airborne and deposited droplet fraction at the mosquito or slide location, which should be characterized using downstream aerosol measurements, field slide deposition, and caged-mosquito bioassays. These differences narrowed considerably for kerosene, reflecting its finer atomization at lower energy thresholds. Regression models showed that operating conditions influenced MMD differently across instruments and solvents, reinforcing that source calibration and downstream exposure characterization serve complementary roles. The results should therefore be interpreted as a complementary measurement assessment rather than an absolute instrument-accuracy comparison.
Among the MMD calculation methods evaluated, the Hatch–Choate conversion was unreliable for non-lognormal ULV spray distributions, while the Volume-Based method reproduced reported MMD values for the APS and MiniWRAS within ±1% but not for the DC-IV. For DC-IV-based nozzle calibration, the instrument-reported MMD should be used because conversion methods assuming lognormality may introduce substantial errors with polydisperse ULV distributions. The fluid-dependent differences between mineral oil and kerosene further demonstrated that calibration results cannot be generalized across carrier fluids. These findings support continued DC-IV use for nozzle calibration while establishing the APS and MiniWRAS as complementary real-time monitoring tools for the downstream airborne aerosol fraction. Future work should validate these inter-instrument relationships under laboratory (e.g., wind tunnel) and field conditions using complete insecticide formulations, including oil- and water-based products, and integrate aerosol spectrometer measurements with deposition sampling and caged-mosquito bioassays.

Supplementary Materials

The following supporting information can be downloaded at: https://www.mdpi.com/article/10.3390/environments13070387/s1, Table S1: Linear regression models predicting droplet and aerosol CMD and MMD across solvent types using atomization pressure and liquid feed rate; Table S2: Pearson and partial correlations between instrument measurements; Table S3: Comparison of calculated MMD values for mineral oil using Methods 2 through 4; Table S4: Comparison of calculated MMD values for kerosene using Methods 2 through 4; Table S5: Summary of percent differences between calculated and reported MMD values across instruments and solvents.

Author Contributions

S.S.: Conceptualization, Methodology, Validation, Formal analysis, Resources, Funding acquisition, Visualization, Project administration, Supervision, Writing—original draft, Writing—review and editing. S.L.R.: Funding acquisition, Writing—review and editing. Q.W.: Formal Analysis, Writing—review and editing. K.B.: Data Curation, Writing—review and editing. A.O.: Data Curation, Writing—review and editing. J.B.: Validation, Writing—review and editing. All authors have read and agreed to the published version of the manuscript.

Funding

This project was funded by the North Carolina Department of Health and Human Services (Sponsor Award Number: 49386) and NC Innovation (Sponsor Award Number: CR25-05-080).

Data Availability Statement

Data are available upon reasonable request.

Conflicts of Interest

The authors declare no conflicts of interest.

References

  1. Athni, T.S.; Shocket, M.S.; Couper, L.I.; Nova, N.; Caldwell, I.R.; Caldwell, J.M.; Childress, J.N.; Childs, M.L.; De Leo, G.A.; Kirk, D.G.; et al. The influence of vector-borne disease on human history: Socio-ecological mechanisms. Ecol. Lett. 2021, 24, 829–846. [Google Scholar] [CrossRef] [PubMed]
  2. World Health Organization. Vector-Borne Diseases. Available online: https://www.who.int/news-room/fact-sheets/detail/vector-borne-diseases (accessed on 25 March 2026).
  3. Centers for Disease Control and Prevention. About Vector-Borne Diseases. Available online: https://www.cdc.gov/vector-borne-diseases/about/index.html (accessed on 25 March 2026).
  4. Centers for Disease Control and Prevention. Vector-Borne Diseases. Available online: https://www.cdc.gov/climate-health/php/effects/vectors.html (accessed on 25 March 2026).
  5. de Souza, W.M.; Weaver, S.C. Effects of climate change and human activities on vector-borne diseases. Nat. Rev. Microbiol. 2024, 22, 476–491. [Google Scholar] [CrossRef] [PubMed]
  6. Abbasi, E. Climate Change and Vector-Borne Disease Transmission: The Role of Insect Behavioral and Physiological Adaptations. Integr. Org. Biol. 2025, 7, obaf011. [Google Scholar] [CrossRef] [PubMed]
  7. Fouet, C.; Kamdem, C. Integrated Mosquito Management: Is Precision Control a Luxury or Necessity? Trends Parasitol. 2019, 35, 85–95. [Google Scholar] [CrossRef] [PubMed]
  8. Centers for Disease Control and Prevention. Integrated Mosquito Management. Available online: https://www.cdc.gov/mosquitoes/php/toolkit/integrated-mosquito-management-1.html (accessed on 25 March 2026).
  9. Tiffin, H.S.; Gordon, J.R.; Poh, K.C.C. One Health, many approaches: Integrated vector management strategies support One Health goals. Front. Insect Sci. 2025, 5, 1549348. [Google Scholar] [CrossRef] [PubMed]
  10. Stiles, P.C.; Balatsos, G.; Liyanage, P.; Baron, J.N.; Sakellariou Sofianou, M.; Bisia, M.; Karras, V.; Bärnighausen, T.; Patsoula, E.; Rocklöv, J.; et al. Three-year assessment of integrated vector management in Attica, Greece: Results from surveillance and control activities. Commun. Biol. 2025, 8, 1533. [Google Scholar] [CrossRef] [PubMed]
  11. Kawiecki, A.B.; Morrison, A.C.; Barker, C.M. Spatial and temporal analysis on the impact of ultra-low volume indoor insecticide spraying on Aedes aegypti household density. Parasites Vectors 2024, 17, 254. [Google Scholar] [CrossRef] [PubMed]
  12. U.S. Environmental Protection Agency. Success in Mosquito Control: An Integrated Approach. Available online: https://www.epa.gov/mosquitocontrol/success-mosquito-control-integrated-approach (accessed on 25 March 2026).
  13. North Carolina Department of Health and Human Services. Precautions for Minimizing Pesticide Exposure During Mosquito-Control Spraying. Available online: https://epi.dph.ncdhhs.gov/cd/diseases/mosquito_spray.html (accessed on 25 March 2026).
  14. Clark, G.G.; Golden, F.V.; Allan, S.A.; Cooperband, M.F.; McNelly, J.R. Behavioral responses of two dengue virus vectors, Aedes aegypti and Aedes albopictus (Diptera: Culicidae), to DUET and its components. J. Med. Entomol. 2013, 50, 1059–1070. [Google Scholar] [CrossRef] [PubMed]
  15. Faraji, A.; Unlu, I.; Crepeau, T.; Healy, S.; Crans, S.; Lizarraga, G.; Fonseca, D.; Gaugler, R. Droplet Characterization and Penetration of an Ultra-Low Volume Mosquito Adulticide Spray Targeting the Asian Tiger Mosquito, Aedes albopictus, within Urban and Suburban Environments of Northeastern USA. PLoS ONE 2016, 11, e0152069. [Google Scholar] [CrossRef] [PubMed]
  16. Hoffmann, W.C.; Walker, T.W.; Fritz, B.K.; Farooq, M.; Smith, V.L.; Robinson, C.A.; Lan, Y. Further Evaluation of Spray Characterization of Sprayers Typically Used in Vector Control. J. Am. Mosq. Control Assoc. 2012, 28, 93–101. [Google Scholar] [CrossRef] [PubMed]
  17. Dritz, D.A.; Novelo, M.; Wheeler, S.S. Evaluating the Metrics of Insecticide Resistance and Efficacy: Comparison of the CDC Bottle Bioassay with Formulated and Technical-Grade Insecticide and a Sentinel Cage Field Trial. Trop. Med. Infect. Dis. 2025, 10, 219. [Google Scholar] [CrossRef] [PubMed]
  18. Dennett, J.A.; Stark, P.M.; Fredregill, C.L.; Debboun, M. Efficacy of Deltagard®, Fyfanon®, and Evoluer™ 31–66 Against Culex quinquefasciatus in Harris County, Texas. J. Am. Mosq. Control Assoc. 2017, 33, 36–42, 37. [Google Scholar] [CrossRef] [PubMed]
  19. Richards, S.; Sousan, S.; Wu, Q.; Murray, W.; Rush, E.; Slade, R.; Jones, P.; White, A.; Braxton, N. Further Development and Testing of a Compact Wind Tunnel for Exposing Mosquitoes to Formulated Insecticide Products. Insects 2025, 16, 1180. [Google Scholar] [CrossRef] [PubMed]
  20. Richards, S.L.; Sousan, S.; Murray, W.; White, A.; Peyton, K.; Slade, R. Development of novel compact wind tunnel for testing efficacy of insecticide formulated products in mosquitoes. Pest Manag. Sci. 2024, 80, 3140–3148. [Google Scholar] [CrossRef] [PubMed]
  21. Britch, S.C.; Linthicum, K.J.; Wynn, W.W.; Walker, T.W.; Farooq, M.; Smith, V.L.; Robinson, C.A.; Lothrop, B.B.; Snelling, M.; Gutierrez, A.; et al. Evaluation of ULV and Thermal Fog Mosquito Control Applications in Temperate and Desert Environments. J. Am. Mosq. Control Assoc. 2010, 26, 183–197. [Google Scholar] [CrossRef] [PubMed]
  22. Dzul-Manzanilla, F.; Correa-Morales, F.; Medina-Barreiro, A.; Bibiano-Marín, W.; Vadillo-Sanchez, J.; Riestra-Morales, M.; Del Castillo-Centeno, L.F.; Morales-Rios, E.; Martin-Park, A.; Gonzalez-Olvera, G.; et al. Field Efficacy Trials of Aerial Ultra-Low-Volume Application of Insecticides Against Caged Aedes aegypti in Mexico. J. Am. Mosq. Control Assoc. 2019, 35, 140–146. [Google Scholar] [CrossRef] [PubMed]
  23. Bonds, J.A.; Greer, M.J.; Fritz, B.K.; Hoffmann, W.C. Aerosol sampling: Comparison of two rotating impactors for field droplet sizing and volumetric measurements. J. Am. Mosq. Control Assoc. 2009, 25, 474–479. [Google Scholar] [CrossRef] [PubMed]
  24. Clayson, P.J.; Latham, M.; Bonds, J.A.; Healy, S.P.; Crans, S.C.; Farajollahi, A. A droplet collection device and support system for ultra-low-volume adulticide trials. J. Am. Mosq. Control Assoc. 2010, 26, 229–232. [Google Scholar] [CrossRef] [PubMed]
  25. Rinkevich, F.D.; Margotta, J.W.; Pokhrel, V.; Walker, T.W.; Vaeth, R.H.; Hoffman, W.C.; Fritz, B.K.; Danka, R.G.; Rinderer, T.E.; Aldridge, R.L.; et al. Limited impacts of truck-based ultra-low-volume applications of mosquito adulticides on mortality in honey bees (Apis mellifera). Bull. Entomol. Res. 2017, 107, 724–733. [Google Scholar] [CrossRef] [PubMed]
  26. Mitchell, J.P.; Nagel, M.W. Time-of-flight aerodynamic particle size analyzers: Their use and limitations for the evaluation of medical aerosols. J. Aerosol Med. 1999, 12, 217–240. [Google Scholar] [CrossRef] [PubMed]
  27. Vosburgh, D.J.H.; Cauda, E.; O’Shaughnessy, P.T.; Sheehan, M.J.; Park, J.H.; Anderson, K. Direct-reading instruments for aerosols: A review for occupational health and safety professionals part 1: Instruments and good practices. J. Occup. Environ. Hyg. 2022, 19, 696–705. [Google Scholar] [CrossRef] [PubMed]
  28. Telg, H.; Collins, D.R.; McComiskey, A. Aerosol optical properties calculated from size distribution measurements: An uncertainty study. Aerosol Sci. Technol. 2023, 57, 597–607. [Google Scholar] [CrossRef]
  29. Sijs, R.; Kooij, S.; Holterman, H.J.; van de Zande, J.; Bonn, D. Drop size measurement techniques for sprays: Comparison of image analysis, phase Doppler particle analysis, and laser diffraction. AIP Adv. 2021, 11, 015315. [Google Scholar] [CrossRef]
  30. Privitera, S.; Manetto, G.; Pascuzzi, S.; Pessina, D.; Cerruto, E. Drop Size Measurement Techniques for Agricultural Sprays: A State-of-The-Art Review. Agronomy 2023, 13, 678. [Google Scholar] [CrossRef]
  31. Sousan, S.; Pender, J.; Streuber, D.; Haley, M.; Shingleton, W.; Soule, E. Laboratory Determination of Gravimetric Correction Factors for Real-time Area Measurements of Electronic Cigarette Aerosols. Aerosol Sci. Technol. 2022, 56, 517–529. [Google Scholar] [CrossRef] [PubMed]
  32. Close, A.; Blackerby, J.; Tunnell, H.; Pender, J.; Soule, E.; Sousan, S. Effects of E-Cigarette Liquid Ratios on the Gravimetric Filter Correction Factors and Real-Time Measurements. Aerosol Air Qual. Res. 2023, 23, 230011. [Google Scholar] [CrossRef] [PubMed]
  33. Streuber, D.; Park, Y.M.; Sousan, S. Laboratory and Field Evaluations of the GeoAir2 Air Quality Monitor for Use in Indoor Environments. Aerosol Air Qual. Res. 2022, 22, 220119. [Google Scholar] [CrossRef] [PubMed]
  34. Hinds, W.C.; Zhu, Y. Aerosol Technology: Properties, Behavior, and Measurement of Airborne Particles; John Wiley & Sons: Hoboken, NJ, USA, 2022. [Google Scholar]
  35. KLD Labs, Inc. DC-IV for Windows 2000/XP/VISTA [Instruction Manual]; KLD Labs, Inc.: Hauppauge, NY, USA, 2009. [Google Scholar]
  36. TSI. Model 3321 Aerodynamic Particle Sizer (APS)® Spectrometer: User’s Manual (Revision K); TSI: Shoreview, MN, USA, 2022. [Google Scholar]
  37. 1371 MiniWRAS, Portable Mini Wide Range Aerosol Spectrometer. Available online: https://www.durag.com/mediafiles/stream/?id=f/2/6/9/f269e05176da8a89166412fca6e00aad161452cd_Datasheet_1371miniwras_en.pdf#page=1.00] (accessed on 3 July 2026).
  38. Safety Data Sheet of DUET® Dual-Action Adulticide. Available online: https://www.clarke.com/wp-content/uploads/2022/03/duet-msds.pdf (accessed on 23 March 2026).
  39. Safety Data Sheet of Malathion 5. Available online: https://www.cdms.net/ldat/mp41D000.pdf (accessed on 3 July 2026).
  40. Chemical Corporation. Specimen Label of Dibrom Concentrate. Available online: https://www.fightthebite.net/download/labels/Dibrom_Concentrate_Label.pdf (accessed on 23 March 2026).
  41. International. Specimen Label of Zenivex E4 RTU. Available online: https://www.mmcd.org/docs/control-materials/Zenivex-E4-label-2016.pdf (accessed on 23 March 2026).
  42. Advancing Chemistry to Advance Agriculture Protect Your Productivity, Profitability and Sustainability. Available online: https://ag.fmc.com/us/en (accessed on 3 July 2026).
  43. Northeast Mosquito Control Association. Solvents for Mosquito Control, Northeast Vector Management Division of Clarke Mosquito Control Products, Inc. Available online: http://nmca.org/PAPER20.htm (accessed on 23 March 2026).
  44. Safety Data Sheet of ANVIL® 10+10 ULV. Available online: https://www.clarke.com/wp-content/uploads/2022/03/anvil1010-msds.pdf (accessed on 23 March 2026).
  45. Safety Data Sheet of BIOMIST® 1.5 + 7.5 ULV. Available online: https://www.clarke.com/wp-content/uploads/2022/03/biomist1575-msds.pdf (accessed on 3 July 2026).
  46. National Vector Borne Disease Control Programme. Govt of India, Directorate General of Health Services, Ministry of Health & Family Welfare. Available online: https://medbox.org/index.php/dl/5e148832db60a2044c2d3e32 (accessed on 3 July 2026).
  47. Shao, W.; Zhang, H.; Zhou, H. Fine Particle Sensor Based on Multi-Angle Light Scattering and Data Fusion. Sensors 2017, 17, 1033. [Google Scholar] [CrossRef] [PubMed]
  48. Hornby, J.A.; Robinson, J.; Opp, W.; Sterling, M. Laser-Diffraction Characterization of Flat-Fan Nozzles used to Develop Aerosol Clouds of Aerially Applied Mosquito Adulticides. J. Am. Mosq. Control Assoc. 2006, 22, 702–706. [Google Scholar] [CrossRef] [PubMed]
  49. Sousan, S.; Regmi, S.; Park, Y.M. Laboratory evaluation of low-cost optical particle counters for environmental and occupational exposures. Sensors 2021, 21, 4146. [Google Scholar] [CrossRef] [PubMed]
Figure 1. Controlled exposure chamber illustrating generation and droplet and particulate measurements.
Environments 13 00387 g001
Figure 2. Comparison of measured MMD for white mineral oil across three instruments, DC-IV, APS and MiniWRAS, at various liquid feed rates (Q) (a) 0.2, (b) 0.4, (c) 0.6, (d) 0.8, and (e) 1.0 mL/min for varying pressures.
Environments 13 00387 g002
Figure 3. Comparison of measured MMD for kerosene across the DC-IV, APS, and MiniWRAS at different liquid feed rates (Q) (a) 0.4, (b) 0.6, (c) 0.8, and (d) 1.0 for varying pressures.
Environments 13 00387 g003
Figure 4. Comparison of measured CMD for white mineral oil across three instruments, DC-IV, APS and MiniWRAS, at various liquid feed rates Q) (a) 0.2, (b) 0.4, (c) 0.6, (d) 0.8, and (e) 1.0 mL/min for varying pressures.
Environments 13 00387 g004
Figure 5. Comparison of measured CMD for kerosene across the DC-IV, APS, and MiniWRAS at different liquid feed rates (Q) (a) 0.4, (b) 0.6, (c) 0.8, and (d) 1.0 for varying pressures.
Environments 13 00387 g005
Figure 6. Mean dM/dlogDp distributions for the DC-IV, APS, and MiniWRAS at four selected mineral oil conditions representing (a) best agreement (Q = 0.20 mL/min, P = 4.3 bar), (b) moderate disagreement (Q = 0.20 mL/min, P = 1.3 bar), (c) near-maximum disagreement (Q = 0.80 mL/min, P = 1.0 bar), and the (d) transition zone (Q = 0.40 mL/min, P = 5.0 bar). Shaded regions indicate ±1 standard deviation across scans within each steady-state window.
Environments 13 00387 g006
Figure 7. Mean dN/dlogDp distributions for the DC-IV, APS, and MiniWRAS at four selected mineral oil conditions representing (a) best agreement (Q = 0.20 mL/min, P = 4.3 bar), (b) moderate disagreement (Q = 0.20 mL/min, P = 1.3 bar), (c) near-maximum disagreement (Q = 0.80 mL/min, P = 1.0 bar), and (d) the transition zone (Q = 0.40 mL/min, P = 5.0 bar). Shaded regions indicate ±1 standard deviation across scans within each steady-state window.
Environments 13 00387 g007
Figure 8. Mean dM/dlogDp distributions for the DC-IV, APS, and MiniWRAS at four selected kerosene conditions representing (a) best agreement (Q = 0.60 mL/min, P = 2.0 bar), (b) moderate agreement (Q = 0.80 mL/min, P = 5.2 bar), (c) moderate disagreement (Q = 1.00 mL/min, P = 4.1 bar), and (d) maximum disagreement (Q = 0.80 mL/min, P = 3.0 bar). Shaded regions indicate ±1 standard deviation across scans within each steady-state window.
Environments 13 00387 g008
Figure 9. Mean dN/dlogDp distributions for the DC-IV, APS, and MiniWRAS at four selected kerosene conditions representing (a) best agreement (Q = 0.60 mL/min, P = 2.0 bar), (b) moderate agreement (Q = 0.80 mL/min, P = 5.2 bar), (c) moderate disagreement (Q = 1.00 mL/min, P = 4.1 bar), and (d) maximum disagreement (Q = 0.80 mL/min, P = 3.0 bar). Shaded regions indicate ±1 standard deviation across scans within each steady-state window.
Environments 13 00387 g009
Table 1. Summary of instrument measurement principles, diameter types, and size ranges.
InstrumentMeasurement PrincipleDiameter TypeSize Range
DC-IV (KLD LABS, Inc.)Heated hot-wire probe; droplet wet wire length proportional to diameterGeometric diameter (equivalent sphere)1–200 µm (oil)
GRIMM Mini-WRAS 1.371Electrical mobility
(NanoSizer, 10–200 nm) +
laser light scattering
(optical, 200 nm–35 µm)
Electrical mobility
diameter (<200 nm);
optical equivalent
diameter (≥200 nm)
10 nm–35 µm
(41 size classes)
TSI APS 3321Time-of-flight aerodynamic sizingAerodynamic diameter0.5–20 µm
Table 2. Independently calculated MMD and CMD values compared to the DC-IV’s reported values across steady state and non-steady state measurements.
MeasurementMMD Calc. (µm)MMD Rept. (µm)MMD Err. (µm)CMD Calc. (µm)CMD Rept. (µm)CMD Err. (µm)
13.1193.1210.0020.5930.593<0.001
241.47441.4730.0010.6350.635<0.001
320.12620.1280.0020.5920.592<0.001
497.16497.165<0.0010.6220.622<0.001
51100.5990.599<0.001
61100.6070.607<0.001
741.30641.305<0.0010.6090.609<0.001
81.4151.415<0.0010.5930.593<0.001
911.32811.3160.0130.6470.647<0.001
101.1091.11<0.0010.6320.632<0.001
1190.16690.166<0.0010.6170.617<0.001
121.1381.138<0.0010.640.64<0.001
131.7851.785<0.0010.6420.642<0.001
141.7571.757<0.0010.6710.671<0.001
151.6911.691<0.0010.6640.664<0.001
161.6551.655<0.0010.6760.676<0.001
171.3431.343<0.0010.6820.682<0.001
182.0712.071<0.0010.6940.694<0.001
191.5841.584<0.0010.7080.708<0.001
201.4041.404<0.0010.7110.711<0.001
211.7961.796<0.0010.6820.682<0.001
221.5571.557<0.0010.6750.675<0.001
231.4971.497<0.0010.6920.692<0.001
247.5677.5680.0020.5860.586<0.001
2527.90927.910.0010.6380.638<0.001
2620.18120.1830.0020.6250.6250
2740.64940.649<0.0010.6330.633<0.001
284.6814.682<0.0010.6060.606<0.001
291.0891.0880.0010.6070.607<0.001
307.2677.2590.0080.5890.589<0.001
Calc. = Calculation; Err. = Error (Difference).
Table 3. CMD and MMD descriptive statistics and instrument comparisons.
MetricSolventDeviceNMean (SD)Median (Min–Max)Comparisonp-Value
CMDMOAPS251.65 (0.75)1.46 (1.19–5.16)DC-IV vs. APS<0.001
DC-IV270.97 (0.43)0.82 (0.63–2.33)DC-IV vs. MiniWRAS<0.001
MiniWRAS270.1 (0.02)0.1 (0.06–0.15)APS vs. MiniWRAS<0.001
KOAPS131.23 (0.5)1.02 (0.91–2.22)DC-IV vs. APS<0.001
DC-IV130.75 (0.08)0.73 (0.65–0.9)DC-IV vs. MiniWRAS<0.001
MiniWRAS130.06 (0.01)0.06 (0.04–0.07)APS vs. MiniWRAS<0.001
MMDMOAPS274.88 (1.61)4.31 (3.61–9.84)DC-IV vs. APS<0.001
DC-IV2730.78 (20.03)30.35 (2.2–70.87)DC-IV vs. MiniWRAS<0.001
MiniWRAS273.15 (0.49)2.97 (2.3–4.11)APS vs. MiniWRAS<0.001
KOAPS136.45 (0.19)6.46 (6.14–6.7)DC-IV vs. APS0.497
DC-IV136.21 (5.24)4.97 (1.86–19.5)DC-IV vs. MiniWRAS0.455
MiniWRAS134.09 (0.04)4.1 (4–4.16)APS vs. MiniWRAS<0.001
MO: Mineral Oil; KO: Kerosene Oil.
Table 4. Comparison of MMD calculation methods’ (Methods 2, 3 and 4 vs. Method 1) threshold for success: ±1% difference from standard.
DC-IVAPSMiniWRAS
Mineral oil
Method 2: Distribution-FreeFailed (+792.6%)Failed (+6.0%)Passed (+0.05%)
Method 3: Hatch–ChoateFailed, unstableFailed (+33.5%)Failed (−31.5%)
Method 4: Volume-BasedFailed (+221.6%)Passed (−0.04%)Passed (+0.10%)
Kerosene oil
Method 2: Distribution-FreeFailed (+2052.3%)Failed (+6.0%)Passed (−0.04%)
Method 3: Hatch–ChoateFailed (+29.2%)Failed (+316.7%)Failed (−88.5%)
Method 4: Volume-BasedFailed (+1242.7%)Passed (−0.03%)Passed (+0.11%)
“Failed, unstable” indicates that the Hatch–Choate calculation produced highly divergent estimates for some DC-IV mineral oil distributions.
Disclaimer/Publisher’s Note: The statements, opinions and data contained in all publications are solely those of the individual author(s) and contributor(s) and not of MDPI and/or the editor(s). MDPI and/or the editor(s) disclaim responsibility for any injury to people or property resulting from any ideas, methods, instructions or products referred to in the content.