


Abstract
Overexploitation of lead–zinc (Pb–Zn) mines results in rock exposure and the dispersal of potentially toxic elements (PTEs) via runoff. These potentially toxic elements accumulate in degraded depressions (negative landforms), leading to severe pollution and creating an urgent need for monitoring and remediation. Thus, this study focuses on a typical abandoned funnel–shaped Mississippi Valley–Type (MVT) Pb–Zn mine pit located in Maomaochang, northwestern Guizhou, China. A quadratic polynomial model was used to analyze the response of bryophyte diversity to vertical pollution gradients, and RLQ analysis was applied to explore the key species–trait–environment relationships. Results showed that PTE concentrations (e.g., Mn, Zn, Cd) in moss tissues converged with those in the soil. A total of 58 species from 22 genera in 6 families were identified, dominated by the families Pottiaceae, Bryaceae, and Brachytheciaceae. Both species and functional diversity exhibited a U–shaped response to an increase of the Nemerow composite index PN (Z–score). Furthermore, a significant correlation was observed between PTEs and bryophyte distribution. Key bryophyte species showed distinct adaptations: in heavily polluted zones (e.g., pit bottom), Didymodon fallax (Hedw.) R. H. Zander displayed warted and curled leaves, whereas in lightly polluted zones (e.g., top), Plagiobryum zierii (Hedw.) Lindb. had smooth and flattened leaves. Overall, this study highlights that bryophytes possess potential bioindication capacity for environmental monitoring in this MVT Pb–Zn mine pit.
1. Introduction
Overexploitation of lead–zinc (Pb–Zn) mines has led to severe contamination by potentially toxic elements (PTEs) in and around mining sites [1,2]. Balabanova et al. [1] conducted a quantitative assessment of PTEs in downwind areas of a Pb–Zn mine using mosses as biomonitors. Mississippi Valley–Type (MVT) Pb–Zn deposits represent one of the major types of such ores. The carbonate rocks are primarily composed of minerals such as dolomite (CaMg(CO3)2) and calcite (CaCO3) [3]. The ore assemblages are dominated by zinc, followed by lead, with sulfur as a common associated element [4]. Overexploitation of MVT Pb–Zn mines can result in the formation of funnel–shaped pits. These are a type of karstic negative geomorphology characterized by complex features including exposed bedrock, distinct slopes, and leaching processes [5,6], resulting in the enrichment of elements at the pit bottom. These characteristics primarily distinguish such mining pits from natural sinkholes. Previous studies on MVT Pb–Zn deposits have focused on aspects such as geographical distribution [7], metallogenic environment [8], and ore fabric [9]. However, studies concerning biomonitoring and ecological restoration following damage to this specific type of mining area remain scarce.
Bryophytes are considered the most primitive land–dwelling group among higher plants. Due to their wide distribution, high sensitivity to, and ability to accumulate potentially toxic elements (PTEs), monitoring the growth trends of bryophytes in mining areas allows for an assessment of local PTE contamination. As a result, they are widely used as bioindicators of PTEs from both natural and anthropogenic sources [10,11,12,13]. The consistent correlation observed between PTE levels in bryophytes and those in soils across various mining areas (e.g., gold, manganese) underscores the reliability of these plants as bioindicators for monitoring mining pollution [14,15]. Research on bryophyte species diversity across horizontal habitats in various mining areas (e.g., gold, bauxite, and manganese mines) has revealed a general negative correlation between species diversity and PTE levels among different functional zones [16,17,18]. Furthermore, significant correlations have been observed between functional diversity or specific functional traits of bryophytes and the spatial distribution of soil PTEs in these areas [19,20]. Multiple studies on moss communities in sinkholes have reported a consistent vertical diversity gradient: bottom > middle > top [21,22]. In contrast, research on species diversity, functional diversity, and pollution monitoring specifically within MVT Pb–Zn mining areas remains limited. Conducting such studies in these environments is crucial for advancing the ecological restoration of abandoned Pb–Zn mines.
Northwestern Guizhou is one of the concentrated distribution areas of MVT Pb–Zn deposits in the karst region of China [23]. Intensive mining activities have resulted in the formation of numerous abandoned mine pits and severe PTE contamination in the surrounding environment. The Maomaochang MVT Pb–Zn deposit in this area is a typical representative of such mines. This study focuses on one of the most representative abandoned doline Pb–Zn mine pits in northwestern Guizhou, aiming to (i) analyze the response patterns of bryophyte species diversity and functional diversity to the vertical pollution gradients, and (ii) investigate the adaptive characteristics of key bryophyte species across different vertical gradients.
2. Materials and Methods
2.1. Study Area
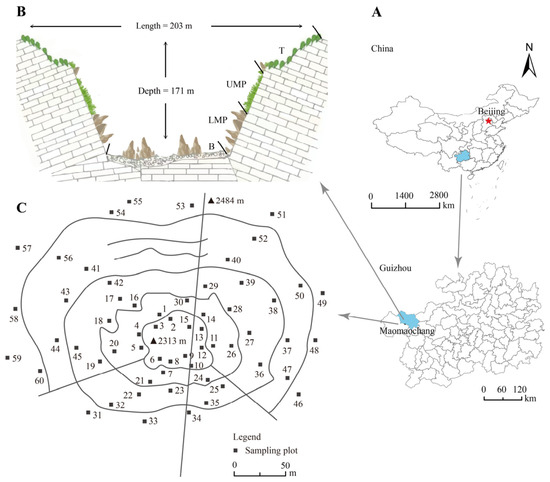
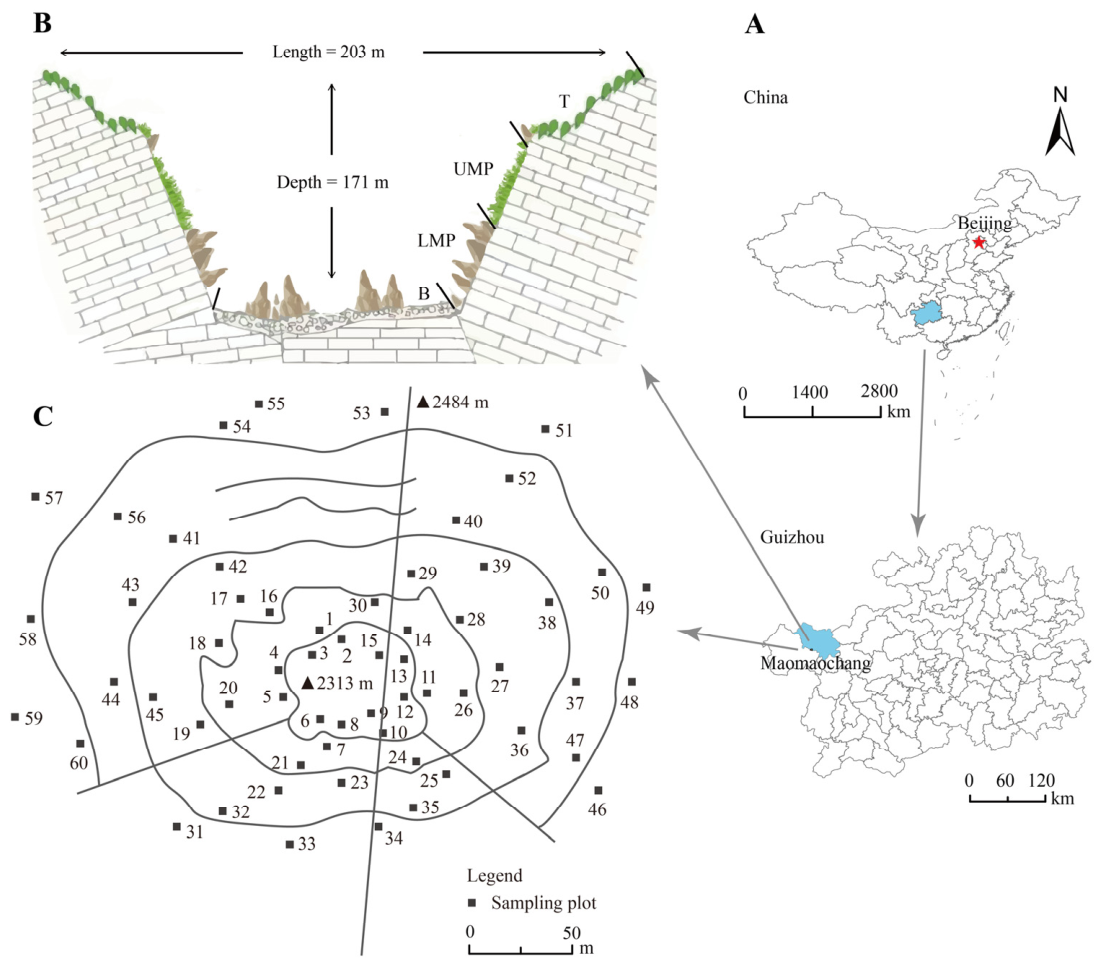
The abandoned Maomaochang MVT Pb–Zn mine is located 27 km southwest of Hezhang County, Bijie City, Guizhou Province (26°57′57″–26°58′34″ N, 104°29′25″–104°29′52″ E), with an elevation of 2313–2484 m. The pit exhibits a funnel–like morphology, featuring an opening diameter of 203 m and a depth of 171 m (Figure 1). A distinct vertical gradient of vegetation succession was observed within the mining pit. The bottom and lower–middle part were dominated by ① lithophytic bryophyte communities on thin soil over bedrock. The upper–middle part transitioned to ② bryophyte communities co–occurring with herbaceous plants and sparse, low shrubs on terrestrial soil. The top supported ③ bryophyte communities alongside denser herbaceous vegetation and sparse, taller shrubs, also on terrestrial soil substrates. The mine terrain sloped from north (higher) to south (lower). The northern face of the pit, spanning the upper–middle part to the top, featured a near–vertical, black exposed rock wall (Figure 1C). The remaining areas consisted of gentle slopes, with the bottom and lower–middle part containing numerous rocks colonized by bryophytes (Figure 1B). The region is situated in a warm–temperate climate zone, with a mean annual temperature of 12.6 °C and annual precipitation of 885.5 mm. The local landscape is typical of karst terrain developed on carbonate rocks, where dolomite serves as the predominant bedrock.
Figure 1.
Brief sketch of the location of the doline mine pit. (A) Location map. (B) Surveying the entire picture (B, LMP, UMP, T denote the bottom, lower–middle part, upper–middle part, and top of the pit, respectively; the same applies below). (C) Sampling profile diagram.
2.2. Sampling
Based on the vertical gradient of vegetation types and the radial enrichment pattern of elements within the negative topography, four vertical sampling gradients were established in the funnel–shaped mining pit: bottom (B), lower–middle part (LMP), upper–middle part (UMP), and top (T), with a distance of 35–65 m between adjacent gradients. At each of the four gradients, three 5 m × 5 m quadrats were set up. Within each quadrat, five sub–quadrats were arranged according to the “five–point sampling method” [20,24,25]. All bryophytes and soil samples (0–2 cm) within a 10 cm × 10 cm metal frame placed on the ground were collected. A total of 12 quadrats were established, from which 60 bryophyte specimens and 60 soil samples were collected. For each sample, coverage, habitat type, latitude, longitude, and altitude were recorded. After removing impurities, the samples were sealed in bags and transported to the laboratory, where they were stored at room temperature (10–13 °C) for subsequent species identification (60 individual specimens) and PTE analysis. For PTE determination, the five bryophyte or soil subsamples from each quadrat were pooled into a single composite sample, yielding 12 composite bryophyte samples and 12 composite soil samples. The PTEs measured included Al, Ba, Cd, Mn, Ni, Pb, Se, Sr, Zn, and Tl.
2.3. Species Identification and Functional Trait Statistics
Bryophyte specimens were identified based on classical morphological taxonomy using an HWG–1 stereomicroscope and a Nikon Eclipse Si optical microscope. The identification followed taxonomic descriptions provided in Flora Bryophytorum Sinicorum (Volumes 1, 4, 6–8) [26,27,28,29,30] and Moss Flora of China (Volume 2) [31]. Morphological traits for all 58 recorded species were documented during observation (Table 1). The selection of these traits adhered to the following criteria:
- Reference to diagnostic characteristics recognized in the Flora Bryophytorum Sinicorum;
- Priority given to microscopic traits with clear taxonomic significance at the genus and species levels and ease of observation;
- Traits recorded as qualitative categorical variables. Key features included the presence or absence of leaf cell wart, the position of the midrib termination, leaf margin condition (entire or toothed), leaf curling, and the degree of axial differentiation.
Table 1.
List of bryophyte functional traits.
2.4. Sample Processing
For PTE analysis of bryophytes and soil, visible debris on the bryophyte surface was gently removed using a soft brush, followed by repeated rinsing with distilled water at least three times until the rinse water became clear. This process was intended to minimize interference from adhering soil particles. Although this cleaning procedure effectively removed loosely attached soil particles, it could not completely eliminate stably deposited elements on the bryophyte surface. Therefore, the measured elemental content in bryophytes represents a mixed total that includes both endogenous accumulation within the tissues and externally deposited elements. The cleaned samples were oven–dried at 60 °C to constant weight, ground, and passed through a 100–mesh sieve [32]. Subsequently, 0.5 g of each sample was digested with 5 mL of nitric acid (HNO3) and 1 mL of perchloric acid (HClO4) at 130–150 °C until the brown fumes disappeared. The temperature was then raised to 180 °C, and digestion continued until the digestate became clear or faintly yellow. After cooling, the solution was diluted to a final volume of 50 mL for analysis. Soil samples were air–dried naturally, ground, and sieved through a 200–mesh screen. A 0.5 g aliquot was moistened with water, treated with 5 mL of hydrochloric acid (HCl), and gently heated until the volume was reduced to approximately 2 mL. Then, 10 mL of HNO3 was added, and heating continued until a near–viscous residue remained. This was followed by the addition of 5 mL hydrofluoric acid (HF) and 2 mL of HClO4, with heating until white fumes were substantially evolved. The residue was rinsed and dissolved using a warm 2% HNO3 solution. After cooling, the solution was made up to 50 mL with 2% HNO3 for measurement by inductively coupled plasma mass spectrometry (ICP–MS; Thermo Fisher iCAP RQ, Thermo Fisher Scientific, Waltham, MA, USA) and inductively coupled plasma atomic emission spectrometry (ICP–AES; Thermo Fisher iCAP 7400, Thermo Fisher Scientific, Waltham, MA, USA) [33]. The detection limits of ICP–MS and ICP–AES were 0.1 ng/mL and 10 ng/mL, respectively. During the analytical process, blank samples and parallel samples were included, with all measurements performed in triplicate. The accuracy and precision of the determined elements were assessed using standard reference materials (GBW10012 for plant and GBW07978 for soil). Recovery rates (measured value/standard reference value × 100%) ranged from 93.1% to 107.5%.
2.5. Statistical Analysis
The soil pollution assessment methods adopted are the Nemerow composite index (PN) method and the soil single–factor pollution index (Pi) method.
In Formulas (1) and (2): is the average Pi value, Pimax is the maximum Pi value, Ci is the measured mass concentration of the PTE i (mg/kg), and Si is the background standard value of element i (mg/kg). The background reference values used in this study are the soil background values for Guizhou Province recorded by the National Environmental Monitoring Station [34]. The contamination levels of PN could be categorized into five grades: safe (PN ≤ 0.7), alert limit (0.7 < PN ≤ 1), mild pollution (1 < PN ≤ 2), moderate pollution (2 < PN ≤ 3), and severe pollution (PN > 3) [35].
This study employed R 4.5.0, Excel 2021, ArcGIS 10.7, and Adobe Illustrator 2020 for data analysis and visualization. The study area map was created using ArcGIS 10.7 and Adobe Illustrator 2020. Data analysis was conducted with R 4.5.0, and the “vegan” package was used to calculate the Shannon–Wiener index, Simpson index, and Pielou evenness index. The “mFD” package was utilized to calculate Rao’s quadratic entropy index (RaoQ) and the functional dispersion index (FDis). RaoQ incorporates both species relative abundances and pairwise functional dissimilarities, representing the mean trait difference between two randomly selected individuals [36,37]. FDis quantifies the dispersion of species traits in functional trait space [38]. Permutation tests were used to compare diversity differences among habitats, with resulting p–values adjusted using the false discovery rate (FDR). The Kruskal–Wallis rank–sum test was employed to analyze differences in PTE concentrations among habitats, with effect size measured by η2 (η2 = H/(H-N + k)). The results were validated using permutation tests with 9999 iterations. Permutation regression (1000 iterations) was applied to obtain permutation p values, with effect sizes quantified using Cohen’s f2, and model diagnostics were performed accordingly. Polynomial regression models were fitted using the R function lm( ). RLQ analysis [39] was performed with the ade4 package, integrating key bryophyte species (the top five species in terms of importance value within each vertical gradient), functional traits (categorical traits converted to dummy variables), and PTEs. This analysis integrated the environmental matrix (R), species abundance matrix (L), and trait matrix (Q) through co–inertia analysis, aiming to reveal their co–variation patterns and to quantify the key environmental drivers shaping the distribution of bryophyte functional traits.
3. Results
3.1. PTE Distribution in Bryophytes and Substrate Soil
3.1.1. Contamination Levels of PTEs in the MVT Pb–Zn Mine Pit
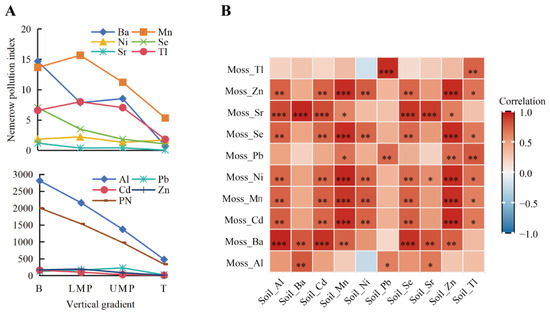
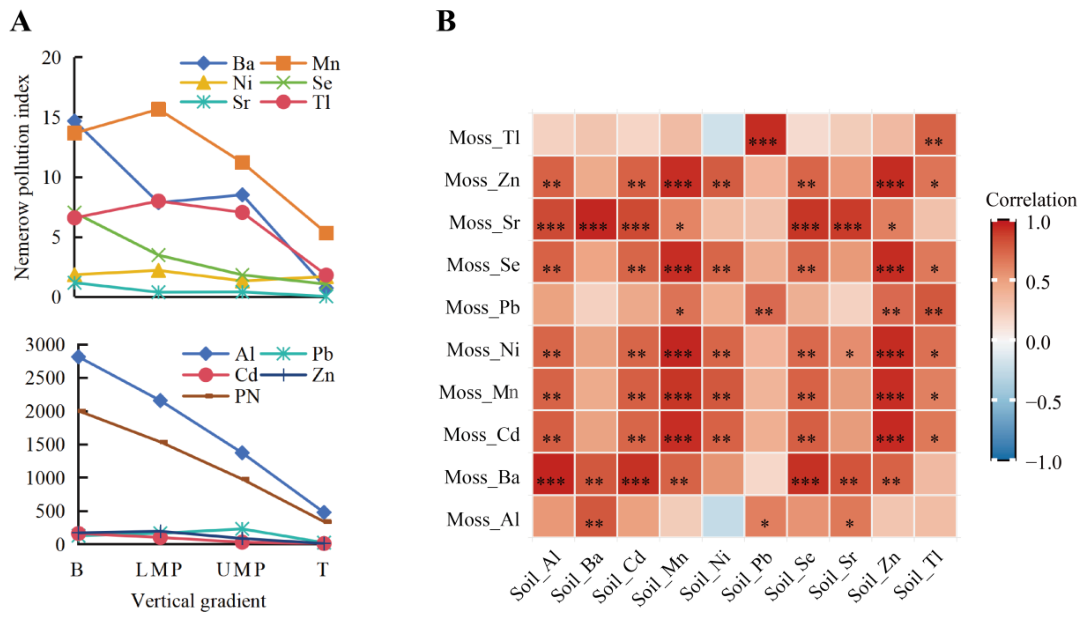
The Nemerow index, calculated for PTEs (e.g., Pb, Zn, Ba, Cd, Se) in topsoil, revealed that while a few elements (e.g., Mn, Tl, Ni) exhibited their highest contamination indices in the lower–middle part of the pit, the overall integrated pollution index decreased markedly from the bottom to the top, following the sequence: bottom > lower–middle part > upper–middle part > top (Figure 2A). Among these, Pb, Zn, Cd, and Al exhibited relatively high contamination levels. Moreover, the location of the study area within a mining zone further supports its classification as a heavily contaminated area (Table 2).
Figure 2.
Nemerow pollution index of soil samples and correlation analysis of PTEs between bryophytes and substrate soil. (A) the Nemerow pollution index (Pi and PN) of soil samples. (B) Spearman correlation analysis of PTEs between bryophytes and topsoil. The color of the squares represents the magnitude and direction (positive or negative) of the Spearman correlation coefficient between two variables, with red and blue representing positive and negative correlations, respectively. The asterisks represent significant difference (*, p < 0.05; **, p < 0.01; ***, p < 0.001). Concentrations of PTEs in both bryophytes and soil were standardized by Z–score to eliminate dimensional error.
Table 2.
The Nemerow index across vertical gradients.
3.1.2. Correlation of PTEs Between Bryophytes and Their Substrate Soil
A comprehensive correlation analysis of element concentrations in the 12 mixed bryophyte communities and their corresponding substrates revealed that Zn, Mn, and Sr in bryophytes and substrates exhibited extremely significant positive correlations (p < 0.001), while Tl, Se, Pb, Ni, Cd, and Ba showed very significant positive correlations (p < 0.01). Moreover, with the exception of Tl and Al in bryophytes and Ba, Pb, and Sr in soils, most other elements displayed varying degrees of significant positive correlations with the majority of elements in either the substrate or bryophyte samples. These findings suggest that synergistic interactions, rather than antagonistic effects, may predominate in the bryophyte–soil system for these elements (Figure 2B).
3.2. Response of Bryophyte Diversity to Vertical Pollution Gradients
3.2.1. Response of Bryophyte Community Composition to Vertical Pollution Gradients
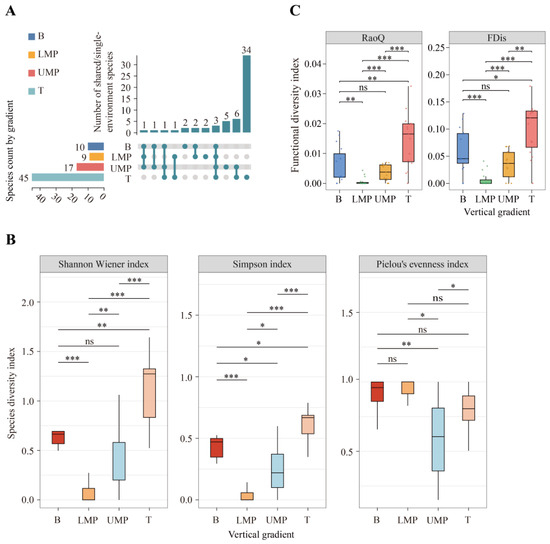
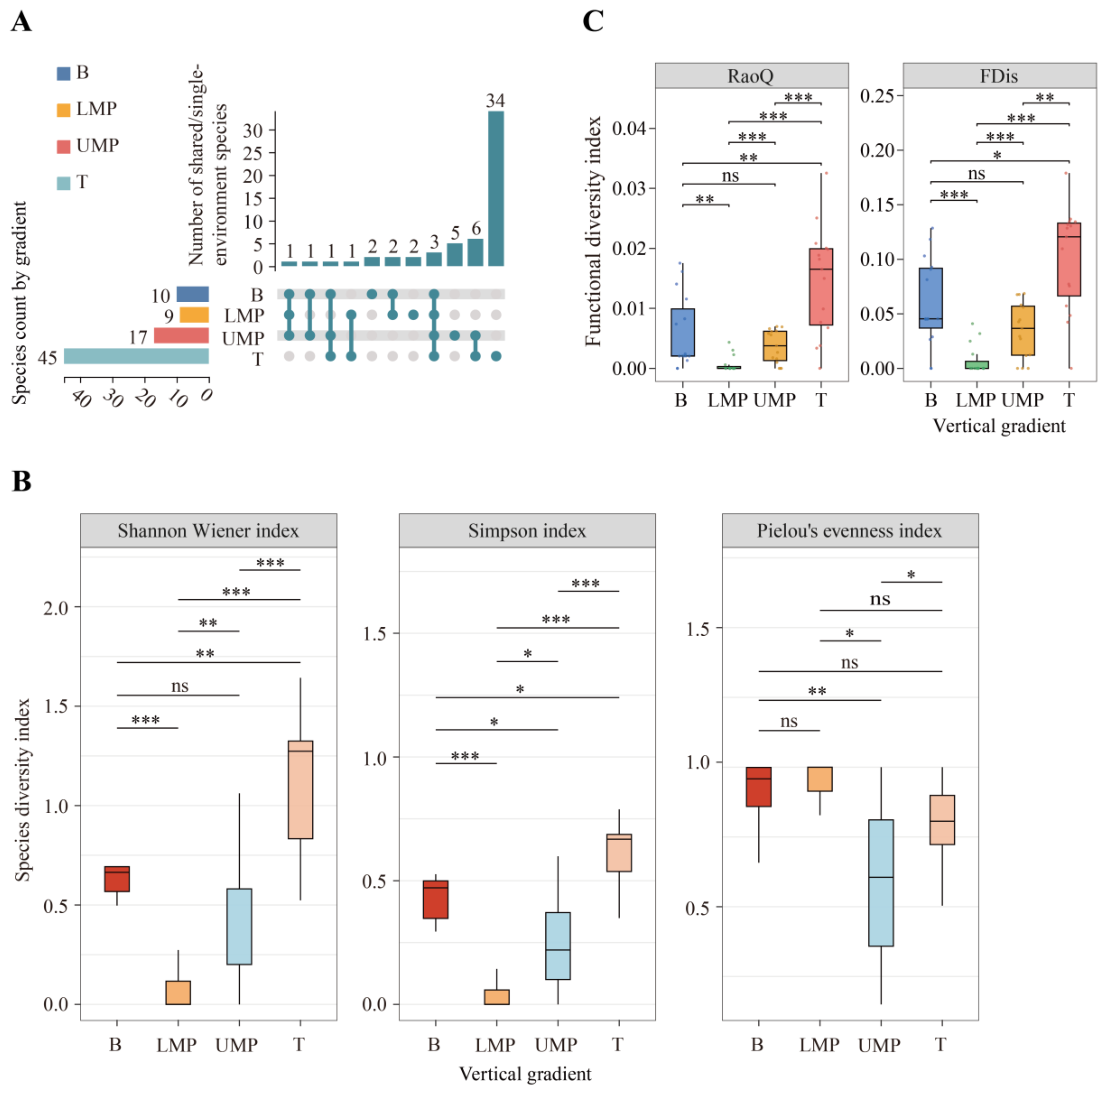
A total of 58 bryophyte species were identified, belonging to 6 families and 22 genera (Table S1). The dominant families were Pottiaceae (39.66%), Bryaceae (24.14%), and Brachytheciaceae (15.52%), whereas Dicranaceae, Thuidiaceae, and Polytrichaceae accounted for 10.34%, 5.17%, and 5.17%, respectively. The total species richness across all environments, as well as the number of species restricted to a single environment, followed the pattern: bottom ≈ lower–middle part < upper–middle part < top. The highest number of shared species occurred between the upper–middle part and the top zone (Figure 3A).
Figure 3.
Bryophyte species counts and diversity indices across the vertical gradient. (A) Species counts for each gradient, including total species, shared species, and species with a narrow ecological amplitude (restricted to a single environment). The green nodes illustrate the calculation of shared species (connected nodes) and narrow–amplitude species (individual nodes); the accompanying bar chart quantifies the number of narrow–amplitude or shared species across the four gradients. (B) Species diversity indices. (C) Functional diversity indices. Significance levels: ns, p > 0.05; *, p < 0.05; **, p < 0.01; ***, p < 0.001.
3.2.2. Response of Species Diversity to Vertical Pollution Gradients
Comparison of species diversity indices across different gradients (Figure 3B) revealed that the Shannon–Wiener index and the Simpson index both exhibited significant differences between adjacent gradients. Specifically, from the bottom to the top, both indices first showed a significant decrease (p < 0.001), followed by a significant increase (p < 0.01), and finally another extremely significant increase (p < 0.001). Both indices reached their lowest values in the lower–middle gradient and their highest values at the top, where they were significantly higher than in all other habitats (p < 0.05). It is worth noting that the Shannon–Wiener index at the bottom did not differ significantly from that in the upper–middle part (p > 0.05). The Pielou evenness index showed a slightly different trend: it remained relatively high in the bottom and lower–middle gradients with no significant difference between them (p > 0.05); it was significantly lower in the upper–middle part than in the bottom and lower–middle part (p < 0.05); and it was significantly higher at the top than in the upper–middle part (p < 0.05), while showing no significant difference between the top and the bottom or lower–middle part (p > 0.05). Overall, from the bottom to the top, the Shannon–Wiener index, Simpson index, and Pielou evenness index all exhibited non–linear trends, first decreasing and then increasing, with the turning point occurring in the lower–middle part (for the Shannon–Wiener and Simpson indices) or in the upper–middle part (for the Pielou evenness index).
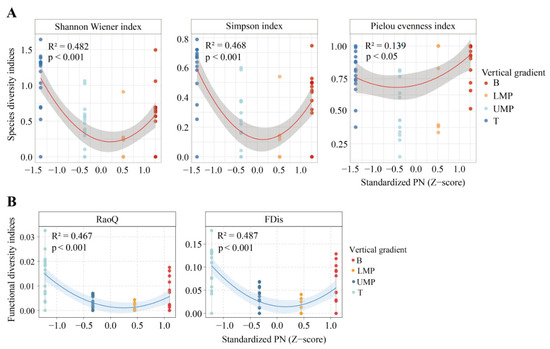
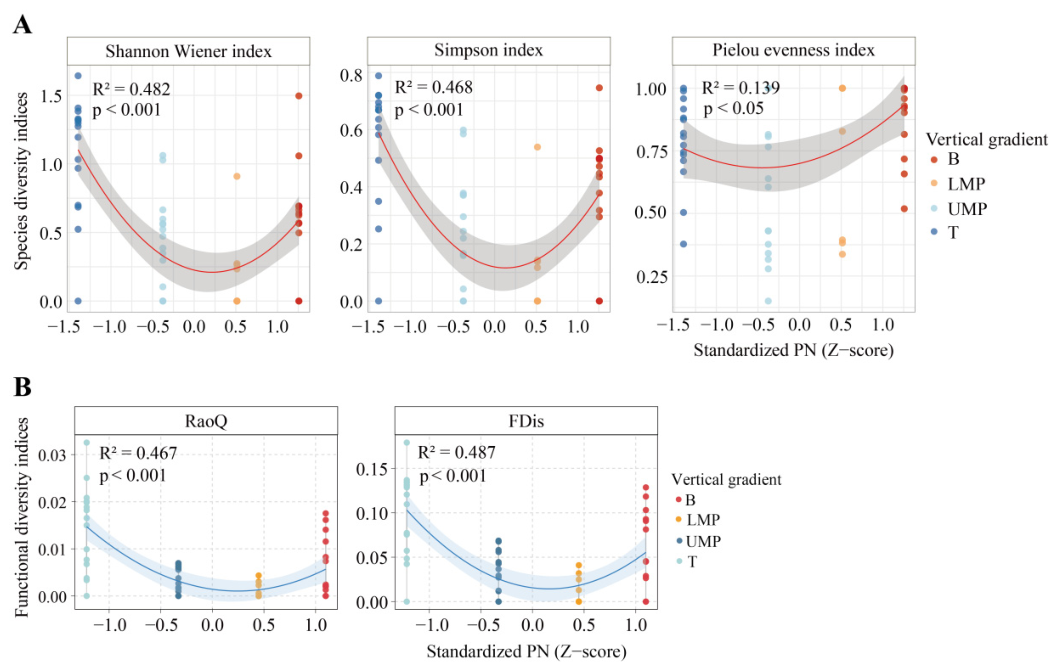
From the top to the bottom, the quadratic polynomial regression analysis showed that the Shannon–Wiener index, Simpson index, and Pielou evenness index exhibited a U–shaped response to the vertical gradient. In particular, the Shannon–Wiener index and Simpson index demonstrated a significant quadratic relationship (permutation test, p < 0.001), explaining 48.2% and 46.8% of the variation, respectively (Figure 4A). According to model diagnostics, the models satisfied the assumptions of homoscedasticity and approximate normality [Figure A1], with a large effect size (Cohen’s f2 > 0.8) [Table A1]. The quadratic model for Pielou evenness was also significant (p < 0.05) but explained only 13.9% of the variation (R2 = 0.139) (Figure 4A); nevertheless, model diagnostics supported the model assumptions, with a medium effect size (f2 = 0.162), indicating a non–linear response of evenness to the pollution gradient.
Figure 4.
Quadratic polynomial models of the relationship between bryophyte diversity indices and the PN (Z–score). (A) Species diversity indices. (B) Functional diversity indices.
3.2.3. Functional Diversity in Response to Vertical Pollution Gradients
Comparison of functional diversity indices (RaoQ and FDis) across different vertical gradients (Figure 3C) revealed a non–linear trend, with functional diversity first decreasing and then increasing from the bottom to the top, and the turning point occurring in the lower–middle part. Both indices exhibited consistent and significant changes between adjacent gradients (p < 0.01). Quadratic polynomial regression analysis of RaoQ and FDis against PN (Z–score) (Figure 4B) showed that both indices displayed a significant U–shaped response to PN (Z–score) (R2 = 0.467–0.487, p < 0.001). In all models, the coefficient of the linear term was significantly negative, whereas the quadratic term coefficient was significantly positive (Table A2), indicating that functional diversity first decreased and then increased with pollution level, reaching its minimum under moderate pollution. Residual diagnostics confirmed that all models satisfied the assumptions of normality and homoscedasticity, demonstrating good model fit (Figure A2).
3.3. Relationships Among Bryophyte Species, Functional Traits, and Environment Based on RLQ Analysis
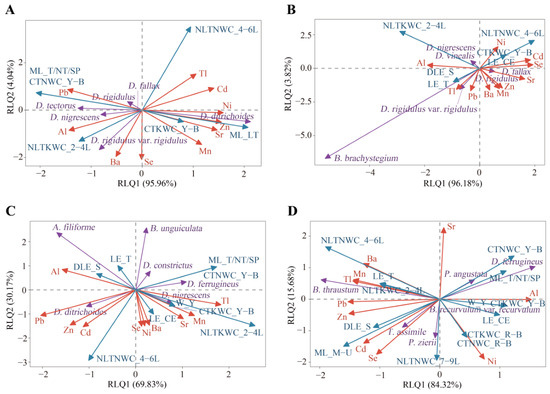
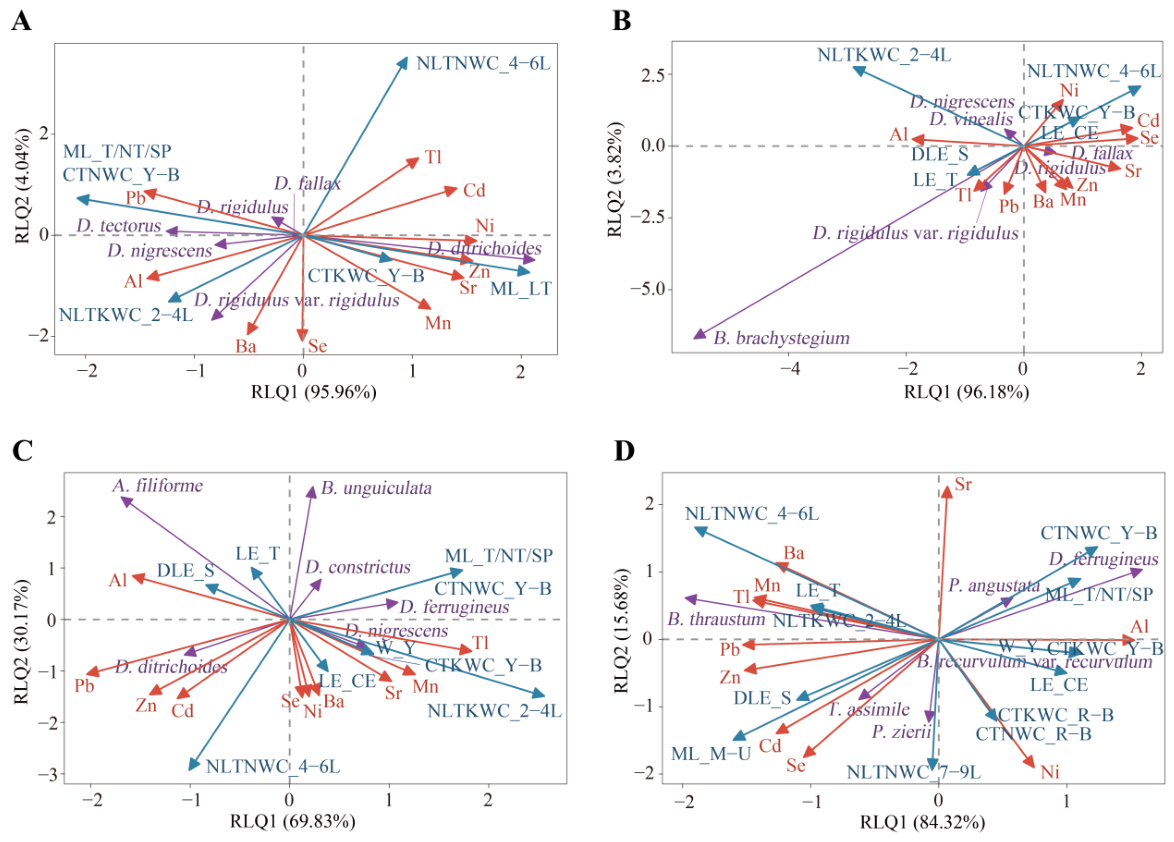
RLQ analysis was conducted on key bryophyte species, functional traits, and PTEs across four vertical gradients from the bottom to the top of the mine pit (Figure 5). The results showed that the first and second axes of the RLQ analysis for the bottom, lower–middle part, upper–middle part, and top together explained 100% of the variance in the relationship between bryophyte traits and PTEs. Among them, the first axis (RLQ1) exhibited extremely high or relatively high explanatory power, accounting for 95.96%, 96.18%, 69.83%, and 84.32% of the variance, respectively, whereas the second axis (RLQ2) accounted for the remaining variance: 4.04%, 3.82%, 30.17%, and 15.68%, respectively. This indicates that the contributions of bryophyte species, traits, and PTEs were greater on the first axis than on the second axis.
Figure 5.
RLQ analysis of key bryophyte species, traits, and PTEs across pollution gradients in the mine pit. (A) Bottom. (B) Lower–middle part. (C) Upper–middle part. (D) Top.
The RLQ analysis (Figure 5) revealed distinct compositions of key bryophyte species across the different gradients. The species composition was relatively simpler from the bottom to the upper–middle part (Figure 5A–C) compared to the top (Figure 5D). Key species at the bottom (Figure 5A) and lower–middle part (Figure 5B)—such as Didymodon fallax (Hedw.) R. H. Zander, Didymodon rigidulus Hedw., and Didymodon nigrescens (Mitti.) Saito—all belonged to the Pottiaceae, while the upper–middle part features species from the Pottiaceae (e.g., Didymodon ferrugineus (Schimp. ex Besch.) Hill, Didymodon ditrichoides (Broth.) X. J. Li & S. He) and the Bryaceae (e.g., Anomobryum filiforme (Dicks.) Husn., whose presence indicated the beginning of diversification in key species categories at the upper–middle part). In contrast, the top (Figure 5D) exhibited the highest diversity, with key species representing Pottiaceae (e.g., D. ferrugineus), Bryaceae (e.g., Plagiobryum zierii (Hedw.) Lindb.), Brachytheciaceae (e.g., Brachythecium thraustum Müll. Hal.), and the Thuidiaceae (e.g., Thuidium assimile (Mitt.) A. Jaeger).
The adaptive traits of key bryophyte species exhibited both commonalities and differences across gradients, with species showing distinct correlations with PTEs. The key species shared by the bottom (Figure 5A) and lower–middle part (Figure 5B) were D. fallax and D. rigidulus, which possessed warty leaves and curled leaves. At the bottom, these species showed positive correlations with Pb, while in the lower–middle part, they were positively correlated with Sr and Zn, and also correlated with entire leaf margins and midribs extending to the leaf tip or slightly beyond. The key species common to the upper–middle part and the top was D. ferrugineus, characterized by warty leaves, a midrib extending to or slightly beyond the leaf tip, and thick/thin–walled cells of the stem appearing yellow–brown. It exhibited a positive correlation with Tl and Al. In the upper–middle part, the key species A. filiforme, with spreading and serrulate leaves, was positively correlated with Al. The top contained the greatest variety of key species and adaptive traits. The distribution of species, traits, and PTEs was more dispersed, indicating lower environmental similarity with other sections. Key species at the top included P. zierii and T. assimile, which possessed spreading leaves and a midrib that disappears in the upper–middle portion of the leaf blade, and were positively correlated with Cd, Se, and Ni.
4. Discussion
4.1. Distribution of PTEs in Bryophytes and Soil Along Vertical Pollution Gradients
The study area exhibited a generally decreasing pollution gradient from the bottom to the top (Figure 1), likely due to weathering, mine drainage, rainwater erosion, and dispersion processes that facilitated the downward migration and enrichment of PTEs [6,40,41]. Correlation analysis revealed significant associations between PTE concentrations in bryophyte communities and those in the corresponding substrates (Figure 2B), indicating their potential for monitoring PTE contamination in this lead–zinc mine pit at Maomaochang. However, the approach adopted in this study for measuring PTE content from a community perspective (pooling every five samples into one composite sample) has certain limitations, as composite samples may obscure fine–scale environmental variation among individual plots.
4.2. Factors Influencing Species Diversity and Functional Diversity
Previous studies have reported that functional zones with high levels of PTEs often exhibit low bryophyte species diversity [17,42]. In this study, from the heavily polluted bottom to the relatively less polluted top of the mine pit, the Shannon–Wiener index, Simpson index, and Pielou evenness index were not entirely negatively correlated with the pollution level; instead, they exhibited a U–shaped pattern of variation, suggesting that the factors influencing bryophyte species diversity in the mine pit are more complex. In addition, the overall trend of species diversity in the studied mining pit contrasted with that observed in the Haolong sinkhole (the world’s third largest sinkhole) [43], a large–scale negative landform with a diameter of 809 m and a depth of 540 m. In the Haolong sinkhole, bryophyte diversity decreased with elevation from the bottom (grassland) through the middle (forest) to the top (agricultural area). This difference was attributed to the fact that during the formation of the sinkhole, habitat isolation contributed to increased bryophyte species diversity at its bottom. Moreover, the relatively enclosed and stable sinkhole environment, combined with reduced anthropogenic disturbance toward the bottom, generally supported greater species richness in lower sections [21]. Conversely, the mining pit exhibited increasingly harsh environmental conditions toward the bottom, resulting in diminished species richness in these areas. A study by Li et al. [22] on the factors influencing bryophyte distribution across five vertical gradients in Xiaozhai Tiankeng—the world’s largest sinkhole (626 m in diameter and 662 m deep)—found that light intensity was the most significant factor, followed by humidity, while temperature and anthropogenic disturbance had relatively minor effects. The discrepancy in diversity patterns between this study and the aforementioned sinkhole study is fundamentally attributable to differences in PTE pollution intensity and dominant driving factors. The mine pit in this study is a typical non–natural negative landform characterized by anthropogenic PTE pollution, where PTEs serve as the fundamental stressor, with significant pollution differences along the vertical gradient [Table S2]. To some extent, this drives a pattern of “higher pollution, lower diversity” (e.g., the diversity changes from the lower–middle part to the upper–middle part, and then to the top), which is consistent with the findings of Long [42] and Xu et al. [17]. In contrast, the Haolong sinkhole is a natural negative landform. Although certain PTE pollution exists there, the pollution level is considerably lower than that in the mine pit. Instead, microhabitat factors such as light, humidity, and habitat stability serve as the dominant driving factors. The enclosed and stable environment at the bottom of the sinkhole is more conducive to species coexistence, thereby presenting a pattern of “increasing diversity with increasing depth”. Nevertheless, as a funnel–shaped non–natural negative landform, microhabitats within the mine pit also partially shape the distribution pattern of bryophyte communities. Specifically, the observed departures of the Shannon–Wiener and Simpson indices from the anticipated negative correlation with pollution at the bottom and lower–middle part of the mine pit may plausibly result from microhabitat influences or the interplay between microhabitats and PTEs. Relevant research indicates that the detrimental impacts of PTEs on bryophytes can be classified as either direct or indirect [44]. The indirect effects are primarily realized through the environment surrounding the bryophyte community. For example, elevated PTE concentrations can induce biochemical dysregulation in sensitive bryophyte species, diminishing their acquisition of nutrients and energy, and consequently impeding their growth and development [45]. Field investigations revealed that although both the bottom and lower–middle part were dominated by lithophytic bryophyte communities, the bottom exhibited slightly lower rock exposure and slightly higher vegetation coverage than the lower–middle part, which enhanced water retention capacity and may have facilitated bryophyte survival and growth. Considering the above factors, the Shannon–Wiener and Simpson indices exhibited a “U”–shaped pattern that first decreased and then increased. The Pielou evenness index also showed a “U”–shaped response to the pollution gradient. At the most heavily polluted bottom and lower–middle part, strong environmental filtering allowed only a few pollution–tolerant taxa to survive, resulting in generally simple community species composition (particularly in the lower–middle part, which was dominated by a single dominant species), with relatively even species coverage distribution, thus leading to high evenness indices. As pollution pressure decreased, species richness increased in the upper–middle part, competition among taxa and differences in resource utilization intensified, and some species gradually became dominant, leading to pronounced differentiation in species coverage and a significant decline in the Pielou evenness index. At the top part, where pollution was the lowest, resource conditions were favorable, species composition was rich, and communities achieved stable coexistence through niche differentiation without absolutely dominant taxa. Consequently, the Pielou evenness index recovered and remained at a relatively high level.
Previous studies have shown that an increase in PTEs in topsoil significantly reduces the functional diversity (e.g., RaoQ and FDis) of bryophyte communities [20]. In this study, although PTE pollution was higher at the bottom than in the lower–middle part, the two habitats had a non–significant difference in species richness (Figure 3A). However, the lower–middle section exhibited a single–dominant–species community pattern, where the dominant species suppressed the niche occupancy of other species through intense competition, leading to a significantly lower degree of functional trait differentiation. Consequently, RaoQ and FDis in the lower–middle part were significantly lower than those at the bottom. These results indicate that PTE pollution is not the sole driver of changes in functional diversity; rather, community structure can lead to divergence in functional diversity under moderate pollution gradients. Integrating these influencing factors, both species diversity and functional diversity ultimately exhibited a “U”–shaped curve from the top to the bottom, declining initially before increasing. Although species diversity and functional diversity were closely linked and generally followed similar trends, they were not interchangeable [46]. This was because, compared with species diversity, functional diversity was more sensitive to environmental changes and served as a better indicator of changes in ecosystem functioning [47]. This is evidenced by alterations in the functional stability and resource use efficiency of bryophyte communities coping with PTE pollution stress within the mine pit. The “U”–shaped distribution of functional diversity from the top to the bottom of the pit, coupled with the functional trait convergence potentially resulting from the single–dominant–species community in the lower–middle part, reveals that different communities vary in their capacity to sustain ecosystem functions (e.g., resistance to disturbance). This indicates that functional diversity holds promise as a sensitive indicator of pollution stress and changes in community structure.
4.3. Mechanisms Linking Bryophyte Species, Traits, and Environment
Numerous studies in China have investigated bryophyte diversity in coal and manganese mining areas, revealing that the dominant families in these regions were similar, primarily Pottiaceae (and Bryaceae) [46,47]. Our survey of bryophytes in an MVT funnel–shaped Pb–Zn mining area also identified Pottiaceae, Bryaceae, and Brachytheciaceae as the dominant families, which aligned with previous findings. These widely distributed bryophyte families were reported to possess enhanced survival strategies and tolerance to extreme environmental conditions, such as intense drought and light exposure, which contributed to their notable adaptability to mining–affected habitats [18,48]. Notably, species exclusively distributed at the top of the mine pit accounted for the majority in that habitat, reflecting distinct species preferences for particular environmental conditions [49].
Along the vertical gradient of the mine pit, the bryophyte community composition exhibited pronounced gradient differentiation. At the bottom and lower–middle part, where pollution intensity was highest, the bryophyte communities were compositionally simple and dominated by highly pollution–tolerant Pottiaceae, followed by Bryaceae. As pollution intensity progressively decreased from the upper–middle part to the top, habitat stress gradually alleviated, and various bryophyte taxa, including Brachytheciaceae, Thuidiaceae, and Dicranaceae, successively colonized the communities, leading to increasingly complex community composition [Table S1]. This indicates that within the study area, simpler bryophyte community structure corresponds to more severe pollution and harsher habitat conditions, whereas more complex community structure corresponds to lighter pollution levels. This finding is consistent with the conclusions of Liu et al. [50] regarding bryophyte ecological responses in a mercury mining area.
PTEs can influence bryophyte community assembly at both the physiological–metabolic and habitat–regulation levels. At the physiological level, PTEs directly impair the structural integrity of bryophyte tissues, disrupt water metabolism pathways, inhibit transpiration [51], and alter the structure and properties of chloroplast proteins, thereby suppressing photosynthesis [52]. At the habitat level, PTEs accumulated in soils progressively deteriorate substrate physicochemical properties, impede the growth of tall vegetation, reduce regional vegetation coverage, and increase light intensity, thereby intensifying habitat aridification and generating a combined stress environment of high PTEs, intense light, and drought [20,53]. In response to such combined stresses, different bryophyte species have evolved distinct species–specific strategies involving both morphological adaptation and physiological detoxification to counteract PTE toxicity [19].
In the present study, the highly contaminated bottom and lower–middle part of the mine pit were characterized by depauperate vegetation, high light intensity, and low water retention capacity. Bryophytes in these sections predominantly grew attached to thin soils overlying rock surfaces. Most key species in these sections (such as D. fallax, D. rigidulus, D. nigrescens, etc.) exhibited traits including entire leaf margins, midribs extending to or slightly exceeding the leaf tip, and leaf cell papillae (warts) [54]. These traits are not exclusively adaptations to xeric conditions but also represent functional features responsive to PTE stress. The warts on leaf cells serve to reflect intense light and reduce water loss while simultaneously increasing capillary spaces on the leaf surface, thereby facilitating water absorption [55,56]. Furthermore, warts are specialized protrusions on the surface of bryophyte leaf cells formed by localized thickening of the cell wall. To a certain extent, they may enlarge the adsorptive surface area of the leaf, enabling heavy metal ions to preferentially bind to and be deposited on the leaf cell wall and wart through physical retention, thereby reducing the rate of ion permeation into the protoplast [57,58]. In line with findings by Xu et al. [20], species with warty and curled leaves occurred primarily in areas with high PTE concentrations (Figure 5A,B), while such species were less frequent in low–concentration areas (e.g., Figure 5D). Additionally, several studies reported that in lithophytic Pottiaceae, the midrib extending to or beyond the leaf tip into a hairpoint can extend and enlarge the leaf–air contact area, trap atmospheric water molecules, and maintain normal photosynthetic physiology under stress conditions [59,60,61]. The curled leaf morphology promotes the detachment of PTEs from the leaf surface, thereby minimizing leaf–particulate pollutant interactions and reducing PTE accumulation. This trait response pattern aligns with the stress response of bryophytes in mining areas documented by Xu et al. [20]. The key species D. fallax and D. rigidulus, which exhibit the aforementioned traits, co–occur at the bottom and lower–middle part, enabling their long–term adaptation to this highly polluted and adverse environment.
In the upper–middle part of the present study, the bryophyte community inhabited a soil substrate, where herbaceous plants and sparse low shrubs gradually became established. The dominance of the highly pollution–tolerant curled–leaf species D. fallax exhibited a sustained decline, culminating in its complete exclusion from the dominant assemblage at the least polluted pit top. Concomitantly, enhanced habitat suitability facilitated the emergence of the flat–leaved species A. filiforme. At the top, where shrubland vegetation developed and both environmental contamination and aridity significantly diminished, species such as P. zierii and T. assimile exhibited traits—including spreading leaves and the disappearance of midribs in the upper–middle portions of the leaves—that were well adapted to these more favorable conditions. Species such as P. zierii and T. assimile, possessing flat leaves and midribs that are reduced or absent in the middle to upper leaf portions, are well adapted to this environment. These species possess potential bioindication value for pollution monitoring in this Pb–Zn mining area.
Owing to sample size limitations in certain data analyses conducted in this study (e.g., RLQ analysis), the generalizability of the conclusions remains to be substantiated through investigations incorporating additional mine pits and expanded sample sizes. Future research should integrate physiological and molecular indicators to further elucidate the mechanisms underlying bryophyte pollution tolerance and to evaluate their potential applicability in the ecological restoration of mining areas.
5. Conclusions
Within the Maomaochang mine pit in northwestern Guizhou, a vertical pollution gradient is observed with PTE contamination gradually declined from the pit bottom to the top. Significant positive correlations are observed between PTE contents in bryophytes and their underlying substrates. Accordingly, bryophytes can serve as potential bioindicators for PTE pollution in this mine pit. Both species diversity (Shannon–Wiener, Simpson, and Pielou evenness indices) and functional diversity (RaoQ and FDis) exhibited significant “U”–shaped distributions along the pollution gradient. The lower–middle part, where a single dominant species induced functional trait convergence, constituted a low–diversity zone. This diversity distribution pattern results from the combined effects of PTE stress and microenvironmental factors (e.g., light and humidity). Nevertheless, the present study confirms a correlation between diversity distribution and PTE pollution. Key bryophyte species and their adaptive traits varied across gradients: in high–pollution zones such as the pit bottom, the key species D. fallax possessed warty and curled leaves, whereas in the low–pollution top zone, the key species P. zierii exhibited smooth and flat leaves. Such species can act as potential indicators to monitor environmental changes in this abandoned Maomaochang MVT lead–zinc mine pit with decades of natural reclamation.
Supplementary Materials
The following supporting information can be downloaded at: https://www.mdpi.com/article/10.3390/environments13060299/s1, Table S1: Family, genus, and species statistics; Table S2: Differences in PTEs among the four gradients for bryophytes and soil separately; Table S3: Species–relative cover matrix; Table S4: Species–trait matrix; Table S5: PTE concentrations in bryophytes and soil.
Author Contributions
Conceptualization, H.L., Z.Z. and Z.W.; methodology, H.L., Z.Z. and Z.W.; formal analysis, H.L.; investigation, H.L. and Z.Z.; resources, Z.Z. and Z.W.; writing—original draft preparation, H.L.; writing—review and editing, H.L., Z.Z. and Z.W.; visualization, H.L.; supervision, Z.Z. and Z.W.; funding acquisition, Z.Z. and Z.W. All authors have read and agreed to the published version of the manuscript.
Funding
This research was funded by the National Natural Science Foundation of China and the Guizhou Provincial Department of Science and Technology, grant number 31960044, 31760043 and Qiankehe [2017] 5742. The APC received no external funding.
Data Availability Statement
The original contributions presented in this study are included in the Supplementary Materials. Further inquiries can be directed to the corresponding authors.
Acknowledgments
This work was supported by the National Natural Science Foundation of China (No. 31960044, No.31760043) and the Guizhou Provincial Department of Science and Technology (No. Qiankehe [2017] 5742). The authors acknowledge Sheng Xu, Dan Lu, Qiang Tian, Xiaohuan Zhou, Minghui Chen, Jing Huang, and Min Cao for their assistance with field surveys and laboratory work.
Conflicts of Interest
The authors declare no conflicts of interest.
Abbreviations
The following abbreviations are used in this manuscript:
| MVT | Mississippi Valley–Type |
| PTEs | Potentially toxic elements |
| RaoQ | Rao’s quadratic entropy index |
| FDis | Functional dispersion index |
| B | Bottom |
| LMP | Lower–middle part |
| UMP | Upper–middle part |
| T | Top |
Appendix A
Figure A1.
Diagnostics of quadratic polynomial models for bryophyte species diversity. (A) Shannon–Wiener index. (B) Simpson index. (C) Pielou evenness index.
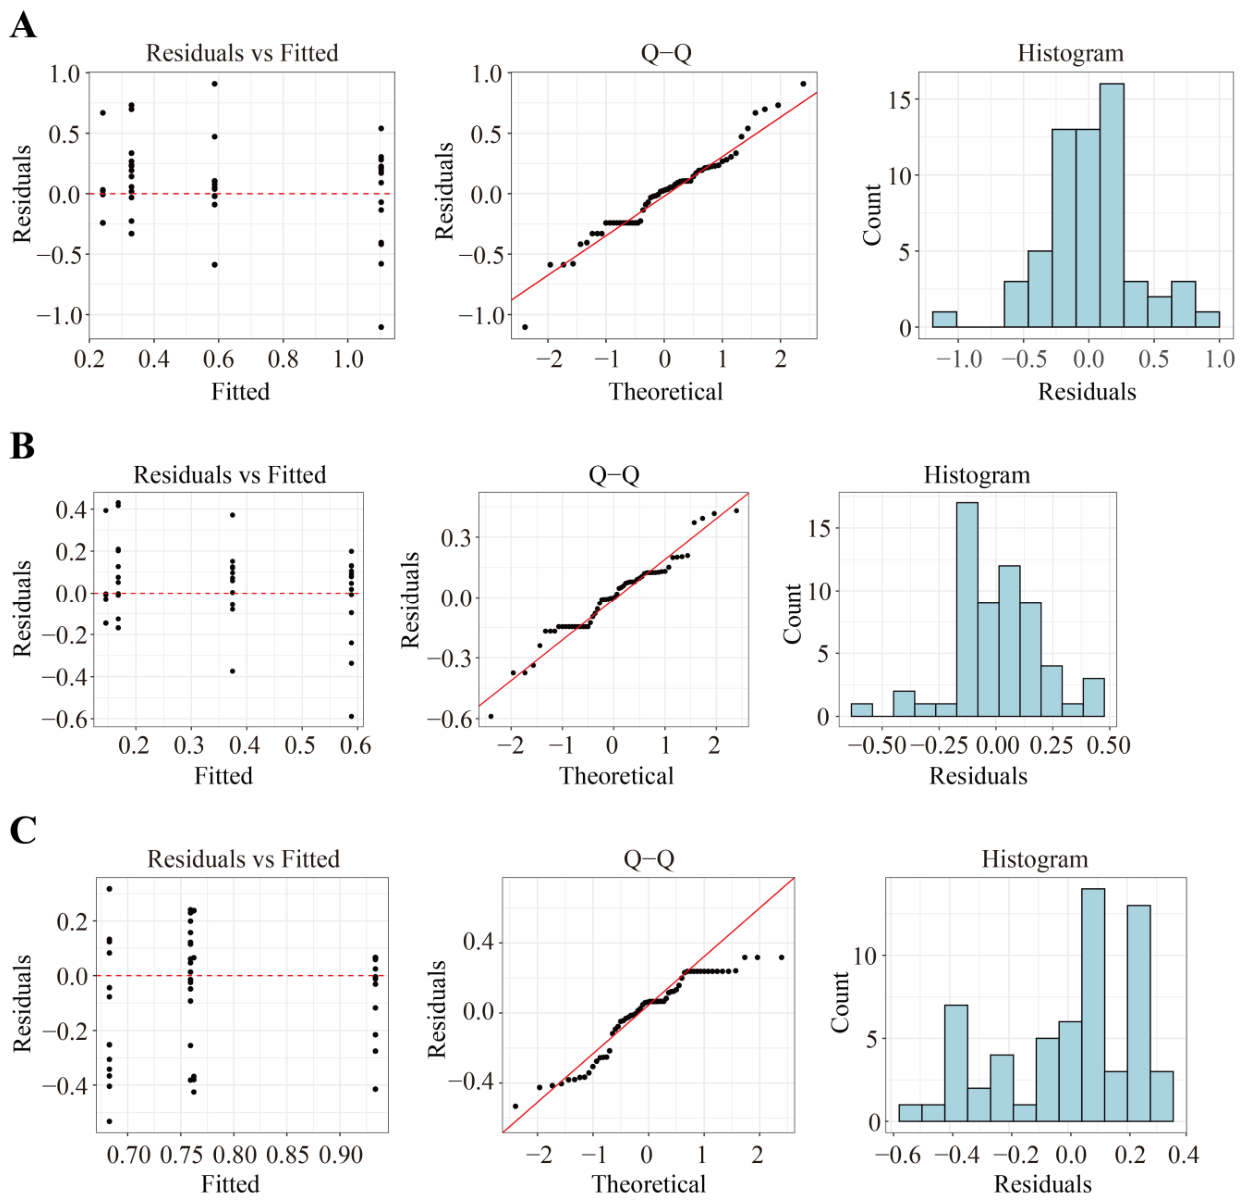
Table A1.
Permutation test and effect size of quadratic polynomial models of species diversity.
Figure A2.
Diagnostics of quadratic polynomial models for bryophyte functional diversity. (A) RaoQ. (B) FDis.
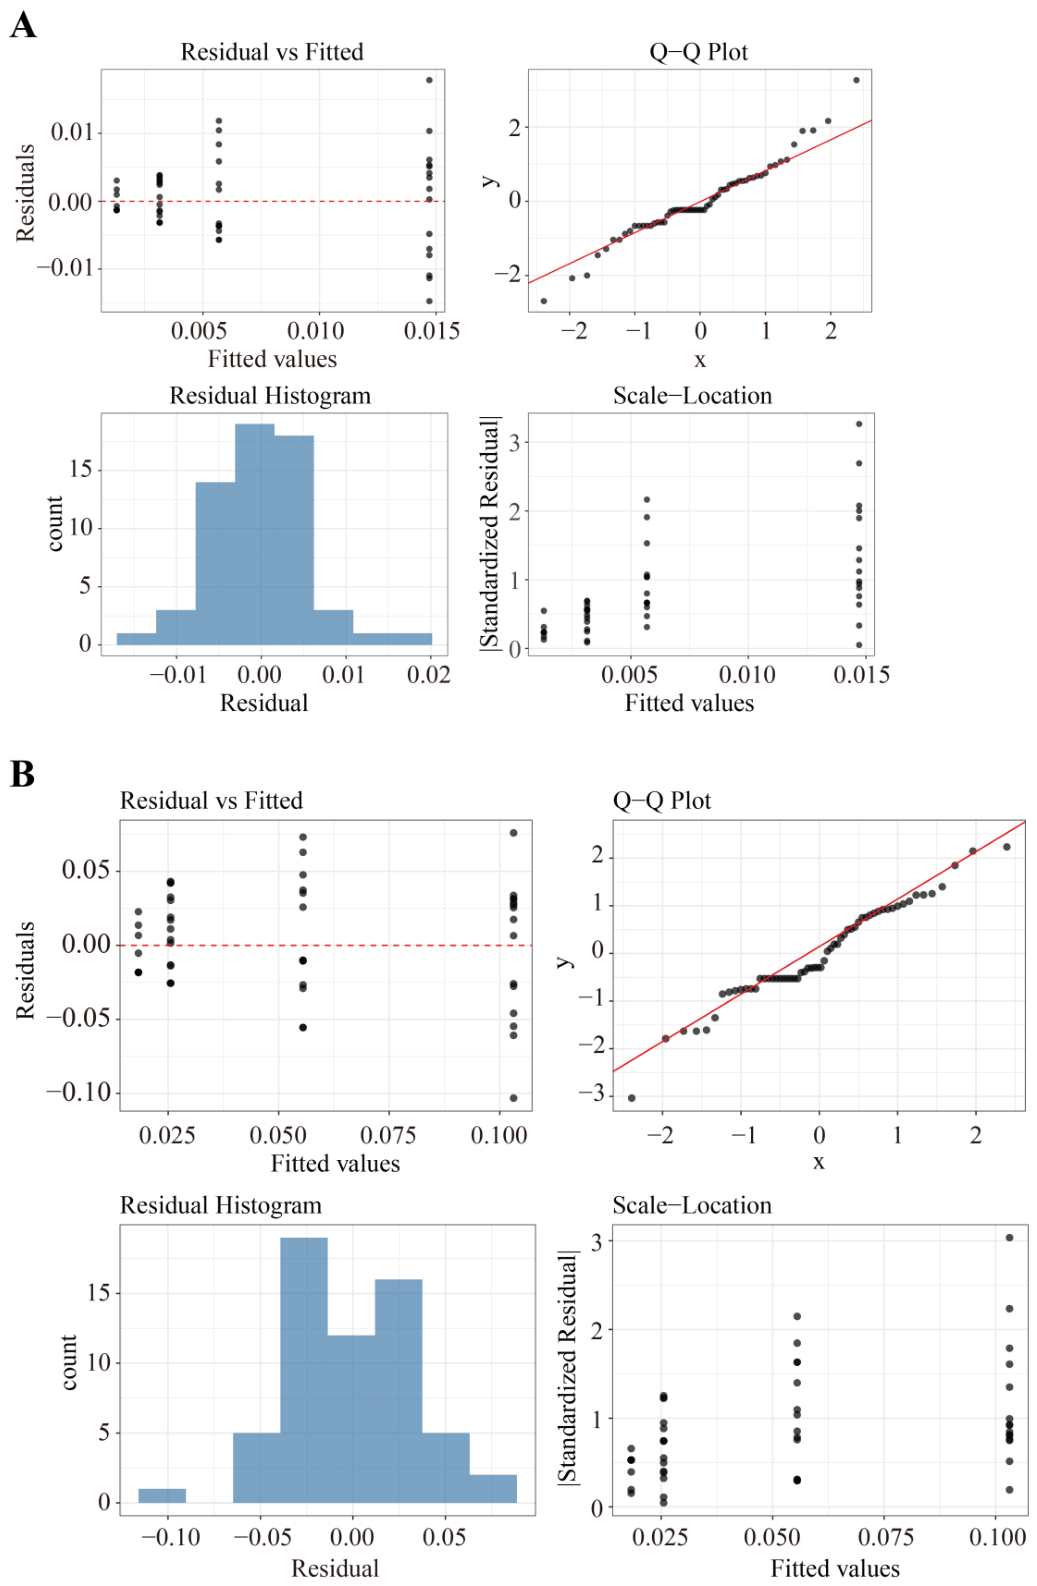
Table A2.
Permutation test and effect size of quadratic polynomial models of functional diversity.
References
- Balabanova, B.; Stafilov, T.; Sajn, R.; Andonovska, K.B. Quantitative assessment of metal elements using moss species as biomonitors in downwind area of lead-zinc mine. J. Environ. Sci. Health Part A Toxic/Hazard. Subst. Environ. Eng. 2017, 52, 290–301. [Google Scholar] [CrossRef] [Scilit] [PubMed]
- Koz, B. Energy-dispersive X-ray fluorescence analysis of moss and soil from abandoned mining of Pb-Zn ores. Environ. Monit. Assess. 2014, 186, 5315–5326. [Google Scholar] [CrossRef] [Scilit]
- Jin, Z.G.; Huang, Z.L.; Zheng, M.H.; Liu, L.; Zhang, L.W.; Zeng, D.G.; Tang, Y.Y.; Zhou, J.X. Geological characteristics and ore-hosting mechanism of the carbonate-hosted type Lead-Zinc deposits in Guizhou Province, China. Acta Mineral. Sin. 2020, 40, 346–355. [Google Scholar] [CrossRef]
- Zhang, C.Q.; Rui, Z.Y.; Chen, Y.C.; Wang, D.H.; Chen, Z.H.; Lou, D.B. The main successive strategic bases of resources for Pb-Zn deposits in China. Geol. China 2013, 40, 248–272. [Google Scholar]
- Huang, C.Y.; Guo, Z.H.; Li, T.S.; Xu, R.; Peng, C.; Gao, Z.L.; Zhong, L.J. Source identification and migration fate of metal (loid)s in soil and groundwater from an abandoned Pb/Zn mine. Sci. Total Environ. 2023, 895, 165037. [Google Scholar] [CrossRef] [Scilit]
- Žibret, G.; Čeplak, B. Distribution of Pb, Zn and Cd in stream and alluvial sediments in the area with past Zn smelting operations. Sci. Rep. 2021, 11, 17629. [Google Scholar] [CrossRef] [Scilit]
- Zhang, C.Q.; Yu, J.J.; Mao, J.W.; Rui, Z.Y. Advances in the study of Mississippi Valley-type deposits. Miner. Depos. 2009, 28, 195–210. [Google Scholar] [CrossRef]
- Liu, Y.C.; Hou, Z.Q.; Yang, Z.S.; Tian, S.H.; Song, Y.C.; Yang, Z.M.; Wang, Z.L.; Li, Z. Some insights and advances in study of Mississippi Valley-type (MVT) Lead-Zinc deposits. Miner. Depos. 2008, 27, 253–264. [Google Scholar] [CrossRef]
- Leach, D.L.; Sangster, D.F. Mississippi Valley-type Zinc-Lead deposits. Geol. Assoc. Can. Spec. Pap. 1993, 40, 289–314. [Google Scholar]
- Jiang, Y.B.; Fan, M.; Hu, R.G.; Zhao, J.S.; Wu, Y.P. Mosses are better than leaves of vascular plants in monitoring atmospheric heavy metal pollution in urban areas. Int. J. Environ. Res. Public Health 2018, 15, 1105. [Google Scholar] [CrossRef] [Scilit]
- Patiño, J.; Vanderpoorten, A. Bryophyte biogeography. Crit. Rev. Plant Sci. 2018, 37, 175–209. [Google Scholar] [CrossRef] [Scilit]
- Wang, S.Q.; Zhang, Z.H.; Wang, Z.H. Bryophyte communities as biomonitors of environmental factors in the Goujiang karst bauxite, southwestern China. Sci. Total Environ. 2015, 538, 270–278. [Google Scholar] [CrossRef] [Scilit] [PubMed]
- Chen, X.; Liu, X.L.; Tang, T. Advances of bryophytes in response to heavy metal stress. BioteChinaol. Bull. 2020, 36, 191–199. [Google Scholar] [CrossRef]
- Figueira, R.; Sérgio, C.; Sousa, A.J. Distribution of trace metals in moss biomonitors and assessment of contamination sources in portugal. Environ. Pollut. 2002, 118, 153–163. [Google Scholar] [CrossRef] [Scilit]
- Xu, S.; Zhang, Z.H.; Wu, Q.M.; Wu, J. Indication of Bryum argenteum for Heavy Metal Pollution in Carbonate Manganese Ore Areas. Environ. Monit. China 2022, 38, 137–145. [Google Scholar] [CrossRef]
- Ji, Y.; Zhang, Z.H. Biodiversity of bryophytes and their characteristics of ecological distribution in the second Lindai karst bauxite area. Carsol. Sin. 2015, 34, 599–606. [Google Scholar]
- Xu, S.; Zhang, Z.H.; Wang, Z.H. Effects of heavy metals on moss diversity and analysis of moss indicator species in Nancha manganese mining area, Southwestern China. Glob. Ecol. Conserv. 2021, 28, e01665. [Google Scholar] [CrossRef] [Scilit]
- Zuo, S.Y.; Wang, Z.H.; Zhang, Z.H. Bryophyte species diversity and its indicative roles in monitoring heavy metals pollution in Zhangjiawanzi gold deposit area of Guizhou Province, Southwest China. Chin. J. Ecol. 2013, 32, 412–417. [Google Scholar] [CrossRef]
- Han, Y.; Kou, J.; Jiang, B.C.; Li, J.P.; Liu, C.C.; Lei, S.G.; Xiao, H.X.; Feng, C. Bryophytes adapt to open-pit coal mine environments by changing their functional traits in response to heavy metal-induced soil environmental changes. J. Hazard. Mater. 2025, 482, 136613. [Google Scholar] [CrossRef] [Scilit]
- Xu, S.; Zhang, Z.H.; Wang, Z.H. Potentially toxic elements have adverse effects on moss communities in the manganese mines of Southern China. Environ. Pollut. 2022, 305, 119255. [Google Scholar] [CrossRef] [Scilit]
- Li, C.; Zhang, Z.; Wang, Z.; Wu, Q. Effects of environmental factors and heavy metals on the vertical distribution of bryophytes in a sinkhole environment. Plant Biol. 2020, 22, 822–831. [Google Scholar] [CrossRef] [Scilit]
- Li, X.F.; Zhang, Z.H.; Wang, Z.H. Distribution of bryophyte communities along the vertical gradient of oversize sinkhole of Xiaozhai Tiankeng of Chongqing city, China. Ecol. Sci. 2020, 39, 18–24. [Google Scholar] [CrossRef]
- Zhou, J.X.; Xiang, Z.Z.; Zhou, M.F.; Feng, Y.X.; Luo, K.; Huang, Z.L.; Wu, T. The giant Upper Yangtze Pb-Zn province in SW China: Reviews, new advances and a new genetic model. J. Asian Earth Sci. 2018, 154, 280–315. [Google Scholar] [CrossRef] [Scilit]
- Wu, Z.Q. An inquiry-based practice on the experiment “Investigating the population density of a dicotyledonous plant in grassland using quadrat sampling”. Middle Sch. Biol. 2016, 32, 76–77. [Google Scholar]
- Lu, D.; Zhang, Z.H.; Wang, Z.H. Heavy metal uptake by bryophytes and vascular plants in a manganese carbonate slag field, China. Plant Biol. 2022, 24, 380–386. [Google Scholar] [CrossRef] [Scilit]
- Gao, C. Dicranaceae. In Flora Bryophytarum Sinicorum, 1st ed.; Editorial Committee of the Flora of Chinese Spore Plants; Chinese Academy of Sciences, Ed.; Science Press: Beijing, China, 1994; Volume 1, pp. 112–189. [Google Scholar]
- Li, X.J. Bryaceae. In Flora Bryophytarum Sinicorum, 1st ed.; Editorial Committee of the Flora of Chinese Spore Plants; Chinese Academy of Sciences, Ed.; Science Press: Beijing, China, 2006; Volume 4, pp. 1–111. [Google Scholar]
- Wu, P.C. Thuidiaceae. In Flora Bryophytarum Sinicorum, 1st ed.; Editorial Committee of the Flora of Chinese Spore Plants; Chinese Academy of Sciences, Ed.; Science Press: Beijing, China, 2002; Volume 6, pp. 191–270. [Google Scholar]
- Hu, R.L.; Wang, Y.F. Brachytheciaceae. In Flora Bryophytarum Sinicorum, 1st ed.; Editorial Committee of the Flora of Chinese Spore Plants; Chinese Academy of Sciences, Ed.; Science Press: Beijing, China, 2005; Volume 7, pp. 82–182. [Google Scholar]
- Wu, P.C.; Jia, Y. Polytrichaceae. In Flora Bryophytarum Sinicorum, 1st ed.; Editorial Committee of the Flora of Chinese Spore Plants; Chinese Academy of Sciences, Ed.; Science Press: Beijing, China, 2004; Volume 8, pp. 368–446. [Google Scholar]
- Li, X.J.; Crosby, M.R. Pottiaceae. In Moss Flora of China; Si, H., Ed.; Science Press: New York, NY, USA, 2001; Volume 2, pp. 114–249. (In English) [Google Scholar]
- Deben, S.; Fernandez, J.A.; Carballeira, A.; Aboal, J.R. Using devitalized moss for active biomonitoring of water pollution. Environ. Pollut. 2016, 210, 315–322. [Google Scholar] [CrossRef] [Scilit]
- Liu, R.; Zhang, Z.H.; Shen, J.C.; Wang, Z.H. Community characteristics of bryophyte in Karst caves and its effect on heavy metal pollution: A case study of Zhijin Cave, Guizhou Province. Biodivers. Sci. 2018, 26, 1277–1288. [Google Scholar] [CrossRef] [Scilit]
- China National Environmental Monitoring Centre. Background Values of Soil Elements in China; China Environmental Science Press: Beijing, China, 1990; pp. 1–501. [Google Scholar]
- Hu, H.; Tian, G.L.; Wu, Z.; Xia, Q. Cross-regional ecological compensation under the composite index of water quality and quantity: A case study of the Yellow River Basin. Environ. Res. 2023, 238, 117152. [Google Scholar] [CrossRef] [Scilit]
- Botta-Dukát, Z. Rao’s quadratic entropy as a measure of functional diversity based on multiple traits. Biodivers. Sci. 2005, 16, 533–540. [Google Scholar] [CrossRef]
- Mouchet, M.A.; Villéger, S.; Mason, N.W.H.; Mouillot, D. Functional diversity measures: An overview of their redundancy and their ability to discriminate community assembly rules. Funct. Ecol. 2010, 24, 867–876. [Google Scholar] [CrossRef] [Scilit]
- Laliberté, E.; Legendre, P. A distance-based framework for measuring functional diversity from multiple traits. Ecology 2010, 91, 299–305. [Google Scholar] [CrossRef] [Scilit]
- Dolédec, S.; Chessel, D.; Ter Braak, C.J.F.; Champely, S. Matching species traits to environmental variables: A new three-table ordination method. Environ. Ecol. Stat. 1996, 3, 143–166. [Google Scholar] [CrossRef] [Scilit]
- Chudaev, O.; Myagkaya, I.; Gustaytis, M.; Kirichenko, I.; Saryg-ool, B.O.; Lazareva, E. Acid Mine Drainage Contamination of the Ur Impoundment: Environmental Geochemistry. E3S Web Conf. 2019, 98, 09021. [Google Scholar] [CrossRef] [Scilit]
- Wu, B.; Li, L.L.; Guo, S.H.; Li, Y. Source apportionment of heavy metals in the soil at the regional scale based on soil-forming processes. J. Hazard. Mater. 2023, 448, 130910. [Google Scholar] [CrossRef] [Scilit]
- Long, C.B.; Zhang, Z.H. Diversity of the bryophytes and their function in monitoring metal contamination in the karst bauxite area in Guangxi. J. Saf. Environ. 2016, 16, 358–363. [Google Scholar] [CrossRef]
- Shui, W.; Chen, Y.P.; Wang, Y.W.; Su, Z.A.; Zhang, S. Origination, study progress and prospect of karst tiankeng research in China. Acta Geogr. Sin. 2015, 70, 431–446. [Google Scholar]
- Zhu, Y.Q.; Feng, L.L.; Zhao, Z.F.; Jolifan, A.; Liu, L.P.; Feruza, T. Research progress of bryophytes on heavy metal enrichment and stress response and pollution monitoring. Chin. Bull. Life Sci. 2024, 36, 1552–1561. [Google Scholar] [CrossRef]
- Deng, B.; Zhao, J.; Zhang, Y.; Fan, Y.; Tian, S. Exogenous ATP triggers antioxidant defense system and alleviates Cd toxicity in maize seedlings. Ecotoxicol. Environ. Saf. 2023, 256, 114898. [Google Scholar] [CrossRef] [Scilit]
- Liu, G.H.; Wu, Y.G.; Fu, T.L. Distribution characteristics of typical heavy metals in bryophyte and soil from rich sulphur and high arsenic coal mining area in Guizhou. Southwest China J. Agric. Sci. 2016, 29, 2201–2205. [Google Scholar] [CrossRef]
- Ren, J.; Liu, F.; Zhu, J.; Luo, Y.; Li, S.; Zhong, X.W. Diversity of the bryophytes and heavy metal pollution monitoring in manganese ore waste area. J. Saf. Environ. 2020, 20, 2398–2407. [Google Scholar] [CrossRef]
- Giudice, R.L.; Mazimpaka, V.; Lara, F. The urban bryophyte flora of the city of enna (Sicily, Italy). Nova Hedwig. 1997, 64, 249–265. [Google Scholar] [CrossRef] [Scilit]
- Tetetla-Rangel, E.; Dupuy, J.M.; Hernández-Stefanoni, J.L.; Hoekstra, P.H. Patterns and correlates of plant diversity differ between common and rare species in a neotropical dry forest. Biodivers. Conserv. 2017, 26, 1705–1721. [Google Scholar] [CrossRef] [Scilit]
- Liu, R.X.; Wang, Z.H.; Zhang, Z.H. Ecological monitoring of bryophytes for mercury pollution in danzhai mercury mine area, guizhou province, China. Acta Ecol. Sin. 2011, 31, 1558–1566. [Google Scholar] [CrossRef]
- Meers, E.; Van Slycken, S.; Adriaensen, K.; Ruttens, A.; Vangronsveld, J.; Laing, G.D.; Witters, N.; Thewys, T.; Tack, F.M. The use of bio-energy crops (Zea mays) for ‘phytoattenuation’ of heavy metals on moderately contaminated soils: A field experiment. Chemosphere 2010, 78, 35–41. [Google Scholar] [CrossRef] [Scilit]
- Hattab, S.; Dridi, B.; Chouba, L.; Kheder, M.B.; Bousetta, H. Photosynthesis and growth responses of pea pisum sativum l. under heavy metals stress. J. Environ. Sci. 2009, 21, 1552–1556. [Google Scholar] [CrossRef] [Scilit]
- Gradstein, S.R.; Sporn, S.G. Land-use change and epiphytic bryophyte diversity in the Tropics. Nova Hedwig. 2010, 138, 311–323. [Google Scholar]
- Zhang, Y.M.; Cao, T.; Pan, B.R. A Review on the Studies of Bryophyte Ecology in Arid and Semiarid Areas. Acta Ecol. Sin. 2002, 22, 1129–1134. [Google Scholar] [CrossRef]
- Crandall-Stotler, B.J.; Bozzola, J.J. Ontogeny, structure and function of leaf cell papillae in the moss Andreaeobryum macrosporum. Am. J. Bot. 1991, 78, 4–5. [Google Scholar]
- Proctor, M.C.F. Structure and ecological adaptation. In Experimental Biology of Bryophytes; Dyer, A.F., Duckett, J.G., Eds.; Academic Press: London, UK, 1984; pp. 9–37. [Google Scholar]
- Basile, A.; Giordano, S.; Cafiero, G.; Spagnuolo, V.; Castaldo-Cobianchi, R. Tissue and cell localization of experimentally-supplied lead in funaria hygrometrica hedw. using x-ray sem and tem microanalysis. J. Bryol. 1994, 18, 69–81. [Google Scholar] [CrossRef] [Scilit]
- Kou, J.; Bai, X.L.; Feng, C.; Ren, D.M.; Zhang, L.; Fu, Y. Light Microscope Observation of Leaf Papillae and Mammillae in Pottiaceae and their Taxonomic Sense. Acta Bot. Boreali-Occident. Sin. 2012, 32, 2224–2231. [Google Scholar]
- Wu, Y.H.; Huang, G.H.; Gao, Q.; Cao, T. Research progress on the response and adaptability of bryophytes to environmental changes. Chin. J. Appl. Ecol. 2001, 12, 943–946. [Google Scholar] [CrossRef]
- Wang, H.; Aifeire, A. Micromorphological Structure of Leaf Apex of Twelve Species of Bryophytes from the Source Area of the Urumqi River. Acta Bot. Boreali-Occident. Sin. 2016, 36, 323–331. [Google Scholar]
- Zeng, J.; Wu, Y.H.; Wang, H.; Aifeire, A.; Chen, Q.Y. Micromorphological Structure of Leaf Apex of Ten Species of Bryophytes from No. 1 Glacier of Tianshan Mountains. Bull. Bot. Res. 2015, 35, 672–678. [Google Scholar] [CrossRef]

Disclaimer/Publisher’s Note: The statements, opinions and data contained in all publications are solely those of the individual author(s) and contributor(s) and not of MDPI and/or the editor(s). MDPI and/or the editor(s) disclaim responsibility for any injury to people or property resulting from any ideas, methods, instructions or products referred to in the content. |
© 2026 by the authors. Licensee MDPI, Basel, Switzerland. This article is an open access article distributed under the terms and conditions of the Creative Commons Attribution (CC BY) license.