Article

Why Marginal Gains Matter: Reducing Construction Waste to Cut Costs and Carbon in UK Housebuilding

1
Sanctuary Housing Association, Worcester WR1 3ZQ, UK
2
Lincoln School of Design and Architecture, University of Lincoln, Lincoln LN6 7TS, UK
*
Authors to whom correspondence should be addressed.
Environments 2026, 13(6), 290; https://doi.org/10.3390/environments13060290
Submission received: 15 April 2026 / Revised: 14 May 2026 / Accepted: 20 May 2026 / Published: 24 May 2026

Abstract

Building cost-effective homes that comply with stringent environmental regulations remains a significant challenge for the UK housebuilding sector, particularly for social housing providers. In the context of net zero targets and reducing embodied carbon, this study examines opportunities to minimise material waste and associated impacts. Using an inductive mixed-methods approach, the research began with a literature review to establish baseline waste rates across key material streams. It then analysed material usage data from three completed housing developments, comparing estimated quantities with actual orders and spend to identify discrepancies between assumptions and real-world outcomes. To validate these findings, a controlled case study tracked the construction of a single four-bedroom home, enabling direct measurement of waste rates and assessment of cost and carbon implications at unit level. Results highlight a series of marginal gains achievable through improved estimating and procurement practices, which collectively offer potential for significant financial savings and reductions in embodied carbon when scaled nationally. For social housing providers, these efficiencies could lower build costs, support sustainability goals, and create opportunities to reinvest in additional housing delivery.

1. Introduction

In 2013, as part of a joint strategy between government and industry, a vision for “Construction 2025” [1] was presented, promising lower costs, reduced emissions, and faster delivery. A decade later, however, a study [2] published in 2023 investigating the barriers to this strategy concluded that none of these targets were on course to be met by 2025.
In response to what Dziekonski et al. [2] characterise as the industry’s “hermetic” condition, this paper seeks to identify and examine marginal opportunities for improved efficiency and reduced environmental impact in the delivery of new-build social housing. By identifying a series of marginal gains across a small range of material waste streams, the study focuses on the potential for cumulative betterment, highlighting how multiple incremental improvements in waste reduction could lead to substantial savings in cost and carbon overall.
At a time when reviving growth in UK housebuilding while managing costs and emissions is critical, this paper situates material waste reduction as a key lever for achieving these goals. It argues that improving resource efficiency not only supports net zero targets but also offers measurable financial benefits, creating opportunities for reinvestment in additional housing delivery.
In developing this position, the paper examines the implications of inconsistent and arbitrary waste rates used across the industry. It argues that both the lack of standardisation and reliance on generic default rates contribute to inaccurate assumptions, increased waste, and underestimated carbon impacts. This latter issue is particularly pertinent as the industry moves toward more rigorous whole life carbon assessments, where waste is at risk of being significantly underestimated. To address these challenges, the study proposes the development of estimating feedback loops—process mechanisms that enable learning from actual project data to inform future resource planning, improve material efficiency, and support more accurate measurement of embodied impacts.
In conclusion, the findings reveal how marginal gains in reducing material waste within UK housebuilding could deliver cumulative benefits. Across the three retrospective housing developments analysed, the cumulative cost of excess material represented, on average, around 1% of the build cost per home. This figure is not intended as a sector-wide benchmark but as an indication of the scale of potential savings observable within the specific projects examined. For social housing providers, when applied at programme level, such potential efficiencies could reduce build costs and carbon emissions while creating opportunities to reinvest in further housing delivery—potentially unlocking additional rental revenue and supporting broader sustainability goals.

2. Materials and Methods

To provide a clear and practical framework for deriving findings within a focused evaluation context [3], the study adopted an inductive mixed methods approach to examine the scale and impact of construction waste in UK housebuilding. This reflects a necessity led, bricolage approach to inquiry, in which methodological choices evolve in response to the constraints and opportunities of real-world research settings [4].
As such, the study began with a literature review to establish the empirical foundation and identify commonly reported waste rates across key material streams. Building on this foundation, the research analysed material usage across three completed housing developments, comparing estimated quantities with actual orders and spend data. This enabled a comparison between real world outcomes and assumptions found in the literature, highlighting opportunities for improved measurement and efficiency.
To further test the findings, a controlled study was conducted on a live construction site, tracking the build of a single four-bedroom affordable home from foundation stage to final fit out. This allowed for direct observation and quantification of waste rates, as well as the associated cost and carbon impacts of excess waste at the unit level.
  • Scope of waste examined
This study focuses specifically on measurable, physical construction waste rather than process- or time-based forms of waste. While operational inefficiencies and workflow disruptions are recognised within lean construction theory as important contributors to overall project waste, they fall outside the scope of this research. The decision to prioritise physical materials reflects the study’s emphasis on embodied carbon: unlike process waste, physical products have quantifiable A1–A3 carbon factors, enabling robust calculation of the environmental impact of excess consumption. This boundary ensures methodological clarity and allows the analysis to concentrate on waste streams with directly measurable cost and carbon implications.

2.1. Literature Review

  • The waste impact of housebuilding
In the UK, reducing construction waste has been a major concern among government bodies, industry stakeholders, and the academic community for more than a decade [5]. According to the latest UK Government datasets (published in 2025 and reporting 2020 figures [6]), 61% of all waste generated nationally originated from Construction and Demolition Waste (CDE), making it the single largest waste category. Numerous legislative measures—such as The Waste (England and Wales) Regulations 2011 [7] and The Controlled Waste (England and Wales) Regulations 2012 [8]—alongside financial instruments including landfill tax and Extended Producer Responsibility, have been introduced to strengthen waste segregation, improve recycling rates, and increase accountability. Nevertheless, in the construction and maintenance of the built environment, including the construction of homes, the industry continues to consume the greatest volume of material resources and generate the highest tonnage of waste [9].
To appreciate the scale of this challenge, it is useful to consider the global context. In the United States, construction and demolition (C&D) waste accounts for approximately 67% (534 million tons) of all solid waste [10]. In the European Union, construction activities generate over 35% of total waste [11]; in Australia, C&D waste represents 31% of all waste produced [12]; and in newly industrialised countries (NICs) such as Brazil—where economic growth has intensified construction activities—data published in 2021 by ABRELPE (Brazilian Association of Public Cleaning and Special Waste Companies), cited in Pinheiro Martins (2025) [13], indicates that C&D waste accounts for up to 52% of total waste collected (24.5 million tons per year) in one region. These statistics highlight that construction waste is a universal sustainable development issue, not confined to the UK, and underscores the need for strategies that reduce intensive resource use and waste generation across the built environment.
However, when it comes to housebuilding specifically, research into the waste impacts of traditional methods is limited. Much of the existing literature focuses on construction waste in general or on the benefits of modular construction (see Agha et al. (2021) [14], Loizou et al. (2021) [15] and Chen, C (2023) [16]), which has received considerable attention for its potential to reduce material waste compared to conventional brick-and-block approaches. This emphasis leaves a gap in understanding the true waste burden of traditional housebuilding and the interventions needed to address it.
Despite the limited evidence base, a recent national study of waste reporting conducted by QFlow in 2023 [17] provides a useful indication of scale. Examining 33 UK residential projects—with an average construction value of £96.8 million—the study found an average waste intensity of 111.35 tonnes per £ million of construction value. Although this metric cannot be directly applied to government spending on housing development—given that it includes the full spectrum of development costs rather than construction alone—it nonetheless suggests that the £12.6 billion invested in housing projects in 2023/24 is likely to be associated with substantial waste generation [18].
Using the benchmark rate of 111.35 tonnes of waste per £1 million of construction value, the average cost of building a new house in the UK (£173,901 [19]) suggests that each new home generates around 19.4 tonnes of waste. Realistically, the waste impact of an individual house is likely to be lower; however, schemes involving the construction of more than one home typically involve additional resource input and material handling—both above and below ground—for materials used in roads, pavements and the wider site infrastructure required for a housing development.
In a rare example of a focussed study into construction waste in UK housebuilding conducted by Redrow [20] (now Barratt Redrow), the housebuilder found that, on average, 8.849 tonnes of construction waste is generated for each typical house type it builds. While this is lower than the estimate of 19.4 tonnes derived from the QFlow study [17], Redrow’s figure relates only to unit-level waste and does not account for site infrastructure. This suggests that material waste in new-build housing remains significant—both financially and environmentally.
Expanding on this evidence of significant waste, it is important to consider not only its quantity but also its broader environmental implications. Beyond the sheer volume of waste and its consequences through landfill and leachate, the environmental burden of material waste from housebuilding also arises from the embodied emissions of construction materials—those produced, used, and ultimately discarded. A recent comprehensive report by the New Economics Forum (2025) [21] synthesises evidence underscoring the need to deliver homes within planetary boundaries. It highlights that constructing new housing is highly carbon-intensive; meeting the government’s target of 300,000 homes annually until 2050, at current rates of decarbonisation, would consume England’s entire carbon budget for that period. Consequently, one of its key recommendations is to maximise resource efficiency in new builds. While the report notes that new housing is rarely resource-efficient, it stresses that where construction occurs, adherence to environmentally sustainable building standards is essential. Furthermore, it argues that the forthcoming Future Homes Standard (FHS), a long-awaited piece of legislation scheduled for December 2025, does not sufficiently address embodied emissions to align with climate targets and recommends its evaluation to ensure new homes minimise embodied carbon.
To illustrate the scale of the embodied-carbon challenge, an indicative estimate can be derived by combining Energy Performance Certificate (EPC) data for new-build homes with established assumptions for embodied carbon in typical UK dwellings. EPC records for homes completed in 2022 and 2023 [22] show an average floor area of around 90.8 m2, while the UKGBC (UK Green Building Council) baseline [23] for upfront embodied carbon is 800 kgCO2e/m2. Applying these figures indicates that approximately 72.6 tonnes of CO2e are embodied in the construction materials of an average new-build house.
While 800 kgCO2e/m2 is a widely used high-level benchmark, it is not the only reference point. Several UK frameworks propose alternative values that vary by building type, construction stage, and target year. For example, the RIBA 2030 Climate Challenge [24] sets a target of 625 kgCO2e/m2 for 2030, while the Greater London Authority [25] identifies an aspirational benchmark of below 600 kgCO2e/m2 for residential schemes. These variations highlight the importance of prioritising material efficiency when defining future embodied-carbon targets.
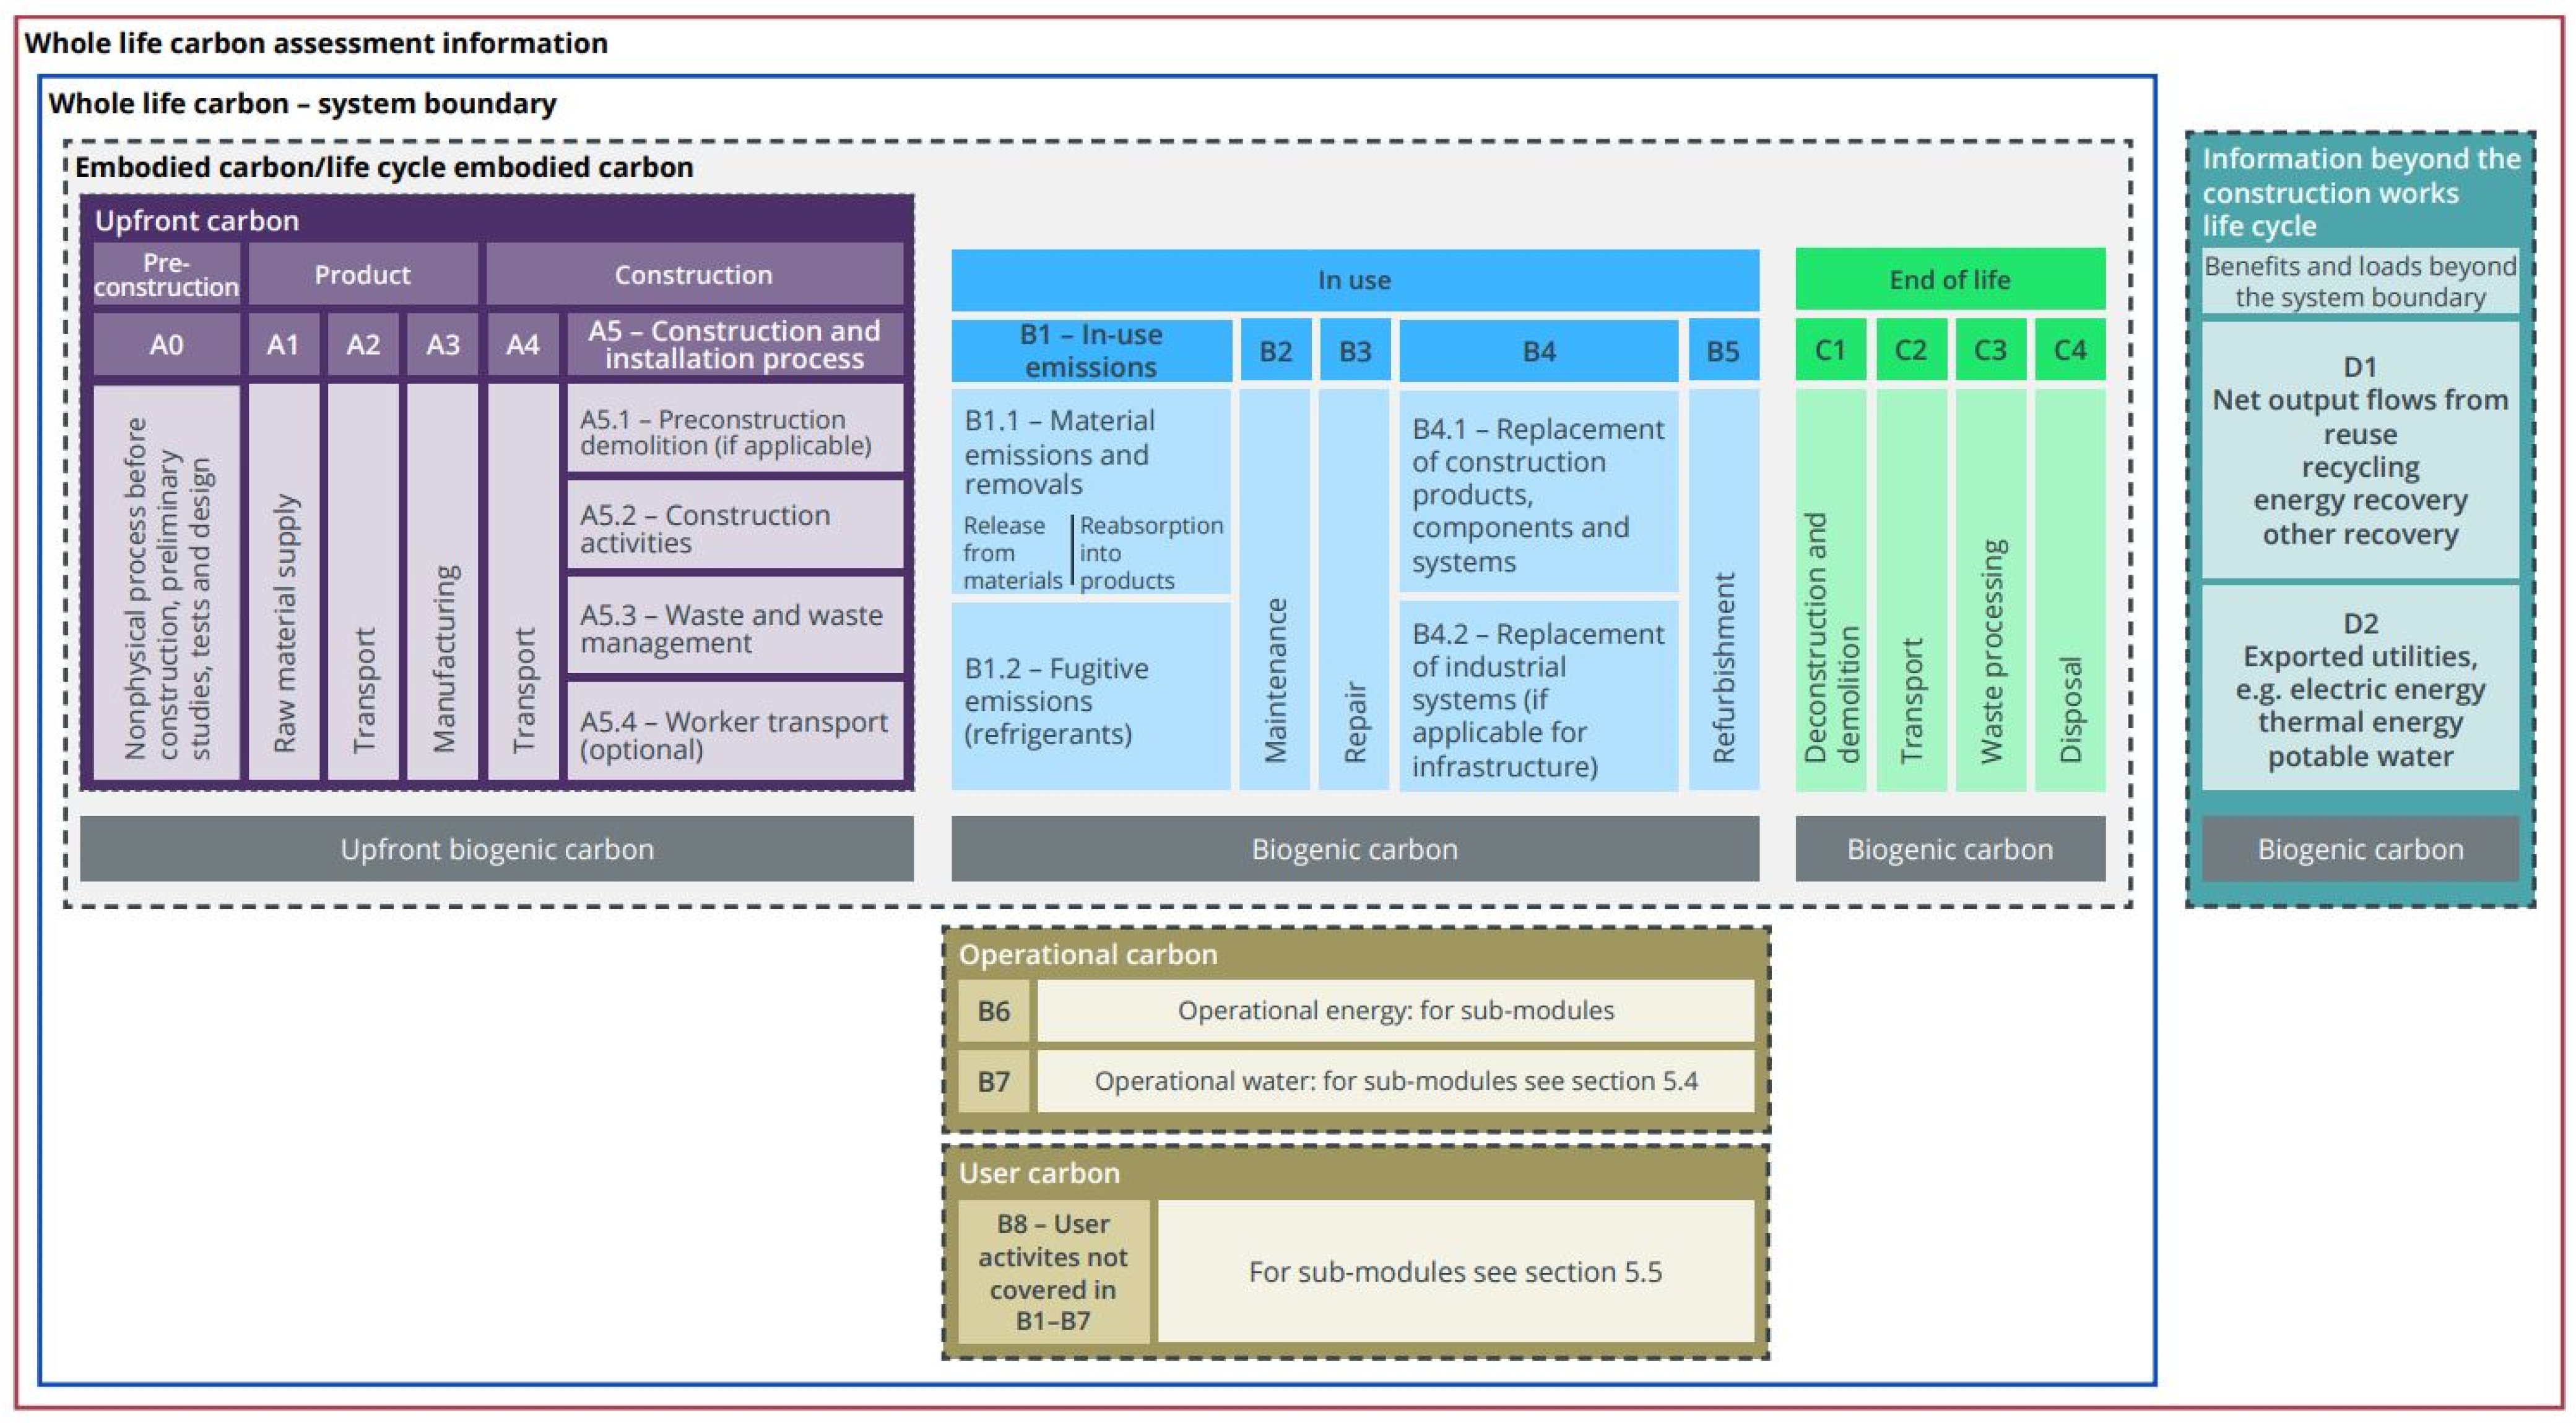
To understand how the estimated 72.6 tonnes of carbon in an average new-build house is distributed across its life-cycle, it is necessary to consider the system boundaries and modules defined in whole life carbon assessments. These are shown in Figure 1 [26], which presents an updated version of RICS Whole Life Carbon Assessment (WLCA) framework. Within this 72.6 tCO2e, the carbon impact of waste is accounted for numerous times: firstly, as a measure of the impacts embedded in Environmental Product Declarations (EPDs) resulting from material extraction (A1) and product manufacture (A3); then as a measure of the expected waste impacts arising from construction itself (A5.3); following that, as a measure of waste resulting from indicative component lifespans in relation to replacement (B4.1) and refurbishment (B5); and finally, as a measure of the waste generated during demolition when the house reaches the end of its serviceable life (C3). These calculations, which are assumed and presumed, are based on wastage rates drawn from construction-industry literature and Environmental Product Declarations (EPDs)—see Table 1 for a summary.
This breakdown highlights where waste-related impacts occur and where housebuilders have the greatest opportunity to intervene. A housebuilder can only measure waste at A5.3, whereas the rates embedded in EPDs are based on amounts of waste that are anticipated in relation to known wastage rates for specific material streams (in A1–A3) or assumptions (in B and C). Therefore, if any of these rates are underestimated, the overall carbon footprint of the house will also be underestimated. Housebuilders cannot control the rates attributed to other modules, but by focusing on how efficiently materials are used at A5.3, they can reduce costs and reduce carbon emissions as well.
  • Considering waste rates used in estimating

Understanding the precise quantity of materials required for a project is crucial to its success in relation to controlling cost and impact, and accurate waste rates are an important part of this equation. Where the quantity of material required is underestimated risks an increase in cost and where the quantity of material is overestimated risks an increase in actual waste. This is particularly pertinent to larger projects where small percentage margins can be significant, especially for carbon where greater quantities of material required and waste produced increases embodied impact. According to the literature, rates for estimating waste of building materials conventionally used in the construction of a UK home vary greatly across different material streams. For example, sources referencing the wastage rates of common clay bricks vary between 5% [27], 6% [26,28] and 10% [29], while the Estimator’s Pocket Book (2019) [30] estimates between 7.5 and 12.5%.
This review of literature finds such variance continues across a wider range of materials demonstrated in Table 1 below:
Table 1. Wastage rate variance found in the literature for key material streams.
MaterialWastage RatesSource of Reference
Facing Bricks5%The Brick Development Association (2024) [27]
6%RICS (2024) [26] and Future Homes Hub (2024) [28]
10%Brickhunter (2024) [29]
7.5–12.5%Estimator’s Pocket Book (2019) [30]
Blocks3%Adams K and Hobbs G (2023) [31]
3%Future Homes Hub (2024) [28]
5%Estimator’s Pocket Book (2019) [30]
5–10%RICS (2024) [26]
Plasterboard4%RICS (2024) [26] and Future Homes Hub (2024) [28]
10%British Gypsum (2024) [32], Knauf (2022) [33] and Estimator’s Pocket Book (2019) [30]
35%WRAP (2015) [34]
Insulation Board2%Isover (2022) [35] and Recticel (2023) [36]
7%RICS (2024) [26] and Future Homes Hub (2024) [28]
Timber Joists2%RICS (2024) [26] and Future Homes Hub (2024) [28]
7.5%Estimator’s Pocket Book (2019) [30]
Awareness of factors that increase actual waste (see Table 2 for examples) is essential for controlling and reducing these outcomes, whether through alternative decision-making or enhanced monitoring and control of material usage. The RICS Life Cycle Costing standard (1st edition, June 2025 [37]) seeks to improve knowledge and confidence regarding forecast waste rates by promoting transparency and the use of robust data. Although primarily a cost standard, its modular framework aligns with the detailed guidance in the RICS Whole Life Carbon Assessment (WLCA) Version 2 [26]. However, the recommended methodology for consistent measurement and reporting of emissions from waste relies on default waste rate data derived from Environmental Product Declarations (EPDs) and BRE SmartWaste [38] datasets. It is assumed these rates represent aggregated averages from a broad range of construction projects rather than being specific to housebuilding. Furthermore, the assumptions underpinning EPD-derived rates are not disclosed, limiting the ability to assess their applicability also.
Given the substantial variance in forecast and actual waste rates reported in the literature, alongside the financial and environmental costs associated with material waste and the potential for overconfidence in default recommended rates, this paper seeks to address these issues. Its primary aim is to identify waste rates for common construction products used in real-world housebuilding projects, thereby quantifying both the embodied carbon impact of wasted materials and the associated cost implications. A secondary objective is to posit the importance of improved feedback loops for estimators, emphasising how such mechanisms could support more accurate planning of material use in housebuilding projects and reduce waste, ultimately enabling more efficient and less environmentally impactful housing delivery.

2.2. Theoretical Framework: Resource Efficiency, Lean Construction and Circular Economy Principles

The concept of marginal gains adopted in this study aligns with established theoretical frameworks concerned with reducing raw material extraction, optimising resource use, and minimising waste across the built environment. Three bodies of theory—resource efficiency, lean construction, and circular economy principles—provide the conceptual foundation for understanding how small, incremental improvements in material use can generate cumulative benefits in cost, carbon, and operational performance.
  • Resource efficiency
Resource efficiency frameworks emphasise the need to reduce the quantity of materials required to deliver a given output, thereby lowering both environmental impact and financial cost. In what is widely regarded as the foundational text on resource efficiency, Allwood and Cullen [39] argue that material efficiency is one of the most underutilised strategies for reducing embodied carbon in construction, despite its high mitigation potential. Within this perspective, waste is conceptualised not only as a by-product of construction activity but as a symptom of systemic inefficiencies in design, procurement, and production processes. The marginal gains approach adopted in this study reflects this logic: small reductions in over-ordering, offcuts, and avoidable losses can collectively reduce the embodied carbon associated with A1–A5 stages and improve the accuracy of whole life carbon assessments.
  • Lean construction theory
Lean construction provides a second theoretical lens, originating from Koskela’s [40] seminal application of production theory to the construction sector. Lean theory positions construction as a flow-based production system in which value is maximised by improving flow reliability and systematically eliminating waste. Ballard and Howell [41,42] further developed this perspective, demonstrating that waste commonly arises from variability, poor coordination, and inefficient work structuring—factors that disrupt production flow and increase both time and material losses.
Within lean construction, waste is categorised into several types. Drawing on this body of scholarship, four categories are synthesised here for their particular relevance to housebuilding and to the empirical focus of this study:
Technical waste [40,43]—material lost through cutting, breakage, damage, or inefficiencies inherent in construction processes.
Organisational waste [41]—waste arising from procurement practices, logistics, scheduling, and supply-chain management.
Design waste [40,44]—waste generated by design decisions, such as non-standard dimensions, excessive tolerances, or late design changes.
Behavioural waste [41]—waste resulting from workmanship, site culture, or inconsistent adherence to efficient working methods.
These categories provide a structured way to interpret the sources of waste observed in both the spend-data analysis and the controlled site study. They also reinforce a central proposition of lean theory: waste is not an inevitable by-product of construction but a controllable outcome shaped by decisions made across the project life-cycle. This aligns directly with the marginal-gains approach adopted in this study, whereby small reductions in each category can accumulate to produce meaningful improvements in material efficiency and embodied-carbon performance.
  • Circular economy principles
Circular economy (CE) theory offers a complementary perspective by emphasising the retention of material value and the minimisation of waste across multiple life-cycle stages. CE frameworks—such as those developed by the Ellen MacArthur Foundation and expanded by Kirchherr et al. [45]—advocate designing out waste, keeping materials in use for longer, and regenerating natural systems. Although CE discourse often focuses on reuse, recycling, and end-of-life strategies, its principles apply equally to the construction phase (A5), where preventing waste at source is the most effective intervention. By reducing unnecessary material consumption, improving estimating accuracy, and strengthening feedback loops, marginal gains contribute directly to CE objectives by lowering the volume of materials that must be managed, transported, or disposed of at later stages.
  • Positioning marginal gains within these frameworks
Taken together, these theoretical perspectives position marginal gains as a legitimate and theoretically grounded strategy for improving the environmental and financial performance of housebuilding. Lean construction highlights the operational mechanisms through which waste arises; resource efficiency underscores the material and carbon implications of that waste; and circular economy principles frame waste reduction as part of a broader transition toward sustainable construction practices. By integrating these frameworks, this study situates its empirical findings within a wider body of theory that recognises the cumulative value of small, targeted interventions in reducing waste and improving whole life carbon outcomes.

2.3. Exploring Waste Rates Through Spend Data

To investigate actual wastage taking place on three recently completed housing developments, spend and waste data was evaluated to compare the difference between what quantities of materials were first estimated (including the % of wastage allowed for), with final orders and spend. This required access to a large range of project information in various formats including estimates, technical drawings, bills of quantities and invoices.
  • Selection of material streams
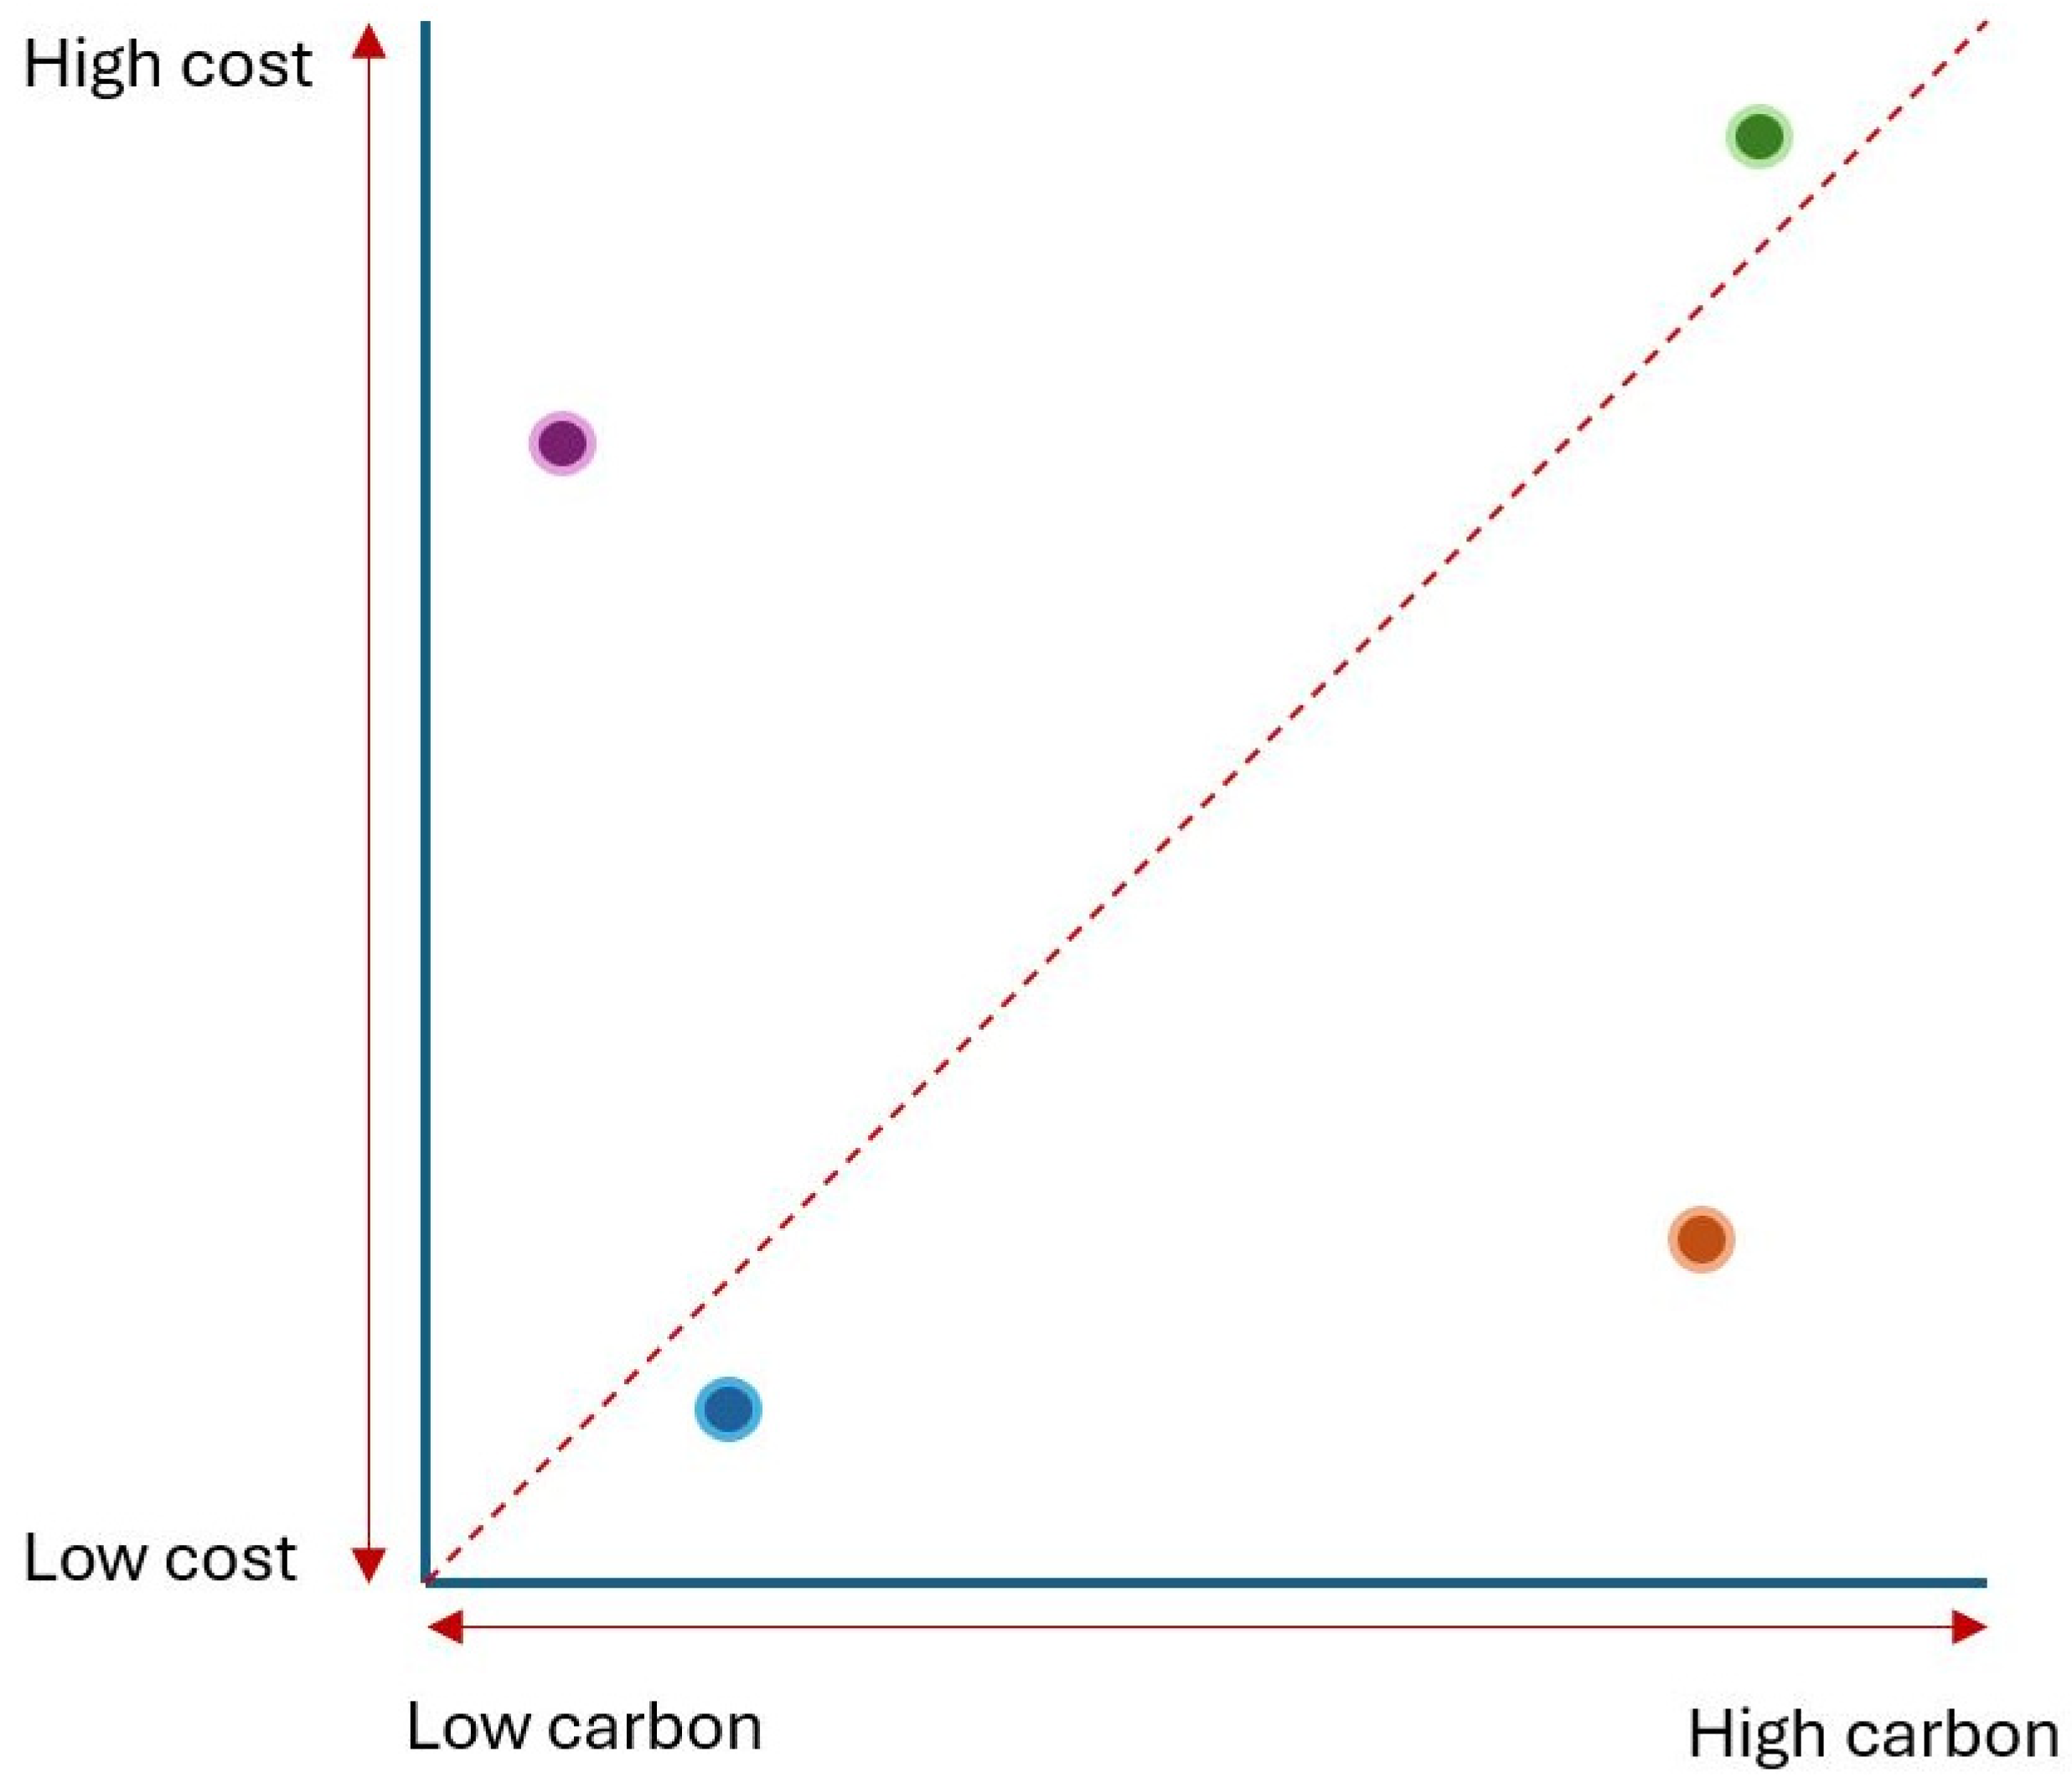
Five material groups were chosen based on an initial analysis of annualised waste data across the housing association’s wider portfolio of housing schemes. This review highlighted bricks, blocks, insulation, plasterboard, and timber joists as the most frequently occurring and highest-impact waste streams in terms of both cost and embodied carbon (A1–A3) (Figure 2 demonstrates the priority of high cost, high carbon items). Focusing on these materials therefore enabled the study to target waste categories with the greatest potential influence on project-level and programme-level environmental performance. Material selection also ensured consistency between the retrospective spend analysis and the controlled site study.
  • Case study selection and data availability
The three schemes analysed were selected on the basis of data availability rather than representativeness of the wider sector. Access to detailed estimating records, bills of quantities, invoices, and waste documentation was only feasible for projects delivered by a single housing association and its internal construction arm. Although this introduces limitations in sampling breadth, it reflects the practical constraints of conducting research within live commercial environments, where consistent documentation across multiple organisations is rarely accessible. To mitigate this constraint, the study triangulates the historic project data with the controlled site study, enabling comparison and validation of the retrospective findings and strengthening the reliability of the results.
  • Data quality and contract model considerations
The analysis relied on project documentation that varied in format, level of detail, and reliability, reflecting the diversity of contract models used across the three schemes. Packages were procured through a mixture of labour-only, supply-and-fix, and lump-sum arrangements, each offering different levels of transparency regarding material quantities. In several cases—most notably drylining—materials and labour were combined within a single contract sum, making it impossible to isolate actual material usage. To address this, generalised assumptions were applied using indicative material–labour splits provided internally by the housing association and supplemented with benchmark ratios from the Estimator’s Pocket Book [30]. These assumptions introduce uncertainty; however, they reflect the inherent limitations of working with real-world project data that is not designed for research purposes and is often not disaggregated or amenable to detailed analysis.
In addition to these data-related constraints, a further limitation is that the study examines waste-allowance decisions only through the material and spend data available, rather than investigating the underlying motivations behind those decisions. Understanding how estimators and surveyors determine waste allowances—including commercial risk management, contractual structures, organisational practice and individual experience—represents a valuable direction for future research.
  • Assessing variability in spend data
Differences between initial estimates and final spend were assessed—enabling a percentage difference to be identified. The percentage difference in material used was then added to the initial percentage of waste allowed for, enabling an estimate of the total percentage of material wasted. Using the respective purchase costs per unit for each material stream, a calculation of the true cost of waste was then reached. The cumulative value of each saving was then calculated to understand what the total percentage of waste represented as percentage of the relevant build cost.
A separate methodology was developed for plasterboard, with drylining procured as a combined material-and-labour package for each scheme. Accordingly, 30% of the contract sum was allocated to material costs, and an indicative material volume was estimated based on the cost and weight of a standard plasterboard sheet. To calculate an indicative percentage rate of plasterboard waste for each of the three schemes, the total weight of plasterboard waste recorded in the scheme’s waste data—made possible because plasterboard is a legislated segregated waste stream in the UK (introduced by the Environment Agency in 2009 to prevent gypsum from being mixed with biodegradable waste [46])—was divided by the assumed total weight of material purchased. The results of this analysis are presented in Table 3.
In addition, to understand the embodied impact (A1–A3) of the excess material used, standard carbon rates for each material stream were applied to the total quantities of waste material calculated. Once the impact of each material stream was reached, the total impact of each stream was added together and divided by the number of homes to demonstrate how much carbon was added on to each house because of inefficient material consumption. An average from the three schemes was used as a baseline to demonstrate what a 1% saving of material waste reduction represents as a reduction in carbon emissions. A summary of the cost and carbon impact added to each home can be seen in Table 4.
It is important to note that these values reflect the specific characteristics of the three schemes studied and should not be interpreted as representative of the wider sector. The ‘1%’ figure cited in the introduction refers solely to the average across these projects and is presented as an indication of potential savings rather than a generalisable estimate of typical waste-related cost impacts. The analysis is descriptive and based on observed differences between estimated and actual material usage within a small and heterogeneous sample; given the limited dataset and variation in procurement models, inferential statistical analysis was neither feasible nor appropriate. The findings therefore illustrate the scale of possible efficiencies within the studied projects rather than providing statistically significant relationships or sector-wide predictions.

2.4. Measuring Waste Rates Through Controlled Site Study

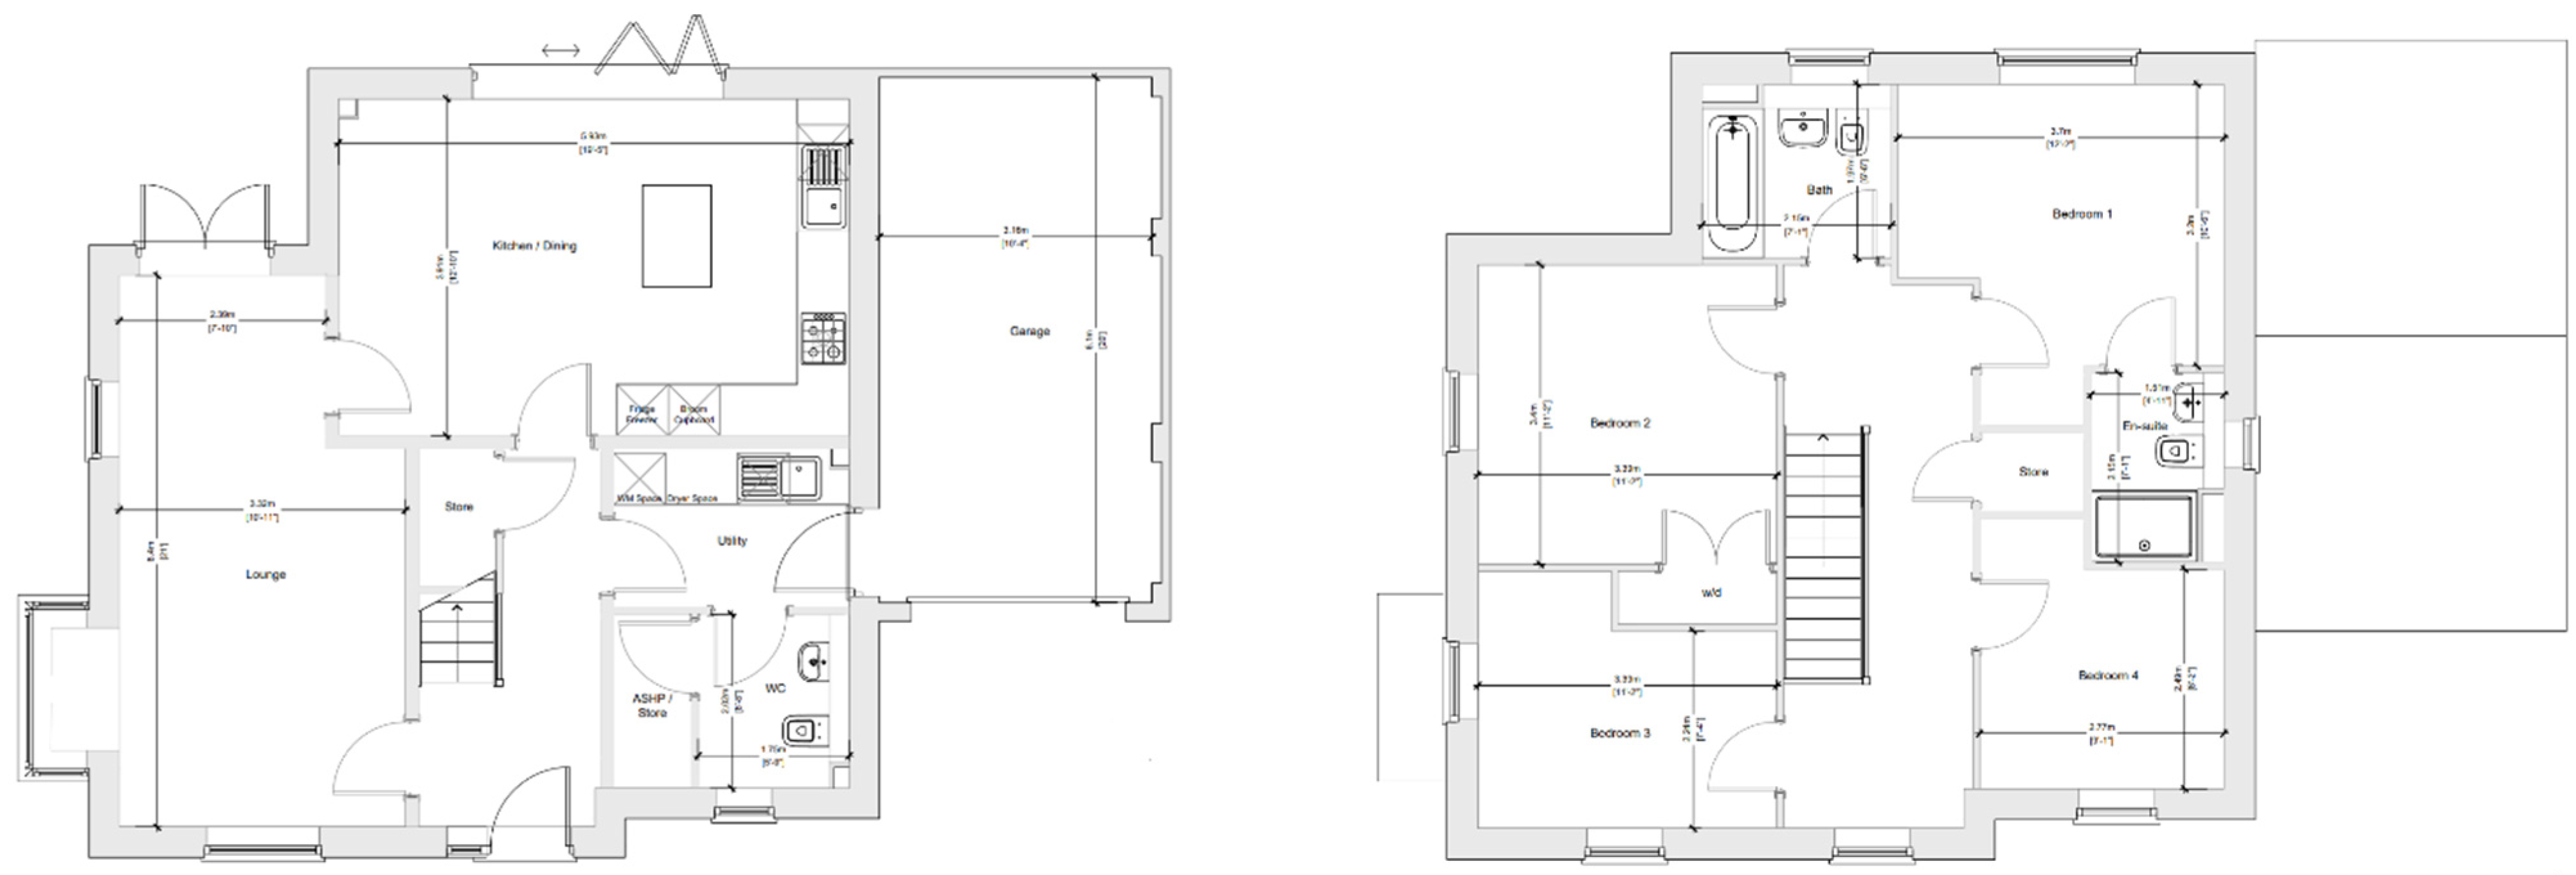
To examine and validate the variance in waste rates reported in the literature, Project Estimator allowances, and the percentage rates derived from the spend and waste data (see Table 3), a controlled case study was conducted on a live housing development in Banbury between May 2024 and March 2025. The study tracked waste generated during the construction of a single four-bedroom home (see Figure 3 for layout) from foundation stages through to final fit-out, thus enabling direct measurement of waste rates and assessment of cost and carbon implications at unit level.
  • Rationale for single-unit focus
The decision to monitor a single four-bedroom home reflects the practical constraints of conducting controlled waste measurement on a live construction site. While monitoring multiple units would have strengthened generalisability, isolating and managing waste streams at that scale was not feasible without disrupting site operations. A single dwelling provided a manageable and clearly bounded unit of analysis, enabling accurate measurement of waste volumes and sources while still offering meaningful insight when interpreted alongside the multi-scheme spend analysis.
The primary objective was to quantify both the volume and cost of waste produced by one unit. This involved systematically documenting each waste stream to determine the cumulative financial and environmental impacts.
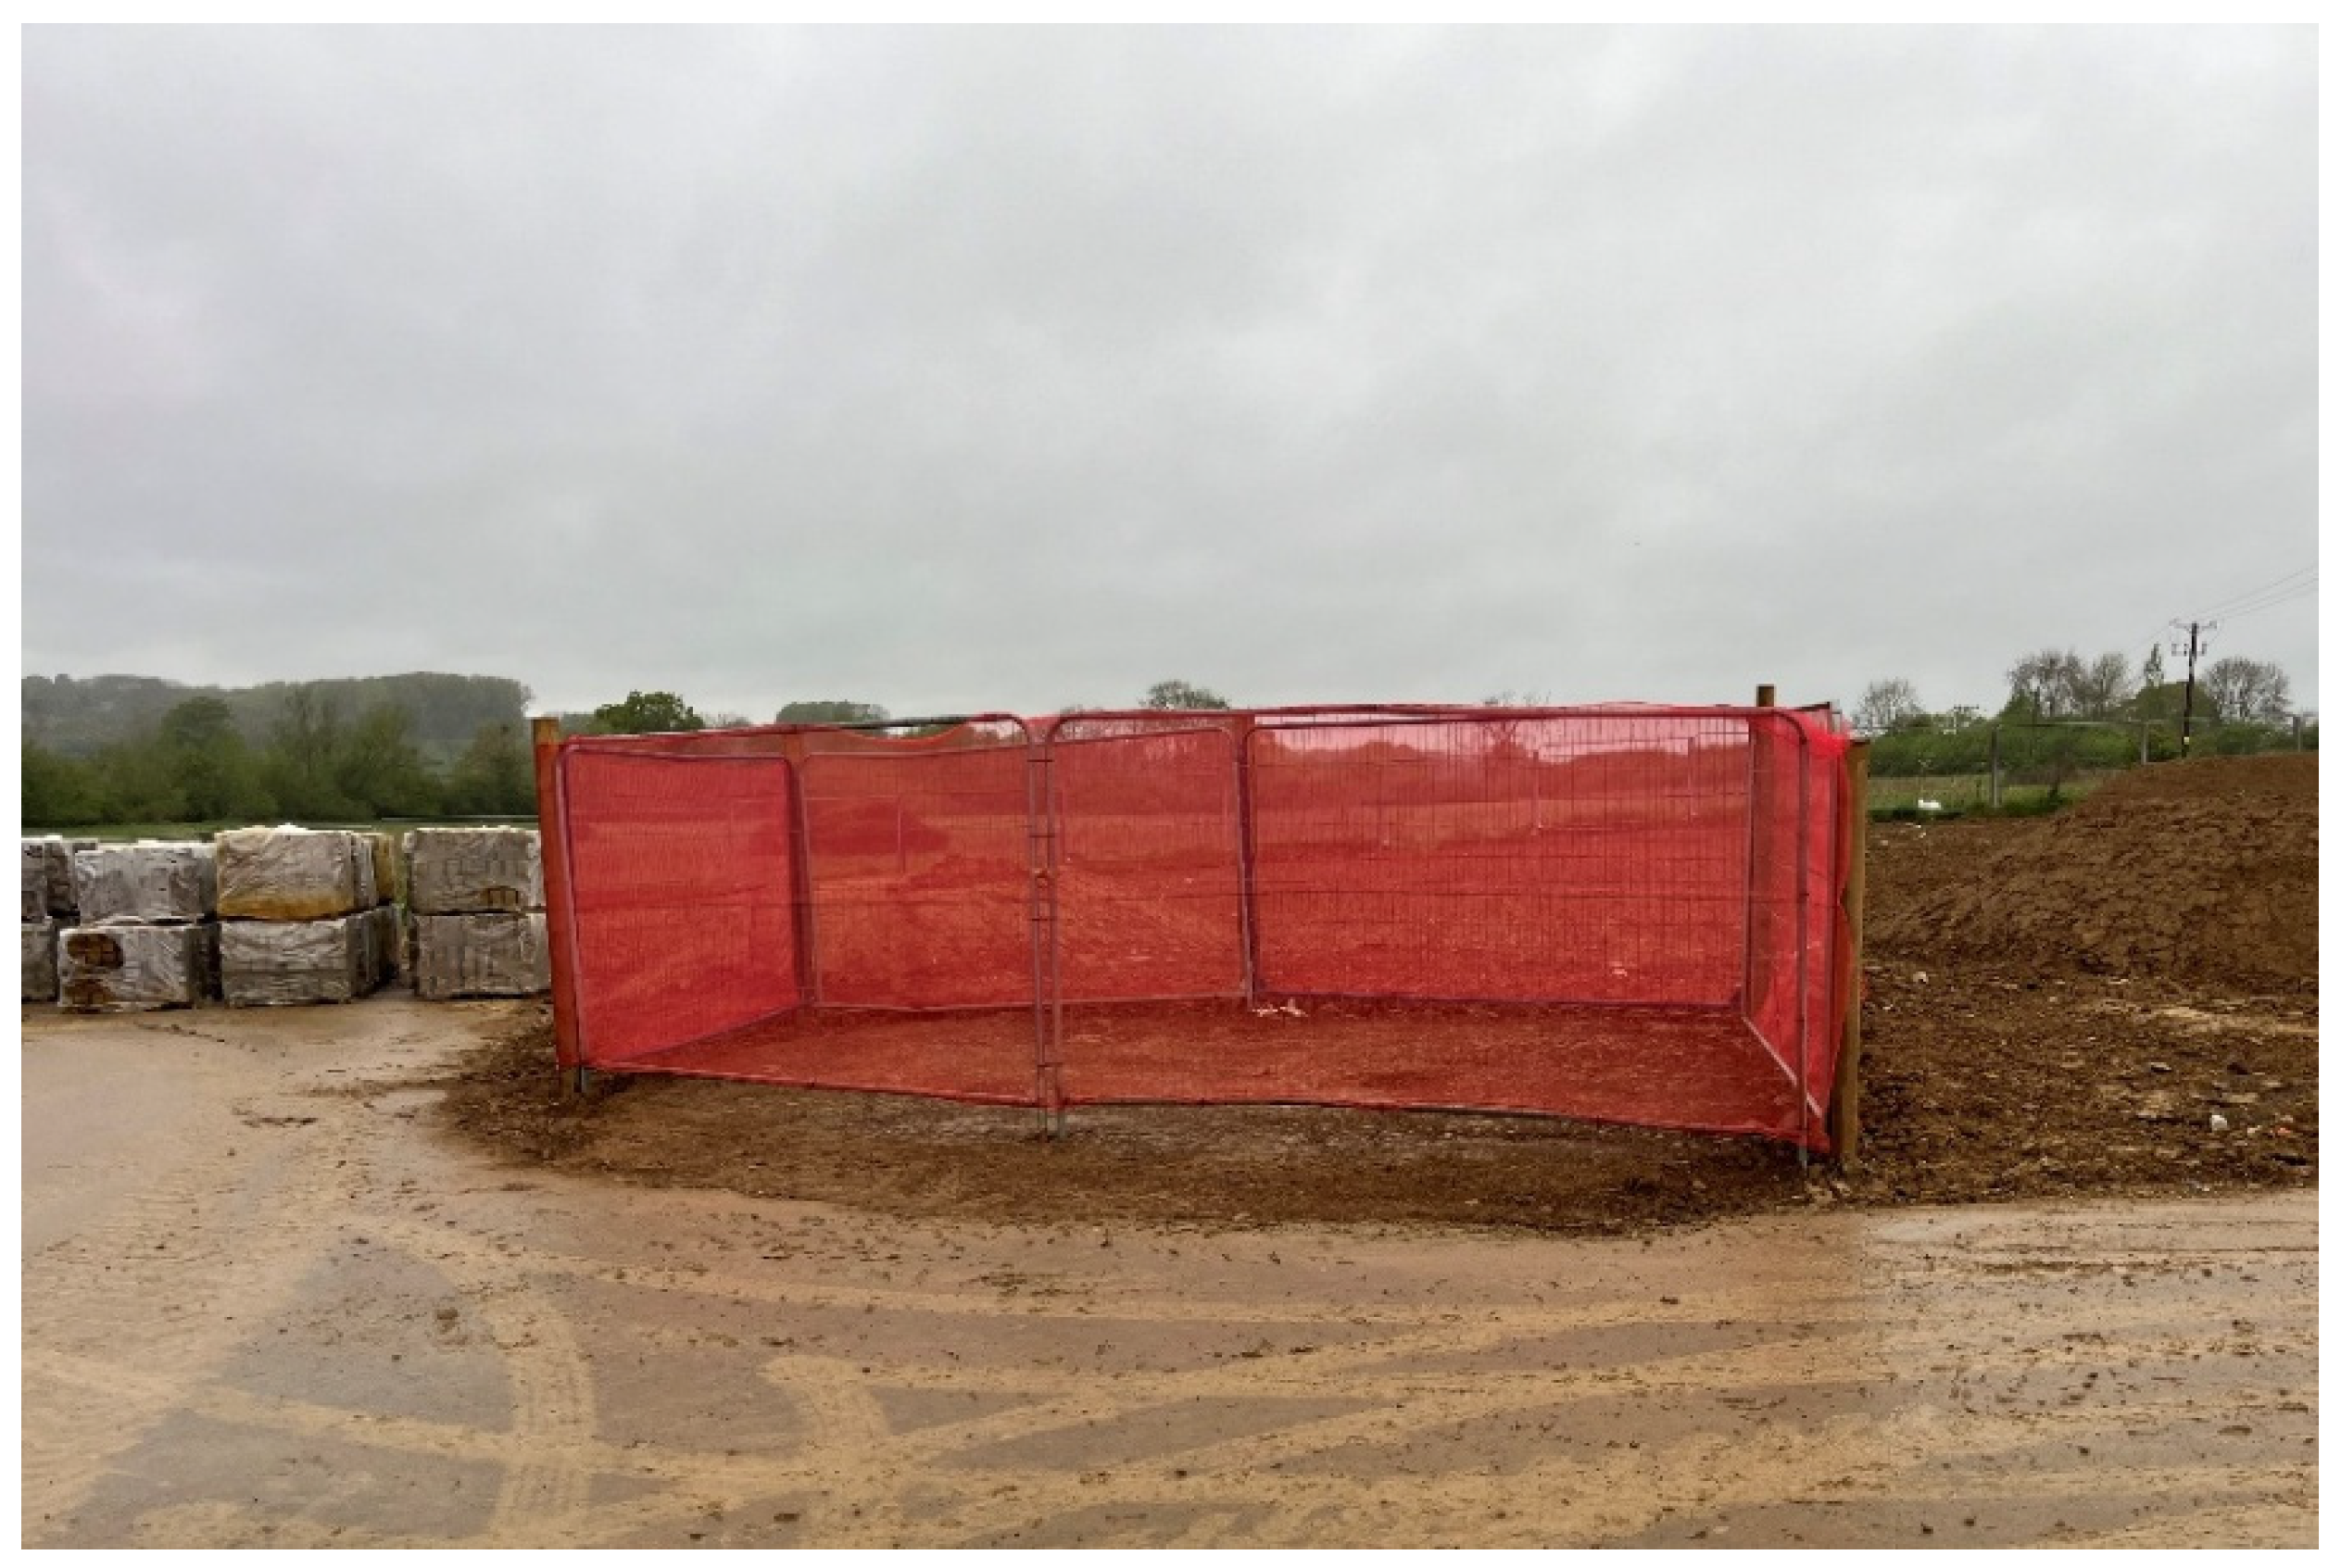
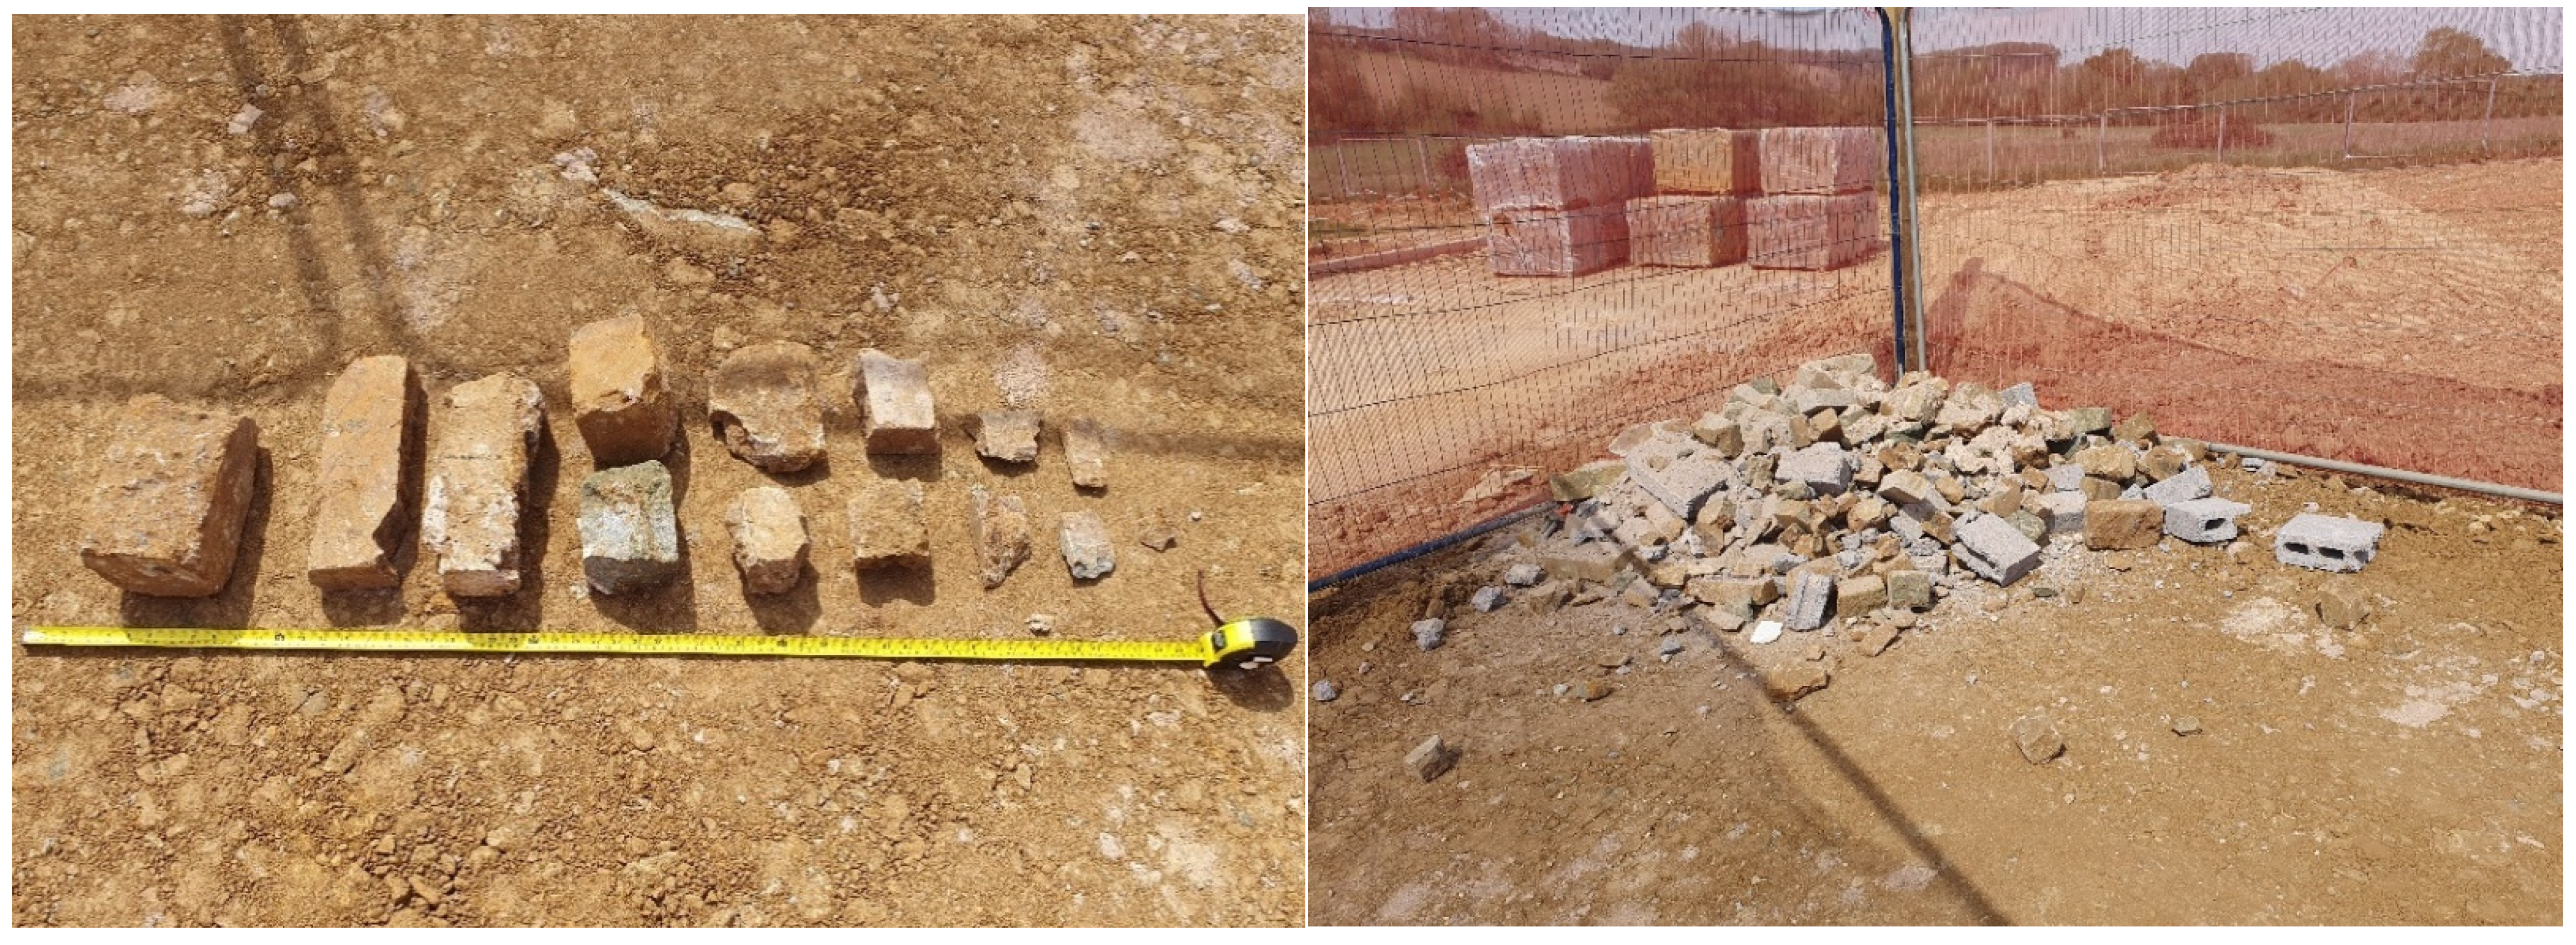
To ensure control, all waste from the selected unit was initially placed in a tipping skip outside the plot. Once full, contents were transferred to a cordoned-off area (see Figure 4) adjacent to the plot for measurement (see Figure 5 for example). Exceptions included plastic solvent bottles and plasterboard, which were segregated to meet hazardous waste compliance requirements.
In addition to monitoring waste, working practices were also observed through informal interviews with tradespeople carrying out their tasks.
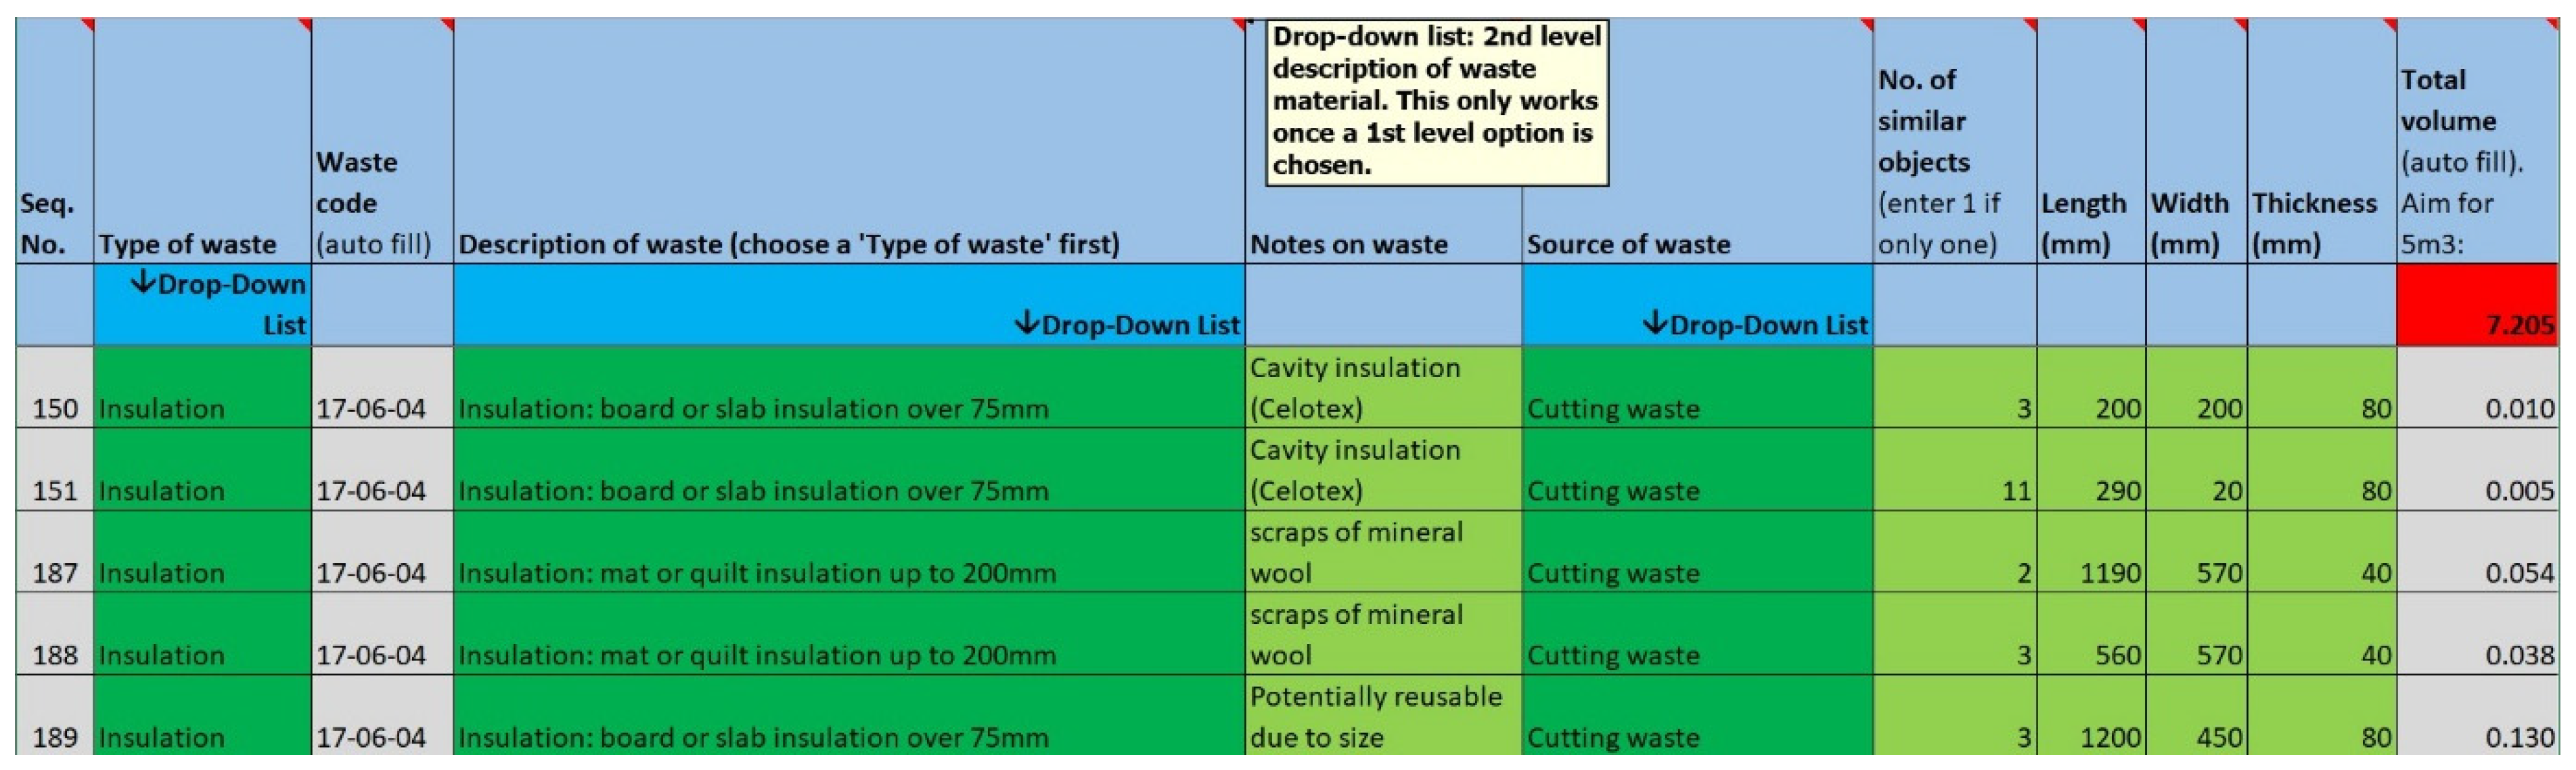
Waste was audited at regular intervals to maintain accurate records. Volumetric dimensions and item counts were entered into the Construction Waste Indicative Cost (CWIC) Calculator (illustrated in Figure 6), designed by Zero Waste Scotland, which helps to record and calculate cumulative volumes of waste by material stream. The Excel-based tool also enabled an estimate of material waste value based on built-in cost assumptions and allowed bespoke entries, which was used once for ironstone bricks. Additional data, such as the source of waste, supported further analysis.

3. Results

3.1. Analysis of Initial Estimates Versus Final Spend

The research found that the average cumulative cost of the five material streams represented approximately 1% of the cost of constructing a new home on each site. For example, at Site A, the total material waste cost for the five streams added £1825 per home, equating to 1% of the construction cost for that scheme (£179,079).
Across the three sites, 13 discrepancies were identified out of 15 assessed lines, highlighting inconsistencies between estimated quantities, waste allowances, and the data collected. In other words, for the five material streams examined, the actual waste rates differed for nearly all material streams in each scheme.
Differences were also observed between work packages that included both labour and materials and those involving direct material procurement. For example, at Sites A and B, bricks were supplied as part of a combined labour-and-materials package, with waste allowances built in (10% and 5%, respectively). In both cases, actual waste did not exceed these allowances, and at Site A, waste was calculated at 1% below the allowance. In contrast, at Site C—where bricks were procured as materials only—the total percentage of bricks wasted was 20%, which is 15% higher than the initial allowance. A further distinction was noted for plasterboard: in drylining packages, subcontractors determine the quantities to supply, meaning the developer has no visibility or control over the waste allowance applied.
When comparing waste percentage rates derived from initial estimates and spend with waste rates reported in the literature, a substantial variance emerges between assumed rates, estimator allowances, and observed data (summarised in Table 5). Literature-based waste rates—many of which inform embodied carbon calculations in WLCAs—tend to underestimate actual waste observed through spend data analysis, typically assuming less than 10% waste across all material streams analysed. With the exception of timber joists, none of the rates derived from the analysis were as low as the lowest figures cited in the literature. Estimators on each scheme had applied standard allowances of either 5% or 10%; specifically, two estimators used 5%, while one applied 10%. In contrast, actual waste rates measured across all five streams and three sites averaged above 10%, with plasterboard showing the highest average waste rate at 17%.
Finally, waste rates referenced in the literature and those used for carbon assessments are typically applied across all construction projects—not specifically housebuilding. For example, published plasterboard waste rates in the Estimator’s Pocket Book [29] do not differentiate between constructing a single house, 100 houses, or an entirely different project type, such as a retail fit-out.

3.2. Analysis of Controlled On-Site Waste Study

During construction of the studied unit, data recorded in the Construction Waste Indicative Cost Calculator (illustrated in Figure 6) indicated a total of 15.5 m3 of waste, with discarded materials valued at approximately £8400. When combined with skip hire costs—estimated at £961 based on collected volume—this equates to around 3% of the total build cost. However, these figures exclude indirect costs such as fuel and labour associated with waste management; inclusion of these factors would likely increase the estimated loss beyond the 3% calculated.
While the controlled case study of a single dwelling indicated a higher potential saving than the retrospective spend-data analysis, this variation illustrates that waste-related cost impacts can differ substantially between projects. This reinforces that the study’s findings highlight potential efficiencies rather than asserting a universal saving applicable across all housebuilding contexts.
By value, ironstone bricks used as facing material in the monitored site constituted the costliest waste stream, accounting for 39% of the total cost of materials discarded, followed by insulation (predominantly PIR board) and concrete blocks. By volume, insulation was the most significant component (representing 26% of total volume of material discarded), followed by wood packaging (primarily uncollected pallets—representing 24%) and ironstone bricks (17%).
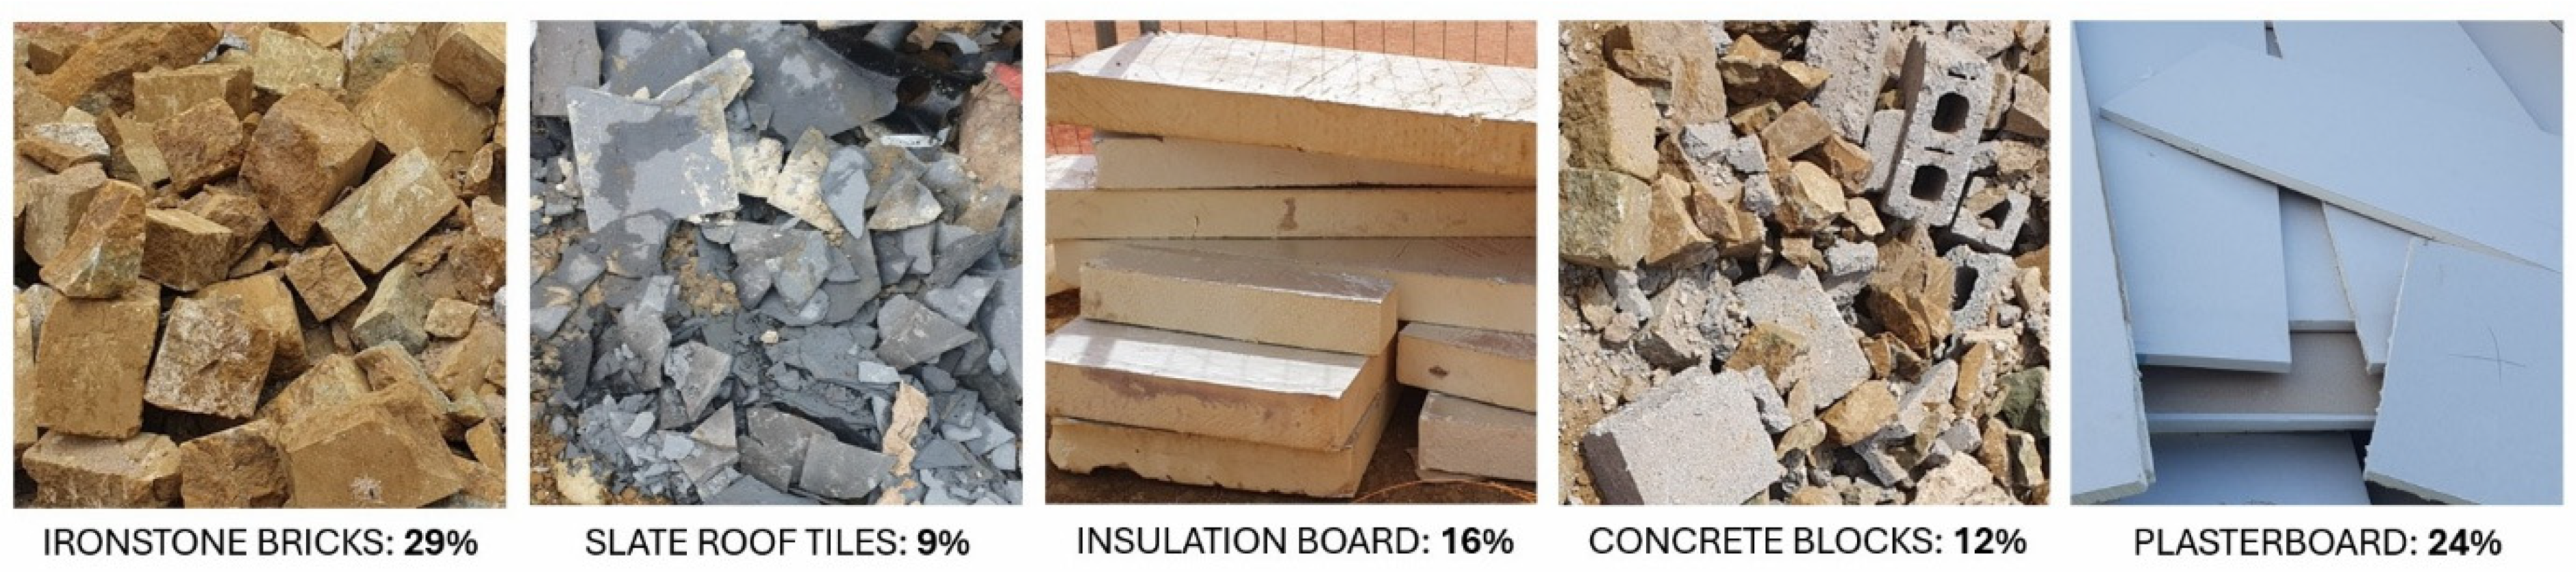
Comparing these volumes with the actual quantities of materials required for the build enables calculation of material-specific waste rates (Figure 7). This analysis not only identifies areas where targeted interventions could be most effective but also reinforces earlier findings (see Table 5) regarding the significant variance in waste rates observed in spend data and across literature sources.
  • Material-Specific Observations from the monitored site
Slate tiles: A notable proportion of slate waste resulted from tiles supplied at a lower grade than specified within a materials-and-labour package. Although not defective, these tiles failed to meet the expected visual quality and were discarded in greater numbers. Field observations indicated that productivity pressures discouraged salvaging or re-sorting tiles: “If I had an extra 20 min, I could probably find a place for one or two of those tiles to go,” illustrating how time-cost trade-offs can render usable materials valueless.
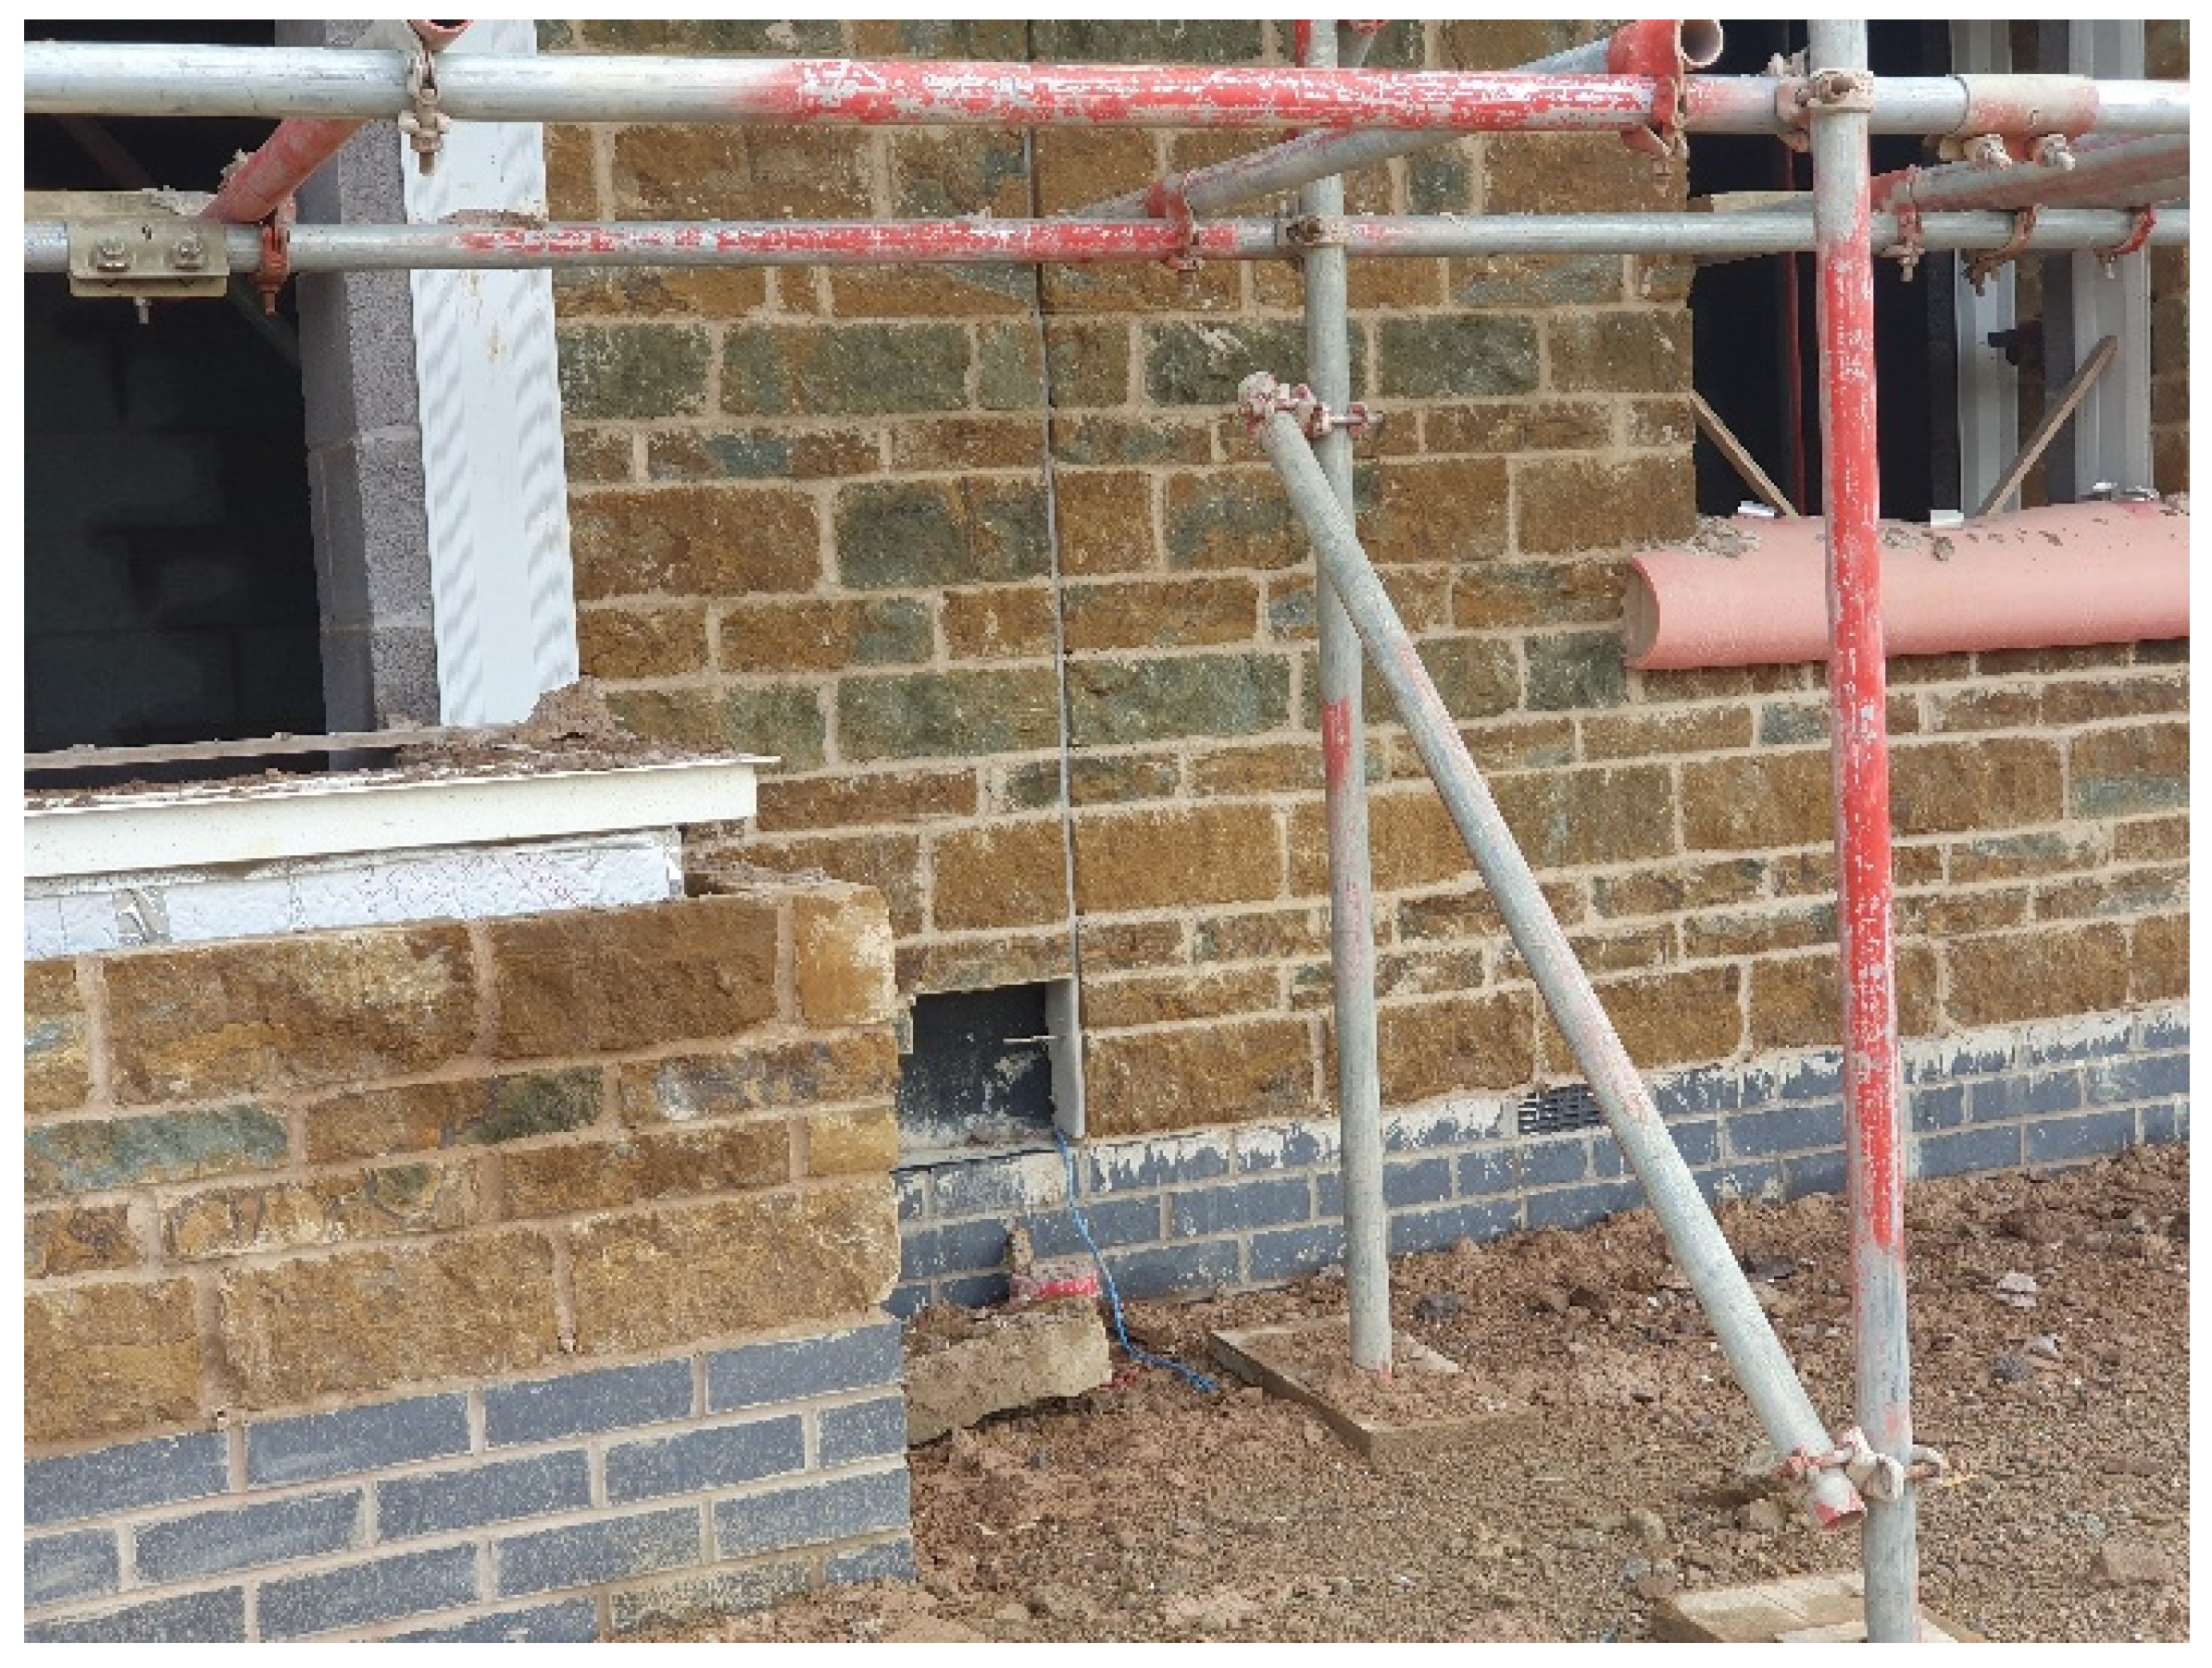
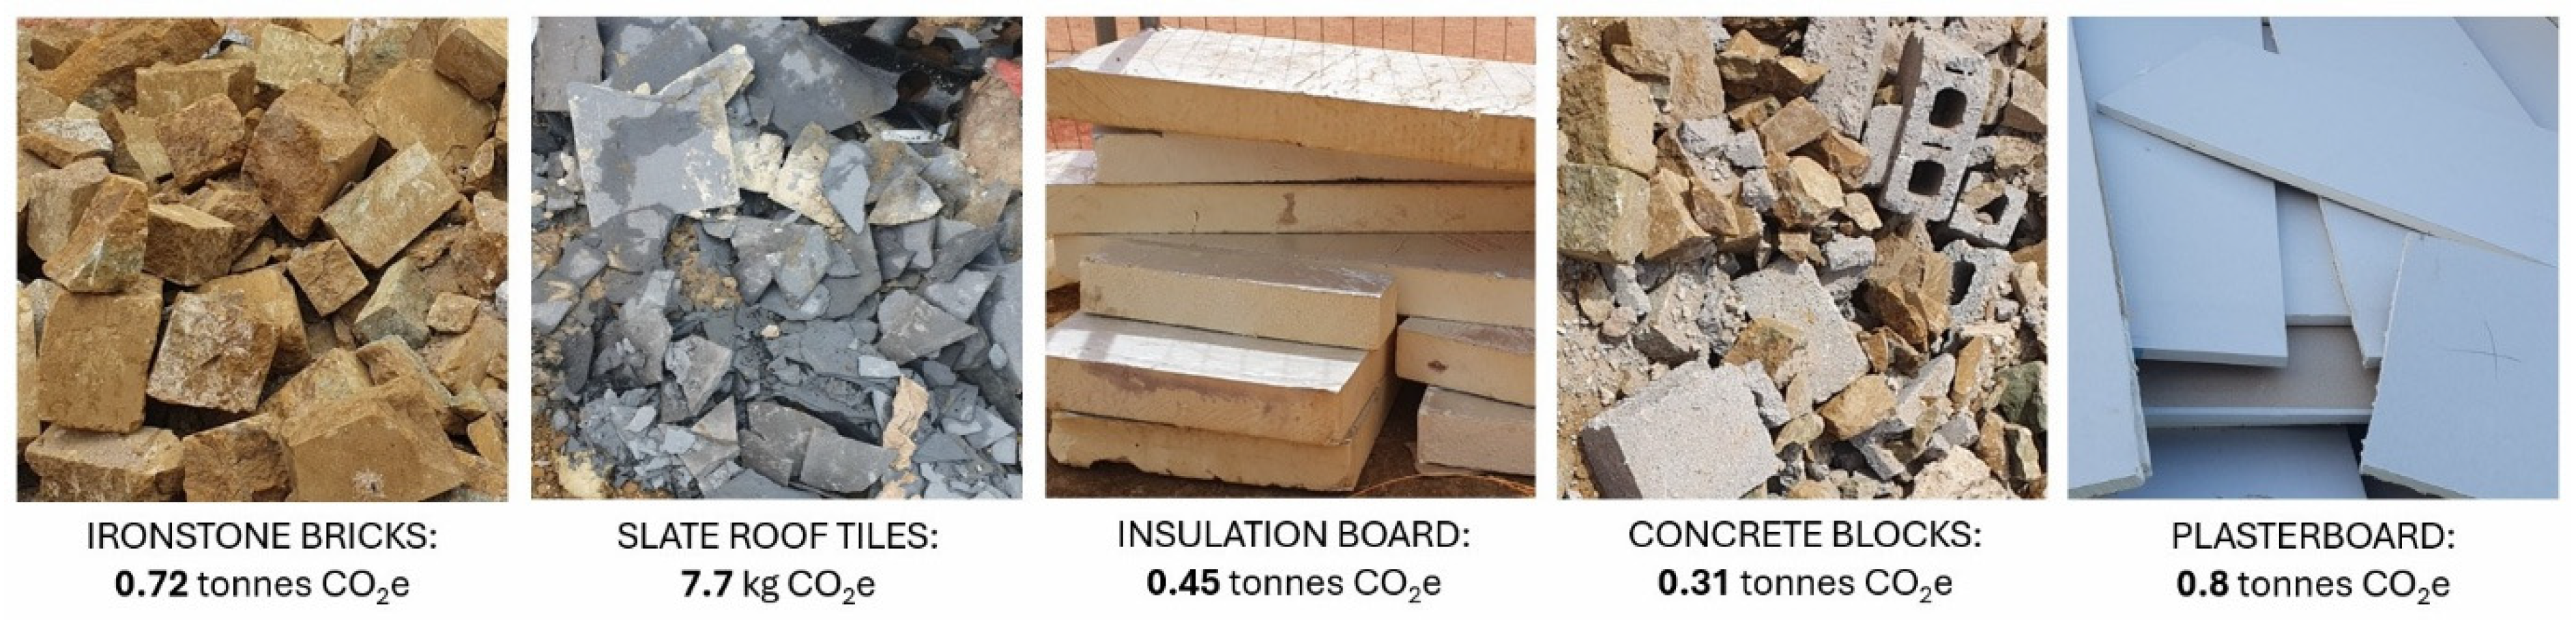
Ironstone bricks: The calculated waste rate for ironstone bricks was approximately 29%. These bricks were specified to satisfy planning requirements for the site’s edge-of-Cotswolds location and generated substantial cutting waste. Numerous large, undamaged bricks were observed in the waste stream, suggesting issues with material handling or limited experience with traditional stone (see Figure 8 for example of irregular brick sizes used). Time pressures and unfamiliarity with the material appeared to have encouraged operatives to use new bricks rather than recover or carefully cut existing ones. Targeted training, stricter material control, or reconsideration of specification could reduce this waste without breaching planning constraints.
Plasterboard and drylining: Drylining generated substantial cutting waste and, while not the largest stream by volume, had the highest carbon impact—representing 0.8 tCO2e in total. Large offcuts suitable for reuse were occasionally set aside, but the fragmentation of plastering into discrete tasks—tacking, dabbing, and skimming—performed by different operatives disrupted material continuity and reuse opportunities. This task division appeared to reduce both workmanship quality and material efficiency; one plasterer remarked, “I only do tacking; I don’t like dabbing or skimming,” highlighting how narrow task allocation can impede reuse.
  • Carbon Impact
As illustrated in Figure 9, five waste streams alone—out of the numerous generated during the build—accounted for approximately 2.3 tonnes of avoidable carbon emissions. This finding underscores the substantial cumulative carbon impact associated with construction waste and highlights the critical need to improve understanding of material-specific waste rates if whole life carbon assessments are to comprehensively and accurately capture the full environmental impact of new-build homes.

4. Discussion

  • Significance for UK housebuilding
If these differential findings were replicated across the wider housebuilding sector, the implications would be substantial. Using the average construction cost of a new home (£173,901 [9]) and the government’s target of delivering 370,000 new homes per year [47], a 1–3% reduction in material use—consistent with the savings identified across both strands of this research—would equate to annual cost savings of approximately £643 million to £1.93 billion. These savings alone could fund the construction of an additional 3700 to 11,100 homes each year without requiring further public expenditure. Such gains could be realised either by targeting reductions in a small number of high-impact material streams or by addressing waste across all materials used in new-build housing.
The carbon implications are similarly significant. The material efficiency analysis demonstrated an average saving of 1 tCO2e across the three schemes examined, while the live scheme case study identified a 2.3 tCO2e saving for a single unit—both figures based solely on five key waste streams. Extrapolated to the national housebuilding target, this suggests a potential annual saving of 370,000 to 851,000 tCO2e. This is equivalent to the upfront embodied carbon associated with constructing approximately 11,722 new homes, based on an average new-build home generating 72.6 tCO2e (derived from UKGBC’s baseline of 800 kgCO2e/m2 and the average UK home size of 90.8 m2).
Collectively, these findings highlight a systemic inefficiency embedded within current construction practices. Carbon is effectively emitted twice: first through the production of materials, and again when those materials become waste without ever delivering functional value. The unusable slate tiles identified in the case study exemplify this issue, a pattern further highlighted by the Qflow study [16], which cites a 2018 BRE report indicating that 13% of construction materials are diverted directly to waste without ever being used.
This study highlights opportunities for further research; larger datasets and consistent procurement documentation would enable statistical testing, modelling of procurement–waste relationships, and more robust sensitivity analyses to quantify uncertainty ranges. The national-scale cost and carbon estimates presented above are therefore intended as illustrative scenarios based on simple proportional scaling, rather than predictive forecasts. The findings demonstrate the potential magnitude of impact if similar efficiencies were realised more widely, but more rigorous (real-time) modelling would be required to substantiate these estimates and assess their variability across different construction contexts.
While the findings offer clear insights into material efficiency within UK social housing delivery, their transferability to other contexts—such as private-sector housebuilding, off-site construction, or housing delivery in developing countries—requires further investigation. Differences in procurement models, regulatory frameworks, construction methods, and labour practices may influence both waste generation and the feasibility of achieving similar marginal gains. Future comparative studies across private developments, alternative construction methods, and international settings would therefore be valuable in testing the applicability of these findings and identifying context-specific drivers of material efficiency.
  • Recommendation for Best-Practice Estimating to Reduce Waste
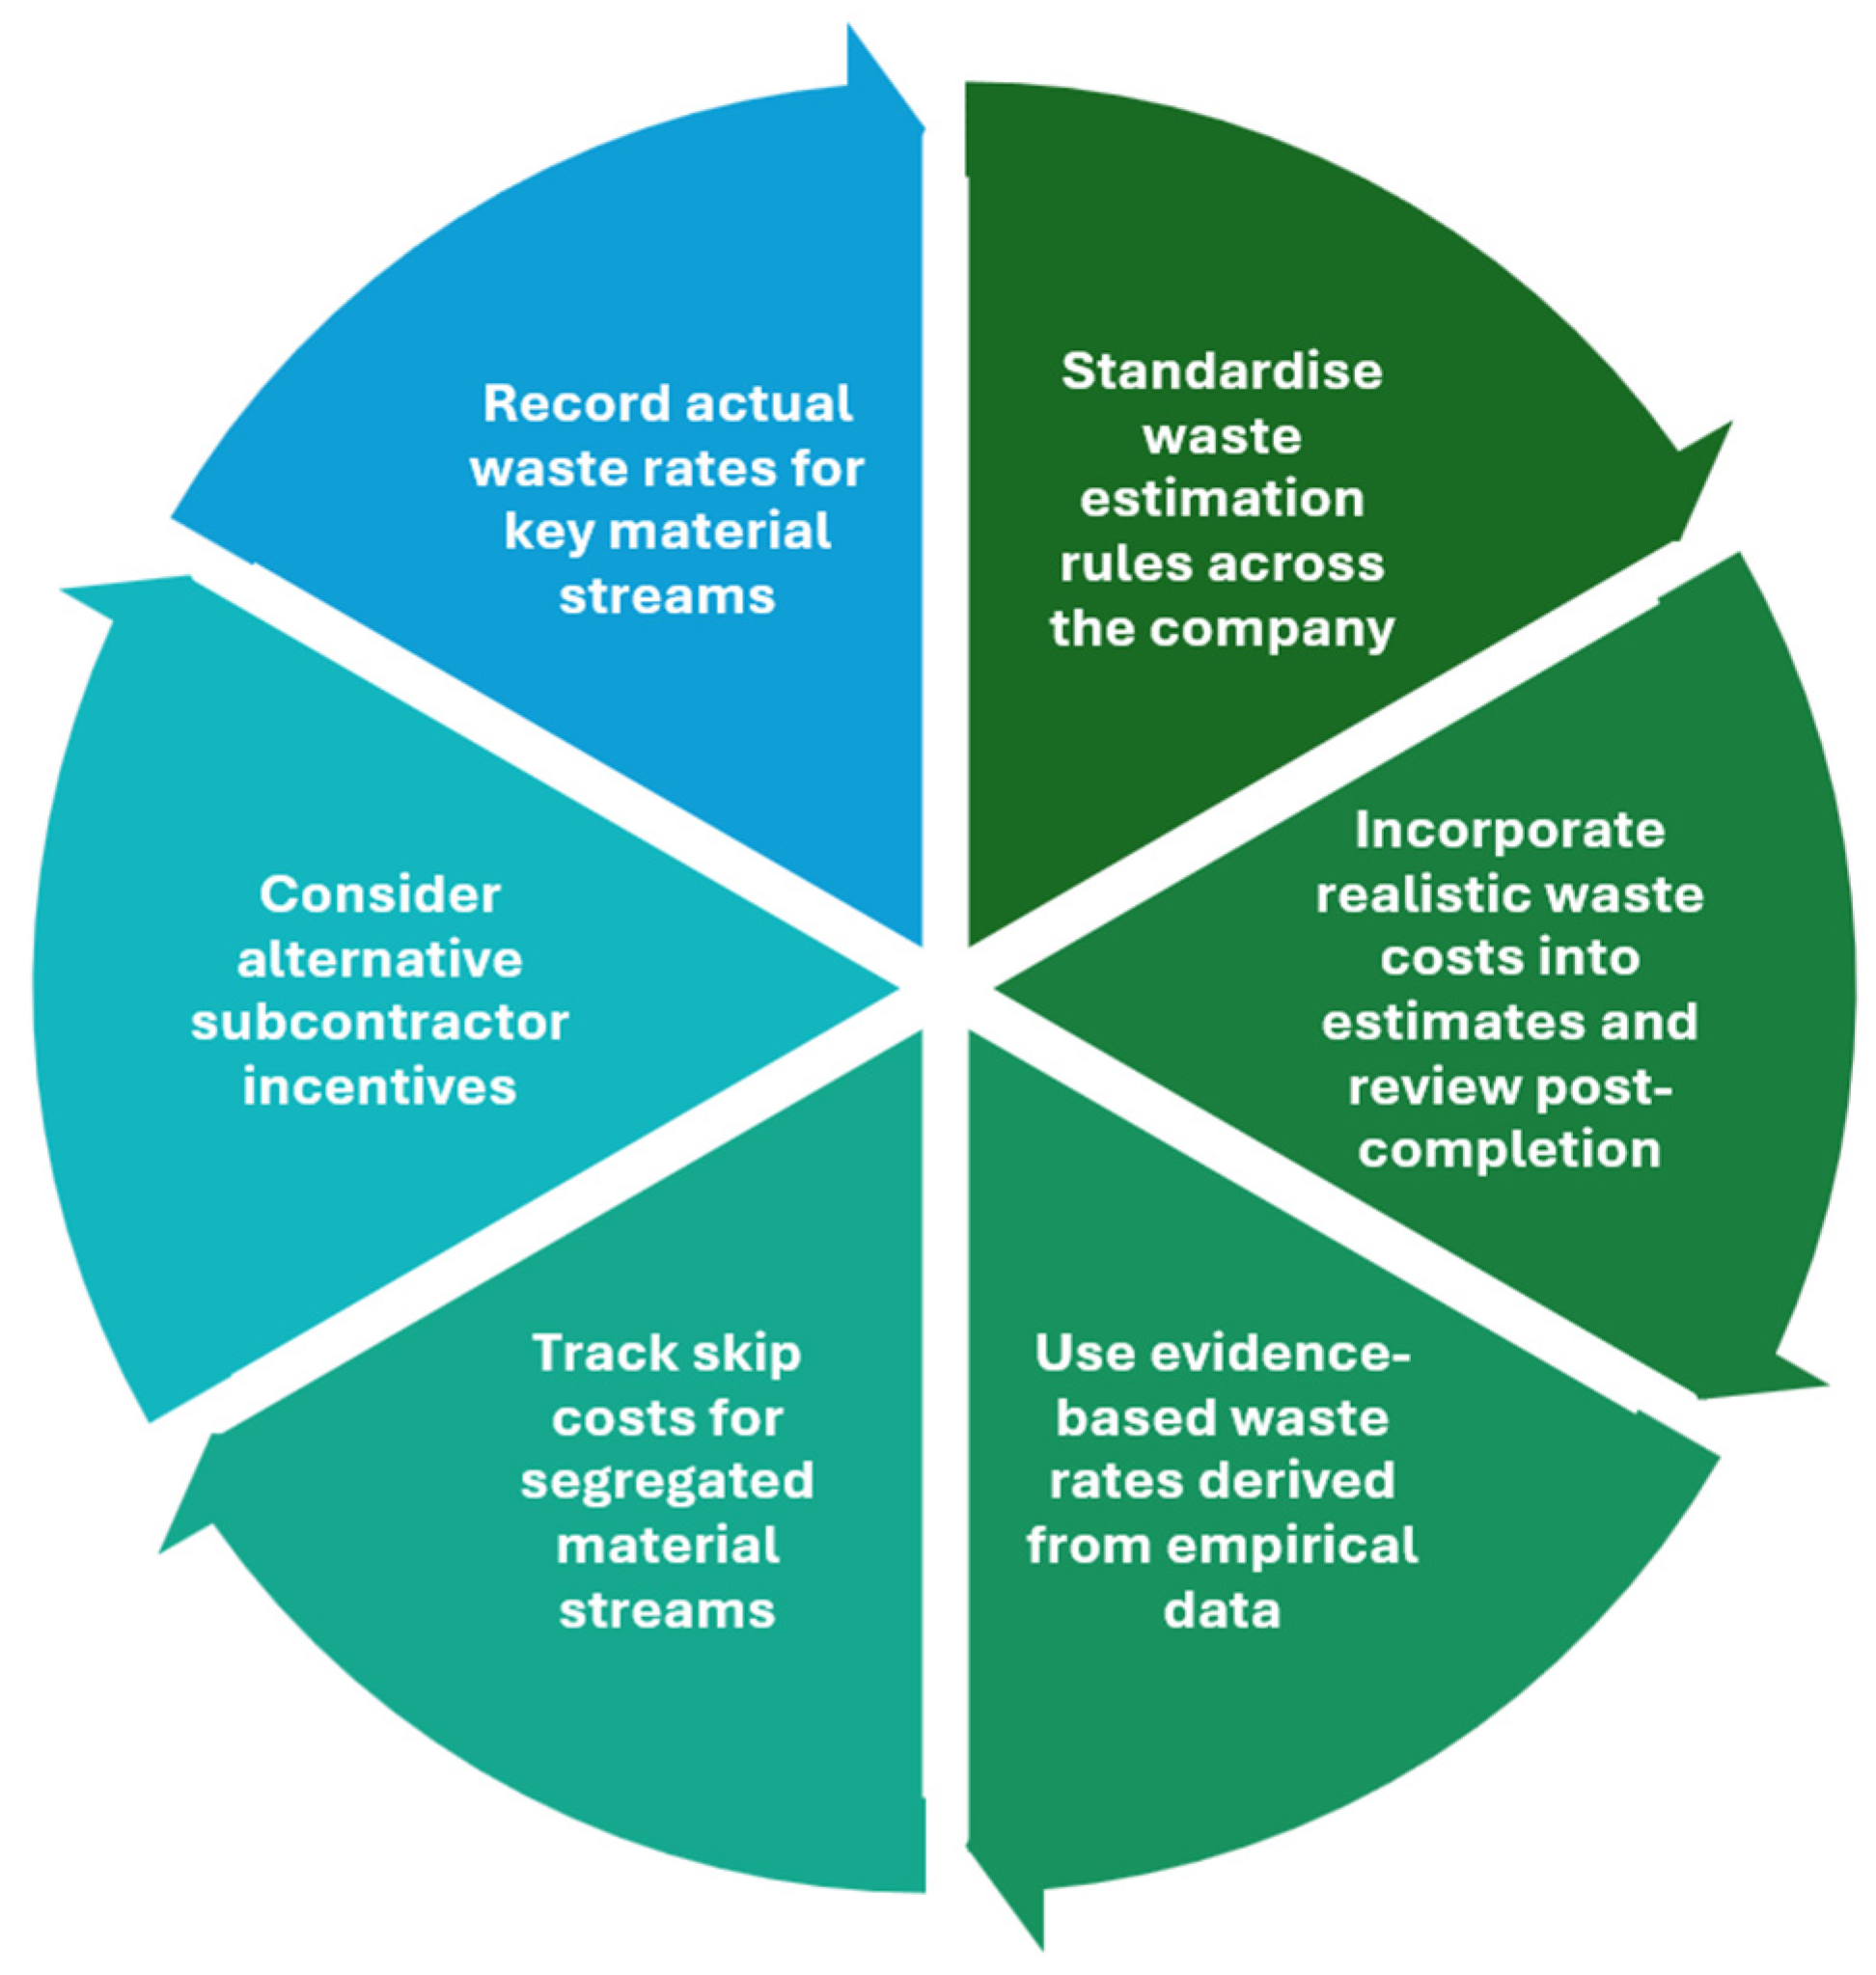
This paper highlights adoption of an estimating feedback loop as a structured mechanism for reducing both the financial and carbon impacts of material waste in housebuilding. As illustrated in Figure 10, the feedback loop establishes a continuous process of measurement, review, and refinement. By comparing estimated material requirements with actual usage and waste outcomes, project teams can identify systematic variances, update estimating assumptions, and adjust procurement practices accordingly.
Key steps in the feedback cycle include:
  • Standardising waste estimation methodologies to ensure consistency and comparability across projects.
  • Incorporating realistic costs for key waste streams into initial estimates and validating them against actual outcomes at project completion.
  • Basing waste rate assumptions on empirical data collected through the feedback loop to improve forecasting accuracy.
  • Monitoring disposal costs for segregated material streams (e.g., plasterboard, timber) and developing targeted reduction strategies.
  • Exploring alternative subcontractor incentives, such as counter-charging for skip use, to encourage more efficient material handling.
  • Capturing detailed data on waste generation by material type to inform future planning and performance benchmarking.
This cyclical process embeds learning into future project stages, enabling the sector to reduce waste proactively rather than reactively. If implemented consistently, such a framework could help capture the substantial cost and carbon savings demonstrated in this research while also supporting broader industry commitments to resource efficiency and net-zero carbon trajectories. Understanding drivers and barriers for feedback data analysis will ultimately enable effective change.

5. Conclusions

This research has demonstrated the financial value and environmental impact of excess material usage, and how, cumulatively, marginal savings add up to offer significant potential for saving costs and reducing carbon at a critical time for housing and climate. Furthermore, for social house builders, this method for saving not only illustrates savings that might fund the delivery of social homes at no additional cost, but it also highlights the potential for additional rental revenue that could be further reinvested to deliver more social housing.
  • Further research
Given the wide variance in waste rates reported in the literature, and the inconsistent application of these rates across observed schemes, there is a strong case for house builders to undertake more rigorous analysis of waste generation. Improved analysis would support a more accurate evaluation of the effectiveness of quantity-measurement practices and the benefits of applying robust waste-rate assumptions. It would also provide clearer insight into how subcontractors value materials and utilise skips.
For social house builders in particular, disclosing such information through annual sustainability reporting and development-level carbon assessments would create a valuable evidence base. This data would enable researchers to monitor trends, assess the success of waste-reduction initiatives, and support the refinement of embodied-carbon assessment methodologies across the sector.
  • Limitations of the study
The findings presented in this paper should be considered in light of several limitations. The analysis of material efficiency across the three completed housing schemes relied on project documentation that varied in quality, completeness, and format. Differences in how project estimators recorded estimates, orders, and waste meant that calculated waste rates were partly dependent on the reliability of available data. This challenge was particularly evident in work packages procured on a supply-and-fix basis, where material quantities could not be cleanly separated from labour costs, requiring assumptions that introduce uncertainty.
The researchers also examined estimator allowances without assessing the underlying rationale behind them. Estimators may apply conservative or optimistic waste rates for commercial, contractual, or risk-management reasons that do not necessarily reflect expected site performance. Without insight into these decision-making processes, discrepancies between estimated and actual waste cannot be fully attributed to inefficiency alone.
The controlled case study, while enabling detailed measurement of waste from a single four-bedroom home, represents only one house type, one contractor, and one set of site conditions. Waste outcomes are influenced by design complexity, sequencing, workforce behaviour, and site logistics, all of which vary widely across developments. As such, the results cannot be assumed to be representative of broader housebuilding practice.
Further analysis of this aspect of the research focused on five material streams selected for their cost and carbon significance. Although these materials account for a substantial proportion of waste, the exclusion of other materials—particularly those associated with site infrastructure such as roads, drainage, utilities, and external works—means the total waste burden of housing developments is not fully captured. This is especially relevant for multi-plot schemes where infrastructure works can generate significant additional waste.
Finally, the research period coincided with a volatile economic context characterised by post-pandemic supply chain disruption and material price inflation. These conditions may have influenced ordering behaviour, contingency allowances, and waste outcomes in ways that differ from more stable market periods.

Author Contributions

Conceptualization, E.S. and R.F.; methodology, E.S. and R.F.; validation, E.S. and R.F.; formal analysis, ES.; investigation, E.S.; resources, E.S.; data curation, E.S.; writing—original draft preparation, E.S.; writing—review and editing, E.S. and R.F.; visualization, E.S. supervision, R.F.; project administration, E.S. and R.F. All authors have read and agreed to the published version of the manuscript.

Funding

This research took place as part of a Knowledge Transfer Partnership (KTP) between Sanctuary Housing Association and the University of Lincoln and was funded by Innovate UK.

Data Availability Statement

The original contributions presented in this study are included in the article material. Further inquiries can be directed to the corresponding authors.

Conflicts of Interest

The authors declare no conflict of interest.

References

  1. HM Government. Construction 2025. Industrial Strategy: Government and Industry in Partnership; GOV.UK; HM Government: London, UK, 2013. Available online: https://assets.publishing.service.gov.uk/media/5a7b7ea140f0b62826a03f2c/bis-13-955-construction-2025-industrial-strategy.pdf (accessed on 11 September 2025).
  2. Dziekonski, D.; Mascarenhas, F.; Mahamadu, A.M.; Manu, P. Investigation into the key barriers to achieving UK “Construction 2025” Strategy targets. Eng. Manag. Prod. Serv. 2023, 15, 116–127. [Google Scholar] [CrossRef]
  3. Thomas, D.R. A General Inductive Approach for Analyzing Qualitative Evaluation Data. Am. J. Eval. 2006, 27, 237–246. [Google Scholar] [CrossRef]
  4. Pratt, M.G.; Sonenshein, S.; Feldman, M.S. Moving beyond templates: A bricolage approach to conducting trustworthy qualitative research. Organ. Res. Methods 2022, 25, 211–238. [Google Scholar] [CrossRef]
  5. Osmani, M. Construction Waste. In Waste: A Handbook for Management; Letcher, T., Vallero, D., Eds.; Academic Press: Cambridge, MA, USA, 2011; pp. 207–218. [Google Scholar]
  6. DEFRA. UK Statistics on Waste 2025 Dataset; GOV.UK; DEFRA: London, UK, 2025. Available online: https://www.gov.uk/government/statistics/uk-waste-data (accessed on 24 September 2025).
  7. The Waste (England and Wales) Regulations 2011. Available online: https://www.legislation.gov.uk/uksi/2011/988/contents (accessed on 24 September 2025).
  8. The Controlled Waste (England and Wales) Regulations 2012. Available online: https://www.legislation.gov.uk/uksi/2012/811/contents (accessed on 24 September 2025).
  9. Adams, K.; Thornback, J. How Much Waste is Produced by the Construction Sector? CPA: London, UK, 2022. [Google Scholar]
  10. Chen, K.; Wang, J.; Yu, B.; Wu, H.; Zhang, J. Critical Evaluation of Construction and Demolition Waste and Associated Environmental Impacts: A Scientometric Analysis. J. Clean. Prod. 2020, 287, 125071. [Google Scholar] [CrossRef]
  11. Kiesnere, G.; Atstaja, D.; Cudecka-Purina, N.; Susniene, R. The Potential of Wood Construction Waste Circularity. Environments 2024, 11, 231. [Google Scholar] [CrossRef]
  12. Ratnasabapathy, S.; Perera, S.; Alashwal, A.; Lord, O. Assessment of Waste Generation and Diversion Rates in Residential Construction Projects in Australia. In Proceedings of the CIB World Building Congress, Hong Kong, China, 17–21 June 2019. [Google Scholar]
  13. Martins, F.P.; Soldal, O.B.; Stefanelli, N.O.; Botelho, A.B. A Scoping Review of Construction and Demolition Waste Management and the Sustainable Development Goals: Evidence from Brazil. Sustain. Dev. 2025, 34, 544–555. [Google Scholar] [CrossRef]
  14. Agha, A.; Shibani, A.; Hassan, D.; Zalans, B. Modular Construction in the United Kingdom Housing Sector: Barriers and Implications. J. Archit. Eng. Technol. 2021, 10, 236. [Google Scholar]
  15. Loizou, L.; Barati, K.; Shen, X.; Li, B. Quantifying Advantages of Modular Construction: Waste Generation. Buildings 2021, 11, 622. [Google Scholar] [CrossRef]
  16. Chen, C. Advantages and barriers of modular construction method in constructing buildings. Proc. Inst. Civ. Eng. Smart Infrastruct. Constr. 2023, 176, 75–84. [Google Scholar] [CrossRef]
  17. QFlow. The UK Construction Industry; Annual Waste Report 2023; QFlow: London, UK, 2023; Available online: https://qualisflow.com/uk-construction-waste-report-2023/ (accessed on 17 October 2025).
  18. HM Treasury. Public Expenditure Statistical Analyses 2024; GOV.UK; HM Treasury: London, UK, 2024. Available online: https://www.gov.uk/government/statistics/public-expenditure-statistical-analyses-2024 (accessed on 22 October 2025).
  19. RIBA. Foundations for the Future: A New Delivery Model for Social Housing; RIBA: London, UK, 2024; Available online: https://www.riba.org/campaigns/policies/social-housing-report/ (accessed on 22 October 2025).
  20. Redrow. Reduce the Rubble; Redrow: Wales, UK, 2020. [Google Scholar]
  21. New Economics Foundation. Good, Green Homes for All; NEF: London, UK, 2025; Available online: https://neweconomics.org/2025/10/good-green-homes-for-all (accessed on 11 November 2025).
  22. Department for Levelling Up, Housing & Communities. Energy Performance of Buildings Data: England and Wales; GOV.UK; Department for Levelling Up, Housing & Communities: London, UK, 2024. Available online: https://epc.opendatacommunities.org/login (accessed on 24 October 2025).
  23. UKGBC. Building the Case for Net Zero: Closing the Gap Towards Net Zero Carbon New-Build Homes; UK Green Building Council: London, UK, 2022. [Google Scholar]
  24. RIBA. 2030 Climate Challenge, 2nd ed.; RIBA: London, UK, 2021. [Google Scholar]
  25. Greater London Authority. London Plan Guidance: Whole Life-Cycle Carbon Assessments; Greater London Authority: London, UK, 2022.
  26. RICS. Professional Standard. Whole Life Carbon Assessment for the Built Environment, 2nd ed.; RICS: London, UK, 2024. [Google Scholar]
  27. The Brick Development Association. Environmental Product Declaration: UK Clay Brick [Issue 4]; BRE: Watford, UK, 2024. [Google Scholar]
  28. Future Homes Hub. Whole Life Carbon Conventions and Simple Tool; FHH WLC Conventions V1.0 APPENDIX A—Default Material and Carbon Data; Future Homes Hub: London, UK, 2024; Available online: https://futurehomes.org.uk/wlc-tool (accessed on 9 April 2025).
  29. Brickhunter. How to Calculate the Number of Bricks You Need. UK. 2024. Available online: https://brickhunter.com/blog/how-to-calculate-the-number-of-bricks-you-need?srsltid=AfmBOoqNEvgx1PqFWyRtmo2MBkhT85OQZgz1EL3q2CZj2jeuoamuduvy (accessed on 9 April 2025).
  30. Cartlidge, D. Estimator’s Pocket Book, 2nd ed.; Routledge: London, UK, 2019. [Google Scholar]
  31. Adams, K.; Hobbs, G. Final Report: Wastage Rates for Blocks and Ready Mixed Concrete; Reusefully: Bedford, UK, 2023. [Google Scholar]
  32. British Gypsum Saint Gobain. Environmental Product Declaration: Gyproc WallBoard 12.5 mm [Version 3]; The International EPD System; British Gypsum Saint Gobain: Loughborough, UK, 2024. [Google Scholar]
  33. Knauf. Environmental Product Declaration: Knauf Wallboard, Baseboard and Plank Plasterboard 9.5, 12.5, 15 and 19 mm; The International EPD System; Knauf: Camellia, Australia, 2022. [Google Scholar]
  34. WRAP. Plasterboard Case Study: Reducing and Recycling Plasterboard Waste on a Site Where Space Is a Constraint; WRAP: Banbury, UK, 2015. [Google Scholar]
  35. Isover Saint Gobain. Environmental Product Declaration: Cavity Wall Slab (CWS) 32.65 mm–100 mm; The International EPD System; Isover Saint Gobain: Courbevoie, France, 2022. [Google Scholar]
  36. EPD Hub. Environmental Product Declaration: IP PIR 022; One Click LCA; EPD Hub: Amsterdam, The Netherlands, 2023. [Google Scholar]
  37. The RICS. Life Cycle Costing Standard, 1st ed.; RICS: London, UK, 2025. [Google Scholar]
  38. BRE. SmartWaste. Available online: https://bregroup.com/products/smartwaste (accessed on 20 November 2025).
  39. Allwood, J.M.; Cullen, J.M.; Carruth, M.A.; Cooper, D.R.; McBrien, M.; Milford, R.L.; Moynihan, M.C.; Patel, A.C.H. Material efficiency: A white paper. Resour. Conserv. Recycl. 2011, 55, 362–381. [Google Scholar] [CrossRef]
  40. Koskela, L. Application of the New Production Philosophy to Construction; Technical Report No. 72; Center for Integrated Facility Engineering (CIFE), Stanford University: Stanford, CA, USA, 1992. [Google Scholar]
  41. Ballard, G.; Howell, G. Implementing Lean Construction: Understanding and Action. In Proceedings of the 6th Annual Conference of the International Group for Lean Construction (IGLC-6), Guarujá, Brazil, 13–15 August 1998. [Google Scholar]
  42. Ballard, G.; Howell, G. What Kind of Production Is Construction? In Proceedings of the 6th Annual Conference of the International Group for Lean Construction (IGLC-6), Guarujá, Brazil, 13–15 August 1998. [Google Scholar]
  43. Koskela, L. An Exploration Towards a Production Theory and Its Application to Construction; VTT Technical Research Centre of Finland: Espoo, Finland, 2000. [Google Scholar]
  44. Koskela, L.; Ballard, G.; Howell, G.; Tommelein, I. The Foundations of Lean Construction. In Proceedings of the 15th Annual Conference of the International Group for Lean Construction (IGLC-15); Koskela, L., Bertelsen, P., Eds.; Michigan State University: East Lansing, MI, USA, 2007; pp. 213–226. [Google Scholar]
  45. Kirchherr, J.; Reike, D.; Hekkert, M. Conceptualizing the circular economy: An analysis of 114 definitions. Resour. Conserv. Recycl. 2017, 127, 221–232. [Google Scholar] [CrossRef]
  46. Wastesure: The Consequences of Plasterboard Contamination: Compliance and Cost Implications. UK. 2024. Available online: https://www.wastesure.com/skip-hire-guides/the-consequences-of-plasterboard-contamination-compliance-and-cost-implication (accessed on 13 October 2025).
  47. Housing Today. Rayner Announces New Target of 370,000 Homes as She Reveals Plan for NPPF Changes. 2024. Available online: https://www.housingtoday.co.uk/news/rayner-announces-new-target-of-370000-homes-as-she-reveals-plan-for-nppf-changes/5130731.article (accessed on 24 October 2025).
Figure 1. Updated modular diagram including submodules for WLC building assessment described in RICS Whole Life Carbon Assessment Standard 2nd Edition, 2024 [26].
Environments 13 00290 g001
Figure 2. Highlights materials that are both high cost and high carbon, with the green circle indicating those with the highest combined impact.
Environments 13 00290 g002
Figure 3. Ground and first floor layouts of the studied unit supplied by the housing association.
Environments 13 00290 g003
Figure 4. Photograph of the study compound set-up on site, designed to facilitate the storage and measurement of waste during the controlled study.
Environments 13 00290 g004
Figure 5. Photographs taken during the study of brick and block waste that was transferred from the tipping skip to the compound area for recording, and ironstone brick waste (used as a facing material) being measured for input into the Construction Waste Indicative Cost (CWIC) Calculator.
Environments 13 00290 g005
Figure 6. Screenshot of Construction Waste Indicative Cost (CWIC) Calculator.
Environments 13 00290 g006
Figure 7. Waste rates of key material streams measured on-site.
Environments 13 00290 g007
Figure 8. Example of the traditional aesthetic produced by using irregular size ironstone bricks, contrasted with the consistent facing bond achieved with the standard bricks used below, highlighting the potential for ironstone to increase material waste.
Environments 13 00290 g008
Figure 9. Carbon impact of five key material streams measured on-site.
Environments 13 00290 g009
Figure 10. Example of an estimating feedback loop illustrating the key steps needed to enable cost and carbon savings through improved material-efficiency practices.
Environments 13 00290 g010
Table 2. Summary of factors that drive waste in housebuilding found in Redrow’s Reduce the Rubble study (2020) [20].
Sources of WasteCauses
DesignFrequent design changes, detailed design specifications
OffcutsCutting materials to sizes
ProcurementSupplier’s error, over-ordering
PackagingExcess material product packaging
Material handlingTransportation, off-loading, inappropriate handling
OperationsTradesperson’s error (quality, repairs), material efficiency
Material protectionBad weather (rain and wind)
Table 3. Material efficiency analysis and the cost and carbon impacts of five key material streams.
SchemeNo. of HousesAverage Cost of Construction MaterialInitial % of Waste Allowed forTotal % of Product WastedTotal Value of Product WastedCost Added (£/Home)Amount of Carbon Added Due to Waste (kgCO2e)
Site A15£179,079Blocks10%15%£7780.03£518.6712,997.8
Traditional brick & block build Facing Bricks10%9%£6771.60£451.443493.5
Insulation10%17%£5523.34£368.22876.8
Plasterboard* not identified35%£7240.03£482.671109.43
Joists0%0.5%£65.58£4.370.16
Site B110£176,721Blocks5%8.41%£3540.35£32.191258.3
Pre-manufactured timber frame Facing Bricks5%5%£28,044£254.9534.5
Insulation0%3%£5822£52.938.5
Plasterboard* not identified13%£20,531.79£186.653145.0
Joists0%2%£25,338.54£230.354
Site C34£173,117Blocks5%9.20%£7880.11£231.7717,874.4
Traditional brick & block build Facing Bricks5%20%£37,168.28£1093.1836,683.5
Insulation5%5%£876.00£25.761336.8
Plasterboard* not identified4%£1713.72£50.40262.71
Joists0%0%£0.00£0.000
* Denotes where the percentage of plasterboard waste allowed for was not known and could not be identified due to lump-sum material-and-labour packages obscuring the underlying material allowances.
Table 4. Cumulative cost and carbon impacts added to each home on each scheme.
SchemeTotal Cost of Excess Material Added per HouseCost of Excess Material as a % of Build CostTotal Carbon Added Due to Waste (kgCO2e)Carbon Added per House (tCO2e)
Site A£1825.371%18,477.571.23
Site B£757.060.4%4441.80.04
Site C£1401.120.8%56,157.31.7
Table 5. Illustrates the significant variance in waste rates between those cited in the literature, standard estimator allowances, and the rates observed when comparing initial orders with final spend data.
MaterialReference Wastage RatesDeveloper Estimated RatesActual Rates Measured
Bricks5–12.5%5–10%5–20%
Blocks3–7.5%5–10%8.4–15%
Insulation2–7%5–10%3–17%
Plasterboard4–35%* not identified4–35%
Timber joists2–7.5%0%0.5–2%
* Denotes where the percentage of plasterboard waste allowed for was not known and could not be identified due to lump-sum material-and-labour packages obscuring the underlying material allowances.
Disclaimer/Publisher’s Note: The statements, opinions and data contained in all publications are solely those of the individual author(s) and contributor(s) and not of MDPI and/or the editor(s). MDPI and/or the editor(s) disclaim responsibility for any injury to people or property resulting from any ideas, methods, instructions or products referred to in the content.