Article

Spatial Assessment of Asbestos Fiber Release Potential in a Post-Ban Urban Environment: Cartagena, Colombia

by
María A. Narváez-Cuadro
1,
Aiken H. Ortega-Heredia
1,
Manuel Saba
1,*,
Leydy Karina Torres Gil
1 and
Oscar E. Coronado-Hernández
2
1
Department Civil Engineering, Universidad de Cartagena, Calle 30 # 48-152, Cartagena 130001, Colombia
2
Institute of Hydraulics and Environmental Sanitation, Universidad de Cartagena, Calle 30 # 48-152, Cartagena 130001, Colombia
*
Author to whom correspondence should be addressed.
Environments 2026, 13(6), 289; https://doi.org/10.3390/environments13060289 (registering DOI)

Submission received: 13 April 2026 / Revised: 12 May 2026 / Accepted: 20 May 2026 / Published: 24 May 2026

Abstract

Urban environments in developing countries remain affected by legacy asbestos-containing materials, yet integrated assessments of multi-pathway asbestos release and environmental mobilization integrated with demographic distribution remain limited. This study aimed to develop a spatially explicit framework to assess environmental deterioration and asbestos-related environmental hazard where multiple asbestos release pathways converge in a post-ban urban setting, using Cartagena, Colombia, as a case study. A multi-pathway approach was implemented, combining source characterization of asbestos-cement (AC) roofs through microvacuum sampling, analysis of roof runoff and drinking water, spatial distribution of AC pipelines, and demographic data at the neighborhood scale. A total of 72 roof surface samples were collected, of which 92% showed detectable asbestos fibers, with concentrations reaching up to 326 × 106 structures/cm2. Runoff water analysis indicated 85% detection, with average concentrations of 3.5 ± 3.14 million fibers per liter (MFL). Drinking water samples showed 11% positivity, with lower concentrations (mean 1.01 ± 1.59 MFL). Spatial analysis revealed that approximately 9.5% of the urban area exhibited high airborne release potential and 3.1% exhibited high runoff-related hazard, while integrated spatial prioritization identified 5.59% of the city as high priority for intervention. Results indicated that less deteriorated roofs exhibited higher surface fiber availability, suggesting that emission potential is not directly proportional to visible degradation. The integration of environmental and demographic data supported the identification of critical hotspots where multiple asbestos release pathways converge. The proposed methodology provides a novel framework for multi-pathway asbestos spatial prioritization in urban environments and highlights the need for source-based monitoring approaches. These findings support the development of targeted mitigation strategies in cities with widespread legacy asbestos infrastructure.

1. Introduction

Urban environments have undergone significant environmental deterioration as a consequence of industrialization and rapid urban expansion [1,2,3]. Among the most relevant air pollutants are nitrogen dioxide, tropospheric ozone, carbon monoxide, and particulate matter (PM2.5 and PM10), largely associated with vehicular emissions [4,5,6]. Within the fine particulate fraction circulating in urban air, asbestos fibers represent a less frequently addressed but highly hazardous component [7,8,9]. Asbestos, a group of naturally occurring fibrous silicate minerals [10], has been extensively used for decades in construction materials, including asbestos-cement (AC) roofing [11], water storage systems, and piping [12], as well as in friction products and thermal insulation [13,14].
Asbestos is classified as a Group 1 carcinogen [15] by the World Health Organization (WHO) [16] and is responsible for tens of thousands of deaths annually worldwide, primarily due to lung cancer [15,17,18,19,20,21], mesothelioma [22,23,24,25,26], and asbestosis [27]. Traditionally, exposure to asbestos has been considered predominantly occupational [28], occurring during the manufacture or handling of asbestos-containing materials (ACMs). However, increasing evidence highlights the relevance of non-occupational exposure pathways [29,30], including domestic exposure through building materials such as fibrocement panels, and ingestion exposure through drinking water conveyed via AC pipes or stored in AC tanks [31]. In addition, environmental exposure encompasses naturally occurring asbestos (NOA) in soils and rocks, as well as urban airborne asbestos originating from anthropogenic sources [32].
In urban environments, airborne asbestos originates from multiple sources, including demolition activities, industrial practices, vehicular emissions, and the long-term weathering of asbestos-cement (AC) materials [33]. Recent studies indicate that aging AC roofing may constitute a persistent source of environmental fiber release, particularly in cities where these materials remain widespread decades after installation.
A recent systematic review [30] reported detectable airborne asbestos concentrations across diverse urban contexts, even in the absence of active asbestos industries or natural deposits, highlighting strong regional variability. Generally lower concentrations have been reported in European post-ban settings [8], whereas higher levels and clear spatial relationships with traffic intensity have been observed in Middle Eastern urban environments [33]. These differences suggest that asbestos occurrence in urban air is influenced by multiple factors, including dominant emission sources, environmental conditions, and regulatory context.
However, considerable uncertainty remains regarding the mechanisms controlling asbestos release and dispersion in urban environments. Reported concentrations vary substantially depending on analytical methodologies and monitoring approaches [34]. Moreover, although recent studies have incorporated GIS-based frameworks to identify and classify asbestos-containing materials [35], most investigations continue to focus primarily on ambient airborne concentrations and rarely integrate multiple environmental pathways or source-based release indicators.
Taken together, these studies demonstrate that airborne asbestos remains detectable in urban environments worldwide, with concentrations and dominant sources varying significantly across regions. They also highlight important methodological progress in monitoring and spatial analysis. However, they share several critical limitations. First, most studies focus on a single exposure pathway, predominantly airborne asbestos, without integrating other relevant environmental compartments such as drinking water or runoff water from asbestos-cement roofs. Second, although some studies incorporate spatial analysis, few achieve fine-scale resolution at the neighborhood level or explicitly integrate environmental release indicators with demographic distribution. Third, there is limited empirical evidence on the role of weathering of asbestos-cement roofing in generating respirable fibers in outdoor environments, particularly using surface sampling approaches such as microvacuuming following ASTM D5755 (Standard Test Method for Microvacuum Sampling and Indirect Analysis of Dust by Transmission Electron Microscopy for Asbestos Structure Number Surface Loading) and Transmission Electron Microscopy (TEM). Finally, the contribution of asbestos release into rainwater runoff, an environmental mobilization pathway of particular relevance in tropical developing regions where rainwater is directly used for domestic purposes, remains largely unexplored.
These gaps are especially pronounced in urban settings in the Global South, where high densities of aging asbestos-containing infrastructure coexist with vulnerable populations and limited environmental monitoring. Despite the growing body of literature on airborne asbestos, there is still a lack of integrated, multi-pathway, and spatially resolved assessments that allow for the zoning of environmental deterioration and the identification of densely populated areas potentially affected by asbestos release sources at the neighborhood scale.
In this context, the present study aims to develop an integrated assessment of environmental deterioration zoning and demographic distribution in a post-asbestos ban urban setting, using Cartagena, Colombia, as a case study. By integrating multiple lines of evidence, including source characterization of asbestos-cement roofing through releasable fiber analysis as a proxy for emission potential, assessment of fiber mobilization via roof runoff and drinking water, and the spatial distribution of population at the neighborhood level, this study provides a comprehensive evaluation of multi-pathway asbestos release potential and environmental mobilization. This integrated approach supports improved environmental hazard assessment and more informed public health decision-making in developing urban contexts.

2. Materials and Methods

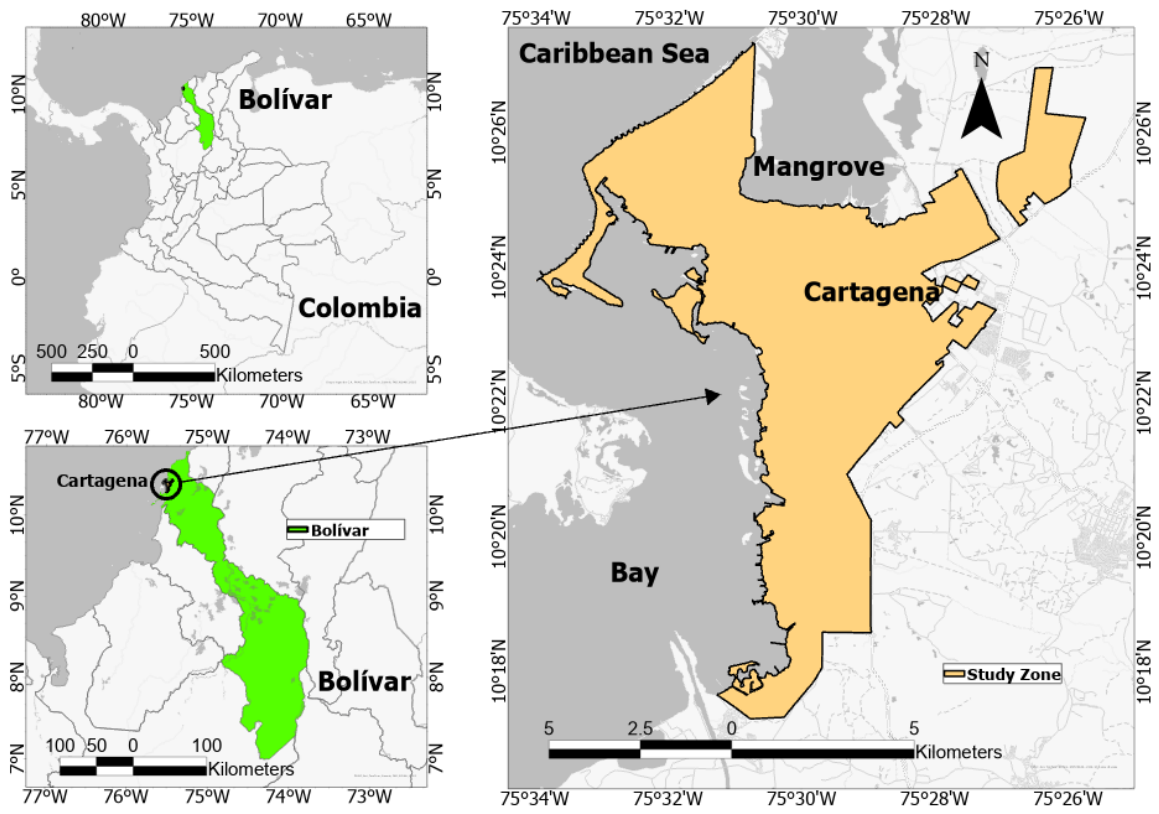
The study area of the present work is the city of Cartagena (10.39972° N, 75.51444° W), located in northern Colombia along the Caribbean Sea. The urban area covers approximately 80 km2 and is home to a population of about one million inhabitants (Figure 1).
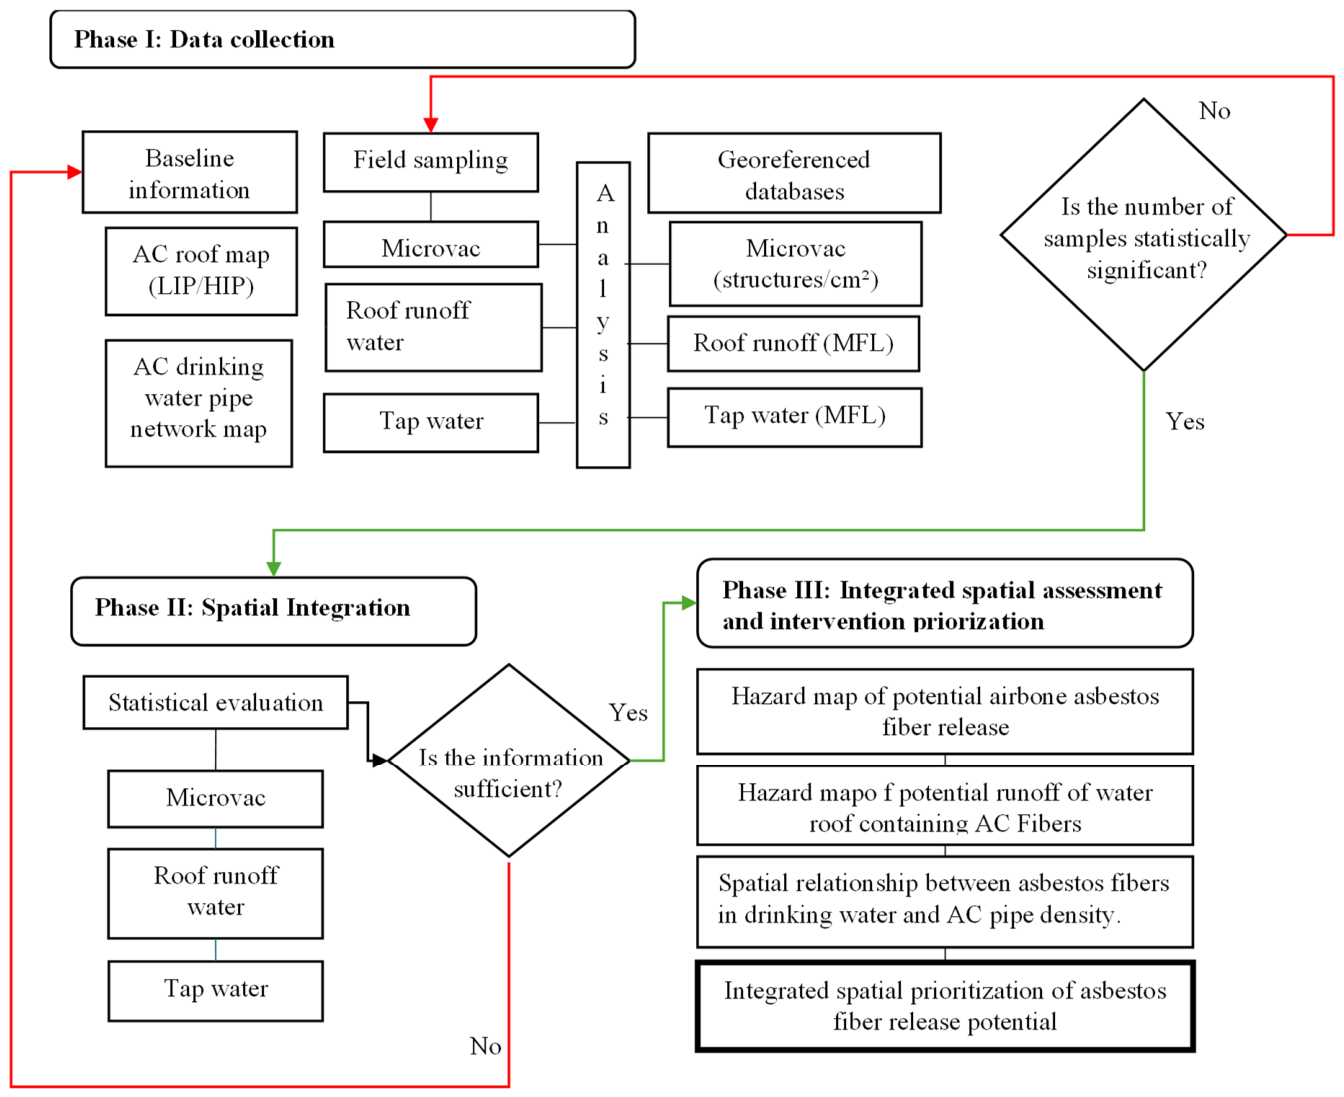
Furthermore, Figure 2 illustrates the overall methodological framework of the study, structured into three sequential phases: Phase I (data collection), Phase II (spatial integration), and Phase III (vulnerability diagnosis). A detailed description of each phase is provided in the following sections.

2.1. Data Acquisition

Phase I focused on the characterization of asbestos-cement (AC) sources and their potential to release fibers into multiple environmental compartments. The identification of primary emission sources was based on a previously developed high-resolution spatial dataset of AC roof distribution and deterioration status in Cartagena, derived from hyperspectral imaging and validated through field observations [36]. In that study, roofs were classified into High Intervention Priority (HIP) and Low Intervention Priority (LIP) categories according to qualitative field criteria, including surface degradation features such as cracks, friability, biological colonization, and evidence of fiber release. In the present work, this classification is adopted as a baseline to guide the selection of sampling locations, assuming that HIP roofs represent areas with higher potential for environmental fiber release. Accordingly, roofs were categorized as HIP when deterioration features were extensively distributed across the surface, indicating a greater likelihood of asbestos fiber release into the surrounding environment. Conversely, roofs exhibiting limited, localized, or no visible degradation were classified as LIP, reflecting a comparatively lower emission potential.
Based on this framework, a field sampling campaign was designed to quantify asbestos fiber presence across three key environmental pathways: direct release from AC roofing materials; mobilization through roof runoff water, and occurrence in drinking water. All sampling locations were georeferenced using high-precision GNSS devices to enable subsequent spatial integration.
Surface fiber release from AC roofs was assessed using the microvacuuming (MicroVac) technique. A total of 72 samples were collected from 10 cm × 10 cm areas using a calibrated suction system (2 L·min−1 for 2 min), following ASTM D5755 [37]. This method allows the quantification of loosely bound and potentially respirable fibers present on the surface of weathered materials. It is important to note that this technique provides an indicator of fiber release potential at the source level and does not represent airborne asbestos concentrations in the breathing zone (f/m3). Samples were analyzed by transmission electron microscopy (TEM) following AHERA-based identification criteria, and results were expressed as structures per square centimeter (structures/cm2).
To evaluate fiber mobilization through precipitation, 40 roof runoff samples were collected from confirmed AC roofs. Deionized water was applied over a standardized surface area (30 cm × 30 cm) to simulate rainfall-induced runoff. Samples were analyzed using TEM in accordance with EPA/600/R-94/134 [38], and results were reported as million fibers per liter (MFL). Additionally, 64 tap water samples were collected across the study area to assess potential fiber presence within the drinking water distribution system. Prior to sampling, taps were flushed for at least three minutes to ensure representative system water. Samples were preserved at 4 °C and analyzed by TEM following U.S. EPA Method 100.2. Results were expressed in MFL to allow comparison with previous studies conducted in similar contexts. To support the interpretation of water-related results, spatial information on the distribution of asbestos-cement drinking water pipes was incorporated. This enabled the exploration of potential relationships between hydraulic infrastructure and the presence of asbestos fibers in tap water, complementing the assessment of roof-derived contributions. Table 1 summarizes the sampling strategy and analytical methods described above.

2.2. Spatial Integration

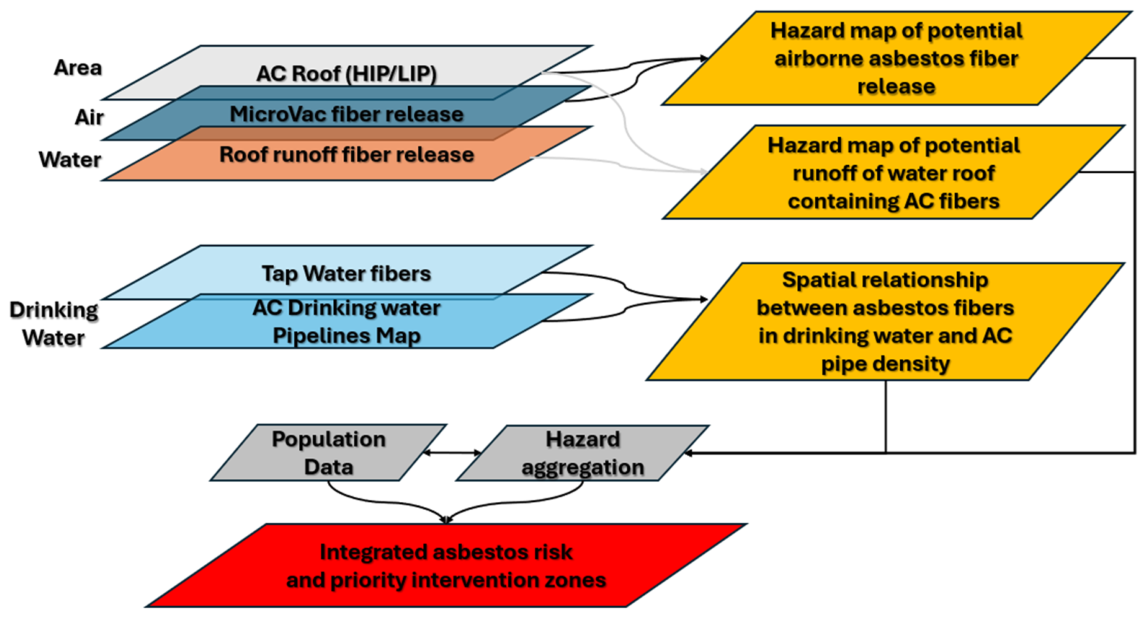
In this phase, a spatially explicit integration of the environmental pathways of asbestos fiber release and transport was performed using Geographic Information System (GIS) tools. Multiple georeferenced datasets generated in Phase I were combined within a unified spatial framework to enable the identification and quantification of environmental hazards at the neighborhood scale. The integrated database included the spatial distribution of asbestos-cement (AC) roofs and their deterioration status (HIP/LIP), fiber concentrations derived from MicroVac surface sampling, asbestos concentrations in roof runoff water and tap water and the spatial distribution of asbestos-cement drinking water pipes (Figure 3). All datasets were standardized, projected into a common coordinate system, and harmonized in terms of spatial resolution. All spatial analyses were conducted in ArcGIS® Pro 3.0, using the MAGNA-SIRGAS/Colombia West Zone coordinate system. Sampling locations obtained during field campaigns were georeferenced using GNSS coordinates and incorporated as point layers, while asbestos-cement roof distributions and neighborhood boundaries were managed as polygon layers. To harmonize datasets with different spatial geometries and scales, all variables were aggregated at the neighborhood level, which served as the common spatial analysis unit throughout the study. Representative mean values derived from MicroVac and runoff sampling were spatially assigned to HIP and LIP roof polygons and subsequently integrated according to the proportional roof area within each neighborhood. Representative examples of the georeferenced datasets and raw sampling distributions are provided in the Appendix A.
To establish a direct relationship between source condition and fiber release, MicroVac and roof runoff sampling points were spatially associated with individual AC roof polygons. This allowed each sample to be linked to a specific deterioration category (HIP or LIP), enabling the comparison of measured fiber concentrations as a function of material condition. Based on these relationships, representative mean fiber concentration values were calculated for HIP and LIP categories and subsequently assigned to all mapped AC roofs according to their classification.
At the neighborhood level, spatial aggregation was performed by combining the total area of HIP and LIP roofs with their corresponding representative fiber release values. This resulted in quantitative indicators reflecting the potential intensity of asbestos fiber emission and mobilization within each territorial unit. These indicators were used to generate continuous spatial surfaces representing the distribution of environmental hazard associated with airborne release (MicroVac-derived) and water-mediated transport (roof runoff).
Tap water data were treated independently within the spatial framework. Measured concentrations were represented as point data, while the density of asbestos-cement pipes was calculated for each neighborhood. This approach allowed for a comparative spatial analysis between observed fiber presence in drinking water and the underlying hydraulic infrastructure, without directly incorporating these variables into the emission-based hazard model. The outcome of this phase consisted of environmental hazard zoning maps that characterize the spatial variability of asbestos-related environmental hazards associated with atmospheric release potential and waterborne transport pathways.

2.3. Spatial Prioritization Framework

The third phase aimed to integrate demographic distribution with environmental hazard indicators in order to identify priority areas for intervention. Demographic data at the neighborhood level were incorporated into the GIS framework, including population density. In addition, four main variables were considered for the overall spatial prioritization: fiber release potential derived from MicroVac sampling, fiber mobilization potential through roof runoff, population density, and the density of asbestos-cement pipes.
To ensure comparability across neighborhoods, all variables were normalized and classified into discrete categories (low, medium, high) based on the most critical condition observed among the analyzed neighborhoods. In this sense, the neighborhood exhibiting the highest values for each variable was used as a reference to define classification thresholds, establishing a relative prioritization scale with respect to the maximum condition identified within the study area. This approach enabled the standardization of indicators and the construction of a consistent basis for the spatial integration of different environmental hazard dimensions.
Based on this classification, spatial metrics were developed to represent two principal components: fiber emission potential, associated with the distribution, condition, and deterioration status of asbestos-cement roofs, and potential fiber release through water pathways, associated with fiber mobilization via roof runoff and the presence of asbestos-cement water supply infrastructure. Additionally, the inclusion of population density allowed the incorporation of the demographic dimension, reflecting the potential magnitude of the population located near identified release sources within each territorial unit.
The combination of these four variables was implemented through a multicriteria classification matrix, enabling the identification of areas where critical conditions converge in terms of emission potential, fiber transport, and population distribution. The result was an Integrated spatial prioritization framework reflecting relative differences among neighborhoods based on the intensity of the observed conditions.
It is important to note that classification into priority levels (low, medium, high) does not imply the absence of asbestos release potential in lower categories. On the contrary, given that asbestos sources and potential pathways for fiber release and transport are distributed throughout the study area, all neighborhoods present some degree of potential asbestos release or environmental mobilization. In this context, the resulting categorization should be interpreted as a prioritization tool, where neighborhoods classified as high priority correspond to those concentrating the most critical conditions across the analyzed variables, while medium and low levels represent comparatively lower-intensity conditions relative to the most critical scenario identified.
All spatial analyses, including overlay operations, proximity analysis, and aggregation of environmental and demographic variables, were conducted using ArcGIS®. Tap water results were presented as a complementary analysis layer, showing the spatial distribution of measured concentrations alongside the density of asbestos-cement pipes, providing additional context for infrastructure-related release pathways.

3. Results and Discussion

For clarity, Section 3 is organized according to the principal environmental pathways evaluated in the study.

3.1. Surface Fiber Release from Asbestos-Cement Roofs

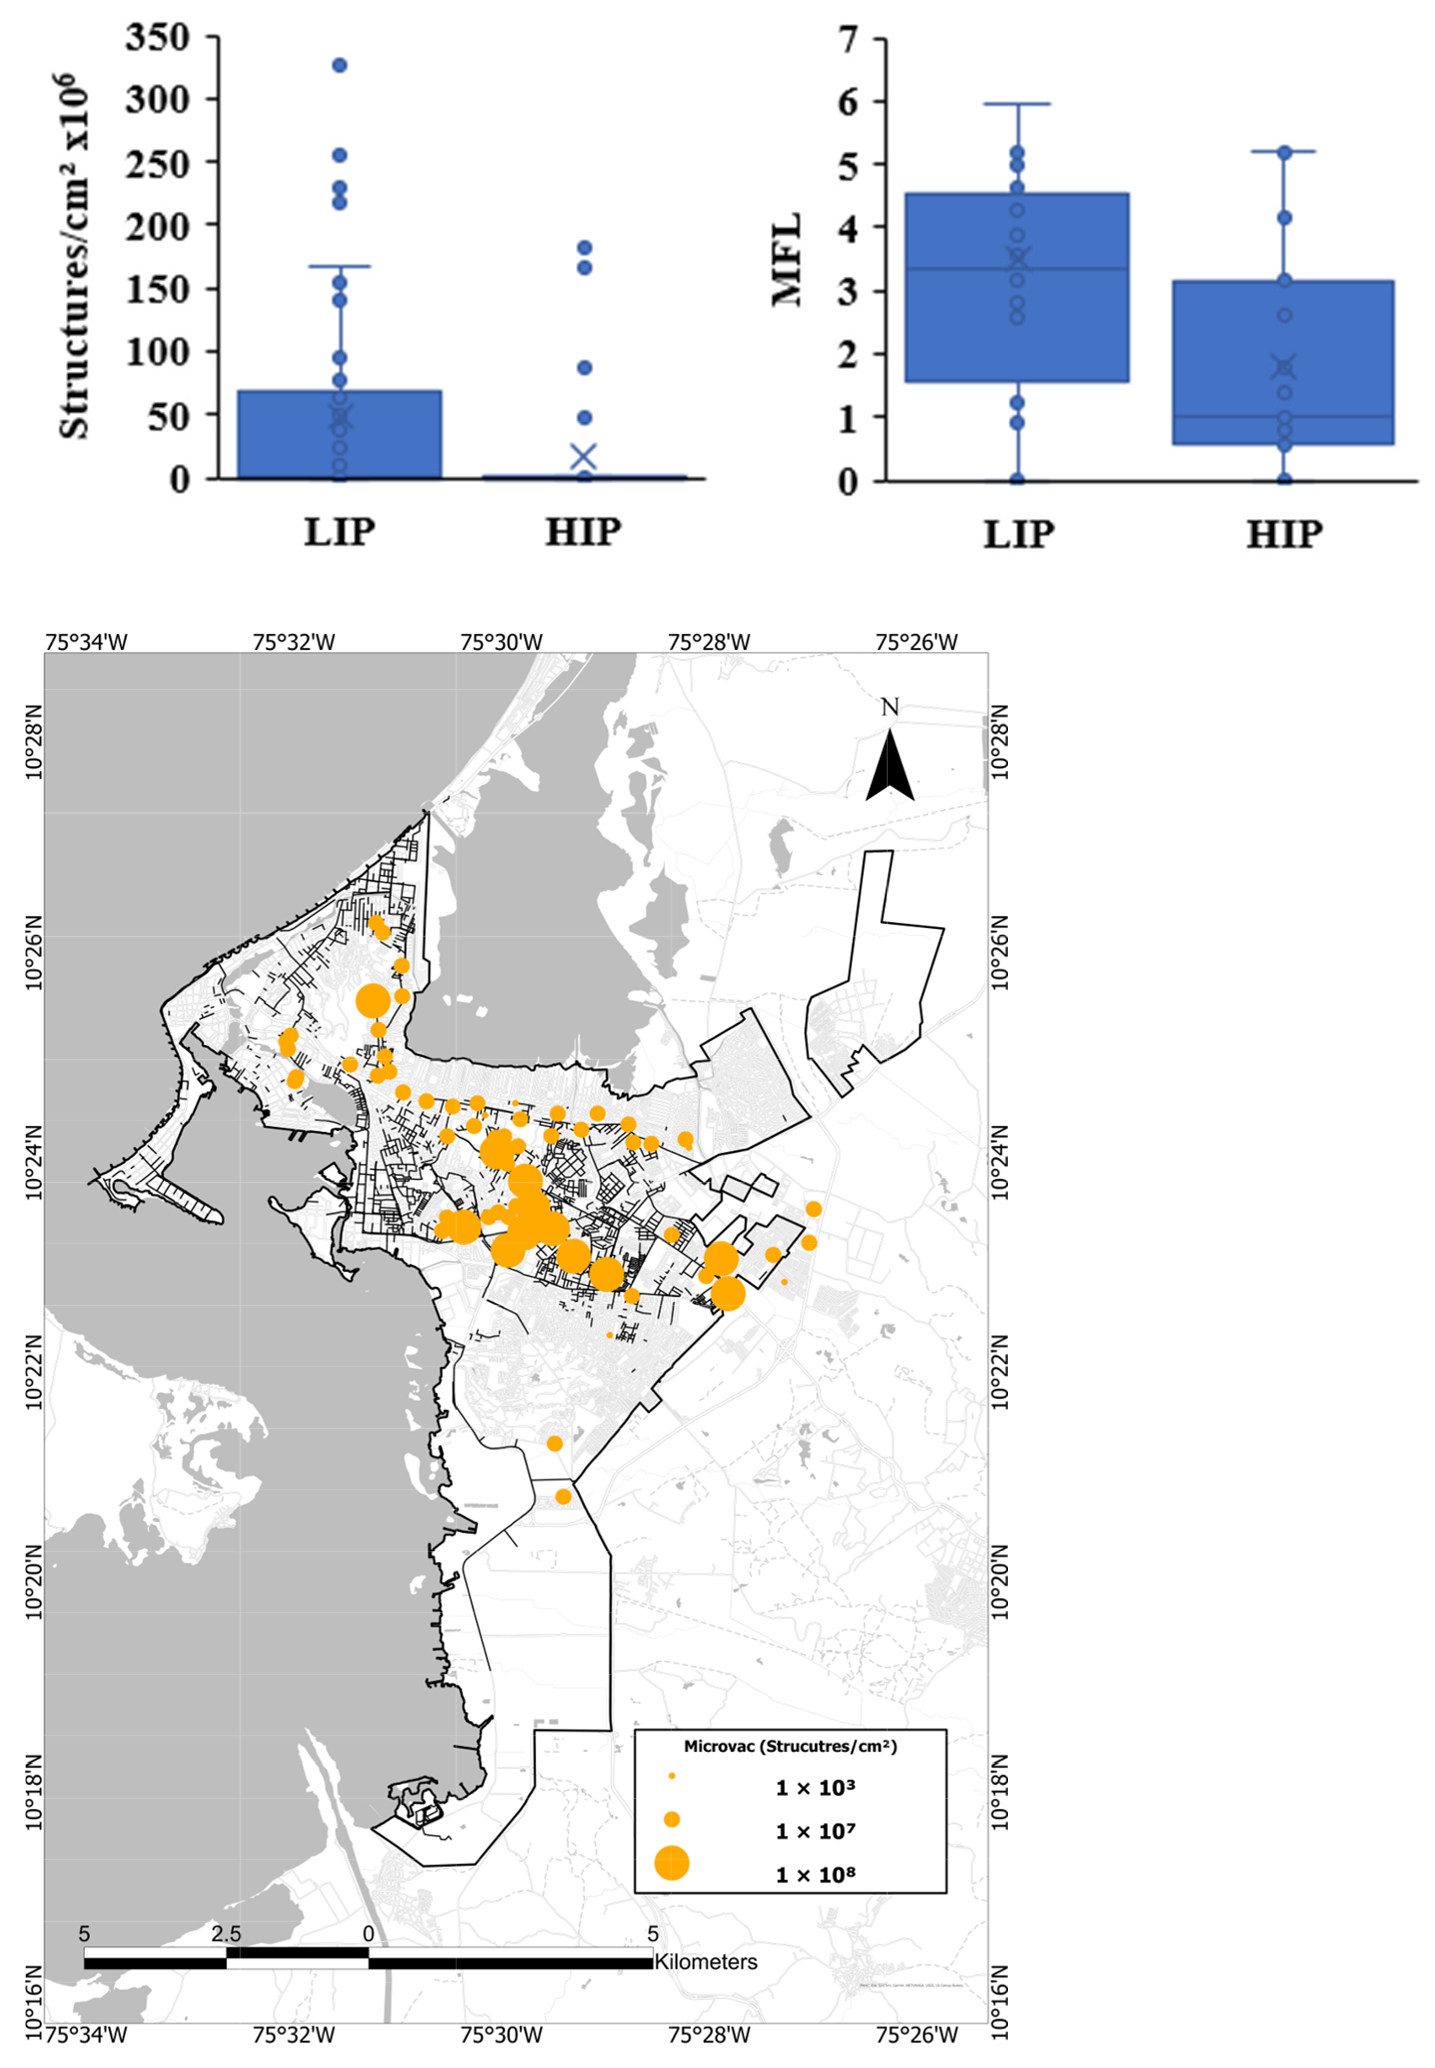
The main findings obtained in the study area are presented below, focusing on asbestos fiber release potential across environmental pathways and their spatial implications. A total of 72 MicroVac samples were analyzed (Figure 4), of which 66 (92%) yielded detectable asbestos fiber concentrations. Measured values reached a maximum of 326 × 106 structures/cm2, with an overall mean of 35.10 × 10⁶ structures/cm2. In parallel, a total of 40 roof runoff water samples were analyzed, of which 34 (85%) yielded detectable asbestos fiber concentrations. Measured values ranged from 0.56 to 14.29 MFL, with an average concentration of 3.5 ± 3.14 MFL. Figure 4 presents the spatial distribution of asbestos fiber concentrations measured at each MicroVac sampling location. Measured concentrations ranged from 2.78 × 10³ to 3.26 × 10⁸ structures/cm2 (Table A1), with the highest values predominantly concentrated in the central area of the city.
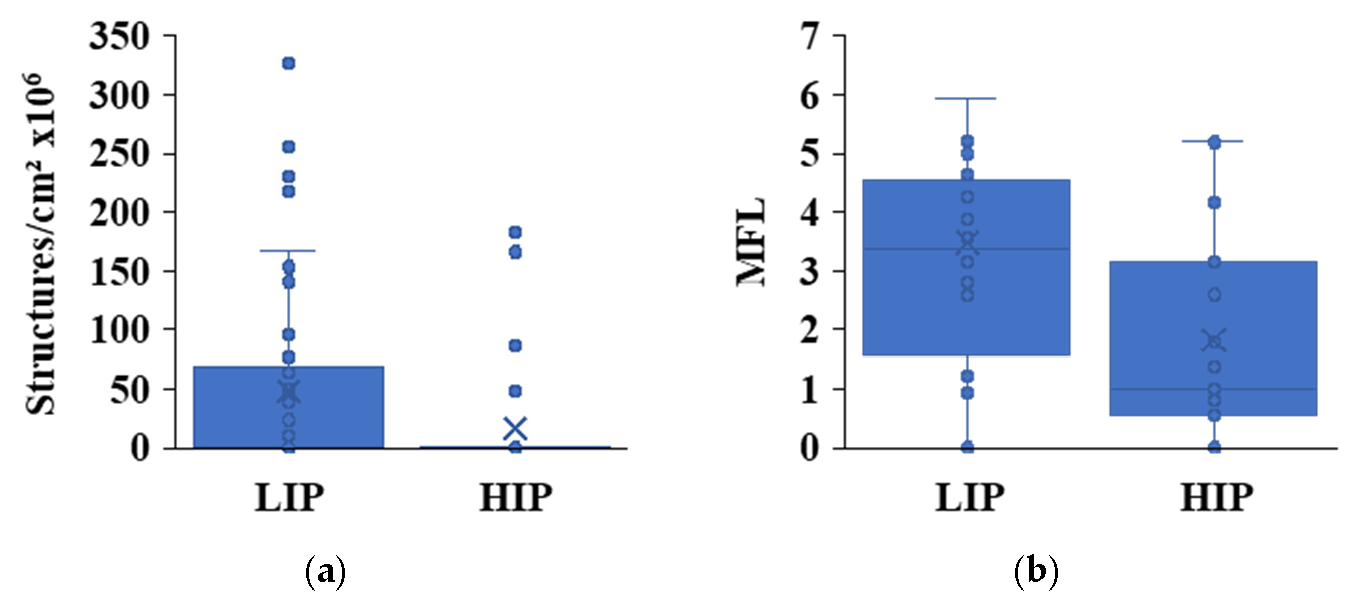
Table 2 summarizes the asbestos fiber concentrations measured in MicroVac and runoff water samples, disaggregated according to roof deterioration category, while Figure 5 presents the distribution of fiber concentrations as a function of roof deterioration status. TEM analysis confirmed that all detected asbestos fibers corresponded to chrysotile asbestos. Representative fibers exhibited the typical elongated and flexible morphology characteristic of serpentine asbestos minerals. Although asbestos identification was systematically performed, detailed morphometric characterization, including fiber length and aspect ratio distributions, was beyond the scope of the present study. Future investigations integrating quantitative fiber morphology analysis could provide additional insight into the relationship between fiber characteristics and environmental release dynamics.
Contrary to initial expectations, both Table 2 and Figure 4 reveal a consistent trend of higher asbestos fiber concentrations associated with roofs classified as Low Intervention Priority (LIP) compared to High Intervention Priority (HIP). The HIP/LIP classification was based on qualitative in situ assessment of deterioration features, including cracking, edge irregularities, surface friability, and biological colonization (e.g., moss, biofilm, or vegetation cover). Previous work by the authors demonstrated that these qualitative indicators are associated with distinct spectral signatures, enabling the large-scale mapping of roof condition across the study area.
Based on this framework, it was initially hypothesized that more deteriorated roofs (HIP) would exhibit greater fiber release potential. However, the present results suggest the opposite pattern (Figure 4). Roofs classified as LIP appear to retain a higher load of loosely bound surface fibers, which may be more readily detached under low-energy disturbances. The MicroVac technique, operating under controlled suction conditions equivalent to a moderate airflow (~6.1 km/h), captures fibers that can be mobilized without direct mechanical disruption. This indicates that relatively intact surfaces may act as reservoirs of releasable fibers, while more degraded roofs may have already lost a substantial fraction of their surface-bound asbestos.
A complementary explanation for this behavior is related to the progressive depletion of releasable fibers in more deteriorated materials. Severely weathered roofs classified as HIP may have experienced prolonged exposure to environmental stressors such as rainfall, wind erosion, and thermal cycling, which can gradually remove loosely bound fibers from the surface. As a result, although these roofs exhibit more advanced structural degradation, their current surface fiber availability may be lower. In contrast, roofs classified as LIP may represent an intermediate stage of material degradation, in which the cementitious matrix begins to weaken and expose embedded fibers, but without having yet undergone significant fiber loss. Under these conditions, fiber availability at the surface may be maximized, leading to higher measured concentrations under controlled sampling.
It is important to emphasize that this interpretation remains hypothetical, as direct physicochemical characterization of the material, such as matrix composition, porosity evolution, or fiber–matrix bonding conditions, was beyond the scope of this study. Therefore, the proposed mechanisms should be understood as conceptual explanations supported by indirect evidence from MicroVac measurements. Future studies integrating mineralogical, chemical, and mechanical analyses would be necessary to confirm these processes and to better elucidate the relationship between material aging and asbestos fiber release dynamics.
This finding is not commonly addressed in the literature, as most environmental studies focus on airborne asbestos concentrations (f/m3), which represent ambient exposure (immissions) at breathing height. In contrast, the present study evaluates emission potential at the source level, providing complementary insight into the mechanisms driving asbestos release from asbestos-cement materials. Therefore, the results should not be interpreted as direct measures of ambient exposure, but rather as indicators of relative emission intensity across the study area.
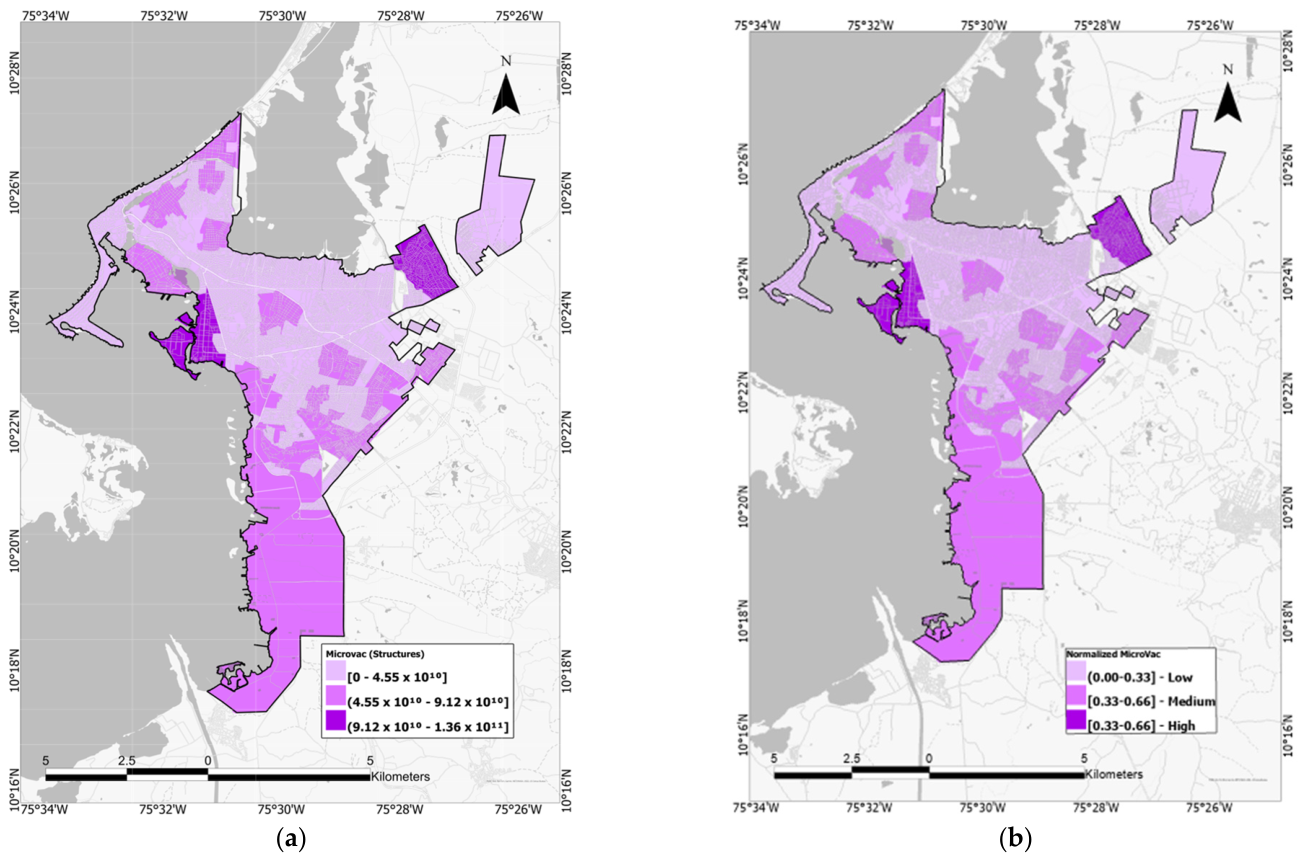
Figure 6 presents the spatial distribution of the priority areas for intervention associated with the potential airborne release of asbestos fibers in Cartagena. The map was constructed by integrating the MicroVac results obtained from 10 cm × 10 cm sampling surfaces (100 cm2), where fiber concentrations were expressed as structures/cm2. Based on Table 2, the mean values for HIP and LIP roofs were extrapolated to a 1 m2 reference surface, yielding representative release values of 16.82 × 10¹⁰ (structures/m2) for HIP roofs and 48.36 × 10¹⁰ (structures/m2) for LIP roofs (Figure 6a). These values were then spatially assigned to the mapped AC roof polygons and multiplied by the corresponding roof areas per neighborhood to estimate the total potential fiber release at the neighborhood scale. The resulting totals were used to classify neighborhoods into Low, Medium, and High intervention priority categories, with minimum and maximum values ranging from 5.54 × 10⁷ to 1.36 × 10¹¹ structures/neighborhood. This surface therefore represents a relative, source-based indicator of the potential intensity of asbestos fiber release from AC roofs across the city.

3.2. Asbestos Mobilization Through Roof Runoff

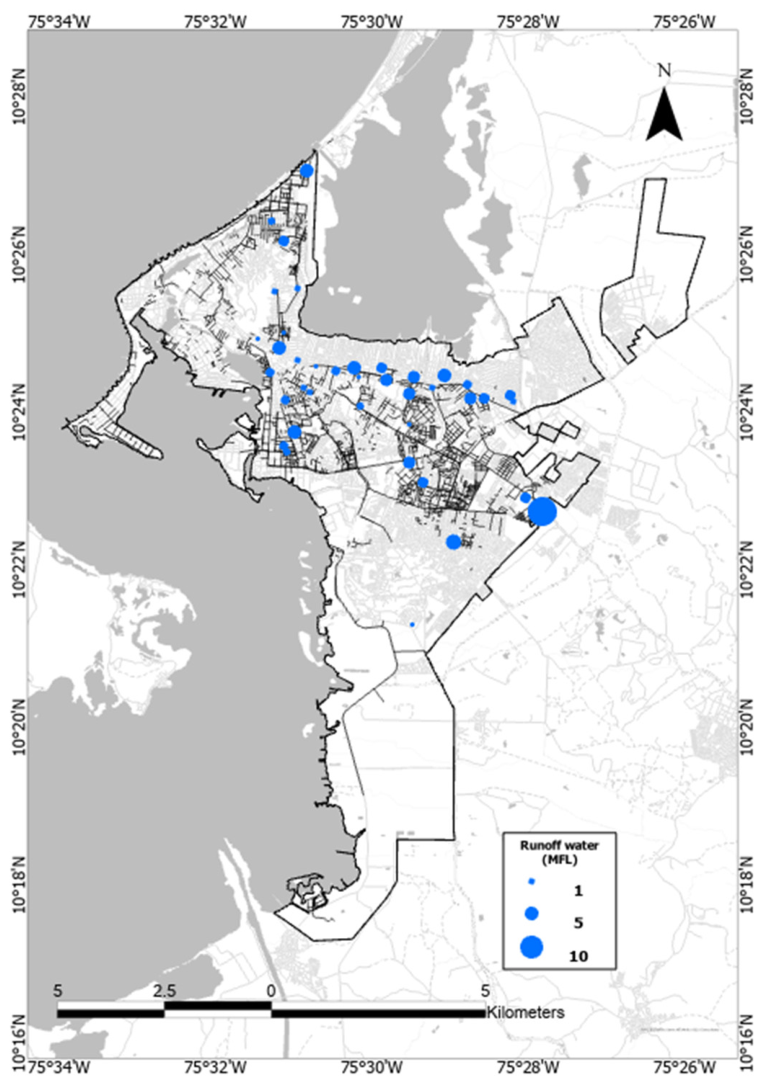
Figure 7 presents the spatial distribution of asbestos fiber concentrations measured in roof runoff water samples collected at each sampling location. Measured concentrations ranged from 0.56 to 14.29 MFL (Table A2), with the highest values predominantly concentrated in the central area of the city.
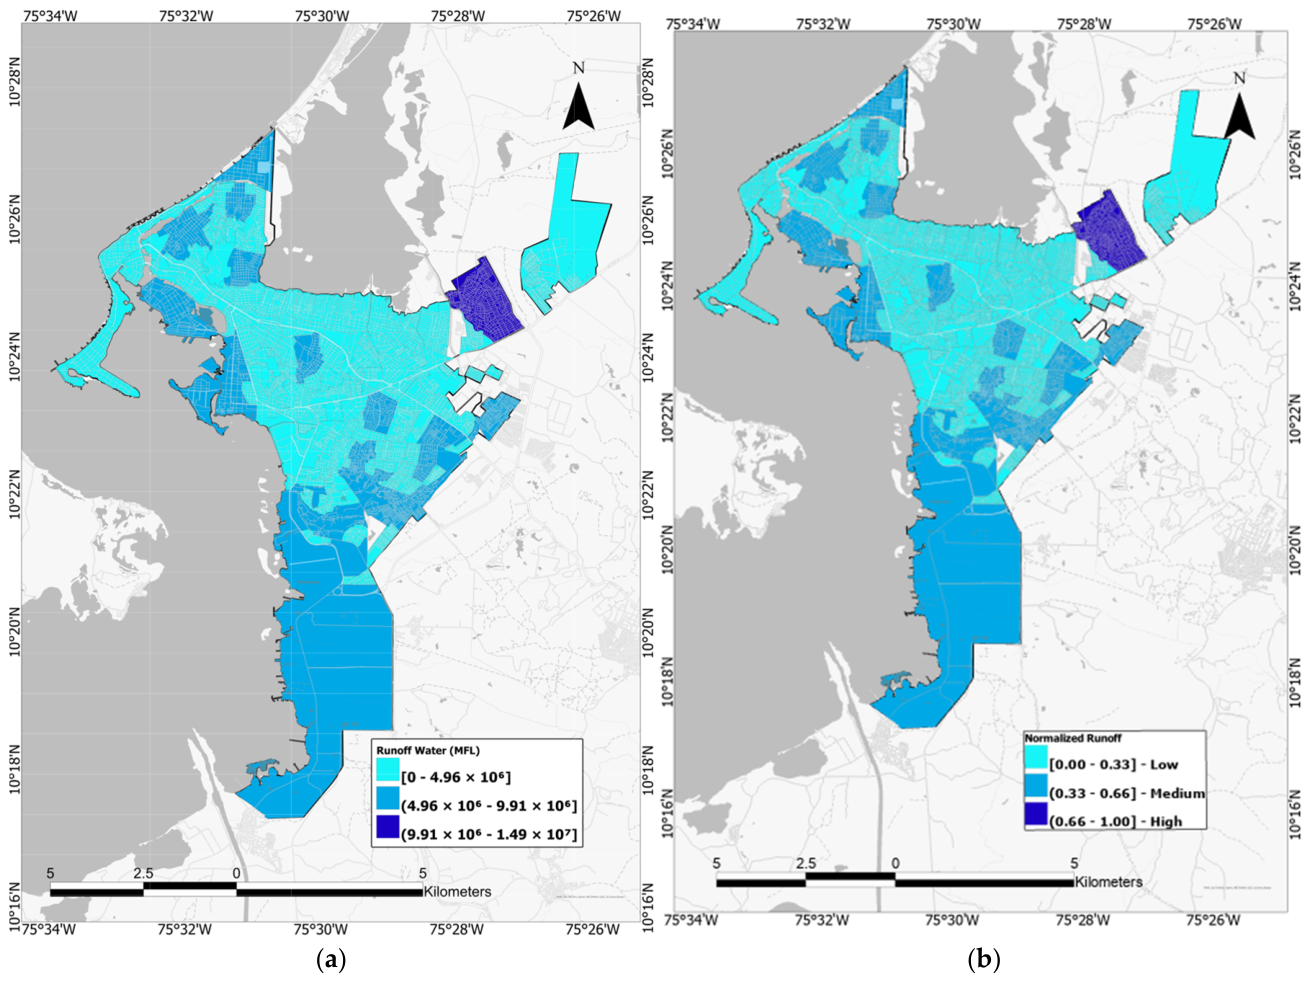
Figure 8 illustrates the hazard associated with asbestos fiber mobilization through roof runoff water. Similarly, average runoff concentrations derived from HIP and LIP categories (Table 2) were spatially assigned to the AC roof layer and extrapolated across the study area. This map represents the potential for asbestos fiber transport through rainfall-driven processes, which is particularly relevant in tropical environments where intense precipitation events can facilitate the redistribution of contaminants.
The map was constructed using the average runoff concentrations derived from HIP and LIP roof categories (Table 2), originally measured over 30 cm × 30 cm sampling areas (900 cm2) and expressed in Million Fibers per Liter (MFL). These values were extrapolated to a 1 m2 reference surface, resulting in mean concentrations of 28.31 MFL for HIP roofs and 37.44 MFL for LIP roofs.
Following the same approach applied for the airborne release assessment, these representative values were assigned to the spatial distribution of AC roofs and combined with the corresponding HIP and LIP areas at the neighborhood level to estimate the total potential fiber mobilization through runoff. The resulting values ranged from 6.95 × 10³ to 1.49 × 10⁷ MFL per neighborhood, reflecting the variability in both roof extent and material condition across the study area.
The final classification into Low, Medium, and High categories represents a relative prioritization of intervention areas based on the potential intensity of asbestos fiber transport driven by rainfall processes, which are particularly relevant in tropical environments characterized by high precipitation intensity.
The results highlight the need for further research to better understand the relationship between the age, weathering processes, and structural integrity of asbestos-cement materials and their capacity to release fibers into different environmental compartments. While LIP roofs appear to exhibit higher surface fiber availability, HIP roofs remain structurally compromised and are more likely to undergo interventions such as repair, breakage, or removal, which can generate high-intensity fiber release events. This is particularly relevant in developing countries, where asbestos regulation is recent or incomplete, and awareness of asbestos-related risks remains limited.
The spatial patterns observed in Figure 5 and Figure 6 exhibit a high degree of concordance, reflecting their common dependence on the distribution and proportional area of HIP and LIP roofs at the neighborhood scale. When expressed in terms of spatial extent, both airborne release potential and runoff-mediated mobilization show a consistent classification pattern. For the MicroVac-based index, approximately 48.16% of the study area falls within the low category, 42.32% within the intermediate category, and 9.52% within the high category. Similarly, the runoff-related index shows 51.30% of the area classified as low, 45.57% as medium, and 3.13% as high (Table 3).
This spatial distribution indicates that, despite a substantial proportion of neighborhoods being classified within lower hazard categories, a considerable share of the urban area remains characterized by moderate to high hazard levels. The observed consistency between both pathways suggests that asbestos-cement roofing distribution and condition constitute the primary controlling factors, rather than pathway-specific dynamics. Nevertheless, although the spatial patterns are comparable, the governing mechanisms differ fundamentally: airborne release is driven by mechanical detachment and wind-induced resuspension, whereas runoff-related mobilization is controlled by hydrological processes and precipitation-induced surface washing. The spatial convergence of these pathways within similar urban clusters supports the robustness of the classification framework and underscores the presence of areas where multiple release mechanisms may interact, potentially enhancing the overall dispersion of asbestos fibers in the environment.

3.3. Drinking Water and Asbestos-Cement Pipeline Infrastructure

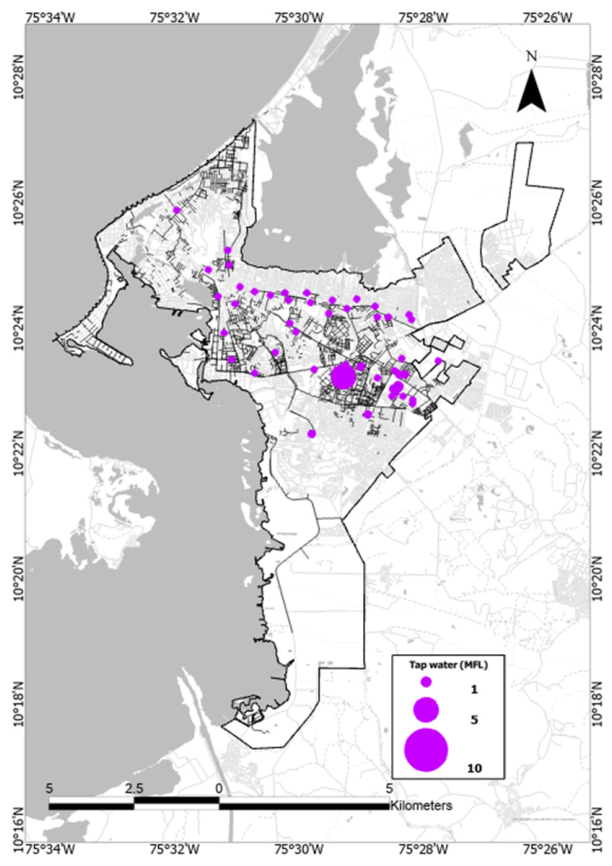
Figure 9 shows the spatial distribution of the measured concentrations of asbestos fibers captured at each sampling point, which was carried out using a Runoff water type sample to determine the value of the concentrations obtained, for which a range of values between 0.28 MFL and 4.86 MFL was obtained, reported in Table A3, which shows a concentration mainly in the central area of the city.
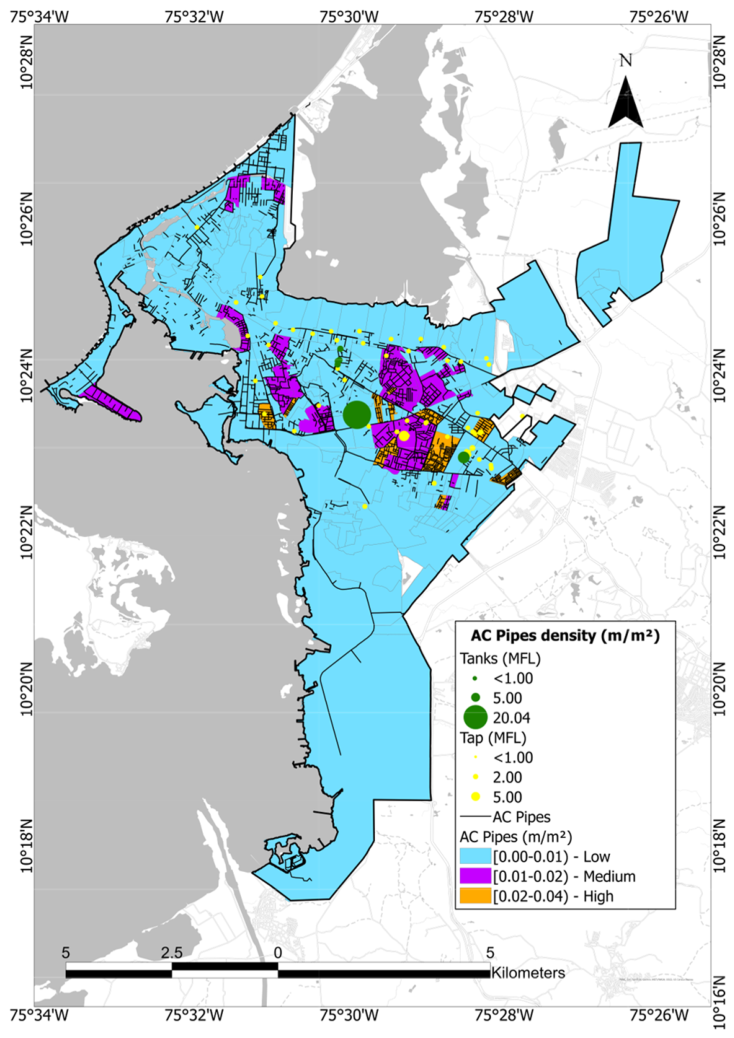
Regarding drinking water, secondary data indicated the presence of more than 115 km of active asbestos-cement (AC) pipelines within the study area. Tap water analysis showed that 7 of 64 samples (11%) were positive for asbestos fibers, with a mean concentration of 1.01 ± 1.59 MFL and a maximum value of 4.86 MFL. When the highest value was excluded as a potential outlier, the remaining positive samples exhibited a substantially lower mean of 0.37 ± 0.27 MFL (Table A3). Figure 10 presents the spatial relationship between asbestos fiber occurrence in drinking water and AC pipe density at the neighborhood scale, allowing a comparative interpretation between measured fiber occurrence and the underlying hydraulic infrastructure.
Additionally, during field campaigns, a complementary set of 28 water samples was collected from asbestos-cement (AC) storage tanks identified across different sectors of the city, generally located in proximity to other sampling points. Among these samples, 8 (28.57%) exhibited asbestos fiber concentrations above the detection limit. For the positive samples, the mean concentration was 5.96 ± 5.75 MFL, with values ranging from 0.28 to 20.04 MFL.
The use of AC storage tanks remains widespread in Cartagena and, more broadly, in many developing countries. Despite their potential relevance as a source of potential asbestos release, this type of infrastructure has received limited attention in the scientific literature. The results obtained are presented in Figure 7; however, it is important to note that this sampling represents a non-systematic, exploratory assessment. The total number and spatial distribution of AC tanks in the city are currently unknown and were beyond the scope of this study. Consequently, no spatial analysis was performed for this dataset, and the results are reported for informative purposes. It is also relevant to consider that the water stored in these tanks originates directly from the municipal distribution system and may remain in storage for variable periods before use, particularly during interruptions in the public supply. At the time of sampling, measured pH values were within the neutral range, indicating conditions suitable for human consumption. Nonetheless, storage conditions and residence time may influence fiber accumulation or release, suggesting that AC tanks could represent an additional, yet underexplored, pathway for asbestos mobilization in urban environments.
The results indicate that the presence of AC pipelines alone does not directly explain the occurrence of asbestos fibers in drinking water. Although higher pipe densities are observed in the northern, central, and coastal sectors of the city, only a limited proportion of samples showed detectable fibers. This weak spatial correspondence suggests that asbestos release into drinking water is not solely controlled by infrastructure distribution, but rather by a combination of physicochemical and operational factors. In this context, the relatively low detection frequency observed in the present study should not be interpreted as the absence of detectable asbestos occurrence, but rather as evidence of the heterogeneous and episodic nature of asbestos release in drinking water systems.
A plausible explanation for the limited fiber detection is the formation of internal mineral scaling and sediment deposits within AC pipes. Long-term studies have shown that calcite precipitation and accumulated suspended solids can form a protective layer that reduces direct interaction between flowing water and the cement-asbestos matrix [39]. Under relatively stable conditions, this process may limit fiber release. However, this protection is not permanent. Seasonal variations in temperature and water chemistry, as well as calcium leaching from the cement matrix, can destabilize the internal structure of the pipe, generating a porous degraded layer prone to fiber release [39]. In such cases, asbestos emission may occur intermittently, particularly under conditions of mechanical stress, such as vibrations from traffic, maintenance activities, or pressure fluctuations [40].
Water chemistry is another key controlling factor. Lower pH conditions enhance the dissolution of the cementitious matrix and promote asbestos fiber release, whereas neutral to slightly alkaline conditions favor stability and scaling processes [7]. In the present study, drinking water pH has been reported within the normal range for potable water, which may contribute to the relatively low concentrations observed. Nevertheless, even under favorable chemical conditions, asbestos release cannot be ruled out, as it depends on a complex interplay between physicochemical and mechanical factors governing long-term pipe degradation.
It is important to note that, in the present study, direct characterization of internal pipe conditions (mineral scaling, porosity, or degradation state) and detailed water chemistry parameters (such as pH variability, alkalinity, or calcium concentration) were not assessed. Therefore, the interpretation of scaling-related processes is based on established mechanisms reported in the literature rather than site-specific measurements. As a result, the observed mismatch between pipe density and fiber occurrence should be understood as indicative of the complex and potentially episodic nature of asbestos release in drinking water systems.
These findings highlight the need for future research integrating physicochemical characterization of pipe materials, hydraulic conditions, and water chemistry to better elucidate the mechanisms controlling asbestos mobilization in distribution networks. In this context, the present results support the view that AC pipeline density alone is not a reliable predictor of asbestos presence in drinking water.
From a regulatory perspective, all tap water samples collected directly from the drinking water distribution system were below the U.S. EPA maximum contaminant level (MCL) of 7 MFL for asbestos in drinking water [41], with a maximum measured concentration of 4.86 MFL. However, among the exploratory samples collected from asbestos-cement (AC) storage tanks, one sample reached 20.04 MFL, exceeding the EPA reference value. It is important to note that the storage tank assessment was non-systematic and intended only as a preliminary exploratory evaluation. Therefore, these results should not be interpreted as representative of the municipal drinking water distribution network.
The interpretation of regulatory thresholds for asbestos in water remains subject to debate. The World Health Organization has not established a health-based guideline value for asbestos in drinking water due to insufficient evidence linking ingestion exposure to adverse health effects. Nevertheless, recent reviews emphasize that asbestos occurrence in drinking water should not be disregarded, particularly in urban environments where aging AC infrastructure remains widespread [7].
An additional consideration is the potential migration of waterborne asbestos into indoor air during water use. Experimental studies have demonstrated that asbestos fibers suspended in water can become airborne under turbulent conditions, particularly during bubble formation and water agitation processes [42]. Earlier field studies also reported increased airborne asbestos concentrations in households supplied with contaminated water, suggesting a potential secondary transfer pathway to indoor air [43]. Although the concentrations observed in the present study are relatively low and sporadic, these findings indicate that the water-to-air pathway should not be completely overlooked, especially in domestic environments.
Therefore, the findings suggest that AC pipeline density alone is not a reliable predictor of asbestos occurrence in drinking water. Instead, asbestos release appears to be governed by a combination of infrastructure condition, internal pipe processes, water chemistry, and operational disturbances. These results are consistent with the recent literature highlighting the need for standardized methodologies and integrated spatial approaches to better understand asbestos dynamics across environmental matrices. In post-ban urban contexts, particularly in developing countries, such approaches are essential to properly understand the long-term environmental implications associated with legacy asbestos infrastructure and to support evidence-based management strategies.

3.4. Integrated Spatial Assessment and Intervention Prioritization

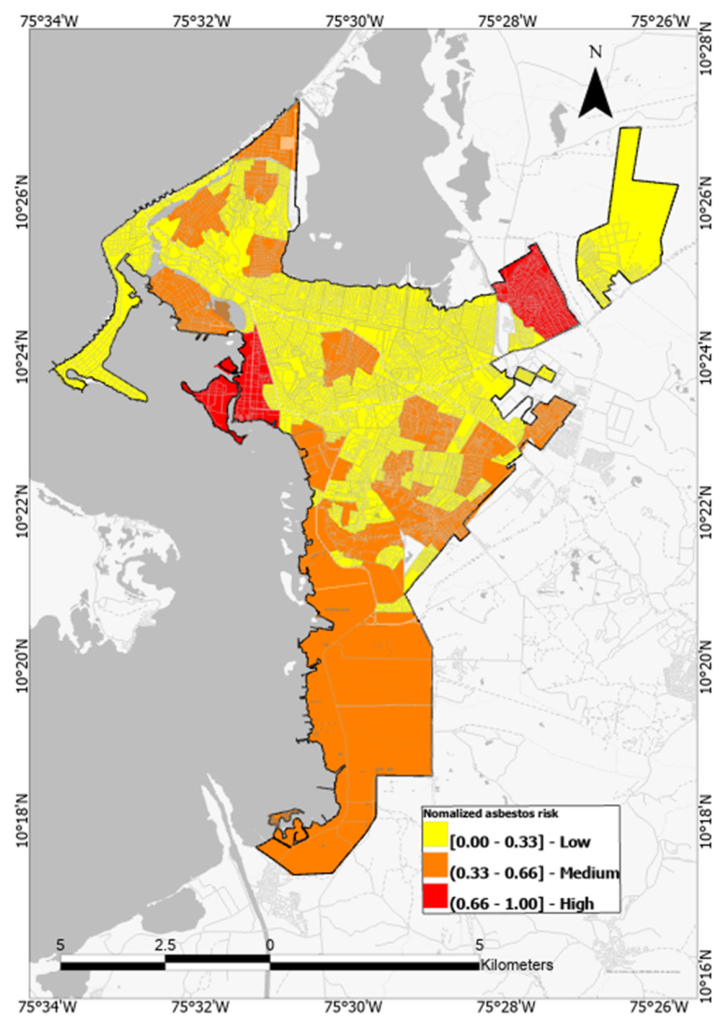
Finally, the integration of the airborne hazard map (Figure 8), the runoff-related hazard map (Figure 9), and the spatial analysis of drinking water and pipeline density (Figure 10), together with demographic variables aggregated at the neighborhood level, resulted in the integrated spatial prioritization map of asbestos fiber release potential (Figure 11). This integrated framework is not intended to define a single remediation strategy, but rather to identify neighborhoods where multiple asbestos-related environmental hazards coexist and where monitoring or intervention efforts may require coordinated prioritization. This composite map represents the spatial convergence of environmental hazard and population distribution, allowing the identification of areas where high emission potential coincides with high potential for environmental fiber mobilization and high population density.
The integrated hazard prioritization presented in Figure 11 indicates that 71.35% of the total study area (7714.22 ha) falls within the low-priority category, while 23.06% corresponds to medium-priority and 5.59% to high- priority conditions. Although the proportion of high-priority areas is relatively limited in spatial terms, these zones represent critical hotspots where elevated environmental hazard coincides with increased high population density, thereby requiring targeted intervention.
It is important to emphasize that the classification presented in Figure 11 represents a relative prioritization framework based on source-related asbestos fiber release indicators and not a direct measurement of human exposure or health risk. Consequently, neighborhoods classified within lower categories should not be interpreted as exposure-free, while higher-priority areas do not necessarily correspond to proportional increases in actual environmental concentrations or individual exposure. Environmental dispersion, meteorological conditions, building configuration, human activity patterns, and dilution processes may substantially influence the relationship between source release and individual exposure. Therefore, the proposed classification is intended primarily as a spatial decision-support tool for identifying areas where remediation and monitoring efforts may be prioritized.
As observed in both Figure 6 and Figure 8, the spatial distribution of airborne release potential and runoff-mediated mobilization exhibits a high degree of consistency, primarily driven by the spatial extent and condition of asbestos-cement roofing across neighborhoods. However, despite this apparent similarity, the underlying mechanisms differ significantly: airborne release is governed by mechanical detachment and wind-driven resuspension, whereas runoff mobilization is controlled by hydrological processes and surface washing during rainfall events.
The classification results (Table 3), when expressed in terms of spatial coverage, reveal a more balanced distribution than that observed at the neighborhood level. For the MicroVac index, nearly half of the study area (48.16%) is classified as low hazard, while a comparable proportion (42.32%) falls within the medium category and a non-negligible fraction (9.52%) corresponds to high hazard conditions. This pattern indicates that, although many neighborhoods may individually present lower relative values, the cumulative spatial extent of areas with moderate to high hazard is substantial. Additionally, considering that Cartagena has an estimated population of approximately one million inhabitants, the spatial prioritization analysis indicates that 60.61% of the population resides in areas classified within lower relative hazard categories, while 29.72% and 9.60% are located in zones of medium- and high-priority categories, respectively. Notably, this corresponds to more than 300,000 individuals located within areas characterized by moderate-to-high asbestos release potential. These findings underscore the public health relevance of the identified spatial patterns, highlighting that a substantial proportion of the urban population is situated in areas where multiple asbestos release and transport pathways may converge.
This outcome reflects the normalization approach, in which the most critical spatial unit defines the upper bound of the scale. Consequently, lower classifications do not indicate the absence of potential fiber release but rather lower relative contributions compared to the most critical areas. From a spatial perspective, this highlights the importance of considering both relative classification and absolute area coverage when interpreting environmental hazard patterns.
It is important to highlight that the measured runoff concentrations themselves are substantial. Field results showed that 85% of runoff samples contained detectable asbestos fibers, with values ranging from 0.56 to 14.29 MFL at the sampling scale (900 cm2). If extrapolated to larger roof surfaces, assuming homogeneous fiber release across the entire roofing material, the estimated fiber loads could theoretically exceed reference concentration values such as the 7 MFL guideline reported for drinking water. Nevertheless, this estimation is based on a simplified assumption derived from localized measurements and should not be interpreted as a direct environmental or exposure measurement. This suggests that rainfall-driven processes may represent a significant pathway for asbestos mobilization in the urban environment, consistent with previous findings on asbestos release and transport in environmental matrices [39].
From a public health perspective, this pathway is particularly relevant in local contexts where direct contact with rainwater is common. Practices such as bathing under roof drainage outlets may increase contact with fibers mobilized from asbestos-cement materials. Although exposure is not directly quantified in this study, the results highlight the potential magnitude of fiber release and the relevance of indirect environmental transfer pathways. A key aspect to consider when interpreting these results is that the MicroVac approach and conventional ambient air monitoring represent fundamentally different measurement frameworks. While ambient air studies quantify airborne asbestos concentrations after environmental dispersion and dilution, the MicroVac method evaluates the potential release of fibers directly at the source material surface under controlled sampling conditions. Consequently, the results obtained in the present study should not be interpreted as directly comparable to ambient airborne concentrations reported in the literature. Instead, the proposed methodology provides complementary information regarding the relative potential for asbestos fiber release from weathered asbestos-cement materials, which may support source characterization and spatial prioritization efforts in urban environments.

4. Conclusions

This study aimed to develop an integrated, spatially explicit framework for assessing environmental hazard and population distribution associated with asbestos in a post-ban urban context, using Cartagena, Colombia, as a case study. By combining source-based emission indicators from asbestos-cement (AC) roofs, water-related pathways, infrastructure analysis, and demographic data, the study provides a multi-pathway perspective on asbestos behavior in complex urban environments.
The results demonstrate that asbestos-related hazards are spatially heterogeneous and primarily driven by the distribution and condition of AC roofing materials. While the majority of the study area was classified within lower relative hazard categories, a non-negligible proportion of the urban territory exhibited moderate to high hazard levels when evaluated in terms of spatial extent and cumulative release potential. The convergence of airborne and runoff-related hazard patterns highlights the dominant role of roofing materials as a persistent and diffuse source of environmental contamination. Additionally, the analysis of drinking water revealed that the presence of asbestos fibers is not directly correlated with pipeline density but rather controlled by a combination of physicochemical conditions, infrastructure aging, and internal pipe processes.
A key contribution of this work lies in the integration of source-based asbestos fiber release indicators with spatial analysis at the urban scale. The MicroVac approach provides information on the relative potential for fiber release directly from asbestos-cement materials under controlled sampling conditions, complementing conventional ambient monitoring strategies that evaluate airborne concentrations after environmental dispersion and dilution. By linking source characterization with spatial modeling and demographic distribution, the proposed framework enables the identification of priority intervention zones where multiple asbestos release pathways converge. Rather than replacing ambient monitoring approaches, the methodology presented here provides a complementary tool for source characterization and spatial prioritization in urban environments where legacy asbestos infrastructure remains widespread and environmental monitoring capacity may be limited.
The study also highlights the importance of considering non-traditional environmental mobilization pathways, such as rainfall-driven fiber mobilization and potential water-to-air transfer mechanisms, which are often overlooked in standard environmental assessments. These pathways may be particularly relevant in tropical and developing contexts, where environmental conditions and water-use practices differ from those typically studied in the literature.
Despite these contributions, several limitations must be acknowledged. The assessment is based on indirect indicators of emission potential rather than direct measurements of airborne asbestos concentrations at the breathing zone, which limits the ability to directly evaluate individual exposure conditions. In addition, the extrapolation of point-based measurements to larger spatial units introduces uncertainty, particularly in areas with heterogeneous roof conditions. The analysis of asbestos in drinking water and storage tanks was exploratory and not spatially exhaustive and therefore should be interpreted as indicative rather than representative of the entire system.
Overall, this study advances the understanding of asbestos dynamics across multiple environmental compartments and underscores the need for integrated, multi-scale monitoring approaches. The proposed methodology provides a foundation for future research and supports evidence-based decision-making aimed at mitigating long-term asbestos-related environmental hazards in urban environments, particularly in developing countries undergoing transitions in asbestos regulation.

Author Contributions

Conceptualization, M.A.N.-C. and O.E.C.-H.; methodology, M.A.N.-C. and A.H.O.-H.; software, A.H.O.-H.; validation, M.A.N.-C., A.H.O.-H. and M.S.; formal analysis, M.A.N.-C. and M.S.; investigation, M.A.N.-C., A.H.O.-H. and L.K.T.G.; resources, O.E.C.-H.; data curation, A.H.O.-H.; writing—original draft preparation, M.A.N.-C.; writing—review and editing, M.A.N.-C., A.H.O.-H. and O.E.C.-H.; visualization, A.H.O.-H.; supervision, O.E.C.-H.; project administration, O.E.C.-H.; funding acquisition, M.S. All authors have read and agreed to the published version of the manuscript.

Funding

This research was funded by General System of Royalties of Colombia (SGR) under project code BPIN 2020000100366.

Institutional Review Board Statement

Not applicable.

Informed Consent Statement

Not applicable.

Data Availability Statement

The original contributions presented in this study are included in the article. Further inquiries can be directed to the corresponding author.

Acknowledgments

This article represents a deliverable within the project “Formulation of an integral strategy to reduce the impact on public and environmental health due to the presence of asbestos in the territory of the Department of Bolivar,” financially supported by the General System of Royalties of Colombia (SGR) under project code BPIN 2020000100366. This project was a collaboration between the University of Cartagena, Colombia and the Asbestos-Free Colombia Foundation. The development of this manuscript was supported by the “Plan de Fortalecimiento Grupo ESCONPAT,” funded by the University of Cartagena (Resolution N. 00721 of 2023, Commitment Act 046 of 2023). The authors acknowledge Carlos Castrillón, Mario Salom, Liseth Sequeda, Federico Frassy, David Valdelamar-Martínez, Michelle Cecilia Montero Acosta, Margareth Peña Castro, and the research group for their efforts.

Conflicts of Interest

The authors declare no conflicts of interest.

Appendix A. Summary of Asbestos Fiber Concentrations and Sampling Information Across Environmental Matrices

Table A1. MicroVac.
Table A1. MicroVac.
NumberStructures/cm2NumberStructures/cm2
167523910,610
238584015,625
396454124,000,000
411,5744259,028
5043140,129
686,700,0004455,556
7289445166,400,000
8116,1024618,326
935,687471,122,685
1062,6934847,261
1137044929,900
1261,7285010,560,000
1319,29051153,600,000
1471,29652140,800,000
1510,610530
16771654230,400,000
1721,29655217,600,000
1843,5195648,000,000
1937,03757256,000,000
2081,48158124,800
210590
2206017,361
23110,1856196,000,000
2427786249,920,000
2512,9636370,400,000
264630641,240,000
2746,2966538,400,000
28212,9636664,000,000
29116,89867300,000
3085,1856876,800,000
3113,88969144,000
32070182,400,000
3328,800715556
342,352,00072326,400,000
35166,400,000
369,440,000
371,200,000
3825,077
Table A2. Roof runoff water.
NumberConcentration (MFL)
10
20
30
40
50
60
70.56
80.56
90.8
100.87
110.93
121
131
141.22
151.39
161.8
172.2
182.59
192.6
202.78
212.78
222.8
232.98
243.15
253.15
263.57
273.6
283.7
293.89
304.07
314.17
324.26
334.63
345
355.19
365.2
375.2
385.37
395.95
4014.29
Table A3. Tap water.
NumberConcentration (MFL)NumberConcentration (MFL)
10330
20340
30350
40360.97
50370.28
60380
70390
80400
90410
100424.86
110430
120440
130450
140460
150470
160480
170490
180500
190510
200520
210530
220540
230550
240560.28
250570
260580
270590
280600.28
290610.14
300620
310630
320640.28

References

  1. Singh, S.; Avtar, R.; Jain, A.; Alsulamy, S.; Ouda, M.M.; Kharrazi, A. Identifying Micro-Level Pollution Hotspots Using Sentinel-5P for the Spatial Analysis of Air Quality Degradation in the National Capital Region, India. Sustainability 2025, 17, 2241. [Google Scholar] [CrossRef]
  2. Kaur, J. A Comparative Review of Air Quality in India’s Most Populated Capitals: Analyzing AQI Based on Environmental pollutants PM2.5, Carbon Monoxide (CO), Nitrogen dioxide (NO2), Sulfur dioxide (SO2), and Ozone (O3). EAI Endorsed Trans. Sustain. Manuf. Renew. Energy 2024, 1. [Google Scholar] [CrossRef]
  3. Sicard, P.; Agathokleous, E.; De Marco, A.; Paoletti, E.; Calatayud, V. Urban population exposure to air pollution in Europe over the last decades. Environ. Sci. Eur. 2021, 33, 28. [Google Scholar] [CrossRef] [PubMed]
  4. Liu, Y.; Wang, T. Worsening urban ozone pollution in China from 2013 to 2017—Part 2: The effects of emission changes and implications for multi-pollutant control. Atmos. Chem. Phys. 2020, 20, 6323–6337. [Google Scholar] [CrossRef]
  5. Meo, S.A.; Shaikh, N.; Alotaibi, M.; AlWabel, A.A.; Alqumaidi, H. Effect of air pollutants particulate matter (PM2.5, PM10), sulfur dioxide (SO2) and ozone (O3) on cognitive health. Sci. Rep. 2024, 14, 19616. [Google Scholar] [CrossRef]
  6. Aljafen, B.N.; Shaikh, N.; AlKhalifah, J.M.; Meo, S.A. Effect of environmental pollutants particulate matter (PM2.5, PM10), nitrogen dioxide (NO2), sulfur dioxide (SO2), carbon monoxide (CO) and ground level ozone (O3) on epilepsy. BMC Neurol. 2025, 25, 133. [Google Scholar] [CrossRef] [PubMed]
  7. Peña-Castro, M.; Montero-Acosta, M.; Saba, M. A critical review of asbestos concentrations in water and air, according to exposure sources. Heliyon 2023, 9, e15730. [Google Scholar] [CrossRef]
  8. Sørensen, M.K.; Thomsen, J.F.; Tøttenborg, S.S.; Ervik, T.K.; Møller, P.; Kolarik, B.D.; Deen, L.; Khoury, G.; Petersen, J.A.; Meyer, H.W.; et al. Monitoring outdoor concentrations of airborne asbestos in urban and residential areas in the four major cities of Denmark: Copenhagen, Odense, Aarhus and Aalborg. Environ. Res. 2026, 291, 123546. [Google Scholar] [CrossRef] [PubMed]
  9. Zhang, H.; Wei, H.; Han, S.; Zheng, L.; Chen, X.; Li, Z.; Wang, L. A comprehensive examination of the impact of environmental pollution on lung cancer: A review. J. Adv. Res. 2026, 81, 273–286. [Google Scholar] [CrossRef]
  10. Lemen, R.A.; Wagner, G.R. Asbestos. In International Encyclopedia of Public Health, 3 rd. ed.; Quah, S.R., Ed.; Academic Press: Oxford, UK, 2025; pp. 70–79. [Google Scholar] [CrossRef]
  11. Kottek, M.; Yuen, M.L. Public health risks from asbestos cement roofing. Am. J. Ind. Med. 2022, 65, 157–161. [Google Scholar] [CrossRef]
  12. Obmiński, A. Asbestos in building and its destruction. Constr. Build. Mater. 2020, 249, 118685. [Google Scholar] [CrossRef]
  13. Alquwayi, S.; Wolfe, C.; Yang, S.; Bandli, B.; Mischler, S.E.; Lee, T. Asbestos identification in bulk samples using FTIR and multivariate data analysis. J. Hazard. Mater. 2025, 497, 139583. [Google Scholar] [CrossRef]
  14. Bolan, S.; Kempton, L.; McCarthy, T.; Wijesekara, H.; Piyathilake, U.; Jasemizad, T.; Padhye, L.P.; Zhang, T.; Rinklebe, J.; Wang, H.; et al. Sustainable management of hazardous asbestos-containing materials: Containment, stabilization and inertization. Sci. Total Environ. 2023, 881, 163456. [Google Scholar] [CrossRef] [PubMed]
  15. Gualtieri, A.F.; Ferrari, E.; Rigamonti, L.; Ruozi, B.; Mirata, S.; Almonti, V.; Passalacqua, M.; Vernazza, S.; Di Valerio, S.; Tossetta, G.; et al. Bridging the gap between toxicity and carcinogenicity of mineral fibres by connecting the fibre parameters to the key characteristics of carcinogens: A comprehensive model inspiring asbestos-induced cancer prevention strategies. Curr. Res. Toxicol. 2024, 7, 100202. [Google Scholar] [CrossRef]
  16. WHO. Asbestos; WHO: Geneva, Switzerland, 2020. [Google Scholar]
  17. Wolff, H.; Vehmas, T.; Oksa, P.; Rantanen, J.; Vainio, H. Asbestos, asbestosis, and cancer, the Helsinki criteria for diagnosis and attribution 2014: Recommendations. Wounds 2014, 13, 5–15. [Google Scholar] [CrossRef]
  18. Markowitz, S.B.; Levin, S.M.; Miller, A.; Morabia, A. Asbestos, asbestosis, smoking, and lung cancer. New findings from the North American insulator cohort. Am. J. Respir. Crit. Care Med. 2013, 188, 90–96. [Google Scholar] [CrossRef]
  19. Institute of Medicine (US) Committee on Asbestos: Selected Health Effects. Selected Health Effects. Asbestos: Selected Cancers. Available online: https://www.ncbi.nlm.nih.gov/books/NBK20329/ (accessed on 16 March 2026).
  20. Klebe, S.; Leigh, J.; Henderson, D.W.; Nurminen, M. Asbestos, Smoking and Lung Cancer: An Update. Int. J. Environ. Res. Public Health 2020, 17, 258. [Google Scholar] [CrossRef] [PubMed]
  21. Smith, A.H.; Shearn, V.I.; Wood, R. Asbestos and kidney cancer: The evidence supports a causal association. Am. J. Ind. Med. 1989, 16, 159–166. [Google Scholar] [CrossRef] [PubMed]
  22. Bayram, M.; Bakan, N.D. Environmental exposure to asbestos: From geology to mesothelioma. Curr. Opin. Pulm. Med. 2014, 20, 301–307. [Google Scholar] [CrossRef]
  23. Kanarek, M.S. Mesothelioma from Chrysotile Asbestos: Update. Ann. Epidemiol. 2011, 21, 688–697. [Google Scholar] [CrossRef]
  24. Cox, L.A.; Bogen, K.T.; Conolly, R.; Graham, U.; Moolgavkar, S.; Oberdörster, G.; Roggli, V.L.; Turci, F.; Mossman, B. Mechanisms and shapes of causal exposure-response functions for asbestos in mesotheliomas and lung cancers. Environ. Res. 2023, 230, 115607. [Google Scholar] [CrossRef]
  25. Rosati, D.; Maurizi, B.G.; Serio, V.B.; Maffeo, D.; Rina, A.; Mari, F.; Palmieri, M.; Giordano, A.; Frullanti, E. From asbestos exposure to carcinogenesis: Transcriptomic signatures in malignant pleural mesothelioma. Exp. Mol. Pathol. 2025, 143, 104973. [Google Scholar] [CrossRef]
  26. Korchevskiy, A.A.; Wylie, A.G. Asbestos exposure, lung fiber burden, and mesothelioma rates: Mechanistic modelling for risk assessment. Comput. Toxicol. 2022, 24, 100249. [Google Scholar] [CrossRef]
  27. Bertolotti, M.; Tamburro, M.; Salzo, A.; Cassinari, A.; Crivellari, S.; Bertolina, C.; Farotto, M.; Adesso, C.; Di Palma, M.A.; Natale, A.; et al. Knowledge and awareness of asbestos risk among General Practitioners: Validation of a questionnaire in an area with a high incidence of asbestos-related diseases. Prev. Med. Rep. 2025, 49, 102940. [Google Scholar] [CrossRef]
  28. D’ELia, F.; Battistig, L.; Da Broi, U.; Simonit, F.; Desinan, L. Work-related exposure to asbestos and criminal liability: Forensic challenges from a nine-year autopsy experience. Leg. Med. 2026, 82, 102822. [Google Scholar] [CrossRef]
  29. GBD 2023 Americas Occupational Exposure Collaborators. Burden of cancer attributable to occupational asbestos exposure in the Americas, 1990–2023: An analysis using the Global Burden of Disease Study 2023. Lancet Reg. Health—Am. 2026, 58, 101463. [CrossRef]
  30. Sørensen, M.K.; Deen, L.; Khoury, G.; Petersen, J.A.; Thomsen, J.F.; Ervik, T.K.; Møller, P.; Tøttenborg, S.S.; Meyer, H.W.; Petersen, K.U.; et al. A systematic review of outdoor airborne asbestos concentrations in urban and rural areas. J. Hazard. Mater. Adv. 2025, 20, 100926. [Google Scholar] [CrossRef]
  31. Zheng, B.; Zang, L.; Li, W.; Li, H.; Wang, H.; Zhang, M.; Song, X. Quantitative analysis of asbestos in drinking water and its migration in mice using fourier-transform infrared spectroscopy and inductively coupled plasma optical emission spectrometry. Anal. Chim. Acta 2019, 1058, 29–38. [Google Scholar] [CrossRef] [PubMed]
  32. Marzini, L.; Osticioli, I.; Ciofini, D.; Agresti, J.; Bellagamba, S.; Paglietti, F.; Mencaglia, A.A.; Siano, S. Identification, mapping, and quantification of asbestos minerals in ACM and NOA using NIR-SWIR hyperspectral scan imaging: Preliminary study. Spectrochim. Acta A Mol. Biomol. Spectrosc. 2025, 333, 125893. [Google Scholar] [CrossRef] [PubMed]
  33. Hajizadeh, Y.; Jafari, N.; Mokhtari, M.; Ebrahimi, A.A.; Abdolahnejad, A. Protocol for identification of airborne asbestos fibres in the urban areas and spatio-temporal trend. MethodsX 2019, 6, 2237–2241. [Google Scholar] [CrossRef] [PubMed]
  34. Khadem, M.; Somea, M.S.; Hassankhani, H.; Heravizadeh, O.R. Joint Iranian-Russian studies of airborne asbestos concentrations in Tehran, Iran, in 2017. Atmos. Environ. 2018, 186, 9–17. [Google Scholar] [CrossRef]
  35. Hikuwai, M.V.; Patorniti, N.; Stewart, R.A. Urban community exposure risk assessment for industrial asbestos cement roofing: Coupled GIS and computer vision-based approach. J. Saf. Sci. Resil. 2025, 6, 100208. [Google Scholar] [CrossRef]
  36. Martínez, D.V.; Saba, M.; Torres-Gil, L. Assessment of asbestos-cement roof distribution and prioritized intervention approaches through hyperspectral imaging. Heliyon 2023, 10, e25612. [Google Scholar] [CrossRef] [PubMed]
  37. Oberta, A.F.; Poye, L.; Compton, S.P. Releasability of asbestos fibers from weathered roof cement. J. Occup. Environ. Hyg. 2018, 15, 466–473. [Google Scholar] [CrossRef] [PubMed]
  38. Husar, R.B.; Patterson, D.E.; Baer, N.S. Deterioration of Marble. A Retrospective Analysis of Tombstone Measurements in the New York City Area; U.S. Department of Energy Office of Scientific and Technical Information: Oak Ridge, TN, USA, 1985. [Google Scholar]
  39. Zavašnik, J.; Šestan, A.; Škapin, S. Degradation of asbestos—Reinforced water supply cement pipes after a long-term operation. Chemosphere 2022, 287, 131977. [Google Scholar] [CrossRef]
  40. Hu, Y.; Hubble, D.W. Factors contributing to the failure of asbestos cement water mains. Can. J. Civ. Eng. 2007, 34, 608–621. [Google Scholar] [CrossRef]
  41. United States Environmental Protection Agency. National Primary Drinking Water Regulations. 2019. Available online: https://www.epa.gov/ground-water-and-drinking-water/national-primary-drinking-water-regulations (accessed on 19 May 2026).
  42. Avataneo, C.; Petriglieri, J.R.; Capella, S.; Tomatis, M.; Luiso, M.; Marangoni, G.; Lazzari, E.; Tinazzi, S.; Lasagna, M.; De Luca, D.A.; et al. Chrysotile asbestos migration in air from contaminated water: An experimental simulation. J. Hazard. Mater. 2022, 424, 127528. [Google Scholar] [CrossRef]
  43. Webber, J.S.; Syrotynski, S.; King, M.V. Asbestos-contaminated drinking water: Its impact on household air. Environ. Res. 1988, 46, 153–167. [Google Scholar] [CrossRef]
Figure 1. Study area in Cartagena, Colombia.
Environments 13 00289 g001
Figure 2. Workflow of the present study.
Environments 13 00289 g002
Figure 3. Conceptual framework for integrated spatial prioritization of asbestos fiber release potential.
Environments 13 00289 g003
Figure 4. Spatial distribution of measured concentrations of asbestos fibers for MicroVac samples in environmental matrices in Cartagena, Colombia.
Environments 13 00289 g004
Figure 5. (a) Structures/cm2 according to deterioration status on field; (b) Millon Fibers per Liter (MFL) in runoff samples according to deterioration status on field. LIP = Low Intervention Priority; HIP = High Intervention Priority.
Environments 13 00289 g005
Figure 6. Hazard map of potential airborne asbestos fiber release for measured (a) and normalized (b).
Environments 13 00289 g006
Figure 7. Spatial distribution of measured concentrations of asbestos fibers for tap water samples in environmental matrices in Cartagena, Colombia.
Environments 13 00289 g007
Figure 8. Hazard map of potential runoff of water roof containing AC fibers measured (a) and normalized (b).
Environments 13 00289 g008
Figure 9. Spatial distribution of measured asbestos fiber concentrations in tap water samples collected from environmental matrices in Cartagena, Colombia.
Environments 13 00289 g009
Figure 10. Spatial relationship between asbestos fibers in drinking water and AC pipe density.
Environments 13 00289 g010
Figure 11. Integrated spatial prioritization of asbestos fiber release potential.
Environments 13 00289 g011
Table 1. Summary of sampling strategy and analytical methods.
Environmental PathwayMatrix/SourceNumber of Samples (n)Method/StandardAnalytical TechniqueUnits
Surface releaseAC roof (MicroVac)72ASTM D5755TEM (AHERA-based)Structures/cm2
Runoff mobilizationRoof runoff water40EPA/600/R-94/134TEMMFL
Drinking waterTap water64EPA Method 100.2TEMMFL
AC = Asbestos-Cement; TEM = Transmission Electron Microscopy; MFL = Million Fibers per Liter.
Table 2. Summary of asbestos fiber concentrations in MicroVac and roof runoff samples according to roof deterioration status.
MicroVac
(Structures/cm2 × 106)
Runoff Water
(MFL)
HIP16.82 ± 47.232.55 ± 2.18
LIP48.36 ± 84.573.36 ± 3.04
Table 3. Spatial distribution of intervention priority levels based on asbestos-related hazard and release potential indicators.
IndexLow (ha)Medium (ha)High (ha)Total Area (ha)
MicroVac48.16%42.32%9.52%100.00%
Runoff Water51.30%45.57%3.13%100.00%
Global71.35%23.06%5.59%100.00%
Disclaimer/Publisher’s Note: The statements, opinions and data contained in all publications are solely those of the individual author(s) and contributor(s) and not of MDPI and/or the editor(s). MDPI and/or the editor(s) disclaim responsibility for any injury to people or property resulting from any ideas, methods, instructions or products referred to in the content.