Article

Sustainability Indicators for Evaluating a Municipal Solid Waste Management System

by
Mirna Castro-Bello
1,*,
Denisse Peralta-Rojo
1,
Carlos Virgilio Marmolejo-Vega
1,*,
Cornelio Morales-Morales
2,
Daniel Angeles-Herrera
1,
Areli Barcenas-Nava
1,
Sergio Ricardo Zagal-Barrera
1 and
Yanet Evangelista-Alcocer
1
1
Technological Institute of Chilpancingo, National Technological Institute of Mexico, Chilpancingo de los Bravo 39090, Guerrero, Mexico
2
Technological Institute of San Juan del Río, National Technological Institute of Mexico, San Juan del Río 76800, Querétaro, Mexico
*
Authors to whom correspondence should be addressed.
Environments 2026, 13(4), 222; https://doi.org/10.3390/environments13040222
Submission received: 17 March 2026 / Revised: 13 April 2026 / Accepted: 16 April 2026 / Published: 18 April 2026
(This article belongs to the Special Issue Circular Economy in Waste Management: Challenges and Opportunities)

Abstract

Inadequate Municipal Solid Waste (MSW) management constitutes a critical environmental challenge, as approximately 40% of waste reaches uncontrolled disposal sites where open-air incineration generates significant air, soil, and water pollution. The objective of this study was to evaluate the MSW Environmental Management System (EMS) in Chilpancingo de los Bravo, Guerrero, Mexico, through sustainability indicators and applicable Mexican environmental regulations to identify operational and structural deficiencies that guide a comprehensive improvement in its management. The methodology comprised an analysis of the EMS via the Municipal Development Plan, the identification of environmental indicators and applicable Mexican standards, and an evaluation of the EMS through waste characterization and sustainability metrics. A sample of 208 kg was defined in accordance with standards NMX-AA-015-1985 and NMX-AA-022-1985. The results indicate a generation rate of approximately 350 tons per day (1.2 kg/capita/day), with municipal collection coverage of 70% of the territory across 24 daily routes operated by 30 vehicles. Indicators revealed a recycling rate of 4.86%, collection coverage of 79.66%, a 0% treatment rate due to the absence of composting or material recovery facilities, and 95% of waste directed to the Final Disposal Site (FDS). These findings demonstrate substantial deficiencies in the current EMS, highlighting that the systematic application of indicators is an effective diagnostic tool for identifying gaps and guiding evidence-based improvements in MSW governance.

1. Introduction

MSW comprises food waste, packaging, household items, including broken furniture, electronics, clothing, footwear, and personal hygiene products, as defined in ref. [1]. Annually, human settlements worldwide produce over two billion tons of waste, evidencing the social co-responsibility derived from consumption patterns, daily practices, and household disposal decisions. These actions directly impact the consumption of energy and raw materials, contributing to what UNEP terms the “triple planetary crisis”: climate change, pollution, and biodiversity loss. Poorly managed waste causes long-term contamination, directly affecting biodiversity and jeopardizing the integrity of entire ecosystems. It is estimated that between 400,000 and 1,000,000 people die annually from diseases such as diarrhea, malaria, heart disease, and various types of cancer linked to mismanaged waste [2]. Furthermore, global MSW generation is projected to increase from 2.01 billion tons to 3.4 billion tons annually by 2050 [3]. Globally, approximately 40% of waste reaches uncontrolled facilities [4], primarily open-air dumpsites, where it is incinerated, contaminating air, soil, and water. Proper management is crucial to preventing public health implications, as these sites are major vectors for the transmission of infectious diseases [5]. According to UNEP, effective management strengthens public policy and enhances governmental planning capacity, infrastructure, access, and service delivery. Furthermore, the application of indicators across generation, collection, recycling, and treatment processes assesses the functionality of EMS, serving as tools to evaluate an organization’s environmental performance and verify compliance with established circular economy and climate change goals [6,7]. These indicators are intrinsically linked to Sustainable Development Goals (SDGs) 11, 12, and 13, reflecting the degree of progress toward MSW management based on reduction, source separation, and material recovery.
Various investigations have reported on EMS studies across different contexts, such as [8], which developed and empirically validated the ARUN model. This model consists of integrating participatory governance based on social capacities and competencies at the micro, meso, and macro levels for zero-waste community management, designed to bridge the gap between zero-waste policies and their actual implementation in semi-rural communities in Thailand. To achieve this, the authors employed a sequential explanatory mixed-methods design that combined a survey of 300 households in the municipality of Saeng Arun. The results confirmed an organization of four competencies—Advocacy, Responsibility, Understanding, and Nurturing—which collectively explained 67.3% of the variance. Responsibility and Nurturing were identified as the strongest predictors of zero-waste behavior, whereas knowledge alone proved insufficient to generate behavioral changes without the support of institutional structures and community leadership. Ref. [9] conducted a comparative study on MSW management based on a documentary review and both qualitative and quantitative components. The study noted that in Laos, waste generation increased from 0.21 million tons in 2012 to 0.37 million tons in 2021. Meanwhile, in the capital city of Vientiane, approximately 1004 tons are produced daily, of which only 50% is collected, highlighting significant limitations in service coverage. In contrast, Japan reduced its generation from 45.23 million tons in 2012 to 40.95 million tons in 2021 through integrated systems that include source separation, recycling, and incineration with energy recovery. This comparison underscores the importance of institutional and technological development in achieving sustainable waste management. Within the scope of comprehensive evaluations, ref. [10] assessed the MSW management system in Nagpur, India, using 20 indicators across four categories: cleanliness, collection, recycling, and disposal. Based on surveys, sample collection, and quantitative analysis, they identified that plastic waste dominates the urban landscape of non-biodegradable materials (65%). The economic value of recyclables in commercial areas reaches 18.37 rupees per kilogram, with cleanliness and collection coverage being adequate in central zones but deficient in the peripheries. Furthermore, 85% of waste ends up in open dumpsites. The study identified that informal recyclers are key to the recovery of valuable materials, such as high-density and low-density polyethylene. Additionally, ref. [11] investigated the role of authorities in promoting waste management in Lagos, Nigeria, through 116 household surveys. The study evaluated five dimensions of sustainability: institutional, economic, technical, socio-cultural, and environmental. The findings showed a moderately sustainable overall index of 0.643, with the institutional dimension scoring 0.655, followed by economic (0.648), technical (0.646), and socio-cultural (0.637). The environmental dimension (0.631) was identified as the weakest due to low material recovery and high pollution levels. This indicates that while adequate policies and institutional structures are in place, substantial improvements in environmental performance are required to achieve a more effective and comprehensive management system.
Other studies demonstrate the application of sustainability indicators to evaluate specific aspects of EMS. For instance, ref. [12] examined the operational efficiency of collection providers in the Sagnarigu Municipality, Ghana, using Data Envelopment Analysis. Their findings highlighted the need to optimize the allocation of production resources—specifically the combination of physical assets, operational staff, and vehicle units with containers—to achieve optimal efficiency levels and maximize service outcomes. In Khulna, Bangladesh, ref. [13] diagnosed the state of MSW management practices using socioeconomic variables (low, middle, and high income). Through a survey of 675 households, multivariable binary logistic regression correlation analysis, and a 95% classical parametric confidence interval, they identified a very high correlation between income levels and MSW generation. Ref. [14] inspected the MSW management practices and EMS in Ethiopia through a descriptive and quantitative investigation involving a sample of 153 households. The results showed that 96.7% of households utilize temporary storage, 94.8% of the MSW is organic, and 79.7% perform basic source separation. However, 60% of the waste is sent to final disposal, while the remaining 40% is dispersed in streets and rivers. Likewise, ref. [15] in Asella, Ethiopia, detected the environmental and health impacts, along with associated factors, of MSW management. Through surveys of 418 households and a systematic and simple random probability sampling technique, they identified the main environmental impacts as water pollution (34.2%), air pollution (31.6%), environmental degradation (20.8%), and soil contamination (13.4%). Regarding health impacts, the study reported respiratory diseases (49.5%), asthma (18.2%), diarrheal diseases (15.8%), parasitic infections (14.8%), and cancer (1.7%).
Additionally, some research has focused on specific dimensions, such as operational efficiency and socioeconomic aspects. For instance, ref. [16] analyzed the primary issues associated with pollutants emitted during the energy recovery treatment of MSW and its organic fraction, emphasizing the impact on human health. Through a literature review and scenario analysis using SCOPUS data to map publication trends, they evaluated two technological scenarios: anaerobic treatment for biomethane production, and waste combustion alongside biomethane generation, the use of solid recovered fuel (SRF) in thermochemical processes, and co-combustion in cement plants. The results indicated that, while emissions of dioxins and furans are increasingly under control due to technological and regulatory improvements, nitrogen oxides and heavy metals still represent significant health risks requiring more rigorous management. This is particularly critical in high-temperature processes such as co-combustion in cement factories, where pollutant mass flows can be elevated despite presenting low concentrations in stacks. Other methodologies compared five MSW management scenarios through Life Cycle Assessment (LCA) in Himachal Pradesh, India, simulating impacts such as climate change, acidification, eutrophication, and human toxicity. The findings showed that the current Business As Usual (BAU) scenario disposes of MSW in open-air dumpsites and through composting without recycling. In contrast, scenario five proved to be the most favorable, achieving significant reductions in greenhouse gas emissions, acidification, and human toxicity [17]. Similarly, ref. [18] evaluated seven MSW management scenarios through LCA in Kinshasa, Democratic Republic of the Congo. They identified that the current system, characterized by low collection rates and a lack of valorization, generates 640,673 tons of CO2-eq/year at a cost of $17.77 million USD. In contrast, scenario seven was the most favorable, reducing emissions to 153,499 tons of CO2-eq/year and lowering costs to $14.43 million USD compared to the baseline system. For their part, ref. [19] identified the main technologies for generating bioenergy from MSW and analyzed technical–economic, environmental and social indicators at a global level in Rio de Janeiro, Brazil. They evaluated and compared different treatment technologies, finding that gasification presents better environmental indicators while incineration stands out in energy efficiency. Regarding environmental aspects, gasification proved superior in emission reduction and land use, whereas incineration excelled in energy efficiency and water consumption. In the United States, Ouedraogo et al. [20] performed a comparative analysis using LCA with OpenLCA software to compare the environmental impacts of traditional waste management methods—landfilling, incineration, and composting—against an integrated management system incorporating recycling, gasification, and anaerobic digestion. Their results showed that the conventional system presents a global warming potential of 899 kg CO2 eq, whereas the integrated system reduces this impact to −14.6 kg CO2 eq, demonstrating significant net environmental benefits. Furthermore, in Santander, Colombia, Sierra [21] conducted a comparative study of different waste management strategies using a quantitative approach based on LCA and multicriteria evaluation to analyze the environmental, social, and economic performance of various management systems. The analysis compared scenarios involving landfilling, recycling, composting, and energy recovery, identifying that traditional systems based primarily on landfilling present the highest environmental impact, particularly regarding greenhouse gas emissions and inefficient resource use. In contrast, integrated management systems that incorporate recycling, biological treatment, and energy recovery significantly reduce environmental impacts by increasing material recovery and decreasing the volume of waste sent to final disposal. This highlights that the integration of multiple treatment technologies constitutes a key strategy for improving the sustainability of municipal waste management systems.
Regarding the applied regulatory framework, no single mandatory international regulation for MSW management exists; instead, each country enforces its own internal legislation. Nevertheless, each administration is governed by international agreements, global objectives, and voluntary technical standards that standardize handling processes and environmental protection. In the case of Mexico, national standards [1,2] converge with international indicators for generation and composition. However, the Mexican regulatory system lacks equivalents for waste treatment, energy recovery, and emissions, in contrast to the guidelines established by the OECD or the 2030 Agenda. This also stands in contrast to the European Union’s Directive 2008/98/EC, where mandatory recycling targets allow these indicators to be measurable [22,23].
Furthermore, the literature reports significant progress in the evaluation of MSW EMS across various international contexts; however, most of these studies focus on consolidated systems with advanced infrastructure, mature institutional frameworks, or economies with greater technical and financial capacity. Nevertheless, there remains a scarcity of studies that simultaneously integrate institutional analysis, physical waste characterization, and the application of sustainability indicators into a single evaluative framework within studies focused on Mexican municipalities—particularly in the state of Guerrero, which is characterized by high levels of marginalization. Addressing this gap, the present research seeks to contribute to the field by establishing a performance baseline for the MSW EMS in Chilpancingo de los Bravo, based on three levels of study: (a) a review of the local institutional framework contained in the Municipal Development Plan (MDP); (b) the physical characterization of waste based on Mexican regulations; and (c) the application of sustainability indicators associated with the processes of generation, collection, transport, treatment, and final disposal. This analysis allows for a contrast between the municipality’s institutional planning and the actual systemic reality, generating quantitative evidence to guide decision-making and the design of public policies that promote integrated MSW management at the municipal level.

2. Materials and Methods

2.1. Materials

For the development of this research, the following equipment was utilized: a 2021 FOTON rear-loading compactor truck with a 10 ton load capacity and a 2015 Nissan stake bed truck with a 1.5 ton capacity. Weighing equipment included a REVUELTA model RCC-1860-V truck scale with a 300 ton platform, a Raganet 200 kg digital commercial scale, and a 20 kg triple beam balance with 1 g sensitivity. Additional materials comprised two 200 L cylindrical metal drums, 0.33 mm thick double-layer PVC/polyester waterproof coveralls, leather gloves, industrial boots with anti-slip polyvinyl chloride soles, and NK95 masks. For waste processing, a 2.00 M sieve, dustpans, brooms, 50 polyethylene bags (1.10 m × 0.80 m, minimum gauge No. 200), round-point shovels, and pitchforks were used. Data recording and analysis were supported by field report forms and specialized stationery, while statistical processing was conducted using Minitab software, version 21.

2.2. Methodology

2.2.1. Study Area

The research was conducted in the city of Chilpancingo de los Bravo, Guerrero, Mexico, which covers a surface area of 2339 km2. The city has a population of 283,354 inhabitants and 1,315,797 private dwellings distributed across 942,043 census households. The urban area comprises more than 670 regular neighborhoods and residential developments, in addition to an indeterminate number of irregular settlements [24].

2.2.2. Methodological Diagram

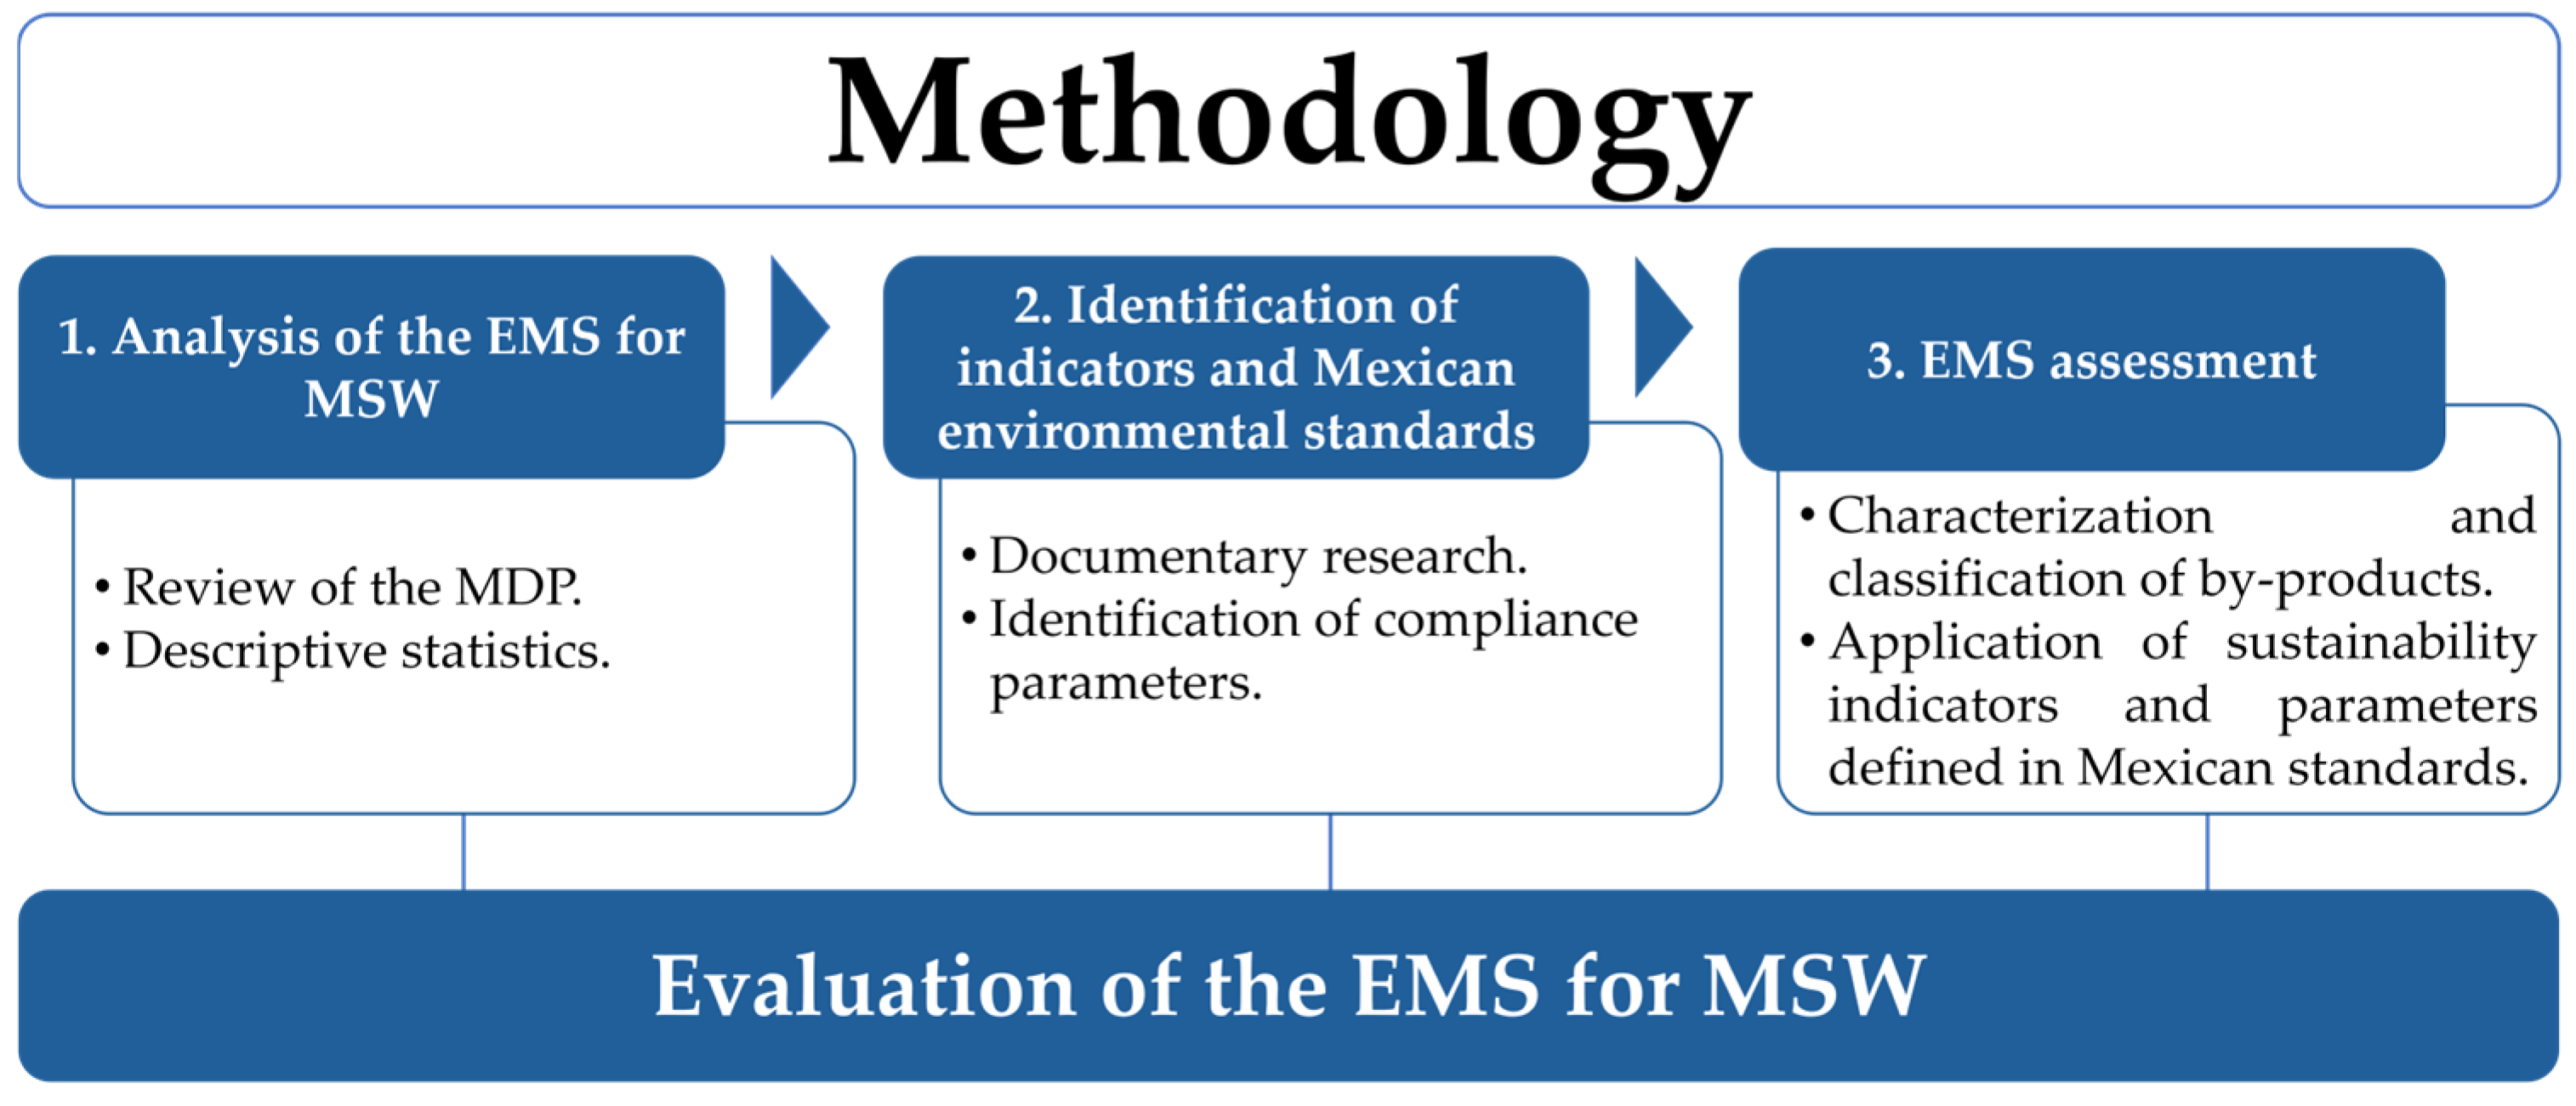
The EMS evaluation employed a methodology described in Figure 1.
Analysis of the EMS for MSW
Through a documentary review of the MDP 2021–2024, its objectives and lines of action linked to MSW management in the city of Chilpancingo were identified, establishing a diagnosis of the local institutional framework and sustainability principles (Table 1 and Table 2).
Additionally, the necessary compliance criteria were generated for the descriptive statistical evaluation of official data sourced from government reports, censuses and institutional platforms.
Identification of Indicators and Mexican Standards
The selection of sustainability indicators linked to MSW management was grounded in the methodology proposed in [29], which considers the processes of generation, collection–transport, treatment and final disposal, adapted to the Mexican regulatory context, as explained in Table A1, Table A2, Table A3, Table A4 and Table A5, Appendix A.
EMS Assessment
Characterization
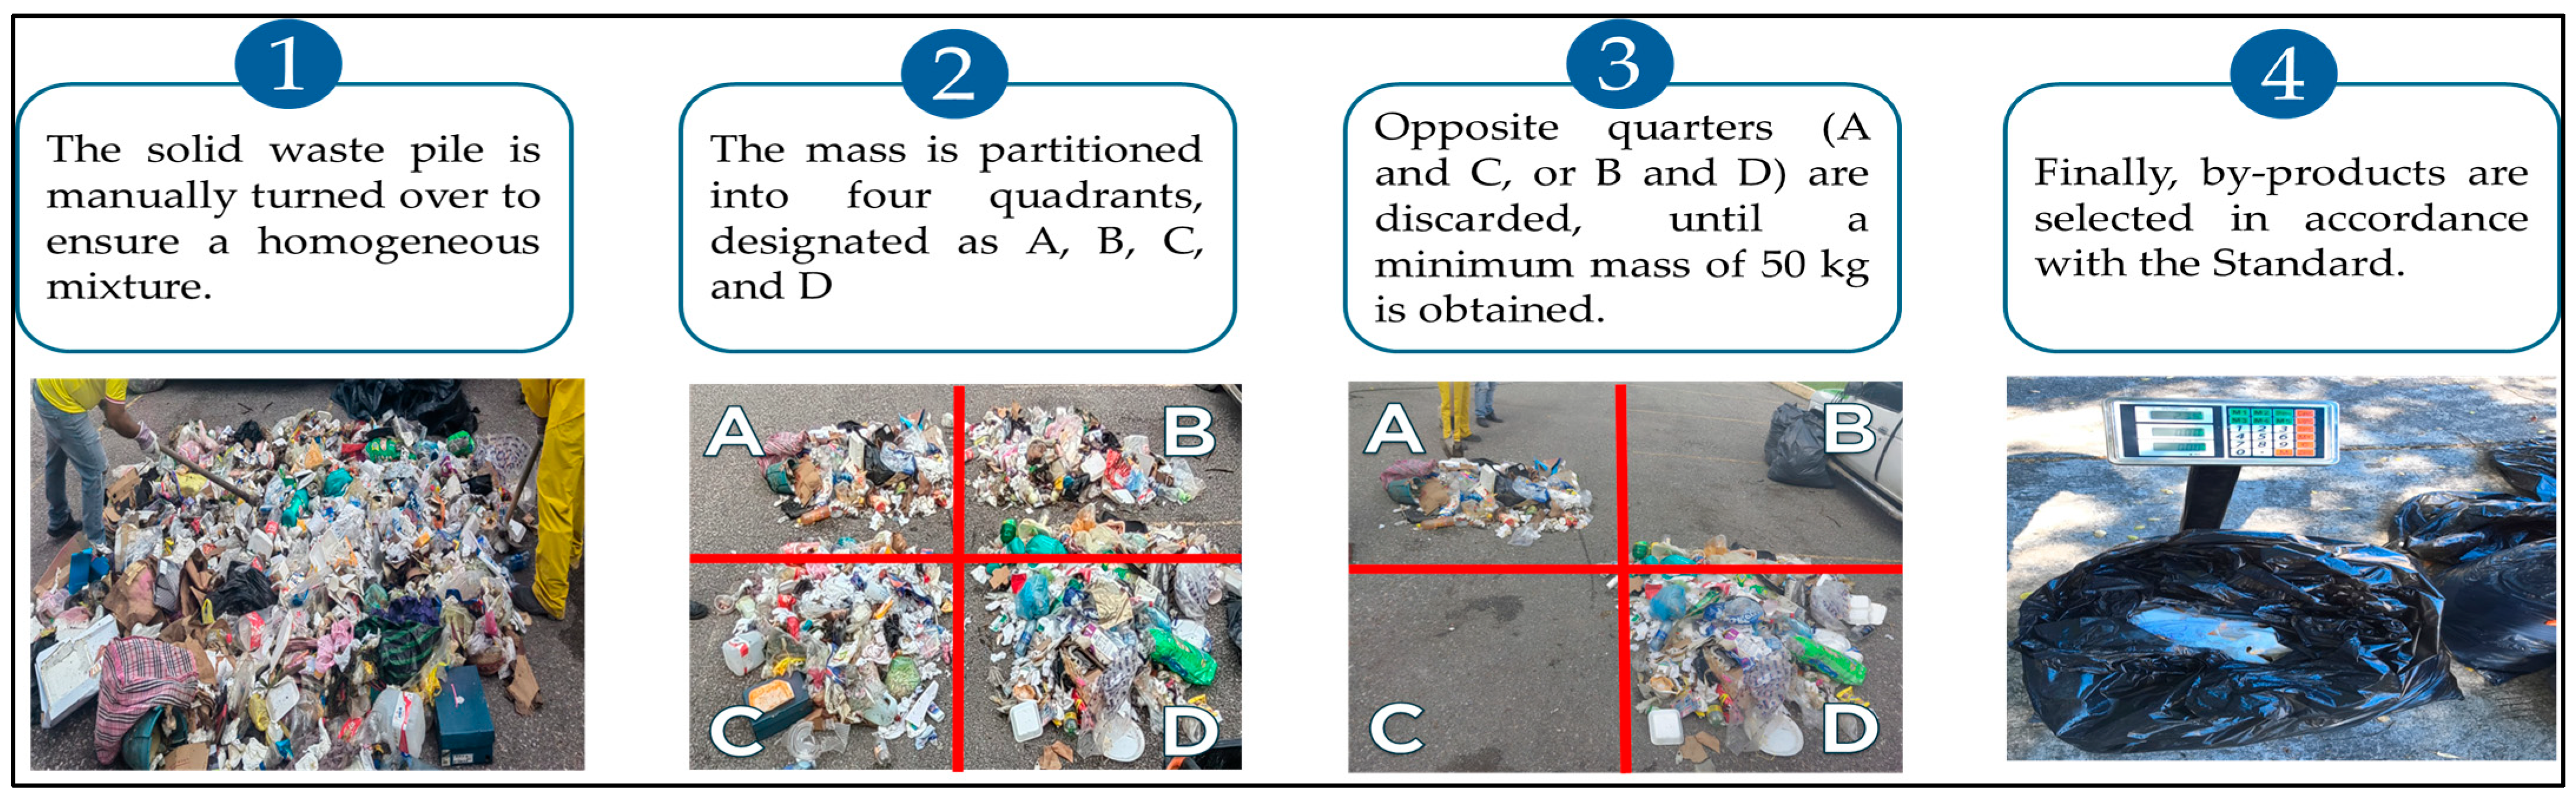
The MSW characterization was performed using the quartering method in accordance with Mexican standards NMX-AA-015-1985 and NMX-AA-022-1985, which establish a minimum of 50 kg for individualization. Rather than fixing a rigid maximum sample size in terms of mass, these standards prescribe a progressive reduction procedure through quartering until a manageable and representative sample is obtained. In this study, two independent samples were considered: 80.8 kg from the public service and 128 kg from the informal service, totaling 208.8 kg of MSW. Sampling was conducted across two distinct periods to account for temporal variability associated with seasonal conditions and waste generation dynamics. The informal collection service sample was gathered in September 2025 during the rainy season (summer–early autumn), characterized by higher moisture content and potential compositional variations derived from seasonal consumption patterns. The public service sample was collected in January 2026, during the winter season, a period dominated by dry conditions and changes in waste composition [30,31]. Regarding the public collector for route 19, a gross weight of 16,780 kg was recorded at full load, with a tare weight of 10,250 kg after discharge, corresponding to a net mass of 6530 kg, shown in Figure 2.
The selection and classification of by-products were performed in accordance with MX-AA-022-1985, yielding a sample of 190.18 kg. Quantification was carried out using Equation (1):
P S = G 1 G × 100 ,
where PS = % of the considered by-product; G1 = weight in kg of the considered by-product (excluding the weight of the bag); and G = total weight of the sample in (minimum 50 kg) [28].
EMS assessment
The application of indicators to the EMS is presented in Table 3.
The assessment of the FDS was conducted in accordance with the NOM-083-SEMARNAT-2003, Table 4.

3. Results

3.1. Analysis of the EMS

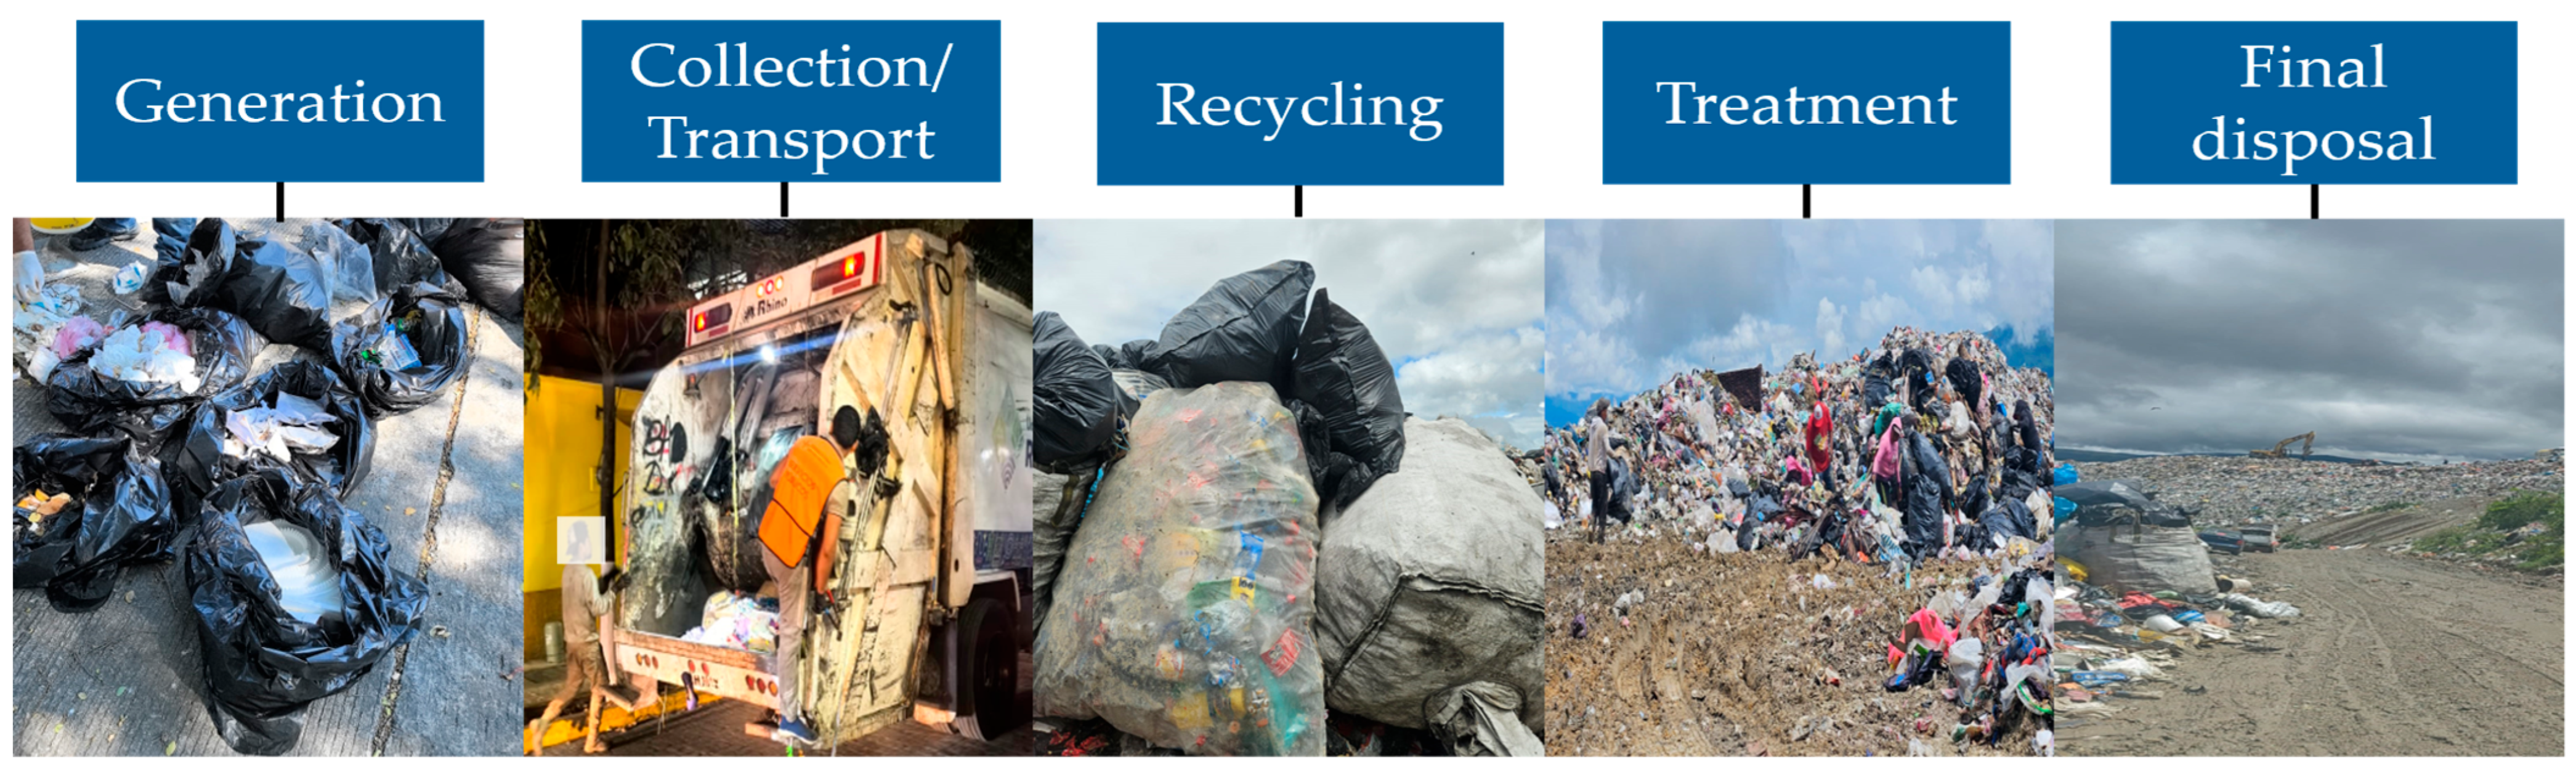
The results presented in this section are based on primary operational data obtained from municipal records corresponding to the year 2024, collected through formal administrative requests directed to the authority responsible for public services [33]. These data were processed exclusively for analytical purposes to evaluate system performance. The municipal EMS presents deficiencies in the processes of collection, transport, deposit, treatment, recovery of valuable products, vehicle fleet, citizen participation, and environmental protection. The analysis identified the process represented in Figure 3.

3.1.1. Generation, Collection and Transport

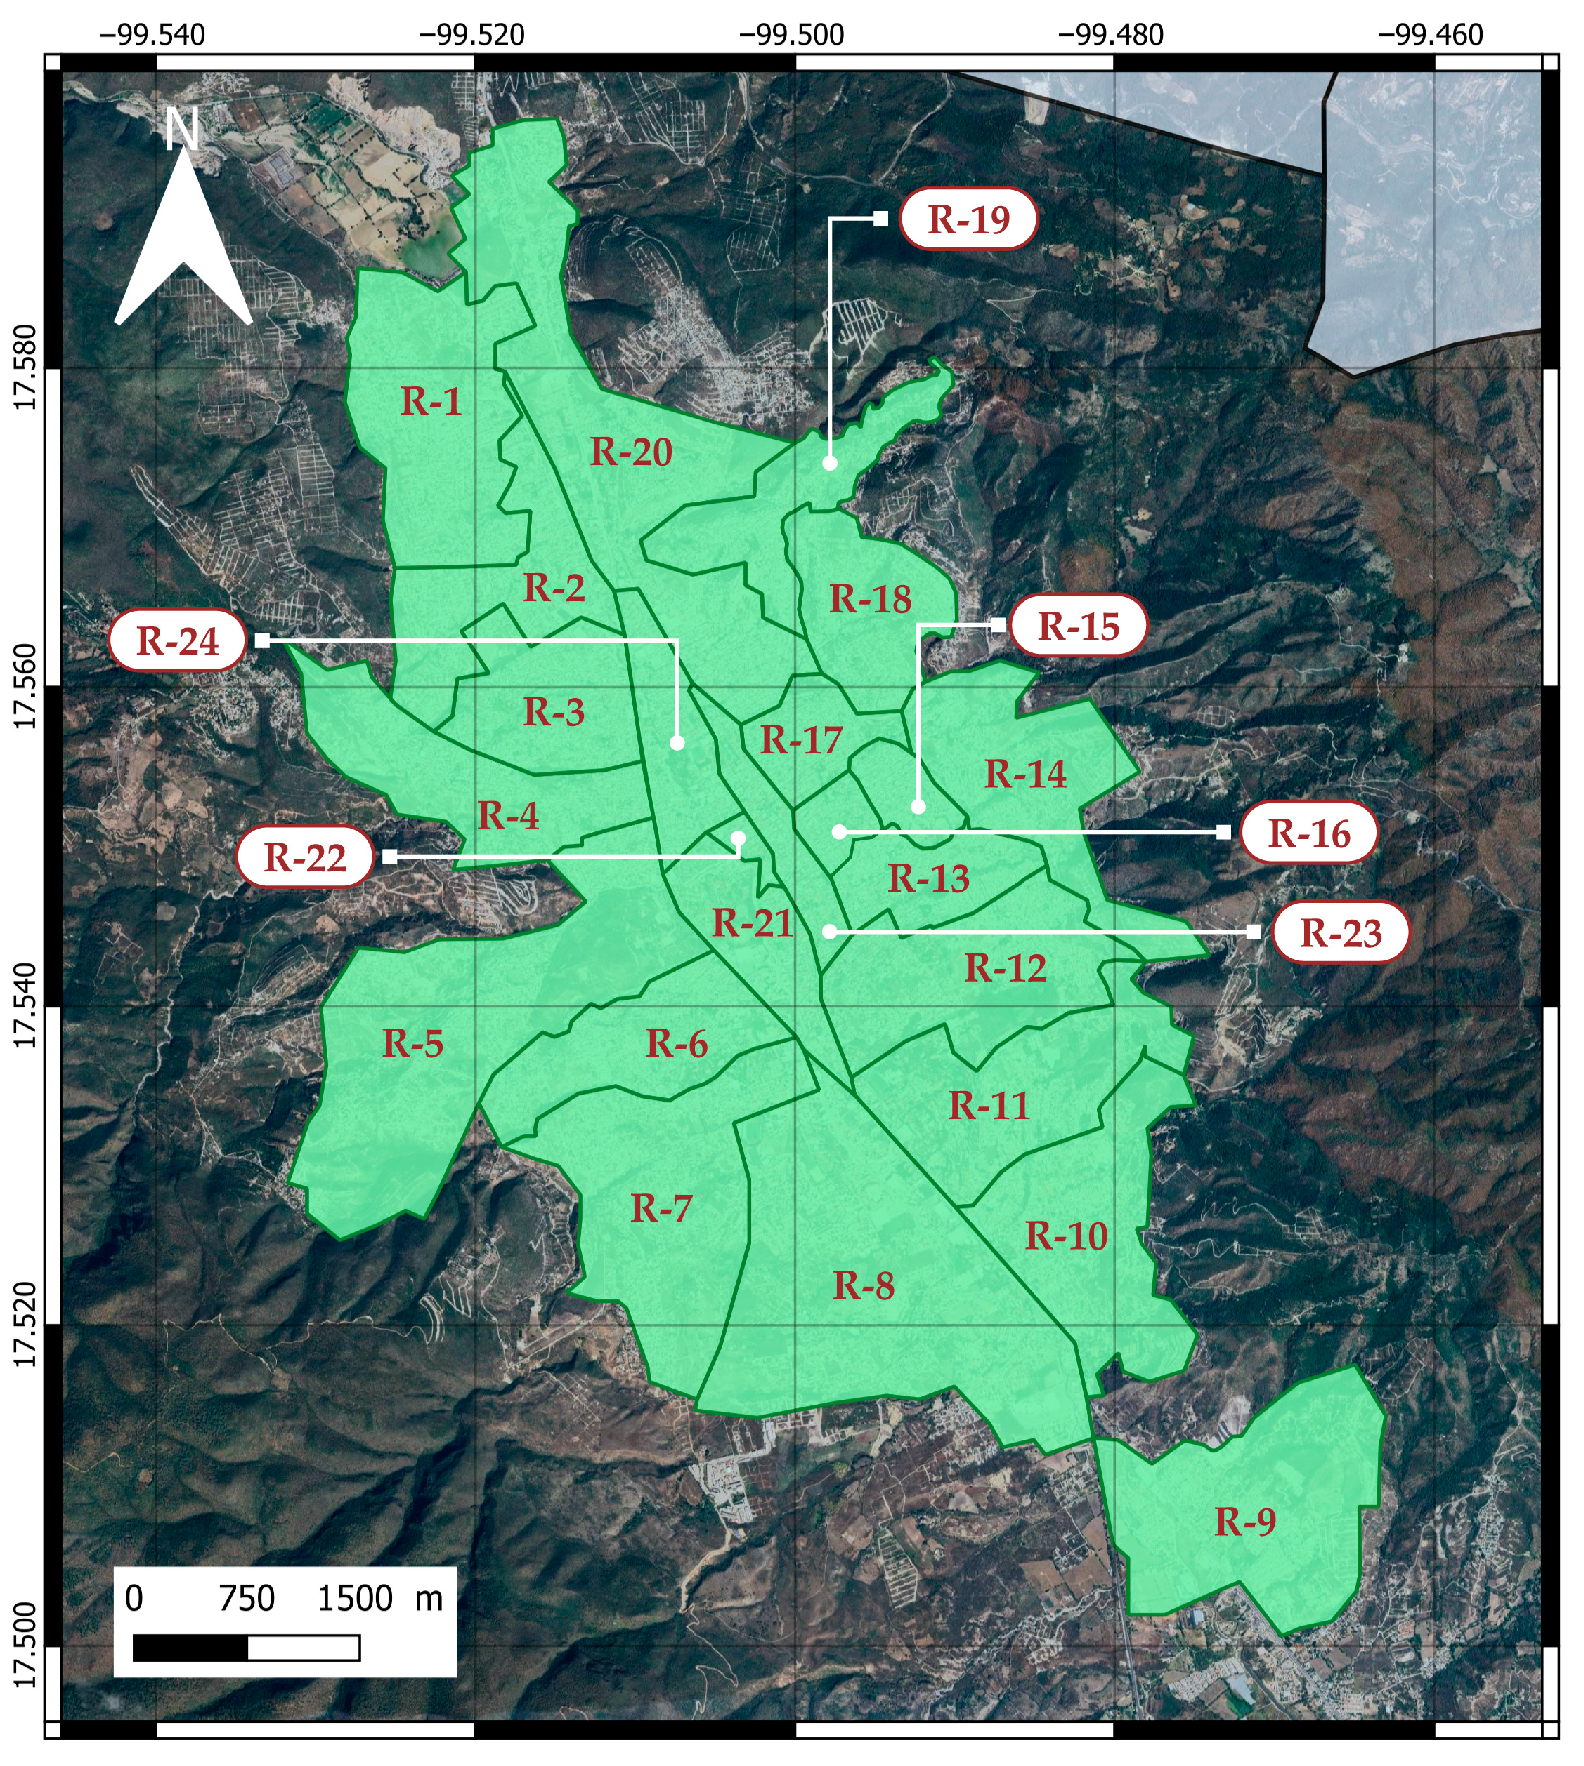
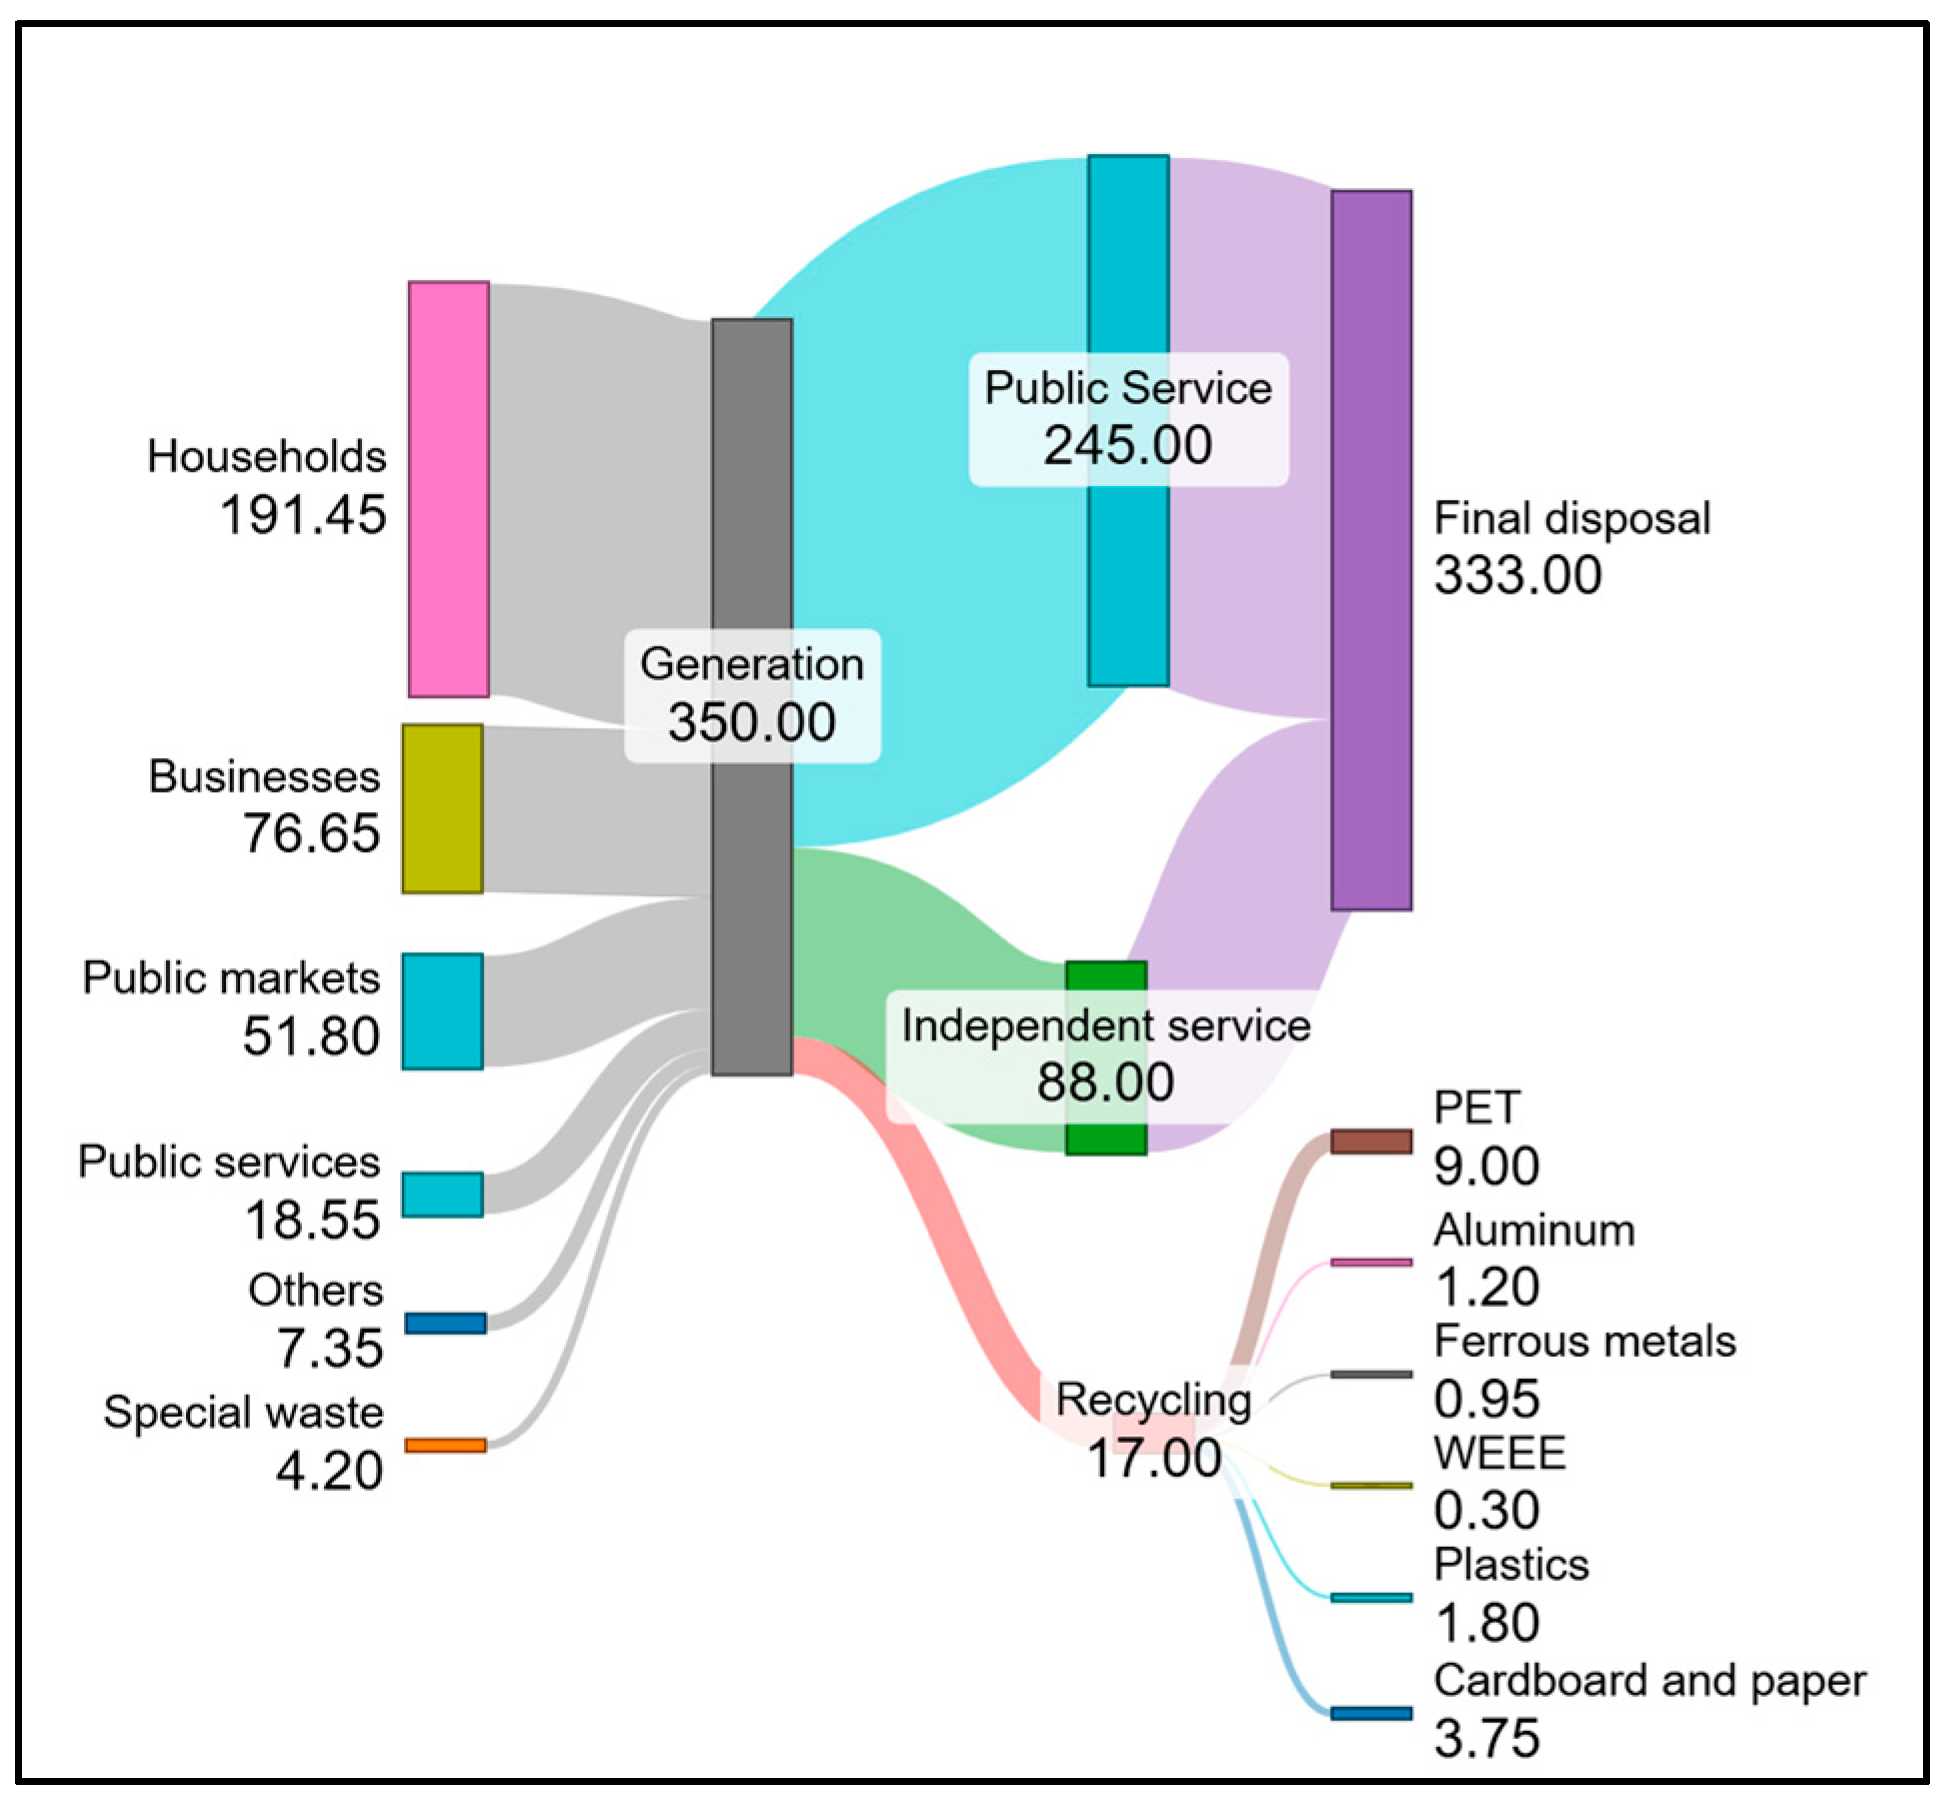
In the city, an average of 350 tons of waste is generated daily, approximately 1.2 kg per capita. The collection service is street-by-street, sectorized into 24 routes using 30 municipal trucks (15 owned and 15 leased) and approximately 170 independent pickup trucks known as “La basura jefa”, which operate based on voluntary contributions (Figure 4, Table 5 and Table 6).

3.1.2. Recycling and Treatment

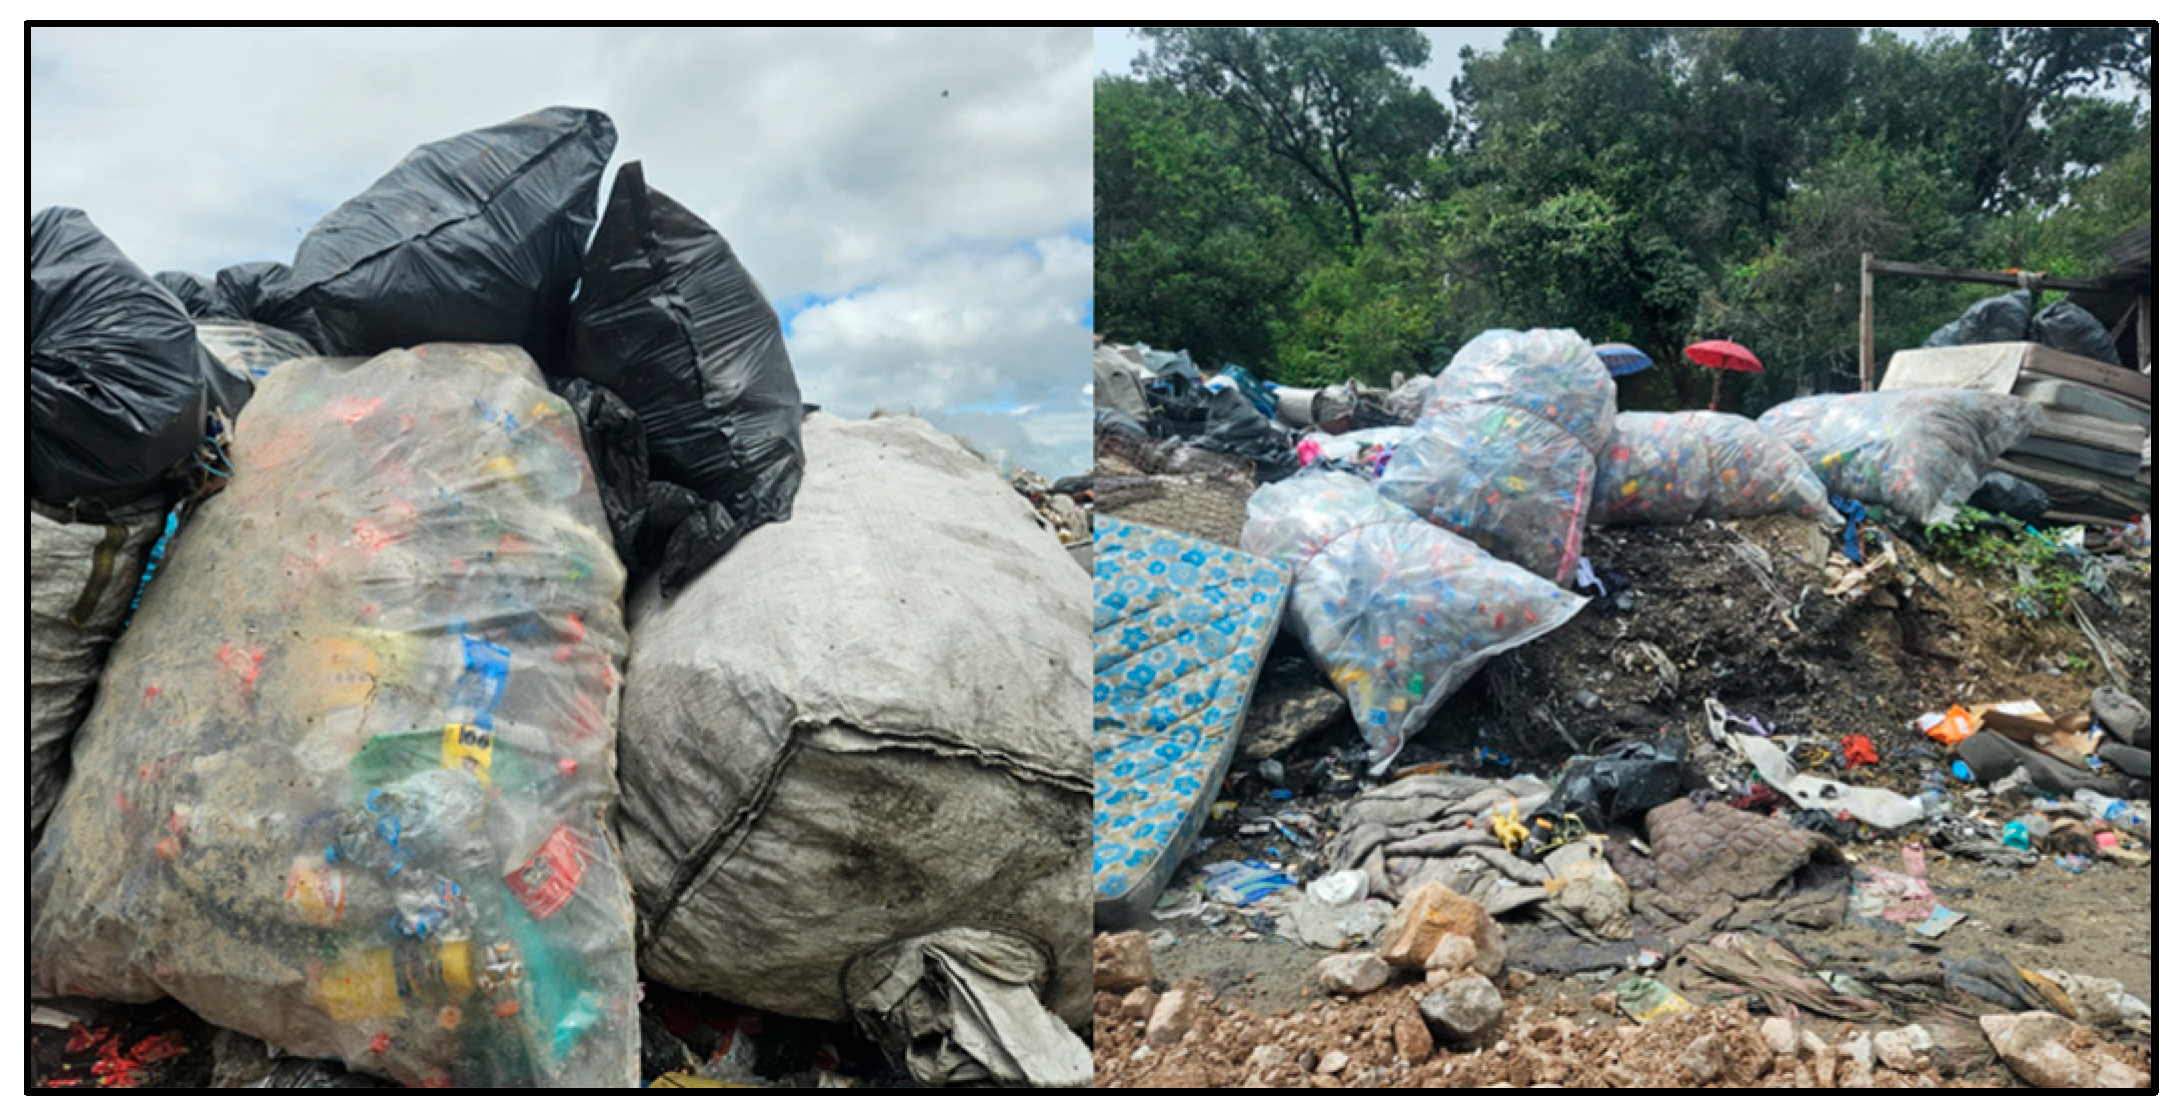
In the city of Chilpancingo, there are no transfer stations or MSW treatment plants. The system lacks selective collection; instead, workers and scavengers independently separate materials—primarily PET, cardboard, and paper, among others. Consequently, only 4.86% of MSW is transferred to private companies for recovery (Table 7 and Figure 5).

3.1.3. Final Disposal of MSW

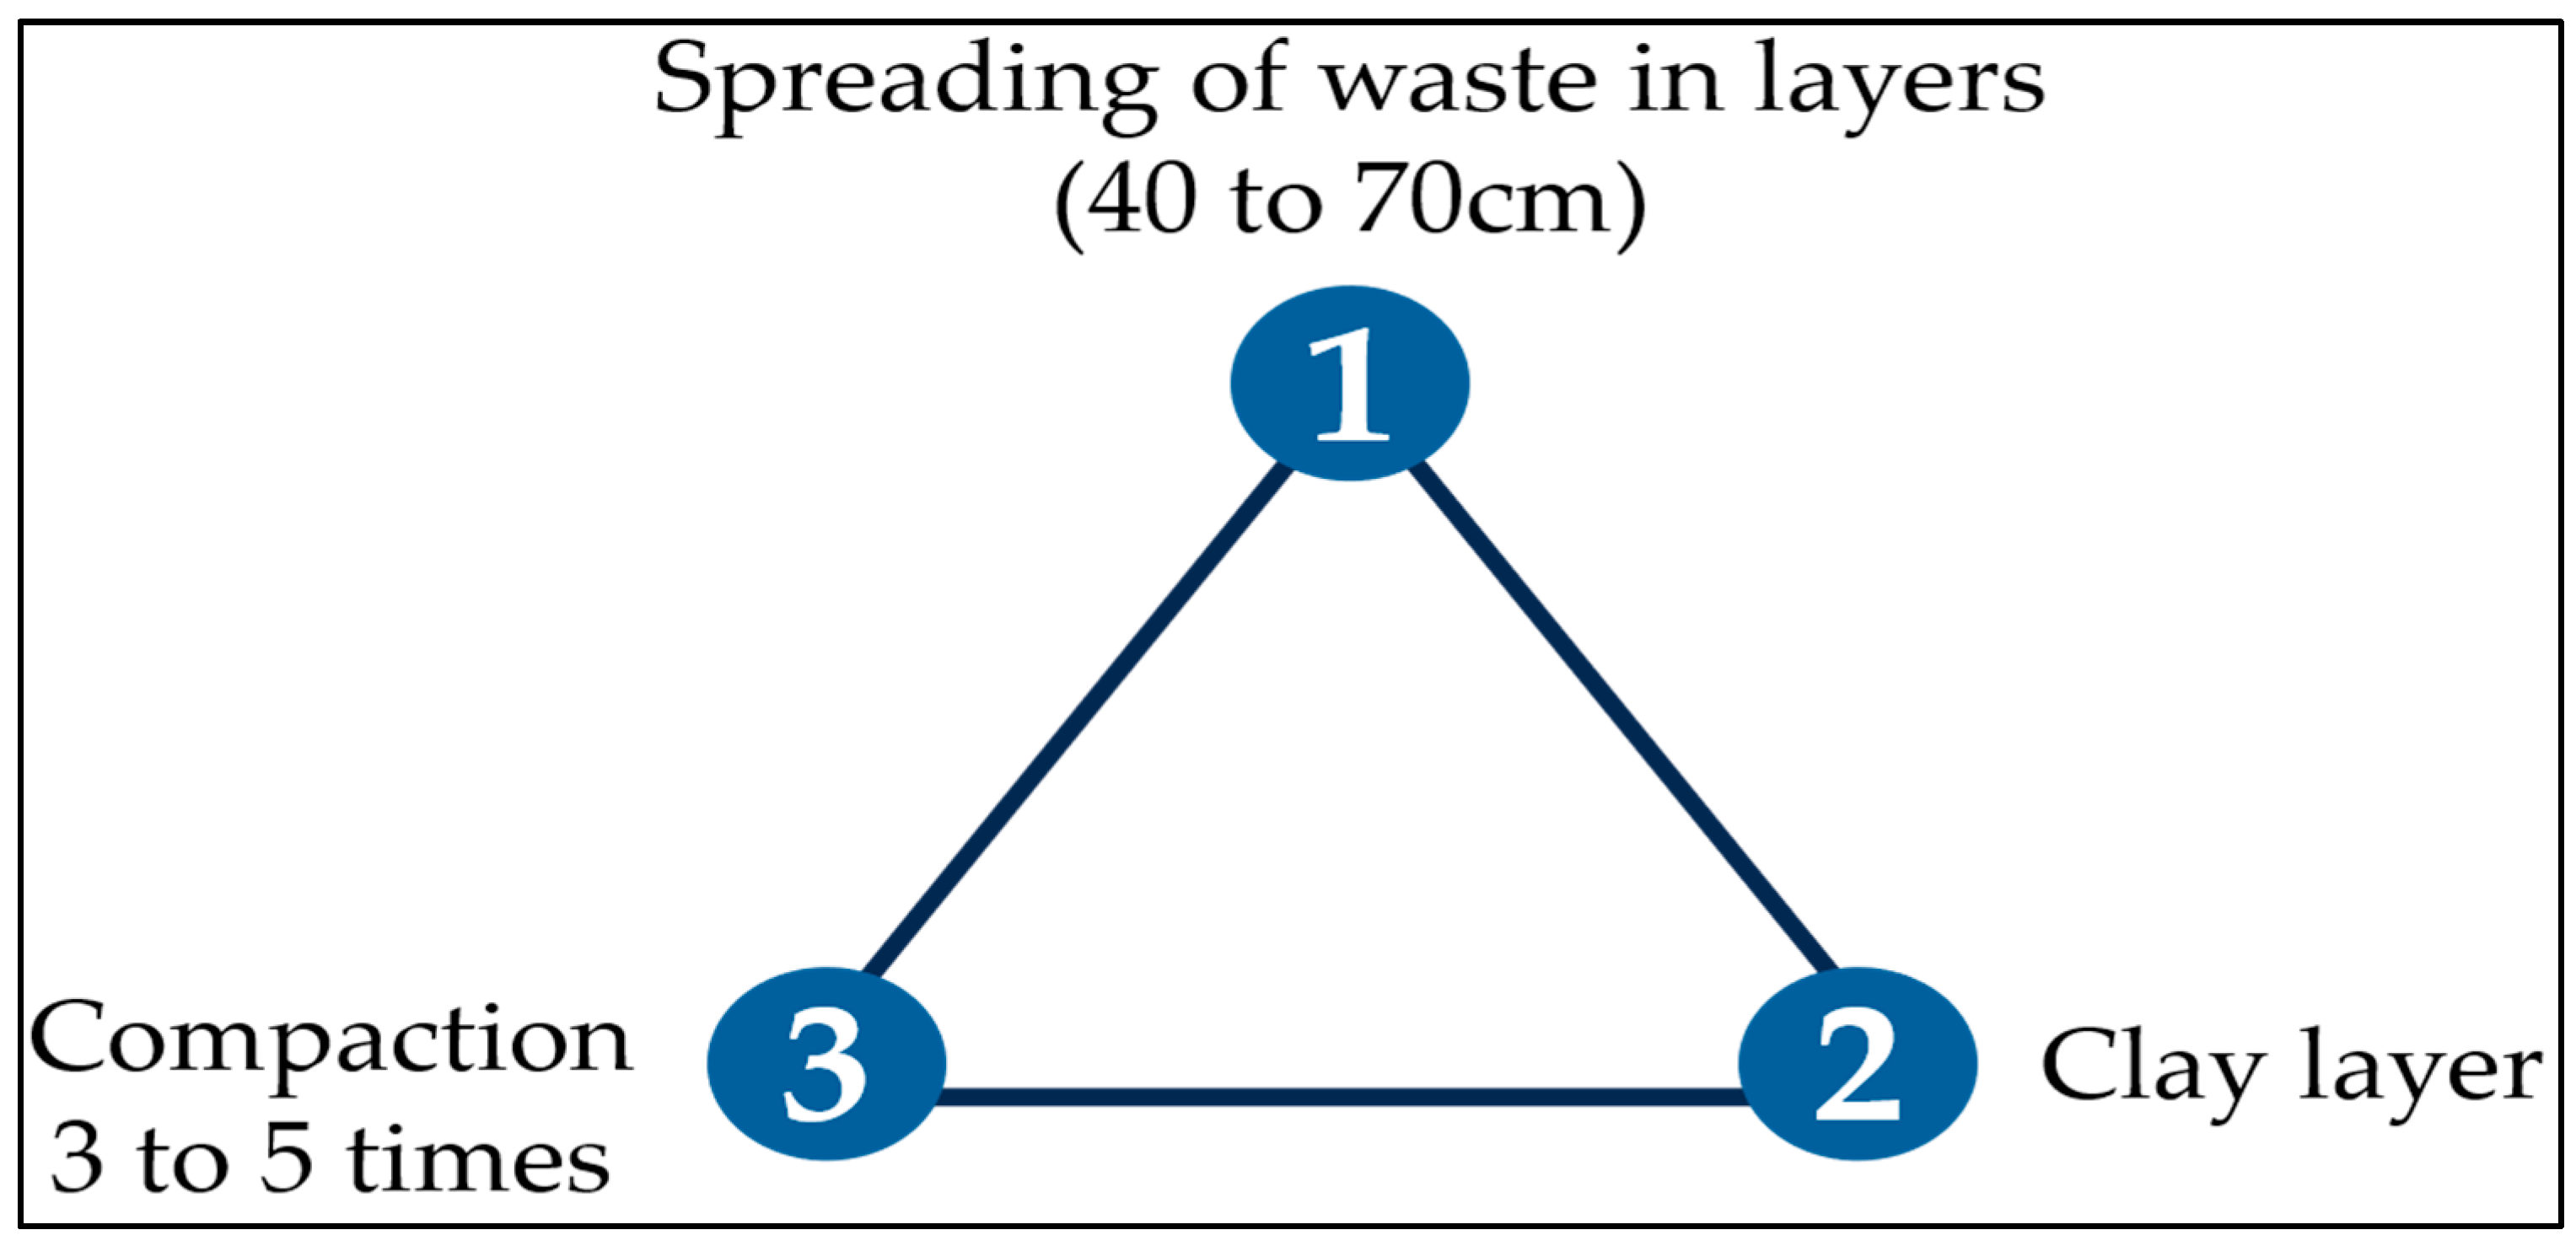
Final disposal is carried out at a site known as “El Huiteco,” classified as a Category A landfill. The site covers an area of 4.5 hectares and features three cells equipped with geomembrane liner systems, daily treatment coverage, and a dedicated vehicle fleet. It is owned by the Honorable Municipal City Council and is located in the northern part of the city; see Table 8 and Table 9, Figure 6 and Figure 7.
Final disposal takes place on a site Known as “El Huiteco”, classified as type A, with an area of 4.5 hectares. The annual costs incurred by the municipality for collection and FDS management are presented in Table 10.

3.2. Evaluation of the MSW Management System

The EMS evaluation comprised MSW characterization and the application of indicators. The characterization results of the samples from the municipal collection vehicle and the independent service are indicated in Table 11.
Regarding sustainability indicators, it is important to note that the municipality does not account for all indicators, as it lacks the complete infrastructure across the collection, treatment, recycling and final disposal processes. Only the indicators presented in Table 12 could be applied.
Another critical aspect is the result of the evaluation of the degree of compliance with FDS parameters in accordance with standard NOM-083-SEMARNAT-2003. Out of ten parameters, only 10% comply with the regulatory specifications, 40% partially comply, and 50% presented non-compliance. The most critical failures, observed in Table 4 are biogas control (parameters 3, 5 and 8) and environmental and contingency monitoring (parameter 9), which violate Sections 7.2, 7.10 and 7.11 of the the NOM-083-SEMARNAT-2003 standard. Likewise, since operations began in 2017 (parameter 10) and the absence of technical justification for its expansion suggest that the site has exceeded its regulatory useful life of three years. Furthermore, the geological barrier criteria (parameter 4) and compaction (parameter 7) showed an insufficient degree of compliance, given that no verifiable information is available on impermeabilization materials or on compaction densities exceeding 600 kg/m3 as required by the standard for type A2 FDS. Regarding the geographic location criterion (parameter 1), the FDS is situated 14 km from the urban area, exceeding the minimum of 500 m established in Section 6.1.3 of the NOM-083-SEMARNAT-2003 standard.

4. Discussion

The evaluation of the MSW EMS in Chilpancingo allowed for the identification of its composition, handling, population consumption habits, and the structural deficiencies of the system. The EMS is comprised of the processes of generation, collection, transport, treatment, and final disposal. This design contrasts with management models that include source segregation, quantification and weighing, recovery of recyclable materials, thermal treatment (incineration), energy recovery, and environmental monitoring, as studied by [34] in India. Similarly, ref. [35] reported an EMS with operational capabilities identified as geospatial monitoring, operational resource assessment, and the control of illegal disposal sites in Rampurhat, India. Furthermore, ref. [36] identified additional phases such as actual generation quantification, environmental and economic life cycle analysis (LCA) of MSW, and the evaluation of material and energy substitution, revealing a significant gap compared to the scope of the municipal EMS within the proposed European framework. The characterization was carried out in according to the Mexican standard NOM-AA-022-1985, which establishes the quartering method, in contrast to [37], which applied a methodology based on a standard volume of 1   m 3 . Regarding by-product classification, this research identified 25 categories, whereas [11] classified only 10 in a South African study. The results showed that 54% of the waste consisted of recyclables (plastics, paper, glass, and metal) and 16% was organic (food, feces, and bone). These findings partially coincide with those of [13], which characterized waste as being 53.5% recyclables (plastics, paper, glass, and metals) and 11.9% organic. Another significant aspect to highlight is the high presence of biodegradable material suitable for composting, the lack of source separation, and the mixing of hazardous and sanitary waste. This stands in contrast to [38], which reported that in rural Italy, biodegradable (organic) waste is sent to the aerobic composting plant in Teora, while urban organic waste is processed at the shredding and baling plant in Avellino. The marked contrast in MSW composition between the public and independent services is primarily due to the distinct operational logics of each collection scheme. The public service captures mixed household waste with a predominance of the organic fraction derived from food-related activities, a pattern consistent with findings in urban contexts [13]. In contrast, the independent service operates under a logic of economic valorization. Its operators prioritize the selective recovery of high-value recyclable materials, particularly plastics, effectively acting as a pre-filter within the management chain. Therefore, the observed differences do not reflect variations in waste generation itself but rather the coexistence of two circuits with differing objectives: one oriented toward the mass collection of non-valorized waste, and the other focused on the recovery of materials with economic value.
The application of indicators demonstrates their practicality for monitoring the performance and scope of an EMS, which aligns with the findings in refs. [39,40,41,42], which also utilized them in EMS evaluations. Regarding the structural absence of indicators related to recycling, treatment, operational efficiency, energy consumption, emissions, or service performance, this study considered 28 indicators, of which only 9 were applicable. In contrast, ref. [40] utilized 62 out of 151 potential indicators.
Regarding the fees for integrated waste management services, their operational destination, and their strengthening—as established in the regulatory framework under LGPGIR, Article 10, Fraction XI—this study identified an absence of tariffs and fiscal incentives. These elements constitute a structural weakness of the EMS, where less than 5% of MSW is recycled. These findings contrast with those reported by [43], which analyzed Extended Producer Responsibility (EPR) policies and documented that jurisdictions with established regulatory frameworks achieve plastic recycling rates between 25% and 45% while reducing landfill disposal to less than 40% of the total waste generated. Consequently, it is confirmed that the various sustainability approaches of an EMS depend not only on infrastructure but also on institutional capacity to measure, compare, and correct performance. This reaffirms that an integrated evaluation serves as the essential baseline for consolidating public policies focused on circular economy, traceability, and regulatory compliance.

5. Conclusions

The analysis of the MSW EMS in Chilpancingo, Guerrero, Mexico, reveals that out of 28 sustainability indicators typically utilized in medium and large cities, only 32% were applicable. These were used to quantify the processes of generation (per capita solid waste generation (1.1), composition by waste type (1.2), and per capita household waste generation (1.3)); collection and transport (collection service coverage (2.1) and per capita collected waste (2.2)); recycling (solid waste recycling rate (3.1)); and final disposal (waste disposal in sanitary and controlled landfills (5.1), land use (5.4), and total cost of sanitary landfill disposal (5.8)). This evidences the insufficient performance of the EMS to guarantee sustainable management in accordance with the LGPGIR and Mexican Official Standard NOM-083-SEMARNAT-2003. The evaluation of sustainability indicators is a vital tool for measuring and comparing EMS performance, allowing for the detection of failures and potential improvements in each stage to ensure the integrated management of MSW. Characterization and byproduct classification are crucial for the valorization of waste—whether for recycling, composting, or recovery—to prevent materials from being sent directly to landfills, where they cause pollution and health risks.
Under the Zero Waste approach, it is imperative for municipalities to prioritize prevention, reduction, reuse, and material recovery throughout the waste life cycle within the LGPGIR framework. Furthermore, implementing municipal programs is essential to transition from an operational scheme dependent on public spending to a self-financed, circular model, thereby reducing the burden on the Final Disposal Site (FDS) and improving EMS efficiency. This study proposes four strategies based on the findings obtained under the Zero Waste approach: 1. Valorization of the Organic Fraction: Implementing decentralized composting in neighborhoods. Since public services currently concentrate 33.64% of untreated organic waste, this would reduce the volume sent to final disposal and generate a marketable soil improver, contributing to the system’s self-financing; 2. Source Separation and Formal Recovery: Given that 54% of the characterized waste consists of recyclables, their valorization currently depends on informal recyclers who perform selective recovery without regulation or systemic benefit. Formalizing this process is essential; 3. Biogas Capture and Utilization at the FDS: Implementing collection systems at the FDS to reduce methane emissions and mitigate environmental impacts, while generating revenue through energy recovery to support the system’s financial sustainability; 4. Financial and Institutional Framework: Implementing tariffs and incentives. Although contemplated in the LGPGIR, the current lack of these mechanisms constitutes a structural barrier to operational improvements. The transition toward Zero Waste requires both physical infrastructure and financial mechanisms that incentivize waste diversion from the FDS. This establishes a foundation for future research focused on the integrated management of municipal EMS, including technical and economic feasibility studies for decentralized composting and biogas capture in Chilpancingo. Additionally, there is a need for indicator systems adapted to middle-income Mexican municipalities with data deficits, alongside the analysis of tariff and incentive models compatible with Mexican regulations to facilitate the transition toward a self-financed and circular EMS.


Author Contributions

Conceptualization, M.C.-B., D.P.-R. and C.V.M.-V.; methodology, M.C.-B., D.P.-R. and C.M.-M.; software, M.C.-B., D.P.-R. and A.B.-N.; validation, M.C.-B., D.P.-R., D.A.-H. and Y.E.-A.; formal analysis, M.C.-B., D.P.-R. and S.R.Z.-B.; investigation, M.C.-B., D.P.-R. and C.V.M.-V.; resources, M.C.-B., D.P.-R. and C.M.-M.; data curation, M.C.-B., D.P.-R. and A.B.-N.; writing—original draft preparation, M.C.-B., D.P.-R., D.A.-H. and Y.E.-A.; writing—review and editing, M.C.-B., D.P.-R. and S.R.Z.-B.; visualization, M.C.-B., D.P.-R., S.R.Z.-B. and A.B.-N.; supervision, M.C.-B., D.P.-R. and C.V.M.-V.; project administration, M.C.-B., D.P.-R. and C.M.-M. All authors have read and agreed to the published version of the manuscript.

Funding

This research received no external funding.

Institutional Review Board Statement

Not applicable.

Data Availability Statement

The data are available upon request from the authors.

Conflicts of Interest

The authors declare no conflicts of interest.

Abbreviations

The following abbreviations are used in this manuscript:
MSWMunicipal Solid Waste
EMSEnvironmental Management System
MDPMunicipal Development Plan
FDSFinal Disposal Site
SDGsSustainable Development Goals
LCALife Cycle Assessment
BAUBusiness As Usual
CTUeComparative Toxicity Units for ecosystems
WtEWaste-to-Energy

Appendix A

Table A1. Generation indicators.
IndicatorDescriptionFormula
1.1. Per capita generationAverage annual quantity of urban waste generated per inhabitant of a population (kg/inhab./year) A n n u a l   a v e r a g e   o f   m u n i c i p a l   w a s t e   g e n e r a t e d T o t a l   p o p u l a t i o n
1.2. Waste compositionPercentage proportion represented by each component or specific fraction within the total waste stream (%) A m o u n t   o f   s p e c i f i c   w a s t e T o t a l   w a s t e × 100
1.3. Household waste per capitaAverage annual quantity of waste generated exclusively in the domestic sphere per inhabitant (kg/inhab./year) T o t a l   w e i g h t   o f   d o m e s t i c   w a s t e T o t a l   p o p u l a t i o n
Table A2. Collection and transport indicators.
IndicatorDescriptionFormula
2.1. Collection coveragePercentage of the urban population with regular and continuous access to the collection service (%) P o p u l a t i o n   s e r v e d T o t a l   p o p u l a t i o n × 100
2.2. Waste collection per capitaTotal quantity of domestic waste effectively collected in relation to the number of city (t/inhab./year) T o t a l   w e i g h t   o f   d o m e s t i c   w a s t e T o t a l   p o p u l a t i o n
2.3. Degree of segregationPercentage proportion of materials that are separated and recovered for valorization relative to total collected waste (%) S e p a r a t e d   w a s t e C o l l e c t e d   w a s t e × 100
2.4. Percentage of vehicles using renewable fuelPercentage of the vehicle fleet dedicated to waste management that operates on fuels from renewable sources (%) R e n e w a b l e   f u e l   v e h i c l e s T o t a l   v e h i c l e s × 100
Table A3. Recycling indicators.
IndicatorDescriptionFormula
3.1. Solid waste recycling ratePercentage of waste that is effectively recycled relative to total waste generated (%) Recycled   waste Generated   waste × 100
3.2. Degree of non-compliance with the regulatory frameworkNumber of environmental legislation non-compliance notices detected during inspections (%) N   o f   n o n c o m p l i a n c e   n o t i c e s N   o f   i n s p e c t i o n s × 100
3.3. Water consumptionVolume of water consumed at valorization and recycling facilities in relation to the quantity of waste processed (L/t) W a t e r   u s e d W a s t e   a t   f a c i l i t i e s
3.4. Land useArea required by recovery and recycling facilities to process each unit of waste (m2/t) F a c i l i t y   s u r f a c e   a r e a I n b o u n d   w a s t e
3.5. Energy consumptionQuantity of energy or fuel required to process each unit of waste deposited at valorization and recycling facilities (kWh/t) E n e r g y   a m o u n t D e p o s i t e d   w a s t e
3.6 Inclusion of waste pickers in the selective collection system (planning and implementation)Percentage of collection vehicles dedicated specifically to selective waste collection relative to the total collection fleet (%) N   o f   c o l l e c t o r s T o t a l   p e r s o n n e l × 100
Table A4. Treatment indicators.
IndicatorDescriptionFormula
4.1. Amount of MSW treated per capitaQuantity of municipal solid waste processed daily in relation to the total (t/inhab./year) W a s t e   p r o c e s s e d   p e r   d a y P o p u l a t i o n
4.2. Total installed capacity for energy production from renewable sourcesTotal volume of electricity generated from renewable sources within waste management and valorization facilities (Mw)----
4.3. Total Material Recovery Facility (MRF) capacity per capita (removal or reduction of pollutants)Quantity of materials recovered from the waste stream in relation to the city population (t/inhab./year) R e c o v e r e d   m a t e r i a l s P o p u l a t i o n
4.4. Total amount of MSW processed in an MRF per capitaNumber of materials processed at sorting and material recovery facilities (t/inhab./year) P r o c e s s e d   m a t e r i a l s P o p u l a t i o n
4.5. Percentage of total collected MSW treated in composting facilities per yearNumber of materials processed at sorting and material recovery facilities (%) A n n u a l   w a s t e   t r e a t e d   b y   c o m p o s t i n g A n n u a l   c o l l e c t e d   w a s t e × 100
4.6. Amount of waste generated in composting facilities per capitaQuantity of waste annually generated within composting facilities in relation to the total population (t/inhab./year) A n n u a l   w a s t e   a t   f a c i l i t i e s P o p u l a t i o n
4.7. Amount of fertilizer sold per capita (compost)Quantity of fertilizers obtained as a product of the composting process that are commercialized, in relation to the total population (kg/inhab./year) F e r t i l i z e r   s o l d P o p u l a t i o n
4.8. Total capacity of composting facilities per capitaTotal installed capacity for processing municipal solid waste at composting facilities in relation to the total population (t/inhab./year) C o m p o s t i n g   f a c i l i t y   c a p a c i t y P o p u l a t i o n
Table A5. Final disposal indicators.
IndicatorDescriptionFormula
5.1. Waste disposal in sanitary and controlled landfillsPercentage of waste deposited in landfills relative to total waste generated (%) W a s t e   d e p o s i t e d   i n   l a n d f i l l s G e n e r a t e d   w a s t e × 100
5.2. Degree of compliance with the environmental regulatory standardProportion of environmental legislation non-compliances detected during inspections carried out at waste disposal facilities (%) N o n c o m p l i a n c e   n o t i c e s I n s p e c t i o n s   p e r f o r m e d × 100
5.3. Water consumptionVolume of water consumed at waste disposal facilities in relation to the quantity of waste processed (L/t) V o l u m e   o f   w a t e r   u s e d W a s t e   a t   t h e   f a c i l i t y
5.4. Land useReflects the area required by disposal facilities to process each unit of waste (m2/t) S u r f a c e   a r e a   u s e d   m 2 W a s t e
5.5. Waste management expenditure per capitaTotal expenditure allocated to the integral management of municipal solid waste in relation to the total local population ( R $ i n h a b . / y e a r ) W a s t e   m a n a g e m e n t   e x p e n d i t u r e P o p u l a t i o n
5.6. Total cost of waste collectionTotal operation and maintenance cost associated with waste collection and transport activities per capita ( R $ i n h a b . / y e a r ) O p e r a t i o n   a n d   m a i n t e n a n c e   c o s t P o p u l a t i o n   s e r v e d
5.7. Total cost of landfill disposalTotal operation and maintenance cost of final waste disposal facilities in relation to the total population ( R $ i n h a b . / y e a r ) F i n a l   d i s p o s a l   f a c i l i t y   c o s t P o p u l a t i o n

References

  1. Cámara de Diputados del H. Congreso de la Unión. Ley General Para la Prevención y Gestión Integral de los Residuos; Cámara de Diputados del H. Congreso de la Unión: Mexico City, Mexico, 2003.
  2. United Nations Environment Programme. Global Waste Management Outlook 2024: Beyond an Age of Waste Turning Rubbish into a Resource; United Nations Environment Programme: Nairobi, Kenya, 2024; ISBN 978-92-807-4129-2. [Google Scholar]
  3. UNESCO. “Trash Hack”: Educación Para el Desarrollo Sostenible a Través de la Acción: Guía para los Docentes; UNESCO: Paris, France, 2021. [Google Scholar]
  4. Kaza, S.; Yao, L.; Bhada-Tata, P.; Van Woerden, F. What a Waste 2.0: A Global Snapshot of Solid Waste Management to 2050; World Bank Publications: Washington, DC, USA, 2018. [Google Scholar]
  5. ONU-Habitat Recolectar y Eliminar Residuos de Manera Eficiente. Available online: https://onu-habitat.org/index.php/recolectar-y-eliminar-residuos-de-manera-eficiente?highlight=WyJnZXN0aVx1MDBmM24iLCJkZSIsInJlc2lkdW9zIl0= (accessed on 26 March 2024).
  6. SNIARN Bases de Datos Estadísticos, Cartográficas y Documentales Que Recopilan, Organizan y Difunden la Información Sobre los Recursos Naturales. Available online: https://www.gob.mx/semarnat/acciones-y-programas/sistema-nacional-de-informacion-ambiental-y-de-recursos-naturales (accessed on 22 April 2025).
  7. Dada, A.; Stanoevska-Slabeva, K.; Gómez, J.M. Organizations’ Environmental Performance Indicators; Springer: Berlin/Heidelberg, Germany, 2013. [Google Scholar] [CrossRef] [Scilit]
  8. Bhumkittipich, P.; Iamsomboon, N.; Siramaneerat, I.; Mueangmin, C.; Bhumkittipich, K. Competency-Based Environmental Governance for Zero-Waste Communities Using a Novel ARUN Model. Environments 2025, 12, 453. [Google Scholar] [CrossRef] [Scilit]
  9. Noudeng, V.; Pheakdey, D.V.; Minh, T.T.N.; Xuan, T.D. Municipal Solid Waste Management in Laos: Comparative Analysis of Environmental Impact, Practices, and Technologies with ASEAN Regions and Japan. Environments 2024, 11, 170. [Google Scholar] [CrossRef] [Scilit]
  10. Singh, D.J.; Dikshit, A.K.; Dangi, M.B.; Tchobanoglous, G.; Kumar, S. Performance Analysis of Municipal Solid Waste Management Using Technical Indicators. Environ. Sustain. Indic. 2025, 26, 100693. [Google Scholar] [CrossRef] [Scilit]
  11. Etim, E.; Tashi Choedron, K.; Ajai, O. Municipal Solid Waste Management in Lagos State: Expansion Diffusion of Awareness. Waste Manag. 2024, 190, 261–272. [Google Scholar] [CrossRef] [Scilit]
  12. Volsuuri, E.; Owusu-Sekyere, E.; Zarouk Imoro, A.; Napoleon Bellua, S. Assessing the Efficiency of Solid Waste Collection Services in Urban Ghana. Waste Manag. Bull. 2023, 1, 71–81. [Google Scholar] [CrossRef] [Scilit]
  13. Noman, A.A.; Rafizul, I.M.; Moniruzzaman, S.M.; Kraft, E.; Berner, S. Assessment of Municipal Solid Waste from Households in Khulna City of Bangladesh. Heliyon 2023, 9, e22446. [Google Scholar] [CrossRef] [Scilit]
  14. Derdera, S.E.; Ogato, G.S. Towards Integrated, and Sustainable Municipal Solid Waste Management System in Shashemane City Administration, Ethiopia. Heliyon 2023, 9, e21865. [Google Scholar] [CrossRef] [Scilit]
  15. Eshete, A.; Haddis, A.; Mengistie, E. Investigation of Environmental and Health Impacts Solid Waste Management Problems and Associated Factors in Asella Town, Ethiopia. Heliyon 2024, 10, e28203. [Google Scholar] [CrossRef] [Scilit]
  16. Rada, E.C.; Ionescu, G.; Conti, F.; Cioca, L.I.; Torretta, V. Energy from Municipal Solid Waste: Some Considerations on Emissions and Health Impact. Calitatea 2018, 19, 118–122. [Google Scholar]
  17. Sharma, A.; Ganguly, R.; Gupta, A.K. Life Cycle Assessment of Municipal Solid Waste Generated from Hilly Cities in India—A Case Study. Heliyon 2023, 9, e21575. [Google Scholar] [CrossRef] [Scilit]
  18. Kang, Y.O.; Yabar, H.; Mizunoya, T.; Higano, Y. Environmental and Economic Performances of Municipal Solid Waste Management Strategies Based on LCA Method: A Case Study of Kinshasa. Heliyon 2023, 9, e14372. [Google Scholar] [CrossRef] [Scilit] [PubMed]
  19. Oliveira, J.P.; Pessoa, F.L.P.; Mehl, A.; Alves, F.C.; Secchi, A.R. Sustainability Indicators to MSW Treatment Assessment: The Rio de Janeiro Case Study. Sustainability 2024, 16, 7445. [Google Scholar] [CrossRef] [Scilit]
  20. Ouedraogo, A.S.; Kumar, A.; Frazier, R.; Sallam, K.A. Comparative Life Cycle Assessment of Landfilling with Sustainable Waste Management Methods for Municipal Solid Wastes. Environments 2024, 11, 248. [Google Scholar] [CrossRef] [Scilit]
  21. Sierra Puentes, M.C.; Puerto-Rojas, E.M.; Correa-Galindo, S.N.; Aristizábal Cuellar, J.A. Using Community-Based Social Marketing to Promote Pro-Environmental Behavior in Municipal Solid Waste Management: Evidence from Norte de Santander, Colombia. Environments 2025, 12, 262. [Google Scholar] [CrossRef] [Scilit]
  22. Parlamento Europeo y Consejo de la Unión Europea. Directiva 2008/98/CE del Parlamento Europeo y del Consejo, de 19 de Noviembre de 2008, Sobre los Residuos y Por la Que se Derogan Determinadas Directivas; Parlamento Europeo y Consejo de la Unión Europea: Brussels, Belgium, 2008.
  23. OECD Environmental Statistics, Accounts and Indicators. Available online: https://www.oecd.org/en/topics/environmental-statistics-accounts-and-indicators.html (accessed on 11 April 2026).
  24. Instituto Nacional de Estadística y Geografía. Principales Resultados del Censo de Población y Vivienda 2020, Guerrero; Instituto Nacional de Estadística y Geografía: Aguascalientes, Mexico, 2023.
  25. H. Ayuntamiento de Chilpancingo de los Bravo. Plan Municipal de Desarrollo Chilpancingo de Los Bravo: Capital de Cultura y Progreso 2021–2024; H. Ayuntamiento de Chilpancingo de los Bravo: Chilpancingo de los Bravo, Guerrero, Mexico, 2021.
  26. Nom-083-Semarnat-2003; Especificaciones de Proteccion Ambiental para la Seleccion del Sitio, Diseño, Construccion, Operacion, Monitoreo, Clausura y Obras Complementarias de un Sitio de Disposicion Final de Residuos Solidos Urbanos y de Manejo Especial. Secretaría de Medio Ambiente y Recursos Naturales: Mexico City, Mexico, 2004.
  27. NMX-AA-015-1985; Proteccion al Ambiente-Contaminacion del Suelo-Residuos Solidos Municipales-Muestreo-Metodo de Cuarteo. Secretaría de Desarrollo Urbano y Ecología: Mexico City, Mexico, 1985.
  28. MX-AA-022-1985; Protección al Ambiente-Contaminación del Suelo-Residuos Sólidos Municipales-Selección y Cuantificación de Subproductos. Secretaría de Comercio y Fomento Industrial: Mexico City, Mexico, 1985.
  29. da Silva, L.; Marques Prietto, P.D.; Pavan Korf, E. Sustainability Indicators for Urban Solid Waste Management in Large and Medium-Sized Worldwide Cities. J. Clean. Prod. 2019, 237, 117802. [Google Scholar] [CrossRef] [Scilit]
  30. Agwe, T.M.; Twesigye-omwe, M.N.; Ukundimana, Z.; Rotimi, D.; Gupta, S. Effects of Seasonal Variations of the Physio-Chemical Properties of Municipal Solid Waste on Effective Materials and Resources Recovery. Sci. Rep. 2025, 15, 4548. [Google Scholar] [CrossRef] [Scilit]
  31. Lohani, A.; Bista, B.; Mahato, A.B.; Khanal, A.J.; Dulal, B.; Tripathee, B.R.; Karki, K.; Gurung, S.B.; Kafle, S.; Karki, B.K. Seasonal Variation in Solid Waste Composition and Characteristics in a Newly Formed Semi-Urban Municipality of Nepal. Clean. Waste Syst. 2025, 10, 100228. [Google Scholar] [CrossRef] [Scilit]
  32. El Gráfico de Guerrero. Controlan Fumarola en el Basurero Municipal de Chilpancingo. El Gráfico de Guerrero, 30 September 2025.
  33. Secretaría de Servicios Públicos del Municipio de Chilpancingo. Respuesta al Oficio SSP/RSU/014/2024 Sobre Generación y Manejo de RSU; Secretaría de Servicios Públicos del Municipio de Chilpancingo: Guerrero, Mexico, 2024.
  34. Meena, M.D.; Dotaniya, M.L.; Meena, B.L.; Rai, P.K.; Antil, R.S.; Meena, H.S.; Meena, L.K.; Dotaniya, C.K.; Meena, V.S.; Ghosh, A.; et al. Municipal Solid Waste: Opportunities, Challenges and Management Policies in India: A Review. Waste Manag. Bull. 2023, 1, 4–18. [Google Scholar] [CrossRef] [Scilit]
  35. Mondal, S.; Mandal, B. Assessment of Urban Solid Waste Management in a Class II Indian City Using Geospatial and Statistical Approaches: A Case Study of Rampurhat Municipality. Waste Manag. Bull. 2024, 1, 74–92. [Google Scholar] [CrossRef] [Scilit]
  36. Sund, J.H.; Albizzati, P.F.; Scheutz, C.; Tonini, D. Comprehensive Assessment of Environmental and Economic Impacts of the Entire EU Waste Management System. Waste Manag. 2025, 204, 114910. [Google Scholar] [CrossRef] [Scilit]
  37. Hemali, N.A.; De Alwis, A.A.P.; Wijesundara, M.; Edirisinghe, L.G.L.M. A Method for Determining the Recycling Value of Unprocessed Municipal Solid Waste in One Cubic Meter Waste Composition Analysis Technique. MethodsX 2024, 12, 102626. [Google Scholar] [CrossRef] [Scilit]
  38. Triassi, M.; De Simone, B.; Montuori, P.; Russo, I.; De Rosa, E.; Di Duca, F.; Crivaro, C.; Cerullo, V.; Pontillo, P.; Díez, S. Determination of Residual Municipal Solid Waste Composition from Rural and Urban Areas: A Step toward the Optimization of a Waste Management System for Efficient Material Recovery. Sustainability 2023, 15, 13378. [Google Scholar] [CrossRef] [Scilit]
  39. Andrade, M.Á.; Braga, R.M.Q.L.; Tavares, A.d.N.; Marques, R.C. The Use of Indicators in the Regulation of Municipal Solid Waste Management: A Bibliometric Analysis (2004–2024). Sustainability 2025, 17, 1348. [Google Scholar] [CrossRef] [Scilit]
  40. Santos, E.; Fonseca, F.; Santiago, A.; Rodrigues, D. Sustainability Indicators Model Applied to Waste Management in Brazil Using the DPSIR Framework. Sustainability 2024, 16, 2192. [Google Scholar] [CrossRef] [Scilit]
  41. Lepota, K.; Premlall, K.; Mabuza, M. Compositional Analysis of Municipal Solid Waste from Tshwane Metropolitan Landfill Sites in South Africa for Potential Sustainable Management Strategies. Waste 2025, 3, 22. [Google Scholar] [CrossRef] [Scilit]
  42. Lubello, C.; Fiaschi, S.; Notari, G. Municipal Solid Waste Composition and Efficiency of Separate Collection: A Case Study in Italy. Clean. Waste Syst. 2025, 11, 100272. [Google Scholar] [CrossRef] [Scilit]
  43. Tumu, K.; Vorst, K.; Curtzwiler, G. Global Plastic Waste Recycling and Extended Producer Responsibility Laws. J. Environ. Manag. 2023, 348, 119242. [Google Scholar] [CrossRef] [Scilit]
Figure 1. Methodological process.
Environments 13 00222 g001
Figure 2. Waste characterization process.
Environments 13 00222 g002
Figure 3. EMS phases of Chilpancingo, Guerrero, Mexico.
Environments 13 00222 g003
Figure 4. Collection routes. The green areas represent service coverage and R-labels indicate collection routes.
Environments 13 00222 g004
Figure 5. Separation of PET, aluminum, and cardboard at the FDS.
Environments 13 00222 g005
Figure 6. MSW treatment process.
Environments 13 00222 g006
Figure 7. MSW management flow in Chilpancingo de los Bravo (t/day) [25].
Environments 13 00222 g007
Table 1. Analysis of MDP *.
Element of the MDPDescription
ObjectiveStrengthen institutional capacity to improve governance, population, poverty, infrastructure, security, health, education, gender equality and environmental areas.
Strategic AxesAxis I Participatory and Inclusive Democracy: a municipal government close to the people, based on dialogue and citizen participation with an inclusion approach.
Axis II Human and Social Development: development of public policies that resolve and guarantee socio-economic and human well-being, prioritizing citizens and their basic needs.
Axis III Economic Prosperity with Sustainable Balance: Programme 21 for Integral Public Services drives the development of strategies for the adequate management of solid waste, drinking water, and environmental protection in vulnerable areas of the municipality.
* Information from ref. [25].
Table 2. Regulations applicable to MSW management.
Institutional FrameworkDescription
Mexico’s General Law for the Prevention and Integrated Management of Waste (Ley General para la Prevención y Gestión Integral de los Residuos, LGPGIR) 1.Establishes principles, competencies and responsibilities of the three levels of government.
Official Mexican Standard NOM-083-SEMARNAT-2003: Environmental protection specifications for the site selection, design, construction, operation, monitoring, closure, and complementary works of a FDS for MSW and special handling waste 2.Regulates the technical and environmental conditions for sanitary landfills and FDS.
* Mexican Standard NMX-AA-015-1985: Municipal solid waste—selection and quantification 3.Establishes procedures for the selection and quantification of solid waste.
* Mexican Standard NMX-AA-022-1985: Municipal solid waste—Procedure for municipal solid waste sampling 4.Defines the methodology for obtaining representative samples of MSW.
* Despite the age of standards NMX-AA-015-1985 and NOM-AA-022-1985 they remain in force in Mexico; 1 [1], 2 [26], 3 [27], 4 [28].
Table 3. EMS evaluation with sustainability indicators.
ProcessIndicatorIndicator Application
1. Generation1.1 Solid waste per capita 450.85   k g / i n h a b . / y e a r (1.2 k g / i n h a b . / d a y )
1.2. Composition by waste type46.42% organics
31.55% recoverables
22.03% others
1.3. Household waste per capita 247   k g / i n h a b . / y e a r
2. Collection and transport2.1. Collection coverage79.66%
2.2 Waste collection per capita 315.59   k g / i n h a b . / y e a r
2.3. Degree of segregation0
2.4. Percentage of vehicles using any renewable fuelN/A
3. Recycling3.1. Solid waste recycling rate4.86%
3.2. Degree of non-compliance with the regulatory framework0
3.3. Water consumption0
3.4. Land use0
3.5. Energy consumption0
3.6. Inclusion of waste pickers in the selective collection system (planning and implementation)0
4. Treatment4.1. Amount of MSW treated per capita0
4.2. Total installed capacity for energy production from renewable sources0
4.3. Total Material Recovery Facility (MRF) capacity per capita (removal or reduction of pollutants)0
4.4. Total amount of MSW processed in an MRF per capita0
4.5. Percentage of total collected MSW treated in composting facilities per year0
4.6. Amount of waste generated in composting facilities per capita0
4.7. Amount of fertilizer sold per capita (compost)0
4.8. Total capacity of composting facilities per capita0
5. Final disposal5.1. Waste disposal in sanitary and controlled landfills95.14%
5.2. Degree of compliance with the environmental regulatory standard0
5.3. Water consumption0
5.4. Land use0.35 m2/t
5.6 Waste management expenditure per capitaN/A
5.7. Total cost of waste collectionN/A
5.8. Total cost of landfill disposalUSD 3,663,584 anual
Note: 0 = absence of infrastructure or process; N/A (Not applicable) = indicators that cannot be evaluated due to conceptual or methodological limitations.
Table 4. Evaluation of the FDS.
Reported InformationRegulatory ComplianceStandard Specification 1
1. FDS located 14 km from the city,
location: 17°35′49.0″ N 99°29′05.0″ W
Compliance6.1.3 Minimum distance of 500 m from the boundary of the urban layout.
2. MSW generation and composition studyNon-compliance6.4 (a) Studies are required for projecting the useful life of the FDS.
3. Biogas estimationNon-compliance6.4 (b, c) No prior estimates of biogas or leachate are reported.
4. Geological barrier/ImpermeabilizationInsufficient7.1 No materials or liners parameters for cells are specified.
5. Biogas extraction: extraction wells without flaringNon-compliance7.2 In the absence of a recovery system, the standard mandates biogas flaring.
6. Operational emergency areaNon-compliance7.5 A designated area must be maintained for contingencies, natural disasters, or emergencies.
7. CompactionInsufficient7.6 FDS type A2 must achieve a compaction density greater than 600 kg/m3. Without reported reception rates or achieved density, compliance cannot be verified.
8. Fires/Fumaroles: Fumarole reported on 29 September 2025 2Non-compliance7.2, 7.10 (a) Points to inadequate generation/migration and control of biogas and/or cover.
1 [26], 2 [32].
Table 5. Characteristics of the municipal vehicle fleet.
VehicleNumber of VehiclesLoad Capacity (Tons)
Dump truck63.5
Nissan stake bed truck11.5
International 6-cubic yard dump truck14.5
7000 L water tanker17000 L
Compactor trucks58
Ford Ranger truck10.750
FOTON box truck (rental)13.5
Rear-loading compactor truck (rental)1410
Table 6. Collection services.
Collection ServiceTons%
Municipal Public Services24570
Informal sector “La basura jefa”8825
Waste pickers175
Total350100
Table 7. Classification of recycled MSW.
WasteKGFinal Disposal
PET9000Collection centers
Aluminum1200
Ferrous metals (iron, sheet metal, steel)950
Waste electrical and electronic equipment300
Plastics1800
Cardboard and paper3750
Total17,000
Table 8. Characteristics of the FDS cells.
CellFootprint (m2)Depth (m)Operational Status
111,00030Closed
214,748.09Final cover
37165.83operational under a closure order
Table 9. Characteristics of the FDS vehicle fleet and heavy machinery.
VehicleActive FleetLoad Capacity
Dump truck27 m3
Caterpillar 320D Excavator121,450 kg
Caterpillar D6R Crawler Tractor (Bulldozer)118,000 kg
Caterpillar Backhoe Loader1-
Water truck120,000 L
Total6
Table 10. Annual operational costs.
CategoryCost
CollectionUSD 3,042,011.23
Landfill OperationsUSD 484,625.61
TotalUSD 3,663,584.00
Table 11. MSW characterization—public and independent collection service.
By-ProductPublic Service
PS (%)
Independent Service
PS (%)
By-ProductPublic Service
PS (%)
Independent Service
PS (%)
Cardboard/waxed cardboard packaging6.659.61Disposable diapers6.632.86
Fine waste2.220.78Plastics (PET, hard, film, wrappers)10.9853.80
Textiles/synthetic fibers/rags4.581.29Foamed plastics (polyurethane, Styrofoam)1.172.36
Metals (ferrous, non-ferrous, aluminum, tin)2.844.13Organics (food waste, feces)36.633.33
Crockery and ceramics1.690Glass6.156.66
Wood4.712.36E-waste3.250
Paper (including sanitary paper)7.715.25Hazardous waste0.944.89
Non-recyclable inorganic/common waste3.852.70
Table 12. Municipal indicators.
EMS ProcessIndicatorMunicipal Indicator Evaluation.
1. Generation1.1 Solid waste per capita1.2 kg/inhab./day (450.85 kg/inhab./year)
1.2. Composition by waste type46.42% organics, 31.55% recoverables and 22.03% others
1.3. Household waste per capita247 kg/inhab./year
2. Collection2.1. Collection coverage79.66%
2.2 Waste collection per capita315.59 kg/inhab./year
3. Recycling3.1. Solid waste recycling rate4.86%
5. Final Disposal5.1. Waste disposal in sanitary and controlled landfills95.14%
5.4. Land use0.35 m2/t
5.8 Total cost of landfill disposalUSD 3,627,225 annual
Disclaimer/Publisher’s Note: The statements, opinions and data contained in all publications are solely those of the individual author(s) and contributor(s) and not of MDPI and/or the editor(s). MDPI and/or the editor(s) disclaim responsibility for any injury to people or property resulting from any ideas, methods, instructions or products referred to in the content.