Article

Quantifying Urban Air Pollution Mitigation by Tree Canopies Using Low-Cost Sensors

1
Institute of Research on Terrestrial Ecosystems (IRET), National Research Council of Italy (CNR), Via Madonna del Piano 10, 50019 Sesto Fiorentino, Italy
2
Department of Agriculture, Food, Environment and Forestry (DAGRI), University of Florence, Piazzale delle Cascine, 18, 50144 Firenze, Italy
3
National Biodiversity Future Center (NBFC), 90133 Palermo, Italy
4
ACRI-ST, 260 Route du Pin Montard, 06904 Sophia-Antipolis, France
5
Institutul Național de Cercetare-Dezvoltare în Silvicultură (INCDS), “Marin Drăcea”, Bulevardul Eroilor 128, 077190 Voluntari, Romania
6
National Agency for New Technologies, Energy, and Sustainable Economic Development (ENEA), CR Casaccia, Via Anguillarese 301, 00123 Rome, Italy
7
Institute of Bioeconomy (IBE), National Research Council of Italy (CNR), Via Caproni 8, 50145 Firenze, Italy
*
Author to whom correspondence should be addressed.
Environments 2026, 13(2), 97; https://doi.org/10.3390/environments13020097

Submission received: 24 December 2025 / Revised: 4 February 2026 / Accepted: 7 February 2026 / Published: 11 February 2026
(This article belongs to the Special Issue Air Pollution in Urban and Industrial Areas, 4th Edition)

Abstract

Urban environments are contaminated by a multitude of air pollutants. Tropospheric ozone (O3), nitrogen dioxide (NO2) as well as coarse particulate matter (PM10) and fine particulate matter (PM2.5) are the most dangerous for human health. However, urban greenery, in particular trees, offer a variety of ecosystem services, including the ability to improve air quality. We planted 170 young trees in the city of Florence using five species with proven capabilities to remove air pollutants, and open-field research was conducted to assess their pollution removal potential. Multi-sensor monitoring devices were used to monitor air pollutant concentrations and meteorological parameters from the first three years after planting. The devices were installed inside/outside the plantation and above/below the canopies. The experiment showed that the selection of suitable species effectively led to an improvement in air quality, with a reduction in monitored air pollutants below the canopy. In detail, a reduction in O3 and NO2 was detected for the second (2023) and third (2024) growing seasons, while a reduction in PM10 was only observed in 2024. The highest average reduction percentage was found for O3 (−9.1%) and PM10 (−24.5%) during 2023 and 2024, respectively. These findings highlight that nature-based solutions are really effective in air pollution mitigation, suggesting their implementation to further expand urban reforestation programmes and preserve human health.

1. Introduction

Outdoor air pollution is a serious concern plaguing urban areas worldwide [1]. Short- and long-term exposure to polluted air can have severe impacts on public health [2]. The main implications are chronic or acute respiratory and cardiovascular diseases, which cause several million deaths per year, according to the World Health Organization (WHO) [3]. Tropospheric ozone (O3), nitrogen dioxide (NO2), and particulate matter (PM) are the most dangerous and widespread air pollutants [4]. Depending on the size, PM is divided into PM10 and PM2.5 if their dimension are less than 10 μm and 2.5 μm, respectively [5].
During 2019, in the EU-27 countries, 307,000, 40,400, and 16,800 premature deaths were attributed to PM2.5, NO2, and O3, respectively [6]. In response to this alarming trend, the WHO released an updated version of the Air Quality Guidelines (AQGs) in 2021, with new reference values for target pollutants [7]. In detail, the annual mean limits are set at 5, 15, and 10 μg/m3 for PM2.5, PM10, and NO2, respectively, and it is recommended that the peak-season 8 h O3 concentration does not exceed 60 μg/m3 (i.e., 30 ppb). Considering these stricter WHO AQGs, in 2019, approximately 90–95% of the EU urban population was exposed to concentrations of PM2.5, O3, and NO2 above the updated limits [6].
Air pollutants derive from different sources and show seasonal patterns [8]. Direct vehicular exhaust emissions and domestic heating represent the main sources of NO2, PM10, and PM2.5 [9,10,11]. On the other hand, O3 is a secondary pollutant resulting from the photochemical interaction of precursors such as nitrogen oxides (e.g., NO2) and volatile organic compounds (VOCs), i.e., hydrocarbons mainly released by both human activities and plants [12,13].
To control urban air pollution and keep concentrations below WHO regulatory limits, countries around the world adopted policy interventions [14]. The most common and preventive strategies are the incentive of vehicle exhaust catalysts, the use of cleaner and more efficient energy for domestic heating, and the promotion of low-emission zones within the cities [15]. Moreover, to mitigate urban air pollution, there is rising attention towards urban greening. At the European level, the European Commission promotes the Nature Restoration Law that recommends an increasing trend in the national level of urban green spaces and canopy cover after 2030 [16].
Urban greening refers to city areas that are partially or entirely covered by vegetation, providing ecosystem services (ESs) to the community [17]. Beyond thermal regulation, recreational value, flood control, and climate change mitigation, air filtration is among the most significant ES provided [18,19,20]. In particular, woody species are effective at absorbing gaseous pollutants via stomatal uptake and at allowing dry deposition of PM on leaves or bark. However, attention must be paid to tree selection [20] as some species are not suitable for urban greening because they emit biogenic VOCs (bVOCs), which are precursors of O3 and secondary organic aerosols, including PM [21]. For example, broadleaves belonging to the Acer, Tilia, and Ulmus genera, thanks to their high stomatal conductance and low bVOC emissions, are effective against gaseous pollutants, while evergreen species (e.g., conifers) are most efficient for PM [22,23].
Several modelling approaches have been developed so far to estimate the magnitude of pollution removal by trees [24,25,26], but direct measurements collected by in situ sensors are still limited. Consequently, we established a novel urban forest in Florence (central Italy) with highly performant species according to the scientific literature, hypothesizing that the vegetation would have an effect on pollutant reduction. Multi-sensor monitoring devices were used for monitoring three consecutive growing seasons after planting. The final aim of this study was to verify whether the local air quality is effectively improved after reforestation (i) inside/outside the experimental area, as well as (ii) above/below the tree canopies, and if (iii) there was a correlation between meteorological parameters and the removal capacity of trees.

2. Materials and Methods

2.1. Study Area and Sensor Settings

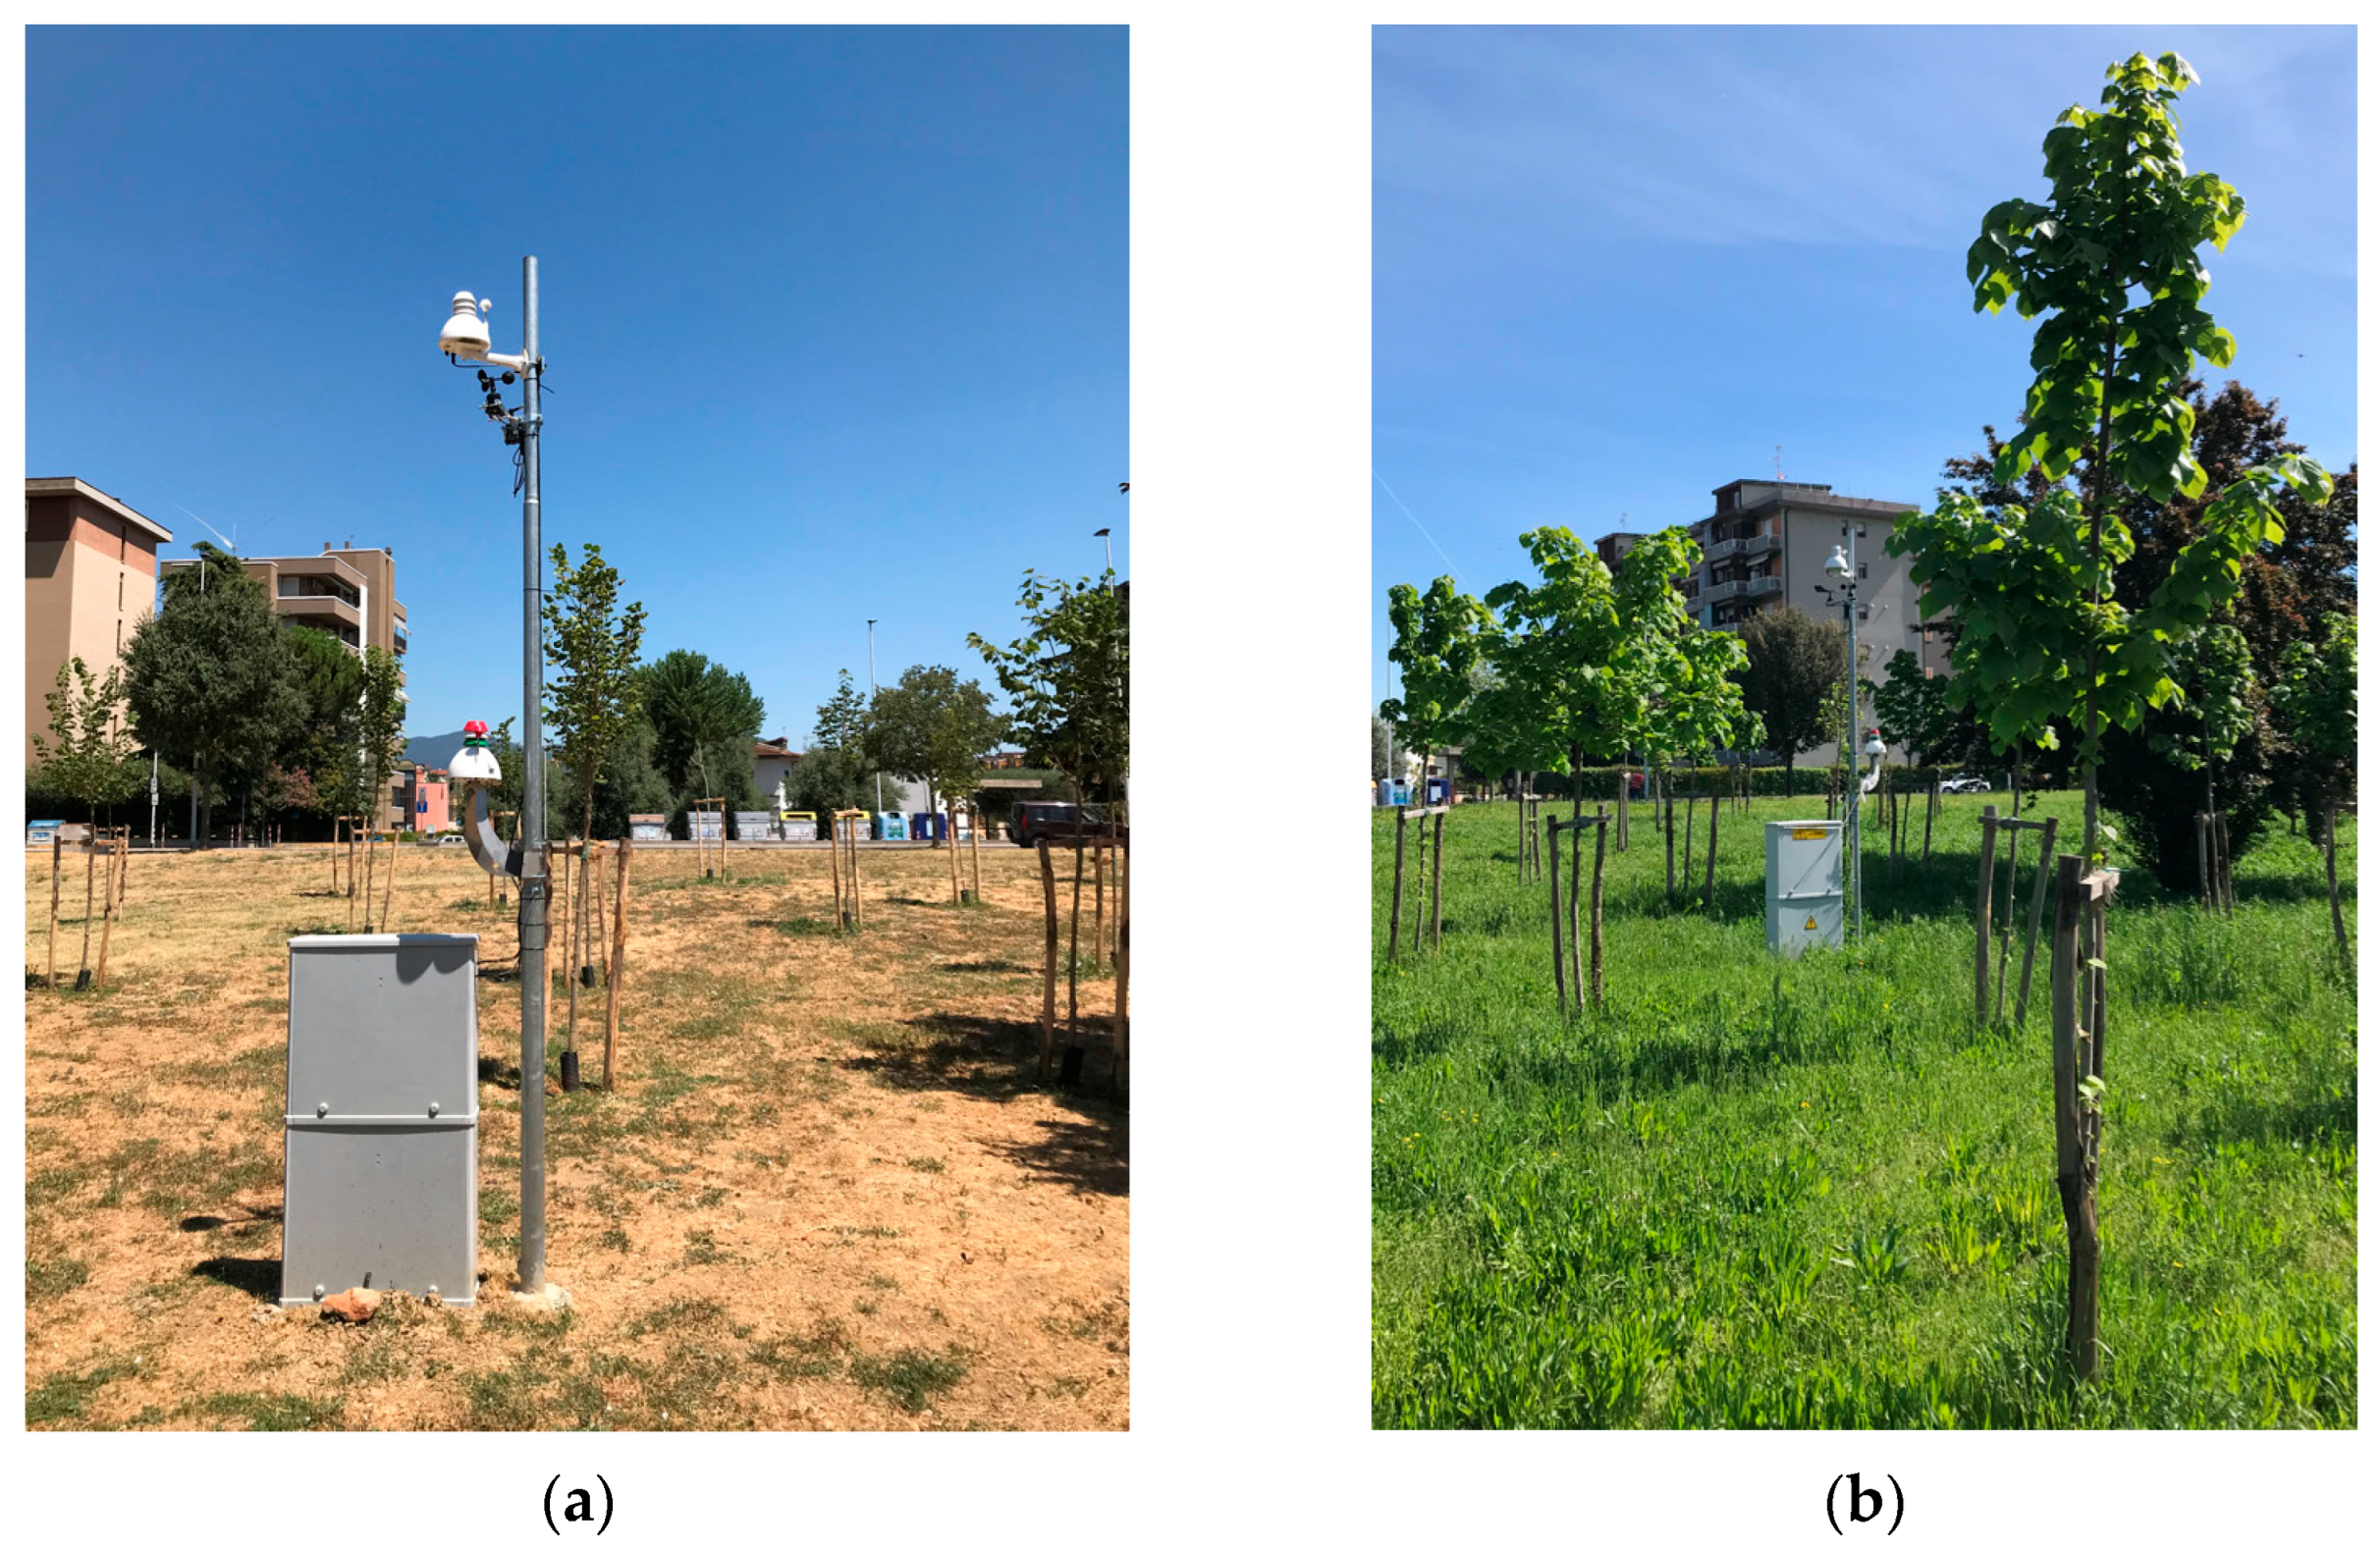
The experimental green area is located in the western suburbs of the Municipality of Florence (Italy), in the “San Bartolo a Cintoia park” (43°46′38″ N, 11°11′25″ E). It has an extension of approximately 0.55 ha and, after reforestation, hosts 170 trees belonging to five species: Tilia platyphyllos Scop., Acer rubrum L., Acer opalus Mill., Cupressus sempervirens L., and Ulmus ‘Plinio’ (a hybrid clone resistant to Ophiostoma novo-ulmi fungal disease [27]). Tree planting took place in January 2022, and all trees had a 2 < height ≤ 3.5 m. The approximate horizontal spacing for the trees was between 3.5 and 5 m. During the summer, trees were constantly watered by a drip irrigation system. To assess the “vegetation effect” on air pollutant absorption, environmental sensors (AirQino) were mounted on iron poles both inside and outside the new urban forest. Inside the area, two AirQino sensors were installed, one at a height of approximately 3.5 m (above the canopies) and the other at 2 m (below the canopies). An additional control sensor was placed outside the test area (at 3.5 m) to monitor background air pollution levels. For each sensor, electric power was supplied by external batteries (Figure 1).

2.2. Pollutant Monitoring Stations: Data Collection, Validation, and Statistical Analysis

Air pollutant concentrations (O3, NO2, PM10, and PM2.5) and meteorological parameters (i.e., air temperature and relative humidity) were recorded by the AirQino air monitoring stations [28] installed in the experimental area. AirQino is a low-cost compact monitoring station developed by the Institute for Bioeconomy of the National Research Council (IBE-CNR). Thanks to its design, AirQino is easy to install and maintain and can be deployed at large scales to create monitoring networks, providing data at high spatio-temporal resolution. The station is equipped with MiCS-2714 (SGX-Sensortech, Neuchatel, Switzerland) and MiCS-2614 (SGX-Sensortech, Neuchatel, Switzerland) Metal Oxide Sensors (MOSs) for NO2 and O3 measurements, respectively (accuracy: ±15%; resolution: 1 µg m−3); an SDS011 (Nova Fitness, Jinan, China) optical sensor for PM10 and PM2.5 (accuracy: ±10%; resolution: 1 µg m−3); and an AM2315 (Adafruit, New York, NY, USA) sensor for air temperature (accuracy: ±5%; resolution: 0.3 °C) and relative humidity (accuracy: ±5%; resolution: 1%). The reliability of AirQino has been evaluated across different geographical contexts, including Italy [29,30,31], Sub-Saharan Africa [32], and the Arctic region [33].
The air quality stations collected raw data over three consecutive growing seasons (2022–2023–2024). Data were obtained via the website https://airqino-api.magentalab.it/, which provides a RESTful API for the AirQino platform developed by Magenta (https://www.magentalab.it) for IBE-CNR. The interface follows REST principles, primarily using HTTP GET methods to retrieve data from the stations.
The downloaded data were cleaned of errors and outliers, then aggregated at the hourly level. To verify the reliability of the air pollutant readings in this context, calibration and validation procedures were implemented. Concerning gas pollutants, data needed to be calibrated into physically meaningful atmospheric concentrations, since MOSs operate via a heated metal-oxide diaphragm, where gas-induced resistance changes are recorded at sub-2 s intervals and converted to digital signals through a 10-bit analogue-to-digital converter (0–1023 counts). Following the approach previously proposed by Cavaliere et al. [29], hourly data of O3 and NO2 were calibrated and validated using multiple linear regression (Table S2; Figures S2 and S3) against measurements operated by the local Environmental Protection Agency (ARPAT) at three local reference stations (Table S1; Figure S1). Concerning PM10 and PM2.5, data were only validated at a daily temporal frequency (Table S3; Figures S4 and S5), since the readings of the SDS011 sensor are already converted into mass concentration units (µg m−3) and previous evidence highlighted the high accuracy of the factory-calibrated data [29,34].
Once processed, data were averaged by day. The reference period for the growing season was assumed to be between 15 April and 31 October, i.e., the approximate dates of leaf emergence and fall. Each day was considered an individual observation (n = 199). After verifying the normality of the distribution, Student’s t-test was applied to assess the delta (Δ) in pollutant concentrations between outside/inside the area and between above/below the canopies. If data were not normally distributed, a non-parametric Mann–Whitney U test was applied.
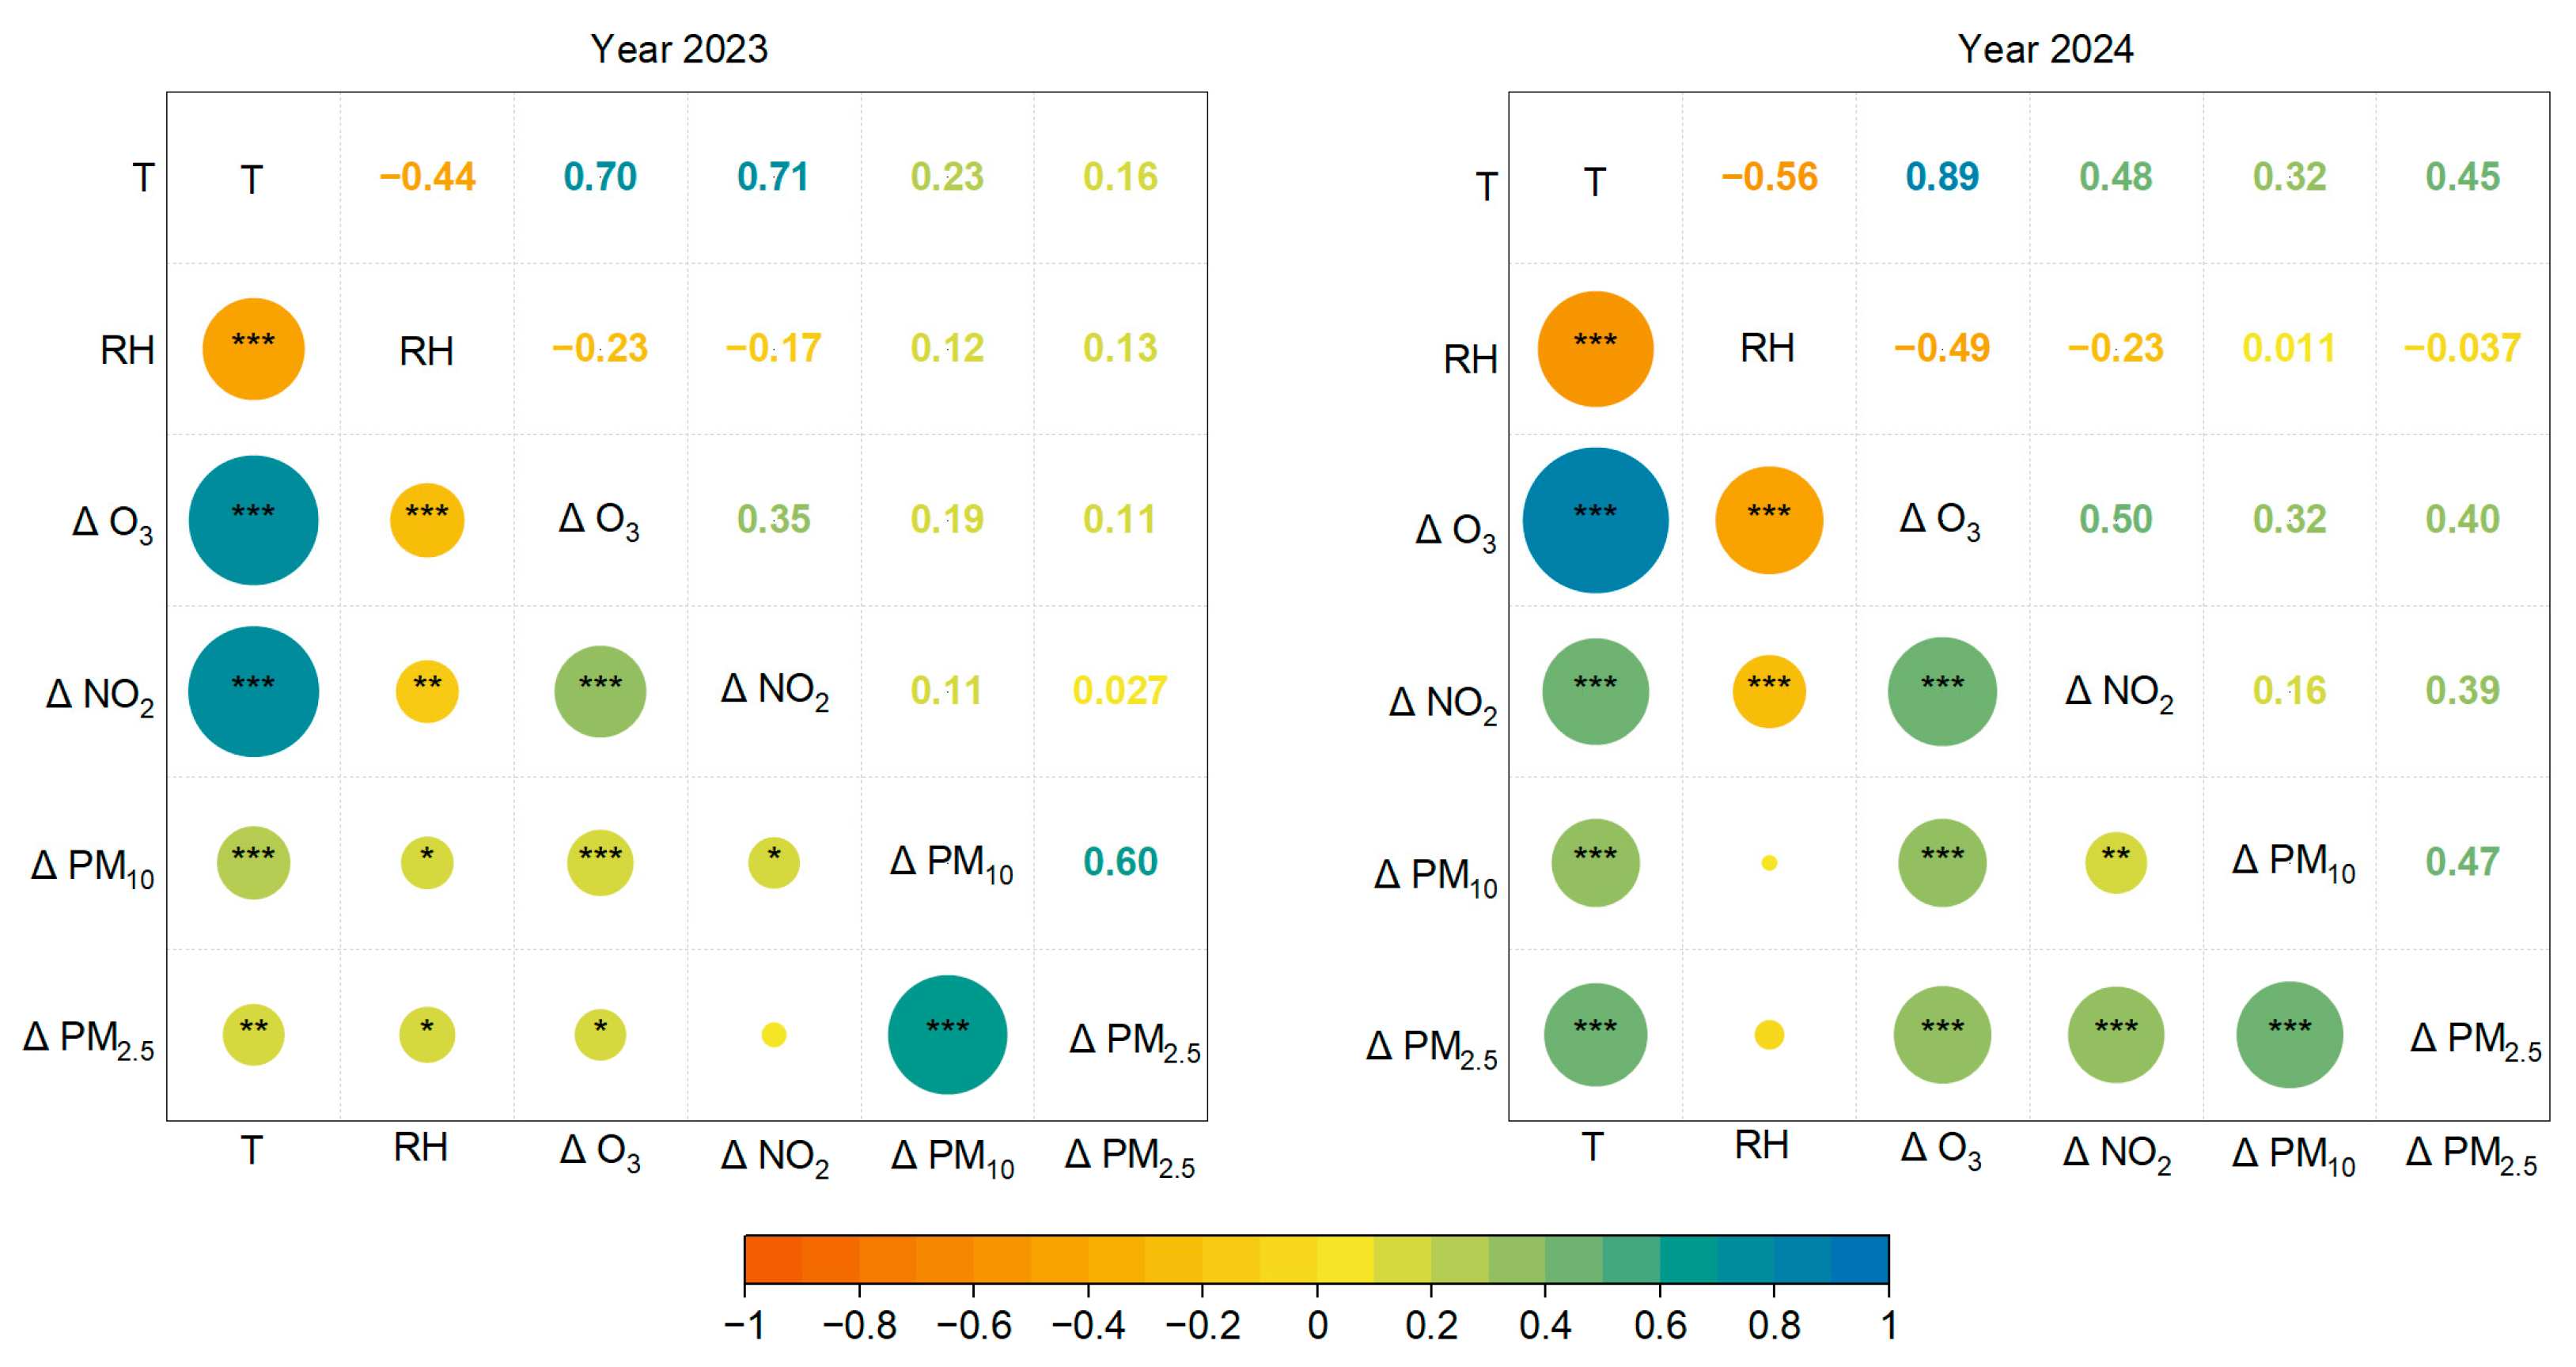
Moreover, a heat-map matrix was used to show the correlation (Pearson’s correlation coefficient—r) between the Δ of pollutants above/below the canopy, temperature, and relative humidity along the two full experimental years (2023 and 2024). All the analyses were performed with RStudio software (version 4.4.1), using the packages “stats”, “corrgram”, and “corrplot”. Results were considered statistically significant with p-values ≤ 0.05.

3. Results

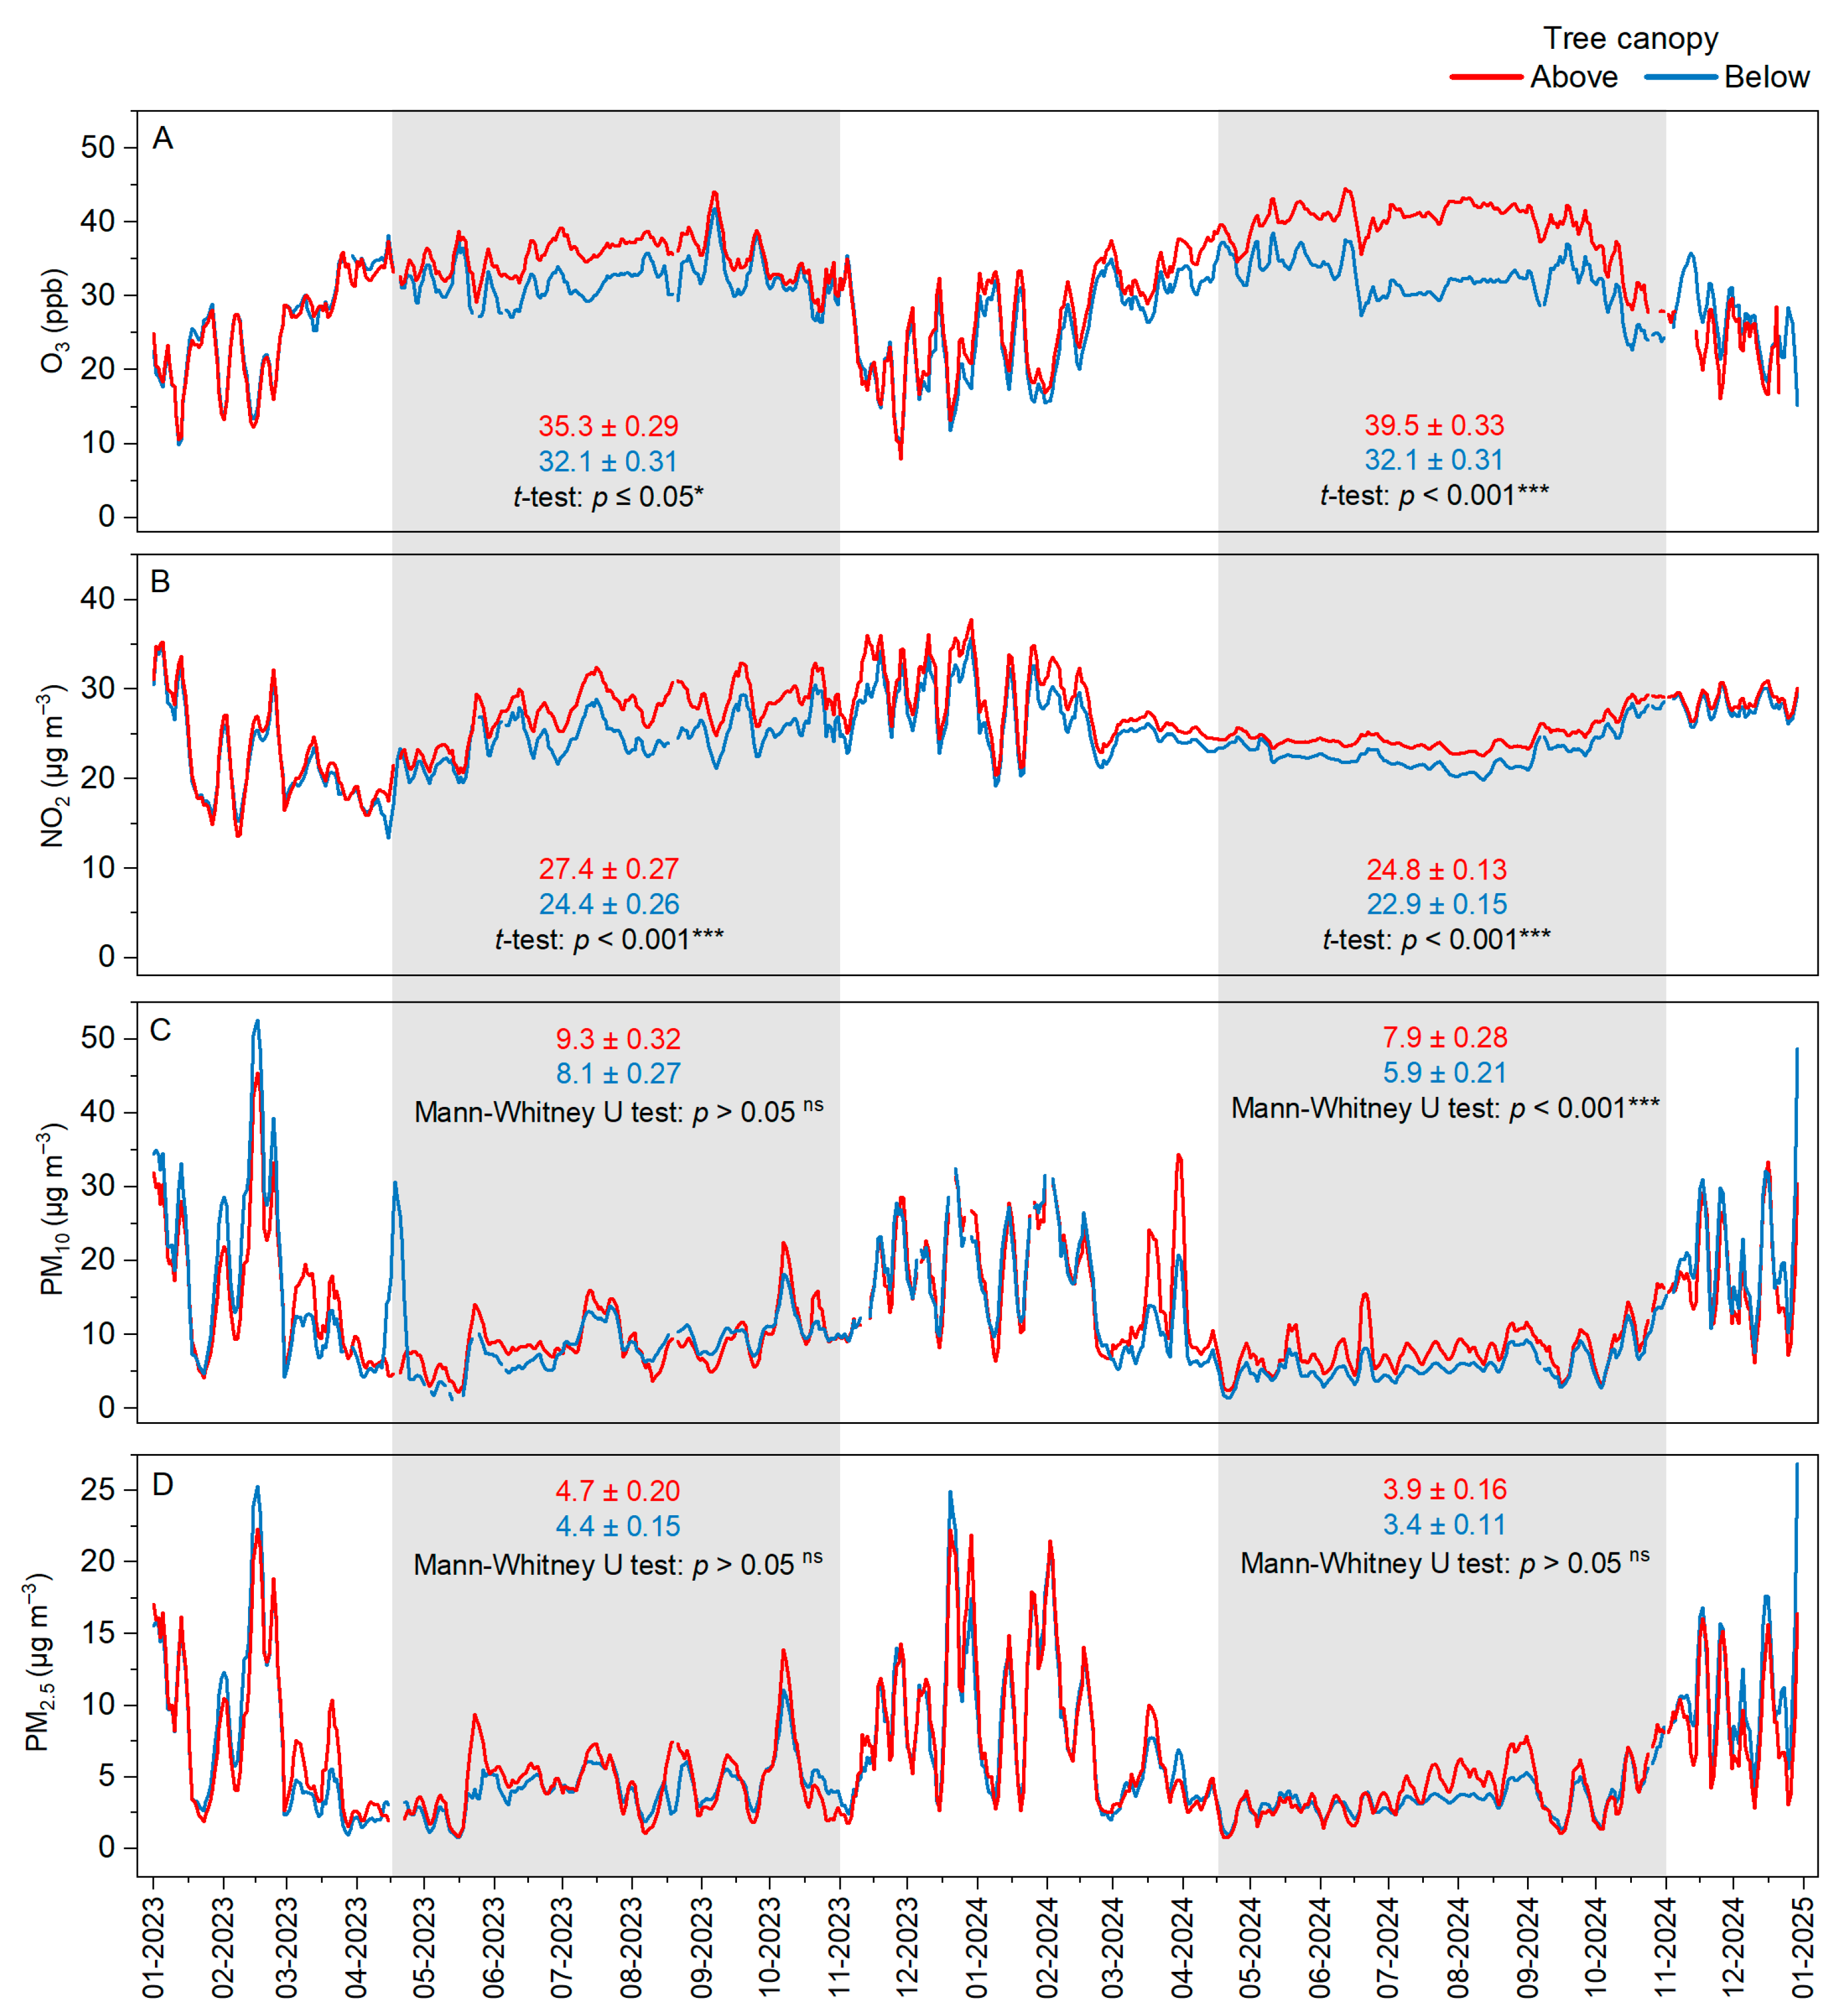
Monitoring started in the summer 2022, and no significant differences in pollutant concentration were observed across sensors in that year. For the 2023 and 2024 growing seasons, according to Student’s t-test, no statistically significant reduction (p > 0.05) was found between sensors placed at the same height (3.5 m) inside and outside the test area for the target air pollutants. Conversely, a significant reduction in Δ above/below the canopies was detected for gaseous pollutants (O3 and NO2) in both growing seasons, while for PM10, this was only found in the second year (2024). Details are provided in Section 3.1 and Section 3.2 as well as in Figure 2.

3.1. Gaseous Pollutants (O3 and NO2)

Ozone and NO2 exhibited opposite seasonal patterns throughout the year (Figure 2A,B). The highest O3 concentrations were recorded in the summertime (June–August), whereas NO2 reached its maximum values during the winter months (December–March).
In 2023, reductions in concentrations below the canopy were observed for both O3 and NO2. Specifically, for O3, an average difference of 3.2 ppb was recorded considering the entire growing season, with an average percentage reduction of 9.1%. In the same year during the summer period (June–September), when O3 concentrations were highest, the average difference raised to 4.1 ppb (−11.4%), with a peak of 5.0 ppb in July (−13.6%). An even more pronounced and significant effect (t-test, p < 0.001) was highlighted for the 2024 growing season, where the average difference above/below the canopy was 7.3 ppb, with a higher percentage reduction than the previous year, equal to 18.5%. In the summer, the average difference settled at 8.9 ppb (−21.6%), with a peak of 10.5 ppb in July (−25.4%), which is double that of the previous year.
With regards to NO2, for both the 2023 and 2024 growing seasons, the results showed a comparable reduction below the canopy between the two years. The average difference was approximately 2–3 µg/m3, and the estimated reductions were 10.6% and 7.7% for 2023 and 2024, respectively.

3.2. Particulate Matter (PM10 and PM2.5)

Both PM10 and PM2.5 concentrations showed similar trends over the two years of monitoring, with peaks in winter and lower values in spring–summer (Figure 2C,D). Concerning the first year of tree growth (2023), no significant PM decrease was observed (p > 0.05). Indeed, although a reduction below the canopy was detected until July (−1.8 µg/m3 for PM10 and −0.6 µg/m3 for PM2.5), a reversal was observed in August, with slightly lower values above the canopy. On the other hand, for the 2024 growing season, PM10 showed lower values below the canopy (p < 0.001), with an average difference of 2 µg/m3 and a reduction of 24.5%. Concerning PM2.5, the maximum difference was recorded in August (−1.7 µg/m3), with an average of 0.4 µg/m3 for the entire season (approximately −1.3% below the canopy); however, this difference was not significant (p = 0.25).

3.3. Correlations Between Pollutant Removal and Meteorological Data

From Pearson’s correlation matrix (Figure 3), for both years, ΔO3 showed strong positive correlations (p < 0.001) with temperature (T) and strong negative correlations (p < 0.001) with relative humidity (RH). In particular, from the first year to the second year of monitoring, r values increased for both T and RH. Furthermore, NO2 showed a similar trend, although the correlation with T was less robust in 2024 (r = 0.48) than in 2023 (r = 0.71). In contrast, for ΔPM10 and ΔPM2.5, a weak correlation with RH was observed in 2023 (r = 0.12 and 0.13, respectively), whereas no correlation was observed in the following year. Considering the possible combinations among air pollutants, the significance of correlations increased from the first year to the second year. The relationship between ΔO3-ΔNO2 and ΔO3-ΔPM10 was already statistically significant (p < 0.001) in the first year, while the correlation coefficient was higher in 2024 than in 2023 for ΔNO2-ΔPM10 and ΔNO2-ΔPM2.5. In detail, the highest correlation was found between ΔPM10 and ΔPM2.5 in 2023 (r = 0.60; p < 0.001).

4. Discussion

Fixed monitoring stations, equipped with high-precision sensors, are employed by administrations, via environmental agencies (e.g., ARPAT in the Tuscany region of Italy), to assess several air pollutant concentrations. Although these stations provide valuable and accurate data, their installation and maintenance are very expensive [34]. In addition, they are limited in number, positioned in strategically selected points, and can only provide information on the monitored area [35]. On the other hand, low-cost active sensors, such as AirQino used in this study, are a smart solution for time-continuous monitoring and can be massively deployed across large study areas thanks to their ease and flexibility of installation [36]. While they do not achieve the same accuracy as official reference stations and are affected by known limitations such as sensitivity to environmental factors (e.g., humidity, temperature, gaseous interference compounds, physical degradation, and signal drifts [29]), these sensors provide indicative measurements that are suitable for characterizing the spatial distribution of air pollutants according to Directive 2008/50/EC.
To the best of our knowledge, our research is the first to have continuously monitored the air quality using low-cost sensors to quantify the mitigation effect provided by a new urban forest since its setup. However, air quality monitoring inside pre-existing urban parks has already been documented [37], as well as the influence of vegetation in reducing air pollution [38]. To assess the removal capacity of green infrastructure, widely applied techniques utilize duplicate passive diffusion samplers inside and outside the urban forest canopy at the local scale [39,40,41,42,43,44]. In the hemi-boreal region, a limited effect of urban trees on O3 between tree-covered and open near-road areas (<1 ppb lower in tree-covered areas) was reported in Gothenburg (Sweden) [40] and Helsinki (Finland) [43]. Nevertheless, a “park effect” was demonstrated by Klingberg et al. [45] in Gothenburg (Sweden), where a significantly lower NO2 concentration was found after leaf emergence compared to adjacent areas near a busy traffic road. Almeida et al. [46] showed higher and lower NO2 and PM10 levels closer to traffic avenues and parks, respectively. Lower PM concentrations were also recorded in a vegetated area than near a roadside by a low-cost sensor network in São Paulo city (Brazil) [47].
In the first year after planting (2022), no statistically significant differences in air pollutant concentrations were observed among the sensor locations. This result is not surprising and is mainly attributable to the still underdeveloped canopies and post-planting stress [48], which is likely exacerbated by the very high summer air temperatures [49]. Conversely, after the first year of adaptation to the new pedo-climatic conditions, a clear reduction below the canopy at the pedestrian level (2 m) was observed for gaseous air pollutants during the 2023 and 2024 growing seasons. In fact, both NO2 and O3 were removed by tree canopies during spring/summer, as confirmed by their positive correlation with temperature. In contrast, a negative relation was detected with RH because in winter (when RH is high) O3 was low, and NO2 was not absorbed due to the absence of leaves (80% of trees are deciduous in the test area).
During the vegetation season, the average O3 removal rate increased year on year (+4.1 ppb), as shown by statistical analysis (t-test, p < 0.001). This finding can be mainly attributed to the development of a larger leaf area and to optimal eco-physiological responses of the trees during the summertime, which allowed for efficient stomatal uptake [50,51]. It should also be noted that optimal soil water content provided by irrigation is essential for trees to keep their stomata open [52], thus absorbing gaseous pollutants, especially in the first years after planting. Therefore, in an environment where the summer period is prolonged, hot and dry (e.g., Mediterranean area), optimal irrigation management strategies are crucial to avoid drought stress and maximize gaseous pollutant removal.
Our results are partially consistent with those by Yli-Pelkonen et al. [44], who found a strong reduction in O3 when comparing open and tree-covered areas in Baltimore (USA) and slight non-significant reductions in NO2. In another study, which was conducted in the city of Siena (central Italy) [41], a decrease in NO2 concentrations under the Quercus ilex canopy was observed compared to an open field, but for O3, the concentrations under the canopy were higher than those measured along the roadside, as Q. ilex emits high amounts of bVOCs [53]. This confirms that careful tree selection, oriented towards species with low-bVOC emissions for new plantings, is essential to avoid side effects such as increased O3 [23].
Regarding PM, a significant reduction below the canopy was observed only in 2024, whereas in the first growing season (2023), the Mann–Whitney U test did not detect a statistical difference between above/below the canopy. This result could be attributable to a “resuspension effect” that might occur in the month of August, where the leaf surface, after long periods without precipitation, could be completely saturated, thus nullifying its ability to capture PM, as previously stated by Pace and Grote [54]. Li et al. [55] demonstrated that PM resuspension is more sensitive to exposure duration than to other factors (e.g., wind speed) and is also influenced by several vegetation traits such as the leaf surface, leaf shape characteristics, and the branch structure. Other studies [56,57] underscored that evergreen or conifer species are more efficient than broadleaved species in avoiding PM resuspension. Given that the majority of the five selected tree species in the test area were deciduous and only 20% of the total were conifers (i.e., 35 specimens of C. sempervirens), this could further corroborate our hypothesis. Furthermore, in winter, where RH was higher, the removal effect was weak or insignificant. This may be due to the fact that we had few conifer trees, and the woody parts (trunks and branches) of broadleaved trees, which would have high retention capabilities [58], were still too small to intercept PM.
Finally, it is worth noting that this study was limited to observing pollutant trends in the first two years after planting. Future research efforts should focus on long-term monitoring (e.g., extending to 10 years) to fully understand the potential of urban forests for air filtration. Indeed, dense and completely developed canopies could also alter the airflow, leading to a localized increase in pollutant concentrations under the tree crowns [59].
Moreover, additional meteorological variables such as wind speed and direction (not considered in this study) deserve further investigation for their potential role in PM deposition and resuspension [60].

5. Conclusions

The main findings can be summarized in this bulleted list:
  • AirQino sensors were proven to be an efficient low-cost solution for monitoring the effect of nature-based solutions over time in the urban context.
  • The impact of an urban reforested area on air quality had already occurred a year and a half after planting.
  • During the growing seasons (2023 and 2024), differences were found above/below the canopy (2 m) for the monitored pollutants.
  • The reduction was more evident for gaseous pollutants (O3 and NO2) than for PM, which may be due to the high presence of deciduous trees (Tilia platyphyllos, Acer opalus, Acer rubrum, and Ulmus ‘Plinio’) compared to evergreen species (Cupressus sempervirens).
  • The selection of species with low bVOC release is essential to avoid altering the chemistry of the local atmosphere and to maximize O3 removal.
  • Optimal tree growth over time (larger canopies) will increase the potential capacity to reduce pollutant concentrations.
  • Careful maintenance operations (e.g., irrigation in the first years after planting) were essential to ensure ideal conditions for tree growth.
  • Urban reforestation projects can actually improve air quality and bring pollutant concentrations below WHO regulatory limits.

Supplementary Materials

The following supporting information can be downloaded at: https://www.mdpi.com/article/10.3390/environments13020097/s1, Table S1: Reference station details. Table S2: Calibration results for O3 and NO2. For each year (2022, 2023, and 2024), calibration models were developed using a multiple linear regression framework (Xref = β0 + β1 Xraw + β2 Tint with X ∈ {O3, NO2}, β0, β1, β2 indicating the regression coefficients. “ref” indicates the data from the reference stations. “raw” indicates the raw data from the AirQino stations, and Tint indicates the AirQino internal temperature) on the hourly data of the 15/04–15/06 period of each growing season. Table S3: Validation of daily concentrations of PM10 and PM2.5 for the whole dataset. Figure S1: Localization of the reference stations employed for AirQino calibration and the study area. Figure S2: Scatterplots of hourly NO2 raw data from AirQino against hourly NO2 concentrations measured by the reference station. Coloured lines represent the fitted relationships between raw and measured concentrations (β1), with the internal temperature fixed at its mean value ( T i n t ¯ ). Figure S3: Scatterplots of hourly O3 raw data from AirQino against hourly O3 concentrations measured by the reference station. Coloured lines represent the fitted relationships between raw and measured concentrations (β1), with the internal temperature fixed at its mean value ( T i n t ¯ ). Figure S4: Scatterplots of the daily average PM2.5 concentrations for the three assessed growing seasons using AirQino against those from the refence station. Figure S5: Scatterplots of the daily average PM10 concentrations for the three assessed growing seasons using AirQino against those from the refence station.

Author Contributions

Conceptualization, J.M. and Y.H.; methodology, J.M., Y.H. and E.P.; validation, A.Z., T.G. and B.C.; formal analysis, J.M. and Y.H.; investigation, J.M., Y.H., B.B.M. and E.P.; resources, P.S. and E.P.; data curation, A.Z., T.G. and B.C.; writing—original draft preparation, J.M.; writing—review and editing, Y.H., B.B.M., A.D.M., P.S., T.G., B.C. and E.P.; visualization, B.B.M.; supervision, E.P.; project administration, P.S.; funding acquisition, P.S. and E.P. All authors have read and agreed to the published version of the manuscript.

Funding

This research was funded by the LIFE project AIRFRESH “AIR pollution removal by FoRESts for a better human well-being” (LIFE19 ENV/FR/000086) and by the National Recovery and Resilience Plan (NRRP), Mission 4 Component 2 Investment 1.4: Call for tender No. 3138 of 16 December 2021, rectified by Decree n.3175 of 18 December 2021 of the Italian Ministry of University and Research funded by the European Union (NextGenerationEU), Award Number: Project code CN_00000033, Concession Decree No. 1034 of 17 June 2022 adopted by the Italian Ministry of University and Research, CUP B83C22002930006, Project title “National Biodiversity Future Center—NBFC” (Spoke 5).

Data Availability Statement

The original contributions presented in this study are included in the article/Supplementary Materials. Further inquiries can be directed to the corresponding author.

Acknowledgments

We would like to thank Moreno Lazzara and Leonardo Lazzara for sensor settings and maintenance and the Municipality of Florence for providing access to the urban park.

Conflicts of Interest

The authors declare no conflicts of interest.

References

  1. Leung, D.Y.C. Outdoor-Indoor Air Pollution in Urban Environment: Challenges and Opportunity. Front. Environ. Sci. 2015, 2, 69. [Google Scholar] [CrossRef]
  2. Kelly, F.J.; Fussell, J.C. Air Pollution and Public Health: Emerging Hazards and Improved Understanding of Risk. Environ. Geochem. Health 2015, 37, 631–649. [Google Scholar] [CrossRef] [PubMed]
  3. Ofremu, G.O.; Raimi, B.Y.; Yusuf, S.O.; Dziwornu, B.A.; Nnabuife, S.G.; Eze, A.M.; Nnajiofor, C.A. Exploring the Relationship between Climate Change, Air Pollutants and Human Health: Impacts, Adaptation, and Mitigation Strategies. Green Energy Resour. 2025, 3, 100074. [Google Scholar] [CrossRef]
  4. Ritz, B.; Hoffmann, B.; Peters, A. The Effects of Fine Dust, Ozone, and Nitrogen Dioxide on Health. Dtsch. Ärzteblatt Int. 2019, 51–52, 881–886. [Google Scholar] [CrossRef]
  5. Kim, B.-Y.; Lim, Y.-K.; Cha, J.W. Short-Term Prediction of Particulate Matter (PM10 and PM2.5) in Seoul, South Korea Using Tree-Based Machine Learning Algorithms. Atmos. Pollut. Res. 2022, 13, 101547. [Google Scholar] [CrossRef]
  6. European Environment Agency. Air Quality in Europe 2021; European Environment Agency: Copenhagen, Denmark, 2021; Available online: https://www.eea.europa.eu/en/analysis/publications/air-quality-in-europe-2021 (accessed on 6 February 2026).
  7. WHO. Global Air Quality Guidelines: Particulate Matter (PM2. 5 and PM10), Ozone, Nitrogen Dioxide, Sulfur Dioxide and Carbon Monoxide, 1st ed.; World Health Organization: Geneva, Switzerland, 2021; Available online: https://www.who.int/publications/i/item/9789240034228 (accessed on 6 February 2026).
  8. Moura, B.B.; Zammarchi, F.; Manzini, J.; Hoshika, Y.; Brilli, L.; Vagnoli, C.; Gioli, B.; Zaldei, A.; Giordano, T.; Martinelli, F.; et al. Assessment of Seasonal Variations in Particulate Matter Accumulation and Elemental Composition in Urban Tree Species. Environ. Res. 2024, 252, 118782. [Google Scholar] [CrossRef]
  9. Ozgen, S.; Cernuschi, S.; Caserini, S. An Overview of Nitrogen Oxides Emissions from Biomass Combustion for Domestic Heat Production. Renew. Sustain. Energy Rev. 2021, 135, 110113. [Google Scholar] [CrossRef]
  10. Wang, B.; Wang, B.; Lv, B.; Wang, R. Impact of Motor Vehicle Exhaust on the Air Quality of an Urban City. Aerosol. Air Qual. Res. 2022, 22, 220213. [Google Scholar] [CrossRef]
  11. Matthaios, V.N.; Lawrence, J.; Martins, M.A.G.; Ferguson, S.T.; Wolfson, J.M.; Harrison, R.M.; Koutrakis, P. Quantifying Factors Affecting Contributions of Roadway Exhaust and Non-Exhaust Emissions to Ambient PM10–2.5 and PM2.5–0.2 Particles. Sci. Total Environ. 2022, 835, 155368. [Google Scholar] [CrossRef]
  12. Wang, P.; Chen, Y.; Hu, J.; Zhang, H.; Ying, Q. Attribution of Tropospheric Ozone to NOx and VOC Emissions: Considering Ozone Formation in the Transition Regime. Environ. Sci. Technol. 2019, 53, 1404–1412. [Google Scholar] [CrossRef]
  13. Fitzky, A.C.; Sandén, H.; Karl, T.; Fares, S.; Calfapietra, C.; Grote, R.; Saunier, A.; Rewald, B. The Interplay Between Ozone and Urban Vegetation—BVOC Emissions, Ozone Deposition, and Tree Ecophysiology. Front. For. Glob. Change 2019, 2, 50. [Google Scholar] [CrossRef]
  14. Huang, W.; Xu, H.; Wu, J.; Ren, M.; Ke, Y.; Qiao, J. Toward Cleaner Air and Better Health: Current State, Challenges, and Priorities. Science 2024, 385, 386–390. [Google Scholar] [CrossRef] [PubMed]
  15. Jonidi Jafari, A.; Charkhloo, E.; Pasalari, H. Urban Air Pollution Control Policies and Strategies: A Systematic Review. J. Environ. Health Sci. Eng. 2021, 19, 1911–1940. [Google Scholar] [CrossRef] [PubMed]
  16. European Parliament & Council of the European Union Regulation (EU) 2024/1991 of 24 June 2024 on Nature Restoration and Amending Regulation (EU) 2022/869. 2024. Available online: https://eur-lex.europa.eu/eli/reg/2024/1991/oj/eng (accessed on 15 October 2025).
  17. Moura, B.B.; Nissim, W.G.; Manzini, J.; Scartazza, A.; Labra, M.; Hoshika, Y.; Sicard, P.; Zaldei, A.; De Marco, A.; Paoletti, E. The Role of Urban Forests in Tackling Air and Soil Pollution in Italian Cities. Urban For. Urban Green. 2025, 113, 129066. [Google Scholar] [CrossRef]
  18. Veerkamp, C.J.; Schipper, A.M.; Hedlund, K.; Lazarova, T.; Nordin, A.; Hanson, H.I. A Review of Studies Assessing Ecosystem Services Provided by Urban Green and Blue Infrastructure. Ecosyst. Serv. 2021, 52, 101367. [Google Scholar] [CrossRef]
  19. Green, D.; O’Donnell, E.; Johnson, M.; Slater, L.; Thorne, C.; Zheng, S.; Stirling, R.; Chan, F.K.S.; Li, L.; Boothroyd, R.J. Green Infrastructure: The Future of Urban Flood Risk Management? WIREs Water 2021, 8, e1560. [Google Scholar] [CrossRef]
  20. Pandey, B.; Ghosh, A. Urban Ecosystem Services and Climate Change: A Dynamic Interplay. Front. Sustain. Cities 2023, 5, 1281430. [Google Scholar] [CrossRef]
  21. Ren, Y.; Qu, Z.; Du, Y.; Xu, R.; Ma, D.; Yang, G.; Shi, Y.; Fan, X.; Tani, A.; Guo, P.; et al. Air Quality and Health Effects of Biogenic Volatile Organic Compounds Emissions from Urban Green Spaces and the Mitigation Strategies. Environ. Pollut. 2017, 230, 849–861. [Google Scholar] [CrossRef]
  22. Manzini, J.; Hoshika, Y.; Carrari, E.; Sicard, P.; Watanabe, M.; Tanaka, R.; Badea, O.; Nicese, F.P.; Ferrini, F.; Paoletti, E. FlorTree: A Unifying Modelling Framework for Estimating the Species-Specific Pollution Removal by Individual Trees and Shrubs. Urban For. Urban Green. 2023, 85, 127967. [Google Scholar] [CrossRef]
  23. Paoletti, E.; Sicard, P.; Marco, A.D.; Moura, B.B.; Manzini, J. Ozone Pollution and Urban Greening. Stresses 2025, 5, 65. [Google Scholar] [CrossRef]
  24. Wu, J.; Wang, Y.; Qiu, S.; Peng, J. Using the Modified I-Tree Eco Model to Quantify Air Pollution Removal by Urban Vegetation. Sci. Total Environ. 2019, 688, 673–683. [Google Scholar] [CrossRef] [PubMed]
  25. Fares, S.; Conte, A.; Alivernini, A.; Chianucci, F.; Grotti, M.; Zappitelli, I.; Petrella, F.; Corona, P. Testing Removal of Carbon Dioxide, Ozone, and Atmospheric Particles by Urban Parks in Italy. Environ. Sci. Technol. 2020, 54, 14910–14922. [Google Scholar] [CrossRef] [PubMed]
  26. Pace, R.; De Fino, F.; Rahman, M.A.; Pauleit, S.; Nowak, D.J.; Grote, R. A Single Tree Model to Consistently Simulate Cooling, Shading, and Pollution Uptake of Urban Trees. Int. J. Biometeorol. 2021, 65, 277–289. [Google Scholar] [CrossRef] [PubMed]
  27. Santini, A.; Fagnani, A.; Ferrini, F.; Mittempergher, L. “San Zanobi” and “Plinio” Elm Trees. HortSci 2002, 37, 1139–1141. [Google Scholar] [CrossRef]
  28. Zaldei, A.; Vagnoli, C.; Di Lonardo, S.; Gioli, B.; Gualtieri, G.; Toscano, P.; Martelli, F.; Matese, A. AIRQino, a Low-Cost Air Quality Mobile Platform. 1 April 2015. p. 6158. Available online: https://ui.adsabs.harvard.edu/abs/2015EGUGA..17.6158Z/abstract (accessed on 15 November 2025).
  29. Cavaliere, A.; Brilli, L.; Andreini, B.P.; Carotenuto, F.; Gioli, B.; Giordano, T.; Stefanelli, M.; Vagnoli, C.; Zaldei, A.; Gualtieri, G. Development of Low-Cost Air Quality Stations for next-Generation Monitoring Networks: Calibration and Validation of NO2 and O3 Sensors. Atmos. Meas. Tech. 2023, 16, 4723–4740. [Google Scholar] [CrossRef]
  30. Gualtieri, G.; Brilli, L.; Carotenuto, F.; Cavaliere, A.; Giordano, T.; Putzolu, S.; Vagnoli, C.; Zaldei, A.; Gioli, B. Performance Assessment of Two Low-Cost PM2.5 and PM10 Monitoring Networks in the Padana Plain (Italy). Sensors 2024, 24, 3946. [Google Scholar] [CrossRef]
  31. Giordano, T.; Brilli, L.; Gualtieri, G.; Martelli, F.; Cavaliere, A.; Carotenuto, F.; Nardino, M.; Fiorillo, E.; Zaldei, A.; Putzolu, S.; et al. Assessment of Risk Components for Urban Population to Heat Intensity and Air Pollution through a Dense IoT Sensor Network. Urban Clim. 2025, 61, 102397. [Google Scholar] [CrossRef]
  32. Gualtieri, G.; Ahbil, K.; Brilli, L.; Carotenuto, F.; Cavaliere, A.; Gioli, B.; Giordano, T.; Katiellou, G.L.; Mouhaimini, M.; Tarchiani, V.; et al. Potential of Low-Cost PM Monitoring Sensors to Fill Monitoring Gaps in Areas of Sub-Saharan Africa. Atmos. Pollut. Res. 2024, 15, 102158. [Google Scholar] [CrossRef]
  33. Carotenuto, F.; Brilli, L.; Gioli, B.; Gualtieri, G.; Vagnoli, C.; Mazzola, M.; Viola, A.P.; Vitale, V.; Severi, M.; Traversi, R.; et al. Long-Term Performance Assessment of Low-Cost Atmospheric Sensors in the Arctic Environment. Sensors 2020, 20, 1919. [Google Scholar] [CrossRef]
  34. Brilli, L.; Carotenuto, F.; Andreini, B.P.; Cavaliere, A.; Esposito, A.; Gioli, B.; Martelli, F.; Stefanelli, M.; Vagnoli, C.; Venturi, S.; et al. Low-Cost Air Quality Stations’ Capability to Integrate Reference Stations in Particulate Matter Dynamics Assessment. Atmosphere 2021, 12, 1065. [Google Scholar] [CrossRef]
  35. Noruzzade, E.; Mirzaei, N.; Janghorbanian, S.; Hassanvand, M.; Nikkhoo, N.; Khanizadeh, M. A Systematic Global Review of Fixed Air Quality Monitoring Stations: Spatial Distribution, Typologies, Measured Pollutants, Technologies, Regulatory Standards, and Research Gaps. J. Air Pollut. Health 2025, 10, 445–468. [Google Scholar] [CrossRef]
  36. Siddiqui, M.A.; Baig, M.H.; Yousuf, M.U. Performance and Data Acquisition from Low-Cost Air Quality Sensors: A Comprehensive Review. Air Qual. Atmos. Health 2025, 18, 1183–1203. [Google Scholar] [CrossRef]
  37. Huzlík, J.; Hegrová, J.; Effenberger, K.; Ličbinský, R.; Brtnický, M. Air Quality in Brno City Parks. Atmosphere 2020, 11, 510. [Google Scholar] [CrossRef]
  38. Xing, Y.; Brimblecombe, P. Role of Vegetation in Deposition and Dispersion of Air Pollution in Urban Parks. Atmos. Environ. 2019, 201, 73–83. [Google Scholar] [CrossRef]
  39. Harris, T.B.; Manning, W.J. Nitrogen Dioxide and Ozone Levels in Urban Tree Canopies. Environ. Pollut. 2010, 158, 2384–2386. [Google Scholar] [CrossRef]
  40. Grundström, M.; Pleijel, H. Limited Effect of Urban Tree Vegetation on NO2 and O3 Concentrations near a Traffic Route. Environ. Pollut. 2014, 189, 73–76. [Google Scholar] [CrossRef]
  41. Fantozzi, F.; Monaci, F.; Blanusa, T.; Bargagli, R. Spatio-Temporal Variations of Ozone and Nitrogen Dioxide Concentrations under Urban Trees and in a Nearby Open Area. Urban Clim. 2015, 12, 119–127. [Google Scholar] [CrossRef]
  42. García-Gómez, H.; Aguillaume, L.; Izquieta-Rojano, S.; Valiño, F.; Àvila, A.; Elustondo, D.; Santamaría, J.M.; Alastuey, A.; Calvete-Sogo, H.; González-Fernández, I.; et al. Atmospheric Pollutants in Peri-Urban Forests of Quercus Ilex: Evidence of Pollution Abatement and Threats for Vegetation. Environ. Sci. Pollut. Res. 2016, 23, 6400–6413. [Google Scholar] [CrossRef]
  43. Yli-Pelkonen, V.; Setälä, H.; Viippola, V. Urban Forests near Roads Do Not Reduce Gaseous Air Pollutant Concentrations but Have an Impact on Particles Levels. Landsc. Urban Plan. 2017, 158, 39–47. [Google Scholar] [CrossRef]
  44. Yli-Pelkonen, V.; Scott, A.A.; Viippola, V.; Setälä, H. Trees in Urban Parks and Forests Reduce O3, but Not NO2 Concentrations in Baltimore, MD, USA. Atmos. Environ. 2017, 167, 73–80. [Google Scholar] [CrossRef]
  45. Klingberg, J.; Broberg, M.; Strandberg, B.; Thorsson, P.; Pleijel, H. Influence of Urban Vegetation on Air Pollution and Noise Exposure—A Case Study in Gothenburg, Sweden. Sci. Total Environ. 2017, 599–600, 1728–1739. [Google Scholar] [CrossRef] [PubMed]
  46. e Almeida, L.D.O.; Favaro, A.; Raimundo-Costa, W.; Anhê, A.C.B.M.; Ferreira, D.C.; Blanes-Vidal, V.; Dos Santos Senhuk, A.P.M. Influence of Urban Forest on Traffic Air Pollution and Children Respiratory Health. Environ. Monit. Assess. 2020, 192, 175. [Google Scholar] [CrossRef]
  47. Connerton, P.; Nogueira, T.; Kumar, P.; De Fatima Andrade, M.; Ribeiro, H. Exploring Climate and Air Pollution Mitigating Benefits of Urban Parks in Sao Paulo Through a Pollution Sensor Network. Int. J. Environ. Res. Public Health 2025, 22, 306. [Google Scholar] [CrossRef]
  48. Czaja, M.; Kołton, A.; Muras, P. The Complex Issue of Urban Trees—Stress Factor Accumulation and Ecological Service Possibilities. Forests 2020, 11, 932. [Google Scholar] [CrossRef]
  49. Haase, D.; Hellwig, R. Effects of Heat and Drought Stress on the Health Status of Six Urban Street Tree Species in Leipzig, Germany. Trees For. People 2022, 8, 100252. [Google Scholar] [CrossRef]
  50. Grote, R.; Samson, R.; Alonso, R.; Amorim, J.H.; Cariñanos, P.; Churkina, G.; Fares, S.; Thiec, D.L.; Niinemets, Ü.; Mikkelsen, T.N.; et al. Functional Traits of Urban Trees: Air Pollution Mitigation Potential. Front. Ecol. Environ. 2016, 14, 543–550. [Google Scholar] [CrossRef]
  51. Baraldi, R.; Chieco, C.; Neri, L.; Facini, O.; Rapparini, F.; Morrone, L.; Rotondi, A.; Carriero, G. An Integrated Study on Air Mitigation Potential of Urban Vegetation: From a Multi-Trait Approach to Modeling. Urban For. Urban Green. 2019, 41, 127–138. [Google Scholar] [CrossRef]
  52. Ibsen, P.C.; Santiago, L.S.; Shiflett, S.A.; Chandler, M.; Jenerette, G.D. Irrigated Urban Trees Exhibit Greater Functional Trait Plasticity Compared to Natural Stands. Biol. Lett. 2023, 19, 20220448. [Google Scholar] [CrossRef] [PubMed]
  53. Fares, S.; Loreto, F. Isoprenoid Emissions by the Mediterranean Vegetation in Castelporziano. Rend. Fis. Acc. Lincei 2015, 26, 493–498. [Google Scholar] [CrossRef]
  54. Pace, R.; Grote, R. Deposition and Resuspension Mechanisms Into and From Tree Canopies: A Study Modeling Particle Removal of Conifers and Broadleaves in Different Cities. Front. For. Glob. Change 2020, 3, 26. [Google Scholar] [CrossRef]
  55. Li, S.; Li, Y.; Meng, H.; Cao, M.; Wang, X.; Zhang, T.; Zhang, Z.; Zhang, W. Effect of Multiscale Plant Traits on Particulate Matter Resuspension. Environ. Pollut. 2025, 387, 127330. [Google Scholar] [CrossRef] [PubMed]
  56. Zhang, X.; Lyu, J.; Han, Y.; Sun, N.; Sun, W.; Li, J.; Liu, C.; Yin, S. Effects of the Leaf Functional Traits of Coniferous and Broadleaved Trees in Subtropical Monsoon Regions on PM2.5 Dry Deposition Velocities. Environ. Pollut. 2020, 265, 114845. [Google Scholar] [CrossRef] [PubMed]
  57. Li, Y.; Zhang, X.; Li, M.; Yin, S.; Zhang, Z.; Zhang, T.; Meng, H.; Gong, J.; Zhang, W. Particle Resuspension from Leaf Surfaces: Effect of Species, Leaf Traits and Wind Speed. Urban For. Urban Green. 2022, 77, 127740. [Google Scholar] [CrossRef]
  58. Wang, M.; Qin, M.; Xu, P.; Huang, D.; Jin, X.; Chen, J.; Dong, D.; Ren, Y. Atmospheric Particulate Matter Retention Capacity of Bark and Leaves of Urban Tree Species. Environ. Pollut. 2024, 342, 123109. [Google Scholar] [CrossRef]
  59. Xing, Y.; Brimblecombe, P.; Wang, S.; Zhang, H. Tree Distribution, Morphology and Modelled Air Pollution in Urban Parks of Hong Kong. J. Environ. Manag. 2019, 248, 109304. [Google Scholar] [CrossRef]
  60. Janhäll, S. Review on Urban Vegetation and Particle Air Pollution—Deposition and Dispersion. Atmos. Environ. 2015, 105, 130–137. [Google Scholar] [CrossRef]
Figure 1. AirQino sensors above/below the canopies inside the experimental area during summer 2022 (a) and spring 2023 (b).
Environments 13 00097 g001
Figure 2. Daily average trend of O3 (A), NO2 (B), PM10 (C), and PM2.5 (D) above/below the tree canopies inside the experimental area from 1 January 2023 to 31 December 2024. The grey background refers to the growing season. Average concentrations ± standard errors are reported for the growing season according to Student’s t-test or the Mann–Whitney U test: ns not significant, * p ≤ 0.05, and *** p < 0.001.
Environments 13 00097 g002
Figure 3. Pearson’s correlation matrix derived from atmospheric variables (temperature—T; relative humidity—RH) and daily differences (Δ) of air pollutant concentrations (O3, NO2, PM10, and PM2.5) below the canopies relative to above the canopies for the years 2023 and 2024. * p ≤ 0.05, ** p < 0.01, and *** p < 0.001.
Environments 13 00097 g003
Disclaimer/Publisher’s Note: The statements, opinions and data contained in all publications are solely those of the individual author(s) and contributor(s) and not of MDPI and/or the editor(s). MDPI and/or the editor(s) disclaim responsibility for any injury to people or property resulting from any ideas, methods, instructions or products referred to in the content.