Article

Habitat Associations, Habitat Selection and Long-Term Monitoring of Land Snails: Quantifying Measurements to Better Detect Trends


by
Lusha M. Tronstad
1,2,3,*,
Katrina A. Cook
1 and
Bryan P. Tronstad
1
1
Wyoming Natural Diversity Database, University of Wyoming, Laramie, WY 82071, USA
2
Department of Zoology and Physiology, University of Wyoming, Laramie, WY 82071, USA
3
Program in Ecology and Evolution, University of Wyoming, Laramie, WY 82071, USA
*
Author to whom correspondence should be addressed.
Environments 2026, 13(2), 89; https://doi.org/10.3390/environments13020089
Submission received: 23 November 2025 / Revised: 8 January 2026 / Accepted: 1 February 2026 / Published: 4 February 2026

Abstract

Land snails have the highest recorded extinction rate, and these small animals are often overlooked, leading to data gaps. Past data for land snails is often lacking, making the analysis of trends difficult. Here, we compared past presence surveys to new quantitative estimates to infer changes over time. We surveyed 55 sites for land snails and habitat characteristics in 2024 using visual encounter surveys for medium to large snails and litter samples to assess the density of small to medium snails. We assessed habitat on two scales to assess associations and selection. We identified 27 land snail species, including a non-native species (Oxychilus cellarius). Sites with higher snail density and a richer assemblage generally had deeper litter, higher canopy cover and taller understory vegetation. Rare land snails were detected at most sites where they had previously been found, and we detected several species at new sites where they had not previously been documented, due to litter sampling. Vertigo arthuri (V. paradoxa) selected sites with a higher canopy cover. The abundance and density of land snails will enable better estimates of long-term trends and help assess how they respond to management actions. Resolving the taxonomy of Oreohelix and Succineidae is critical for direct management of these species.

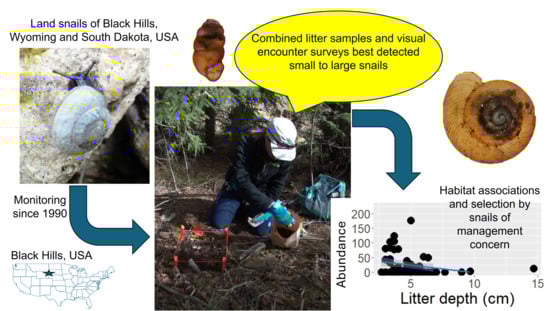
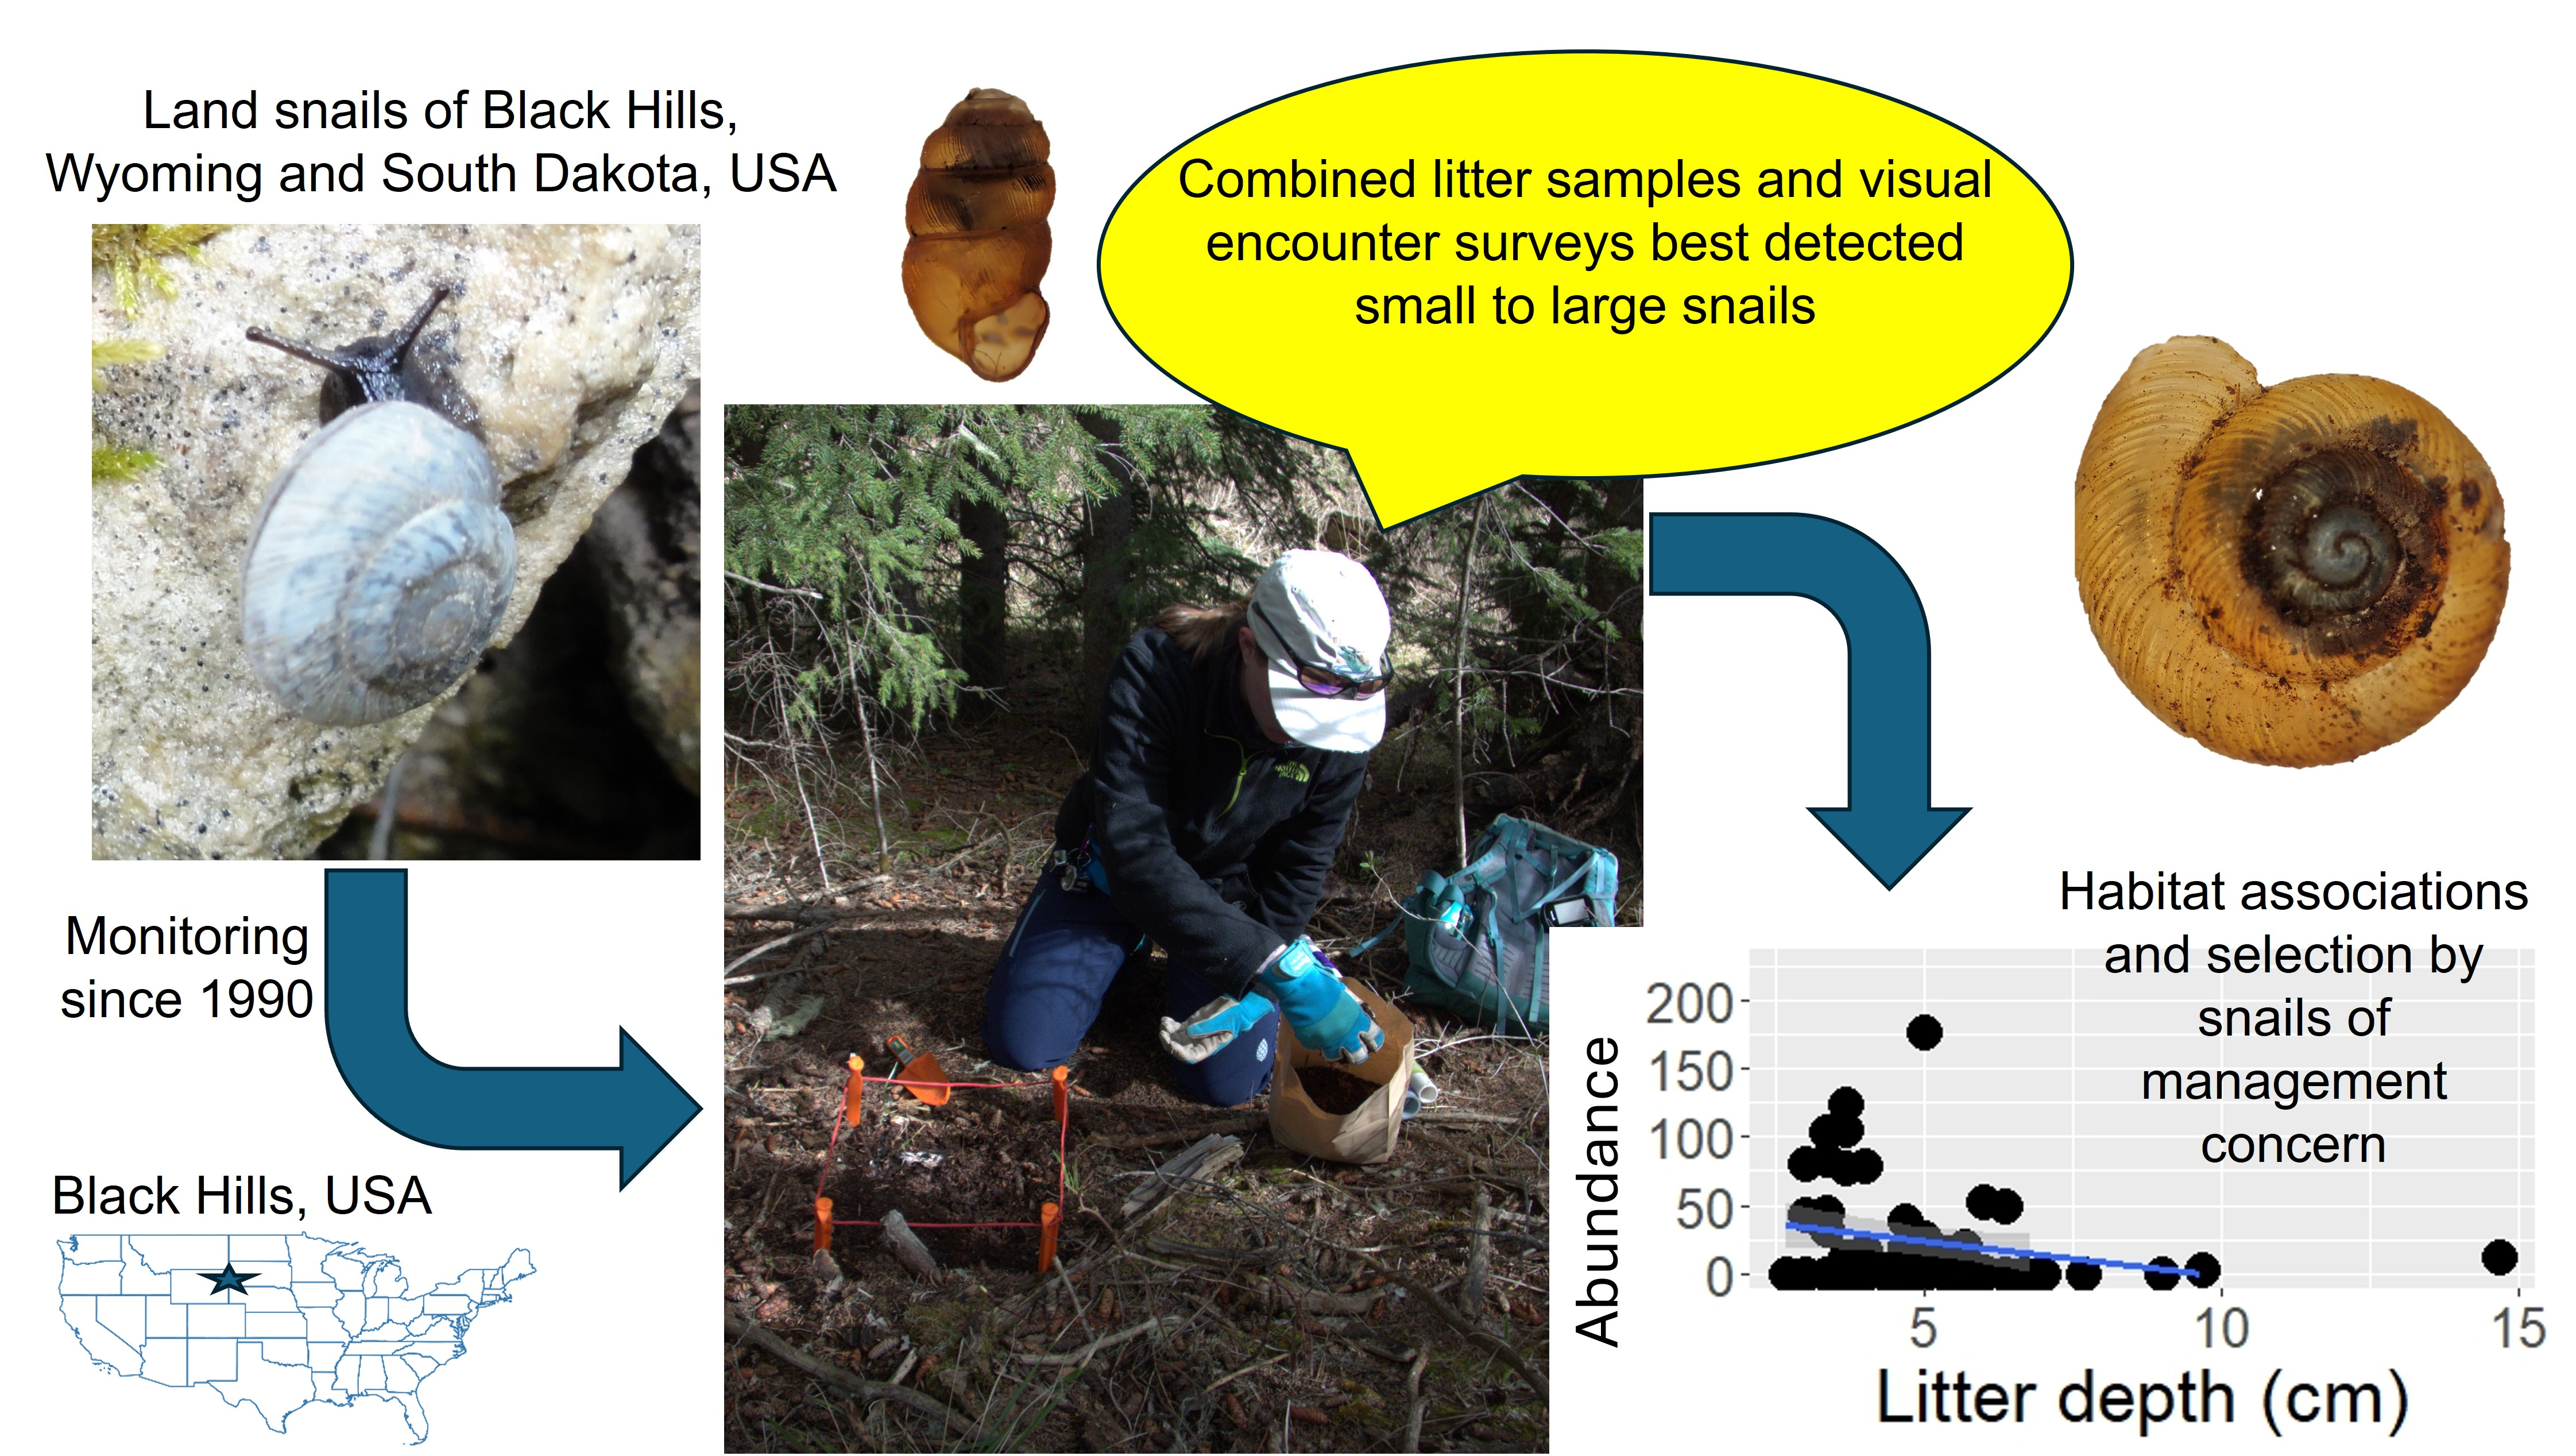
Graphical Abstract

1. Introduction

Land snails are a diverse group of invertebrates about which relatively little is known. They belong to the phylum Mollusca, which is one of the most critically imperiled groups of animals on Earth, partly because they have the highest number of recorded extinctions [1,2]. About 24,000 land snail species have been described, and ~11,000 to 40,000 land snail species are predicted to exist but have not yet been described [1]. Several life history traits increase the risk of extinction for land snails. For example, snails move small distances, which limits dispersal and gene flow and increases the likelihood of endemic species [3]. Additionally, rising air temperatures and changing precipitation patterns may alter the range of land snails [4], especially those living in mountains [5]. Species may shift to higher elevations as conditions change; however, those living at the highest elevations cannot shift farther upward [6]. Understanding the habitats that snails are associated with and prefer can inform management decisions for land use practices, e.g., Ref. [7]; however, most studies investigating such relationships for land snails have been conducted in tropical regions, e.g., Refs. [8,9].
Assessing the habitats that species use is critical for measuring their basic needs. Habitat association and habitat selection are two measures that estimate the habitats used by plants and animals [10]. Habitat associations describe the relationship between a species and habitat characteristics [10], whereas habitat selection compares the characteristics of habitats where an animal is found (i.e., used) to the characteristics of habitats where it is not found (i.e., available) [11]. Habitat association and habitat selection provide different information that can be used to understand a species’ micro- and macrohabitat use. Habitat associations can identify the characteristics of habitats where a species is most abundant using biologically relevant variables chosen a priori [10]. Analyzing habitat association can be an excellent method for assessing the effectiveness of management actions on target species. Density can provide misleading results; for example, ecological traps are created when habitat cues change due to anthropogenic causes, leading to high mortality or low fitness despite high densities [12]. Density is thought to be a good measure for rare species; however, no invertebrate examples were used [13]. Invertebrates are commonly used to measure ecosystem quality in a variety of habitats [14,15], and density may be an optimal measure for many invertebrate animals, but more information is needed. Conversely, habitat selection analyzes the presence and absence of species in relation to habitat characteristics and is interpreted as the habitat chosen compared to the habitat options available [16]. Analyzing habitat association and habitat selection simultaneously can provide more information than either approach alone. For example, a species selects for and thrives in conditions where its density is positively related to a habitat characteristic, and the species also selects that characteristic. Conversely, other factors likely affect the species when its density is inversely related to a habitat characteristics but the species still selects that characteristic (e.g., an ecological trap).
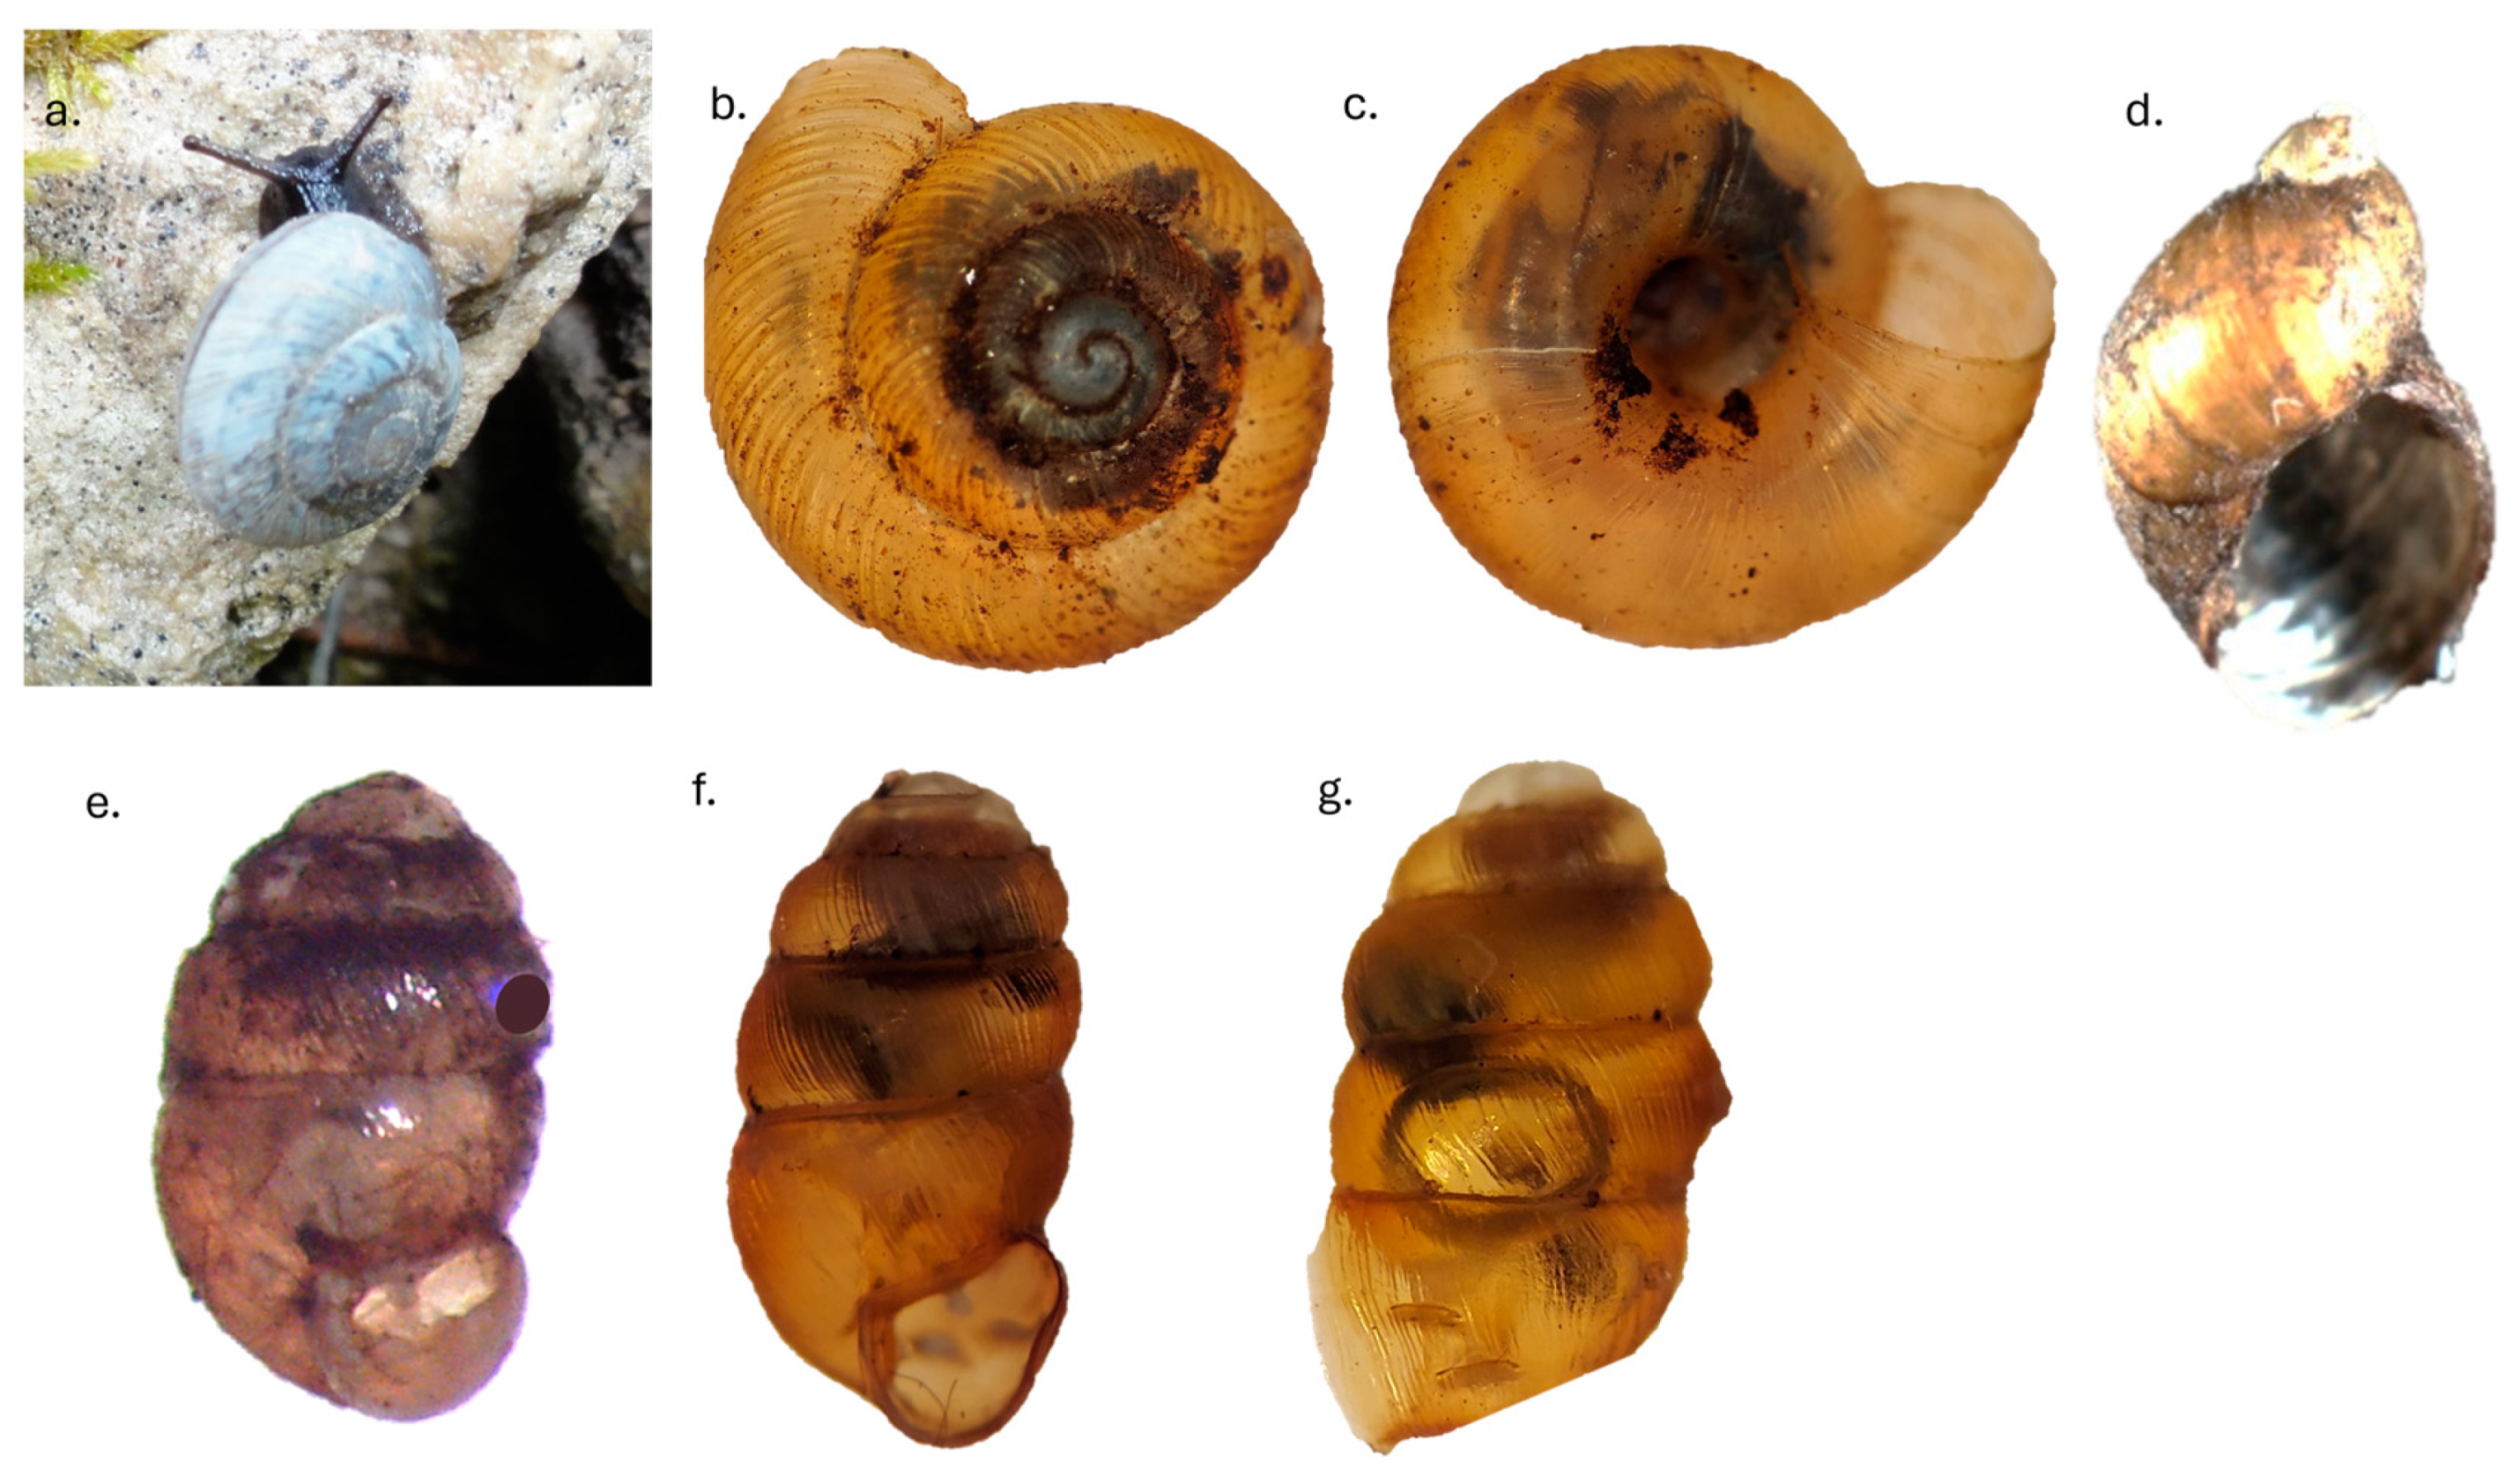
The Black Hills of South Dakota and Wyoming, USA, are a rich area due to both eastern and western species inhabiting the landscape, which includes birds, insects and snails. Several rare land snails live in the Black Hills and are considered Sensitive Species or species of local concern by the US Forest Service and Species of Greatest Conservation Need by the South Dakota Game, Fish and Parks, and Wyoming Game and Fish Department (referred to as target species hereafter; Figure 1). Oreohelix cooperi (or Oreohelix strigosa cooperi; Figure 1a) is a large (<20 mm diameter), compressed snail that conspicuously lives in the Black Hills. Discus shimekii is another compressed snail that is 5–7 mm in diameter, with ribs on the upper side of the shell (Figure 1b). The validity of Mediappendix gelida is still debated among taxonomists (Figure 1c); some scientists think that the 5–7 mm long snail differs enough to be considered a unique species [17] while others consider the form in the Black Hills as a variant of C. wandae [18]. Vertigo arthuri and V. paradoxa are minute snails (<2 mm height) that live in litter (Figure 1d,e). Recent genetic analysis has found that V. paradoxa cannot be distinguished genetically from V. arthuri [19], although the presence of a callus inside the aperture of V. arthuri makes them morphologically distinct.
Land snails have been surveyed throughout the Black Hills, and 38 [17] to 39 species have been reported [20] with five species of concern [17,21]. Frest and Johannes [17,21] surveyed 357 sites in the Black Hills in 1991–1992 and 1999, and they reported at least one target snail species at 164 sites. Tronstad and Andersen [22] surveyed 45 sites in 2010 and developed protocols to monitor those sites, process samples and detect changes in the target species. We returned to 55 of these sites in 2024 to assess the land snails there using visual encounter surveys for the larger species (Oreohelix, Discus and Mediappendix) and litter samples for the minute species (i.e., Vertigo). Our goals were to assess the status of these snails at a portion of the original sites and collect qualitative and quantitative data to establish a more sensitive monitoring protocol. Our specific questions were as follows: (1) What was the abundance or density of target snail species? (2) What habitat characteristics were they associated with and which habitat characteristics did they select? (3) To what degree have long-term trends changed by site? We report on the current status and trends of target snail species 33 years after the initial surveys and 14 years after the most recent effort. The results will inform managers about the trends in snail species of management concern in the Black Hills so that informed decisions can be made.

2. Materials and Methods

2.1. Study Ecosystem

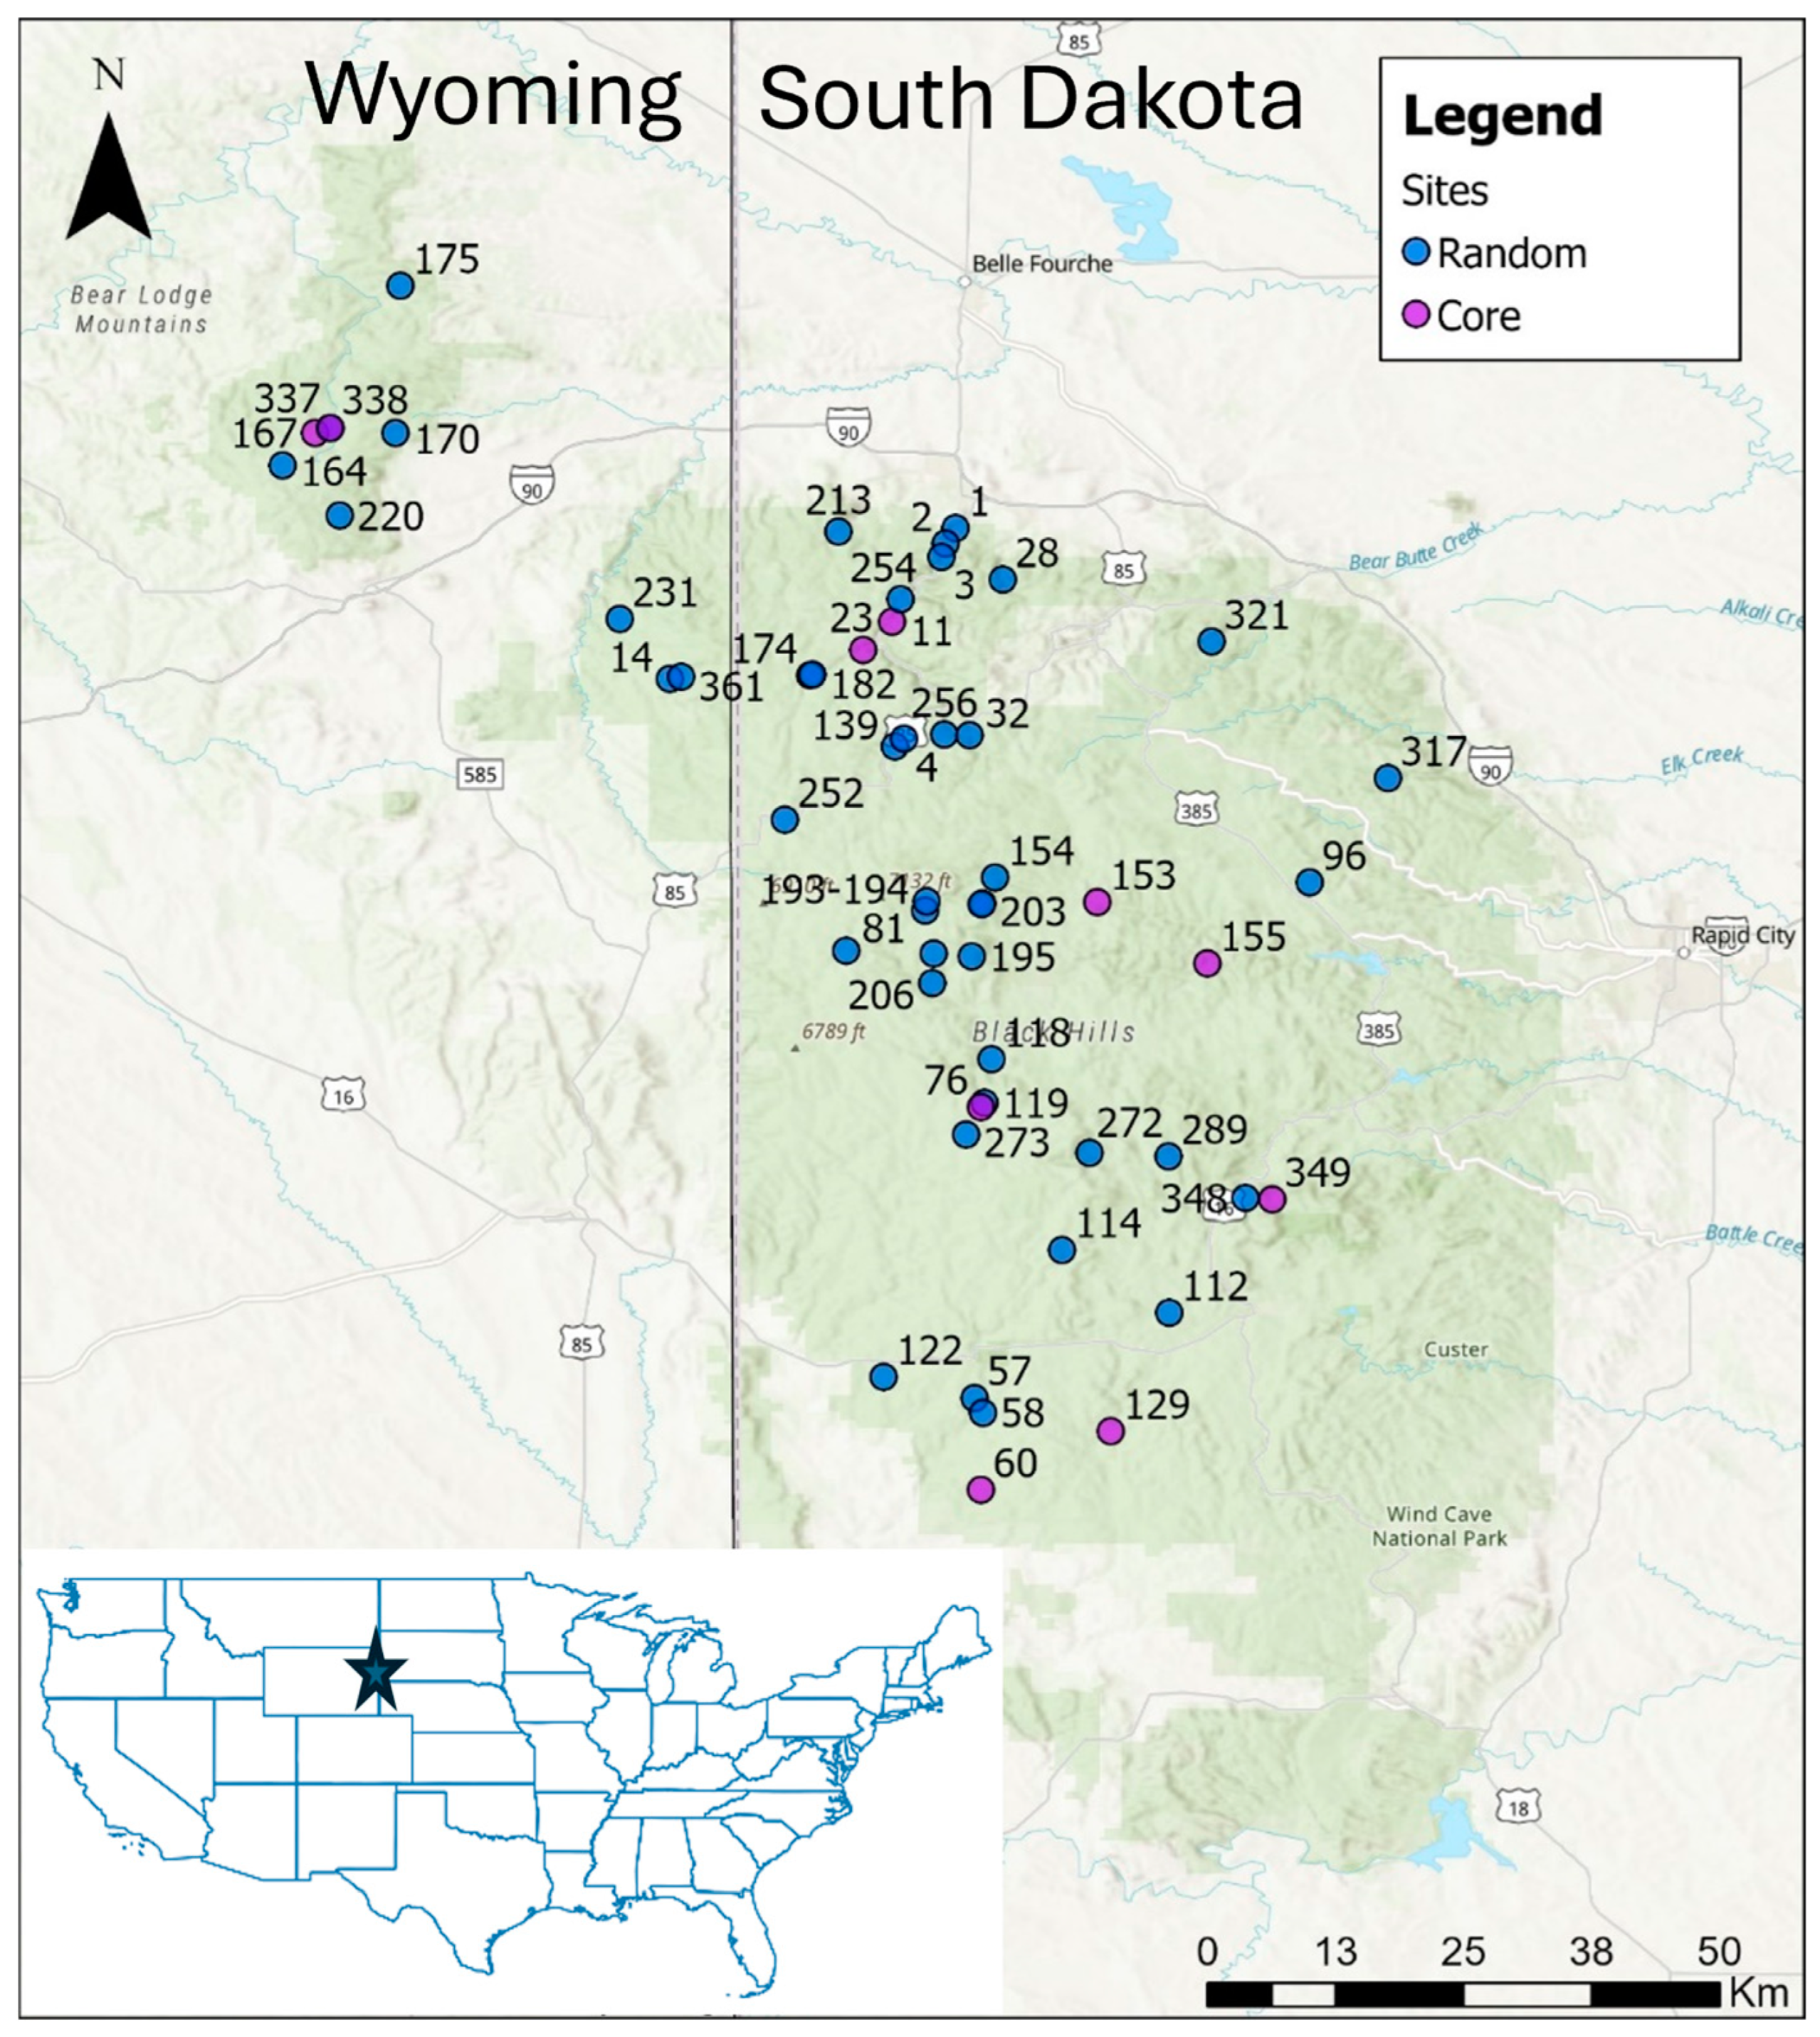
The Black Hills are located along the border of South Dakota and Wyoming, USA, and the US Forest Service manages >506,000 hectares of land (Figure 2). The forest is primarily composed of Ponderosa pine (Pinus contortus), White spruce (Picea glauca), Quaking aspen (Populus tremuloides) and Bur oak (Quercus macrocarpa). The understory is primarily composed of Juniper (Juniperus), Chokecherry (Prunus virginiana), Currant (Ribes), Rose (Rosa) and Oregon grape (Mahonia aquifolium; Figure S1). The maximum elevation of the Black Hills is 2207 m. Recreation, timber production and livestock grazing are the main land uses in the forest. The Black Hills have distinct seasons, as is typical of a continental climate. The area receives ~43 cm of rain and 102 cm of snow annually, with the northern area being wetter and the southern area being drier. Temperatures vary between −29 °C in winter and ~32 °C in summer.

2.2. Target Snail Species

Five species of land snails are of regional or local concern in the Black Hills National Forest of South Dakota and Wyoming, USA (Figure 1) and were the focus of our study [17,21]. We address the taxonomy so that how we name the species can be related to previous reports. Mountainsnails (genus Oreohelix) are detritivores [23] that consist of ~85 taxa, and most of those are endemic to small areas (e.g., a canyon or mountain range). The taxonomy is based on shell morphology and internal anatomy assessed ~100 years ago, and is in desperate need of revision with modern techniques [24]. Originally, Oreohelix from the Black Hills were called O. strigosa cooperi, and individuals from the Bearlodge Mountains were O. strigosa berryi [21]. We refer to the Black Hills as the area west of Rapid City (Black Hills proper) and the Bearlodge Mountains (Figure 2), but whether Oreohelix is unique between these areas has been debated. Frest and Johannes [17] separated Oreohelix in the Black Hills into 3 taxa: Oreohelix cooperi (larger Oreohelix from the Black Hills proper), Oreohelix n. sp. 1 (smaller Oreohelix from the Black Hills proper), and Oreohelix n. sp. 2 (Oreohelix from the Bearlodge Mountains). The morphological conclusion of Frest and Johannes [17] precipitated two molecular studies. Weaver et al. [25] concluded that Oreohelix in the Black Hills proper and Bearlodge Mountains were all the same taxonomic unit using mitochondrial DNA; however, Chak [26] suggested that Oreohelix from the Black Hills proper differed from those in the Bearlodge Mountains using nuclear DNA. Therefore, both studies suggested that the large and small varieties of Oreohelix in the Black Hills proper did not differ (e.g., the same species or subspecies). Anderson et al. [27] reported that differences in shell size were due to environmental factors, where warmer temperatures and lower shell densities resulted in larger diameter Oreohelix. In fact, Frest and Johannes [17] stated that the only shell morphology that differed between large and small varieties was size. Future analyses are required to settle the debate. We refer to only one species of Oreohelix in the report. If the species differ, they can easily be distinguished by location (i.e., Black Hills proper vs. Bearlodge Mountains). No other species of Oreohelix live in the Black Hills.
Three species of Discus live in the Black Hills. Discus whitneyi is one of the most common land snails in the Black Hills, while D. shimekii and D. catskillensis are uncommon. We are not aware of any debate about the taxonomy of Discus shimekii, and the three species can be distinguished with magnification.
Mediappendix gelida belongs to the family Succineidae, the genera and species of which cannot be identified (Nekola, personal communication, 2024). The previous genus Catinella was changed to Mediappendix [28]. Currently, no reliable keys exist to identify land snails in this family. Furthermore, Frest and Johannes [17] did not state how they differentiated the three species of Succineidae in the Black Hills (Catinella gelida, Succinea indiana and Succinea stretchiana), and the shell dimensions they list for each species overlap, making identification impossible. Therefore, we identified only snails in the family Succineidae.
Frest and Johannes [17] reported two species of rare Vertigo in the Black Hills: V. arthuri and V. paradoxa. These two taxa are differentiated by the presence (V. arthuri) or absence (V. paradoxa) of a callus along the upper palatal wall of the aperture Figure 1e–g [29]. Nekola and Coles [29] stated that reports of V. paradoxa in the Black Hills are probably Vertigo arthuri with a poorly developed callus, and recent analysis found little genetic distinction between the two species [19]. We found Vertigo with and without a callus in the Black Hills, and we combined them for analysis, but identified them separately in case future works find them distinct. Nekola and Coles [29] stated that callus size can vary within a colony, but the forms we observed either had or lacked a callus, making species identification clear.

2.3. Field Methods

We sampled sites according to the monitoring plan proposed by Tronstad and Andersen [22], where core sites are monitored each time surveys are performed, and random sites are chosen based on priorities. We sampled 10 core sites and 45 random sites as time and funds allowed in May and June 2024 (Figure S1; Supplemental Materials). This design allows for close monitoring of core sites so that long-term data can be assessed while also providing the opportunity for managers to focus on areas or sites that are of concern. At least one target species was detected at the selected sites in the past.
We used visual encounter surveys for medium (Mediappendix and Discus) to large (Oreohelix) target snail species (referred to as larger species) and litter samples for minute (Vertigo) to medium-sized target species (referred to as smaller species). Larger species were surveyed by walking through each site and visually counting individuals. This included turning over logs, looking under bark and other debris, and examining other microhabitats that may harbor land snails. We collected 5 Oreohelix individuals for later genetic analysis, but we collected at least 1 individual of other larger target species at each site to verify their identity (i.e., Discus and Mediappendix), and these specimens are stored at the Center for Invertebrate Studies, University of Wyoming. We calculated abundance in visual encounter surveys using catch per unit effort (CPUE; snails person−1 h−1), where we counted the number of snails of each target species observed (N) and divided by the number of people completing the survey (P) and the total time surveyed (t):
C P U E = N P × t
Vertigo species are extremely difficult to detect in visual surveys due to their minute size, so we collected one to three litter samples at each site to detect their presence. We collected three litter samples at sites where Vertigo had been previously observed and one litter sample at all other sites due to funding constraints. All litter was removed within the quadrats (0.0929 m2) down to the soil and placed in a paper bag to allow the samples to dry. The samples were transported to the laboratory, where they were separated into size classes using a sieve shaker (12.5, 4, 2, 1 and 0.25 mm stacked sieves) and shook for ~1 min. The contents of each sieve were placed in separate white photographic trays (28 × 48 cm) for sorting. Snails were removed from debris, identified using a key we previously developed [30] and preserved in ethanol. We classified the snails as live, recently dead (pigmented shell only) and long dead (white shell only). We calculated the density of snails in litter samples by dividing the number of snails in each sample by the sampling area to calculate the number of individuals per square meter (ind/m2).
We assessed macrohabitat at each site within a 20 m radius (1557 m2) and smaller-scale variables in 0.0929 m2 quadrats in places that had suitable snail habitats (e.g., the presence of litter, limestone rock outcrops, understory), and we spent ~2 h at each site. Macrohabitat was assessed at three locations per site (beginning, middle and end of visual surveys). We noted the dominant understory vegetation and overstory tree species (i.e., common species at the site). Understory vegetation height was measured to the nearest 5 cm, and tree height was estimated using a range finder and recording the distance from the observer to the top of the tree. The percent cover of rock, leaf litter, coarse woody debris (CWD) and moss was visually estimated at the macrohabitat scale. The number of logs (i.e., fallen trees) was counted in each macrohabitat plot. Vegetation density varied little among plots; thus, we excluded this information from our analysis.
We assessed microhabitat at the same locations that macrohabitat was measured. The percent cover of rock, leaf litter, CWD, and moss was visually estimated in each quadrat. We measured leaf litter depth to the nearest 0.5 cm. Soil temperature was recorded with a handheld temperature gun (Klein Tools IR1 Infrared Thermometer, Klein Tools, Inc., Lincolnshire, IL, USA), and soil moisture and pH were assessed using a soil meter (Moistenland Soil Meter, Moistenland, Shenzhen, China) inserted ~5 cm into the soil. Soil moisture and temperature likely varied among and within days; however, we were only able to visit the sites once. We collected these values to gather basic information at each site, realizing that they changed with conditions. We measured canopy cover using a spherical densiometer at ground level (snail height). Relative humidity was measured with a Kestrel unit at the center of the site. Microhabitat was measured at one or two locations where one or several individuals were present (i.e., used habitat) and at one location where snails were absent (i.e., available habitat) at sites with larger target snails to assess habitat selection using a resource selection function.

2.4. Statistical Analysis

We analyzed the degree to which snail abundance (visual encounter; CPUE; larger target species) and density (litter; ind/m2; smaller target species) varied by habitat characteristics to estimate which variables most influenced their populations. Habitat characteristics from visual encounter surveys were visually assessed within a 20 m radius (1257 m2), and we measured habitat characteristics within quadrats to assess relationships with snail density in litter samples. We used generalized linear model glmmTMB [31] to assess how the presence of dominant tree species (Ponderosa Pine, White Spruce and Bur Oak), ground cover (percent cover of rock, leaf litter, coarse woody debris and moss), canopy cover, number of logs, litter depth, soil moisture, soil pH, soil temperature and relative humidity individually were related to snail abundance and density in Program R [32] using the packages plyr [33] and ggplot [34]. Snail abundance and density were not normally distributed, and we used a zero-inflated Gamma distribution that most closely fit the data after visually inspecting histograms. We added 1 to the abundance and density of snails because Gamma distributions do not allow values < 1. We analyzed the CPUE of Oreohelix and Succineidae from visual encounter surveys, and Vertigo (arthuri and paradoxa), Succineidae, and total snail density and richness in litter samples. We did not analyze Discus shimekii because few detections prevented statistical analysis.
We analyzed macro- and microhabitat selection for target species using a resource selection function by analyzing where each species was present or absent. We used visual encounter surveys to analyze macrohabitat and litter samples to assess microhabitat. To bolster our dataset, we used litter samples in which the density of the target species varied within a site. Macrohabitat selection was analyzed for Oreohelix and Discus, and microhabitat selection was performed on litter samples for Vertigo and Succineidae due to their small size and difficulty detecting via visual encounter surveys. We used the presence (1) or absence (0) of snails as the response variable for habitat selection, and the dependent variables were ground cover (percent cover of rock, leaf litter, coarse woody debris, and moss), canopy cover, number of logs, litter depth, soil moisture, soil temperature and relative humidity. Individual models were created for each habitat variable due to the small sample sizes.

3. Results

3.1. Habitat Characteristics

White spruce (51% of sites), Ponderosa pine (69%), Aspen (46%) and Paper birch (42%) were the most common trees at surveyed sites, and Bur oak (16%) was the least common. The understory plants Wild rose (67%), Juniper (62%), Currants (60%), Oregon grape (51%), Chokecherry (42%), Dogwood (33%) and Honeysuckle (13%) varied in commonness among sites. Ground cover within a 20 m radius averaged 15% (range: 0–67%) rock, 8% (0–47%) moss, 52% (18–85%) litter, 14% (4–37%) CWD, and 87% (0–100%) canopy cover. We observed 8 fallen logs (1–29 logs) per site on average. Litter depth was 5 cm (2.7–14.7 cm) on average. Soil moisture (mean = 3; range: 1–6), pH (6.6; 6.0–7.0) and temperature (17 °C; 3–39 °C) varied among the sites. The height of the understory vegetation averaged 71 cm (0.5–277) and the overstory trees averaged 5 m (1–11.7).

3.2. Relationship Between Snail Density in Litter Samples and Their Habitat

We identified 27 snail taxa in the litter samples. Vallonia parvula (23% of individuals), Discus whitneyi (16%), Punctum minutissimum (9.5%) and Nesovitrea binneyana (7%) were the most common snails we encountered in decreasing order, and Vertigo modesta benihana, Oxychilus cellaris, Nesovitrea electrina and Gastrocopta pentodon were the least common snails (<1%; Table 1). Oxychilus cellaris is a non-native species that has not been previously reported in the Black Hills.
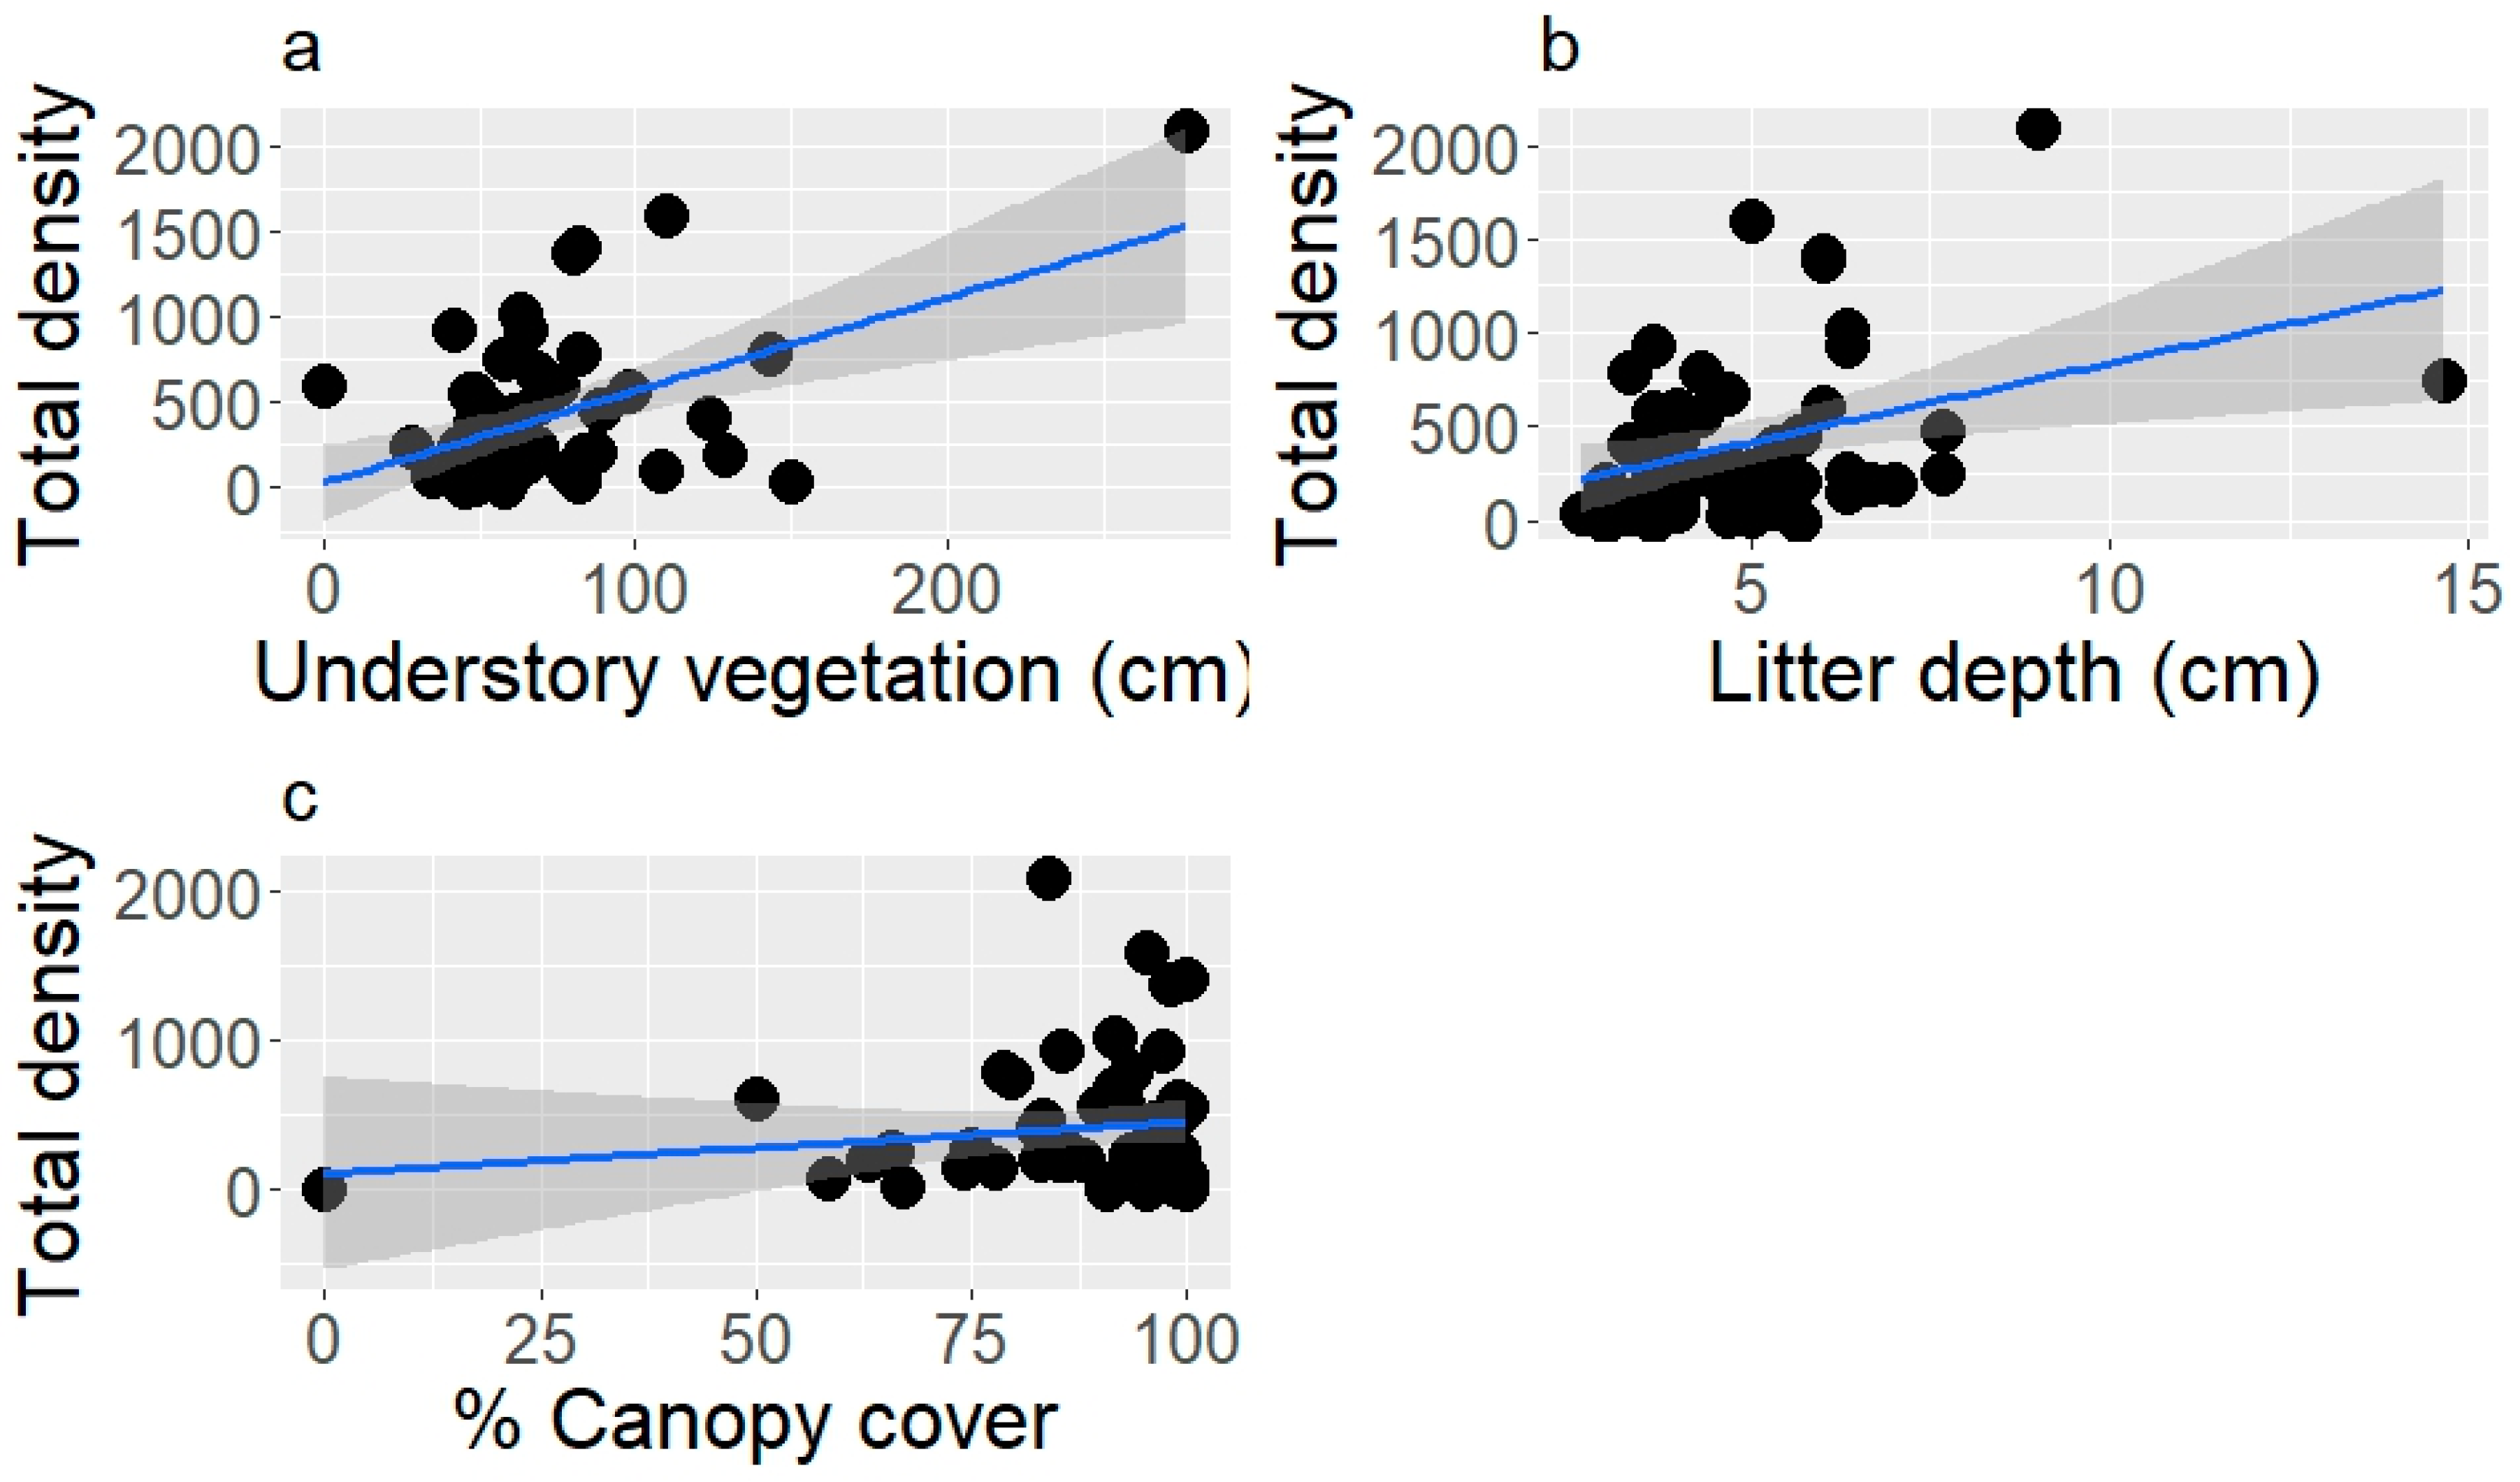
The total snail density in litter samples ranged from 0 to 11,873 ind/m2 (average = 170). The mean percentage of individuals that were alive was 26% (0–100%) while 31% were recently dead in litter samples (0–100%). The total density of live snails was related to understory height (t = 2.2, p = 0.029; Figure 3a), litter depth (t = 2.9, p = 0.0059; Figure 3b) and percent canopy cover (t = 2.0, p = 0.05; Figure 3c). Total snail density was not related to the dominance of White spruce (t = −0.81, p = 0.42), Ponderosa pine (t = −0.57, p = 0.57) or Bur oak (t = −0.41, p = 0.68). The cover of rock (t = 0.40, p = 0.69), litter (t = 0.48, p = 0.63), moss (t = −0.17, p = 0.87) and CWD (t= −0.10, p = 0.93) was not related to total snail density. Tree height (t = 1.21, p = 0.23), number of logs (t = −0.78, p = 0.44), soil temperature (t = 0.65, p = 0.52), soil moisture (t = −1.34, p = 0.31), soil pH (t = −1.1, p = 0.26) and relative humidity (t = −0.39, p = 0.70) were also not related to density.
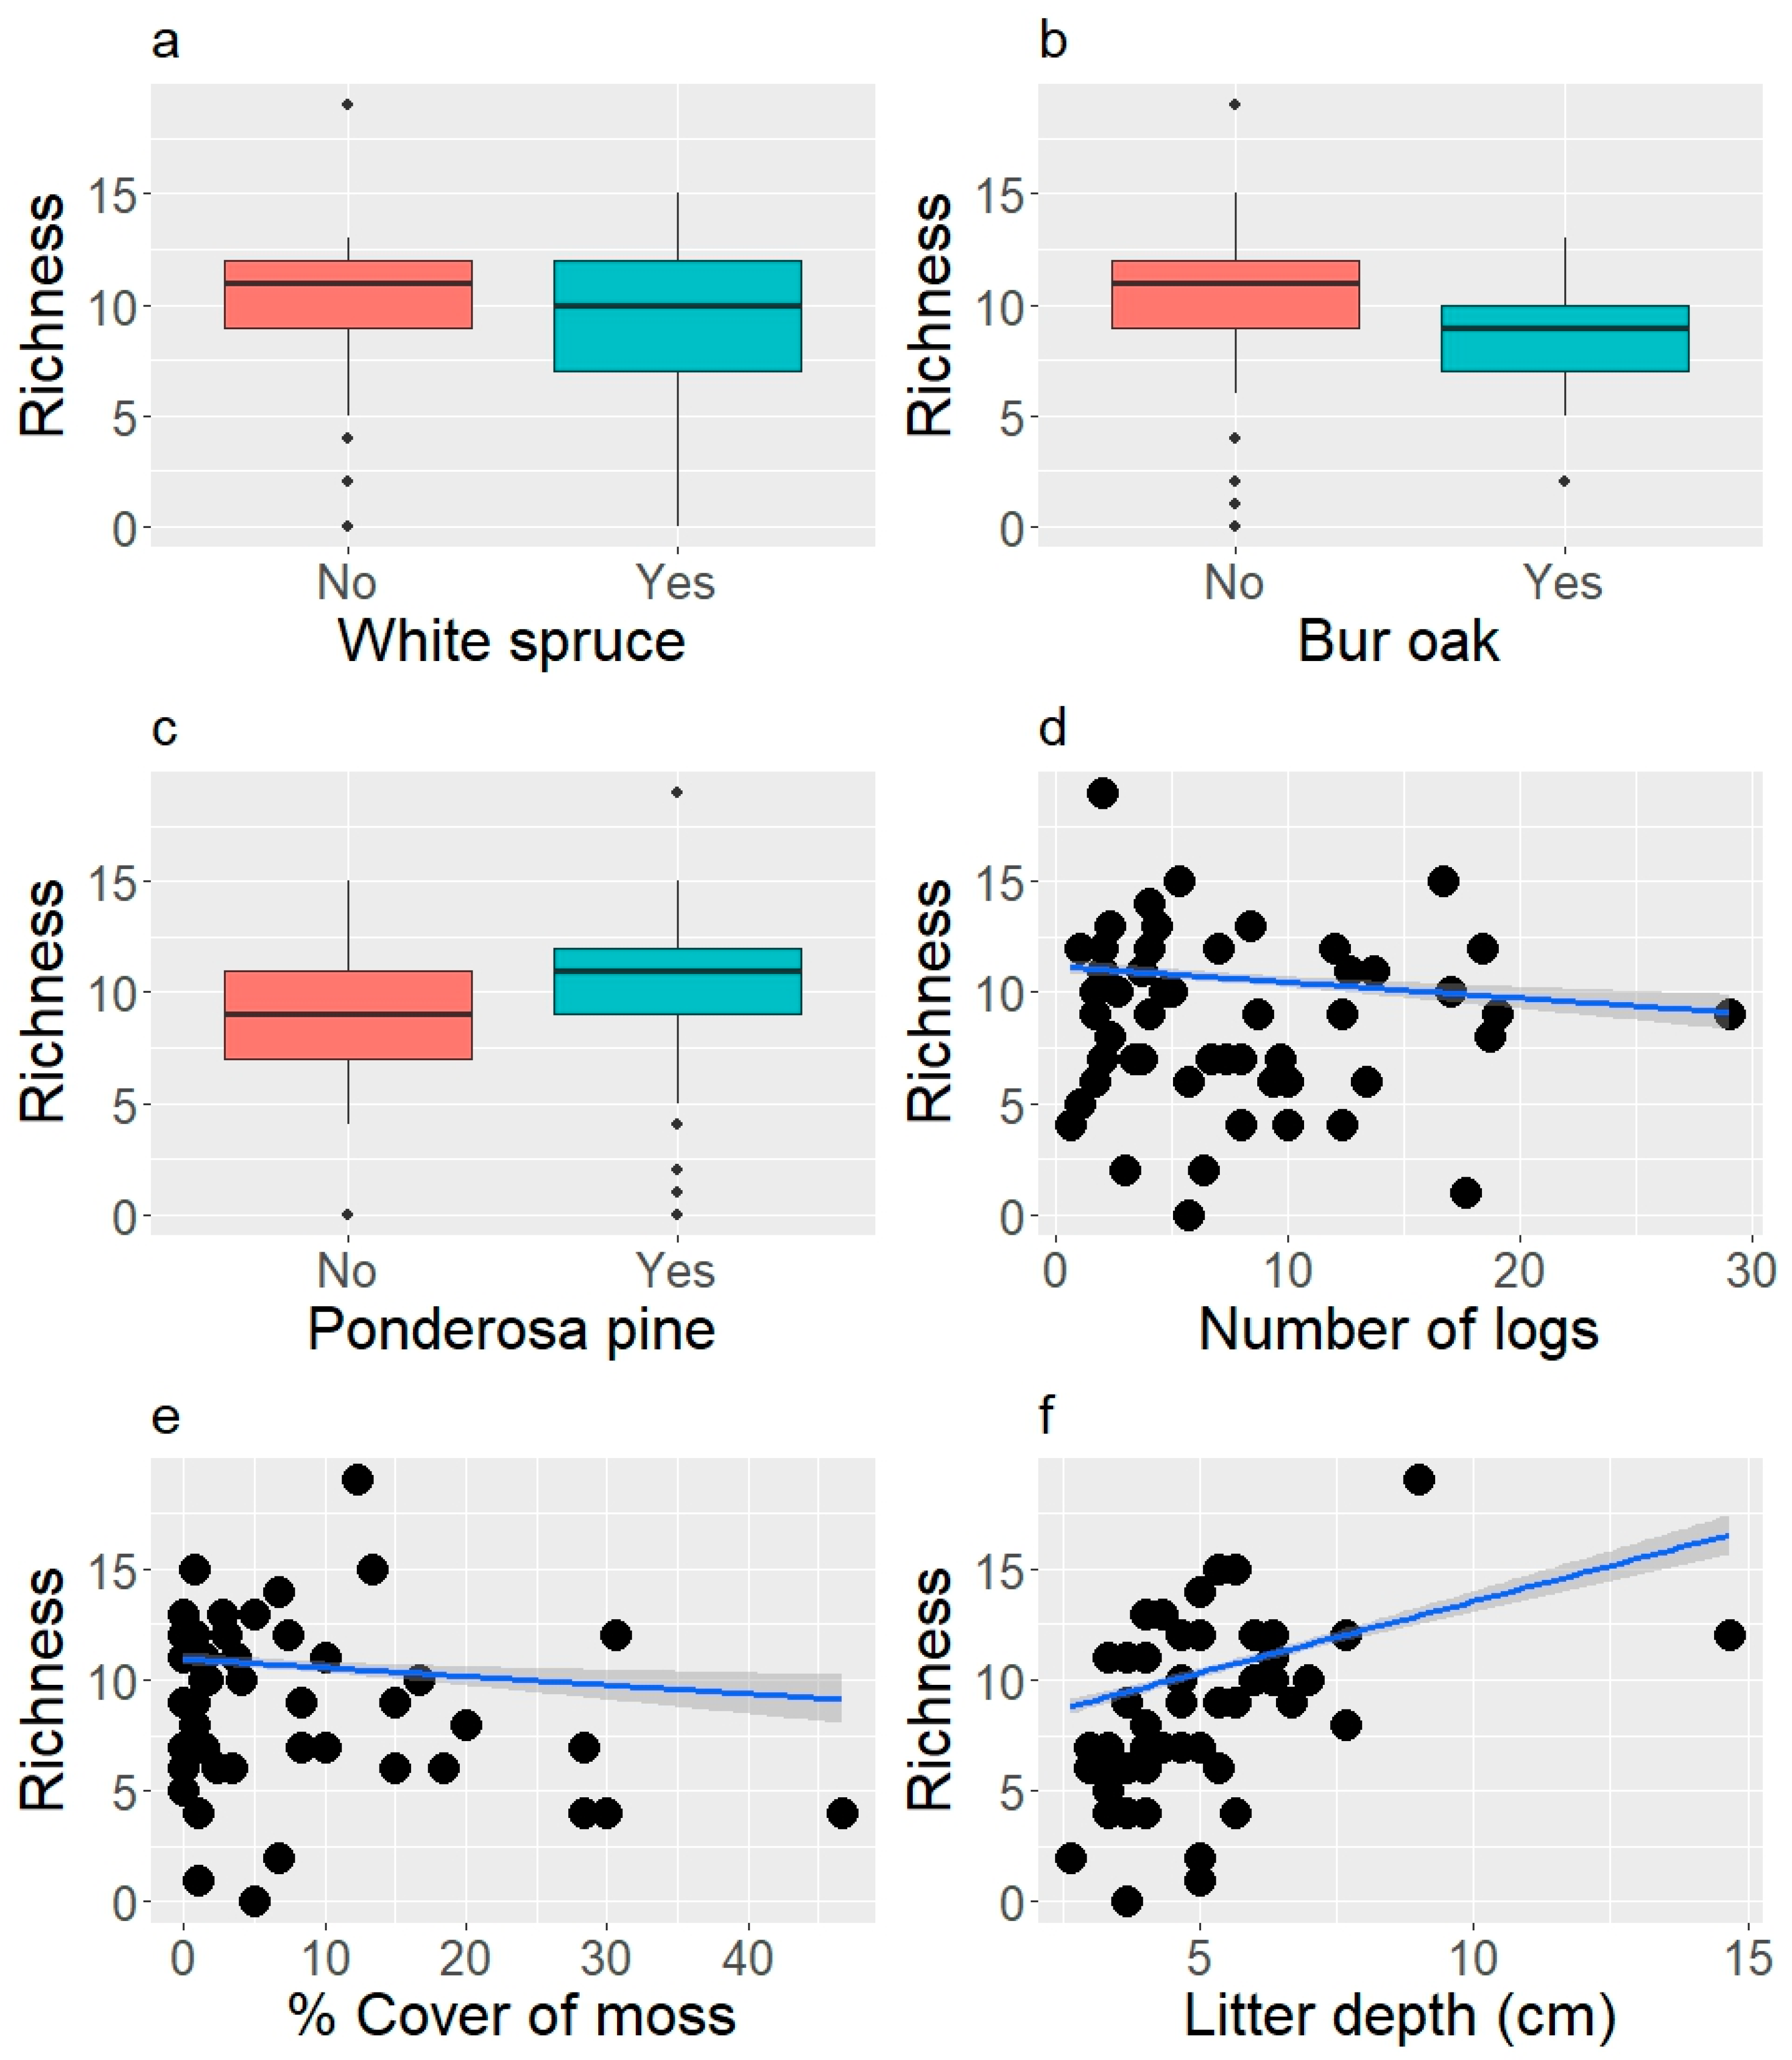
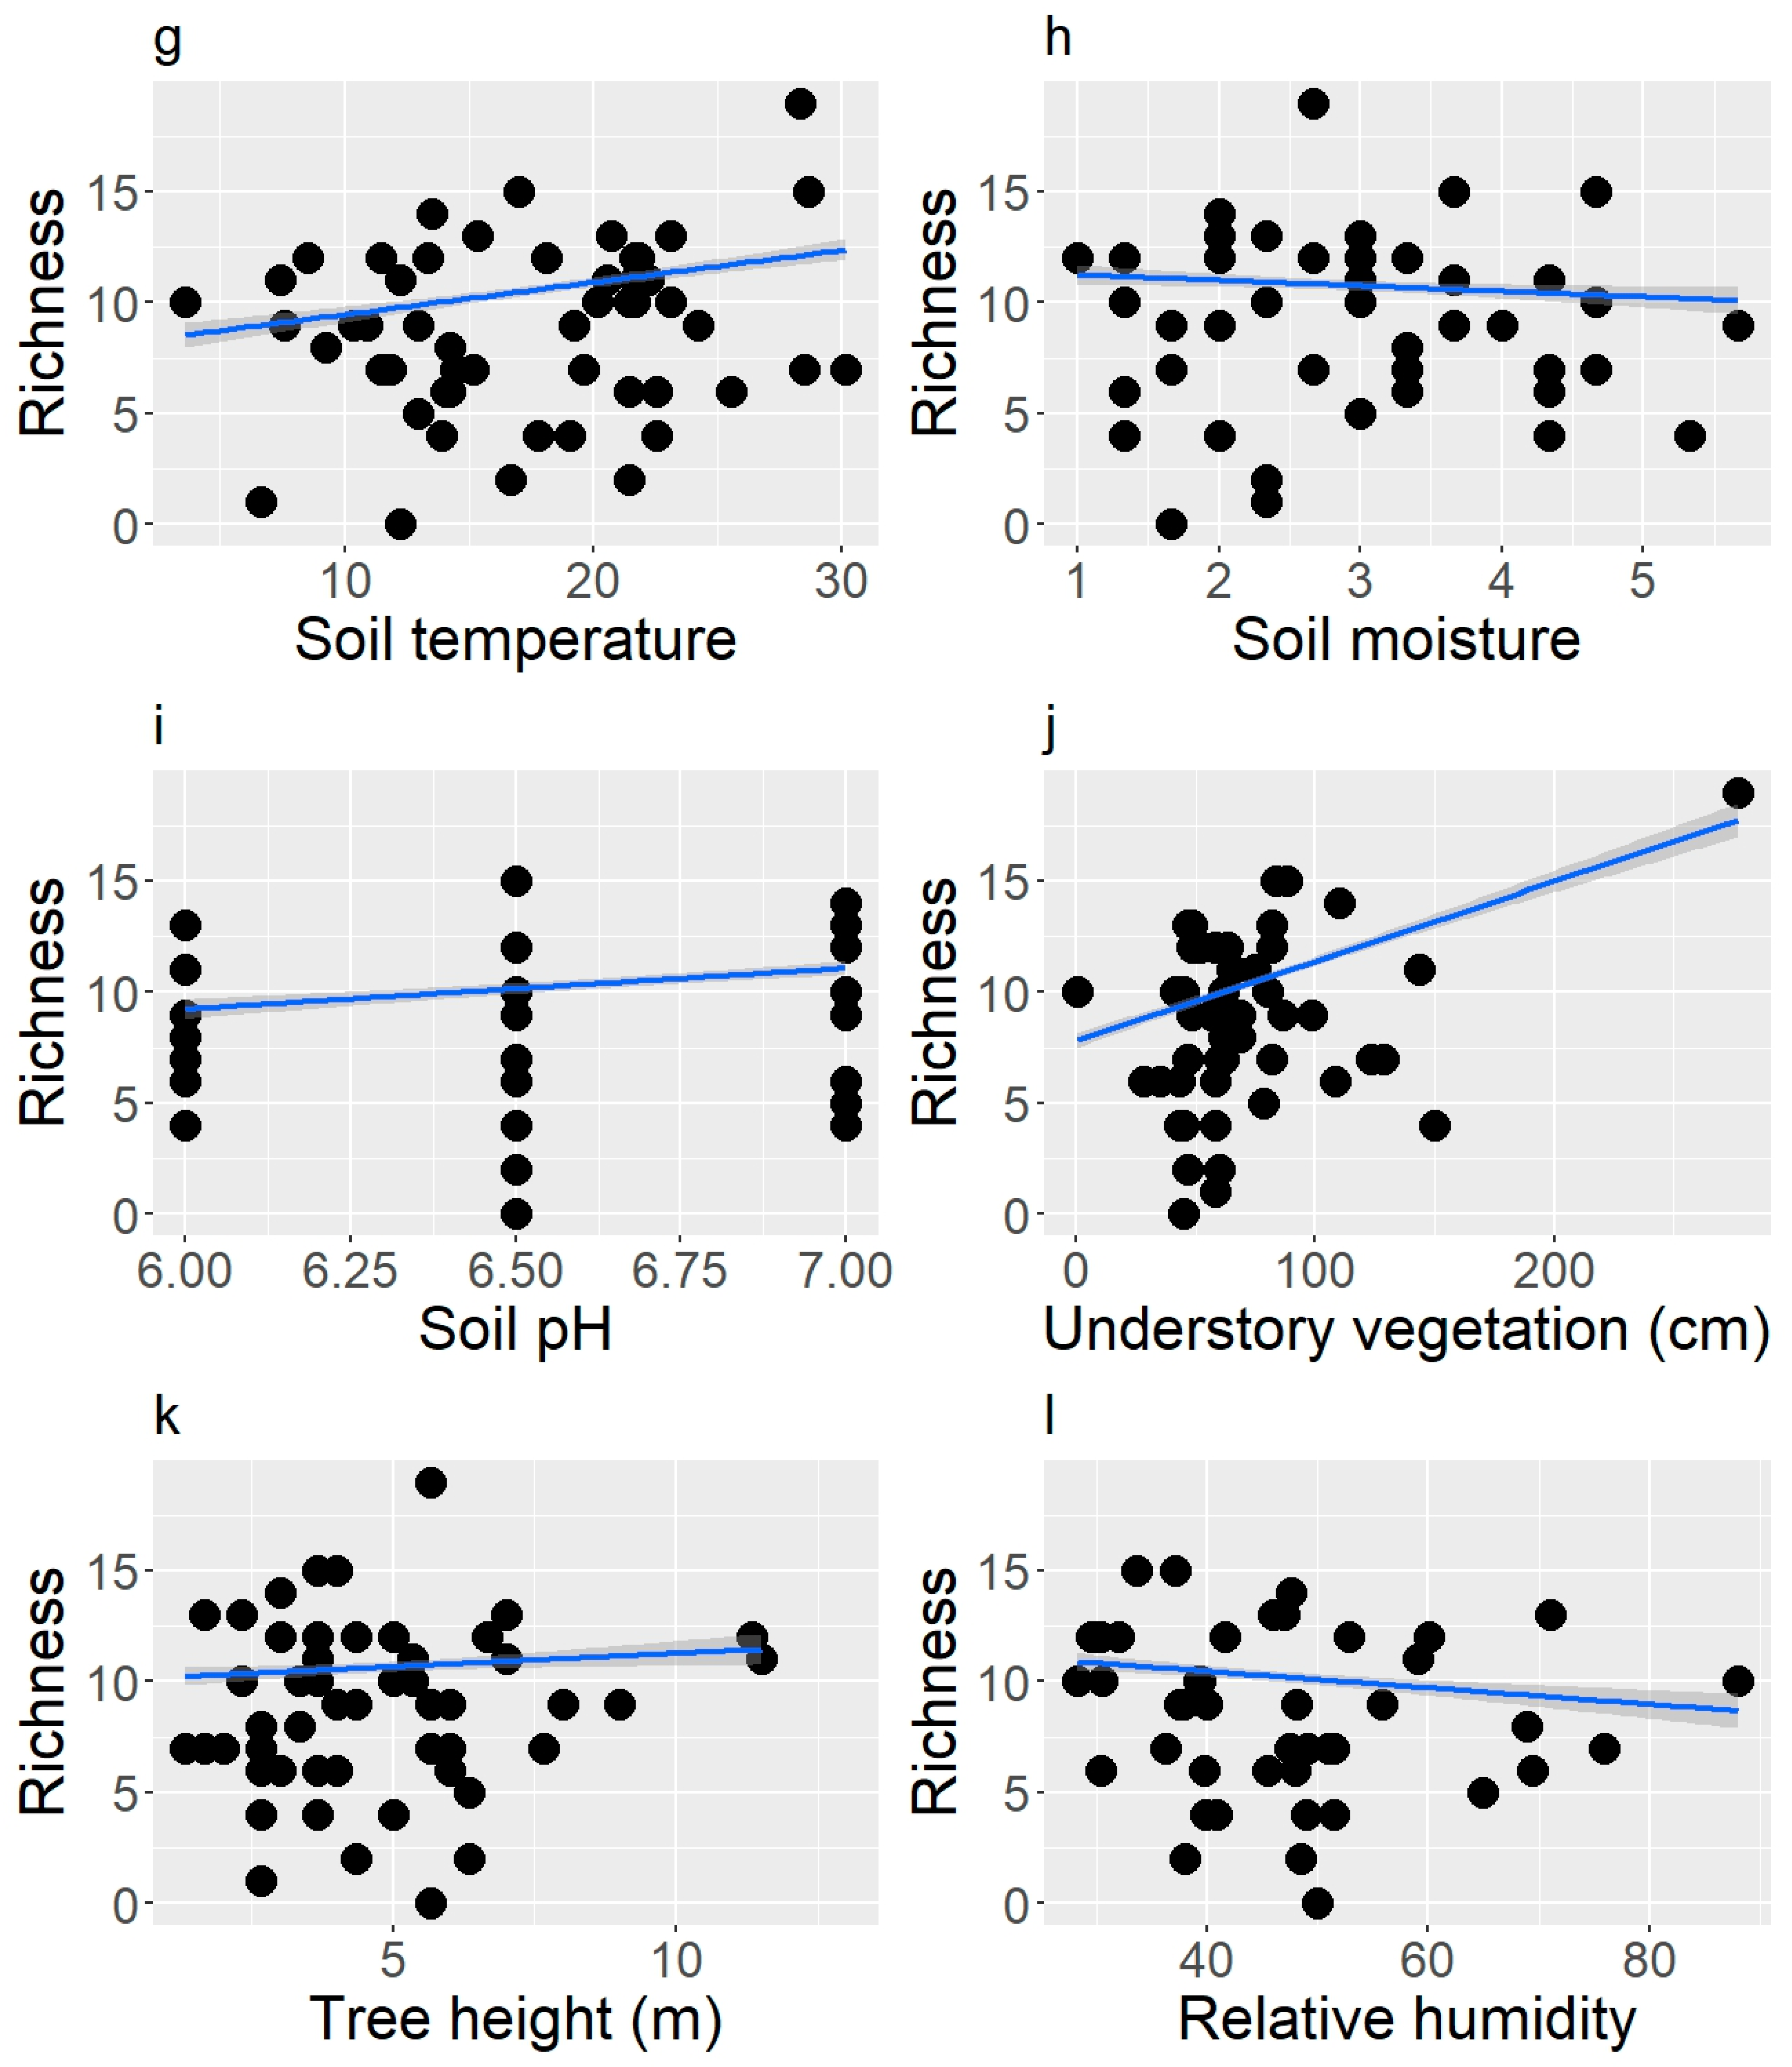
Snail richness in litter samples ranged from 1 to 19 species per site (average = 11). The richness of snails was negatively related to the dominance of White spruce (t = −4.6, p < 0.001; Figure 4a) and Bur oak (t = −4.0, p < 0.001; Figure 4b), and positively related to the dominance of Ponderosa pine (t = 6.9, p < 0.001; Figure 4c). The number of logs (t = −4.2, p < 0.0001; Figure 4d) and moss cover (t = −3.1, p = 0.002; Figure 4e) were negatively related to snail richness. Litter depth (t = 13, p < 0.0001; Figure 4f), soil temperature (t = 8.5, p < 0.001; Figure 4g), soil moisture (t = −2.5, p = 0.013; Figure 4h), soil pH (t = 5.7, p < 0.001; Figure 4i), understory height (t = 17, p < 0.0001; Figure 4j), tree height (t = 2.6, p = 0.011; Figure 4k) and relative humidity (t = −4.1, p < 0.001; Figure 4l) were positively related to the richness of land snails. The percent cover of rock (t = −1.9, p = 0.059; Figure 4d) and CWD (t= −1.8, p = 0.076; Figure 4e) was marginally related to snail richness. Percent canopy cover (t = −1.1, p = 0.25) and litter cover (t = 1.1, p = 0.26) were not related to snail richness.
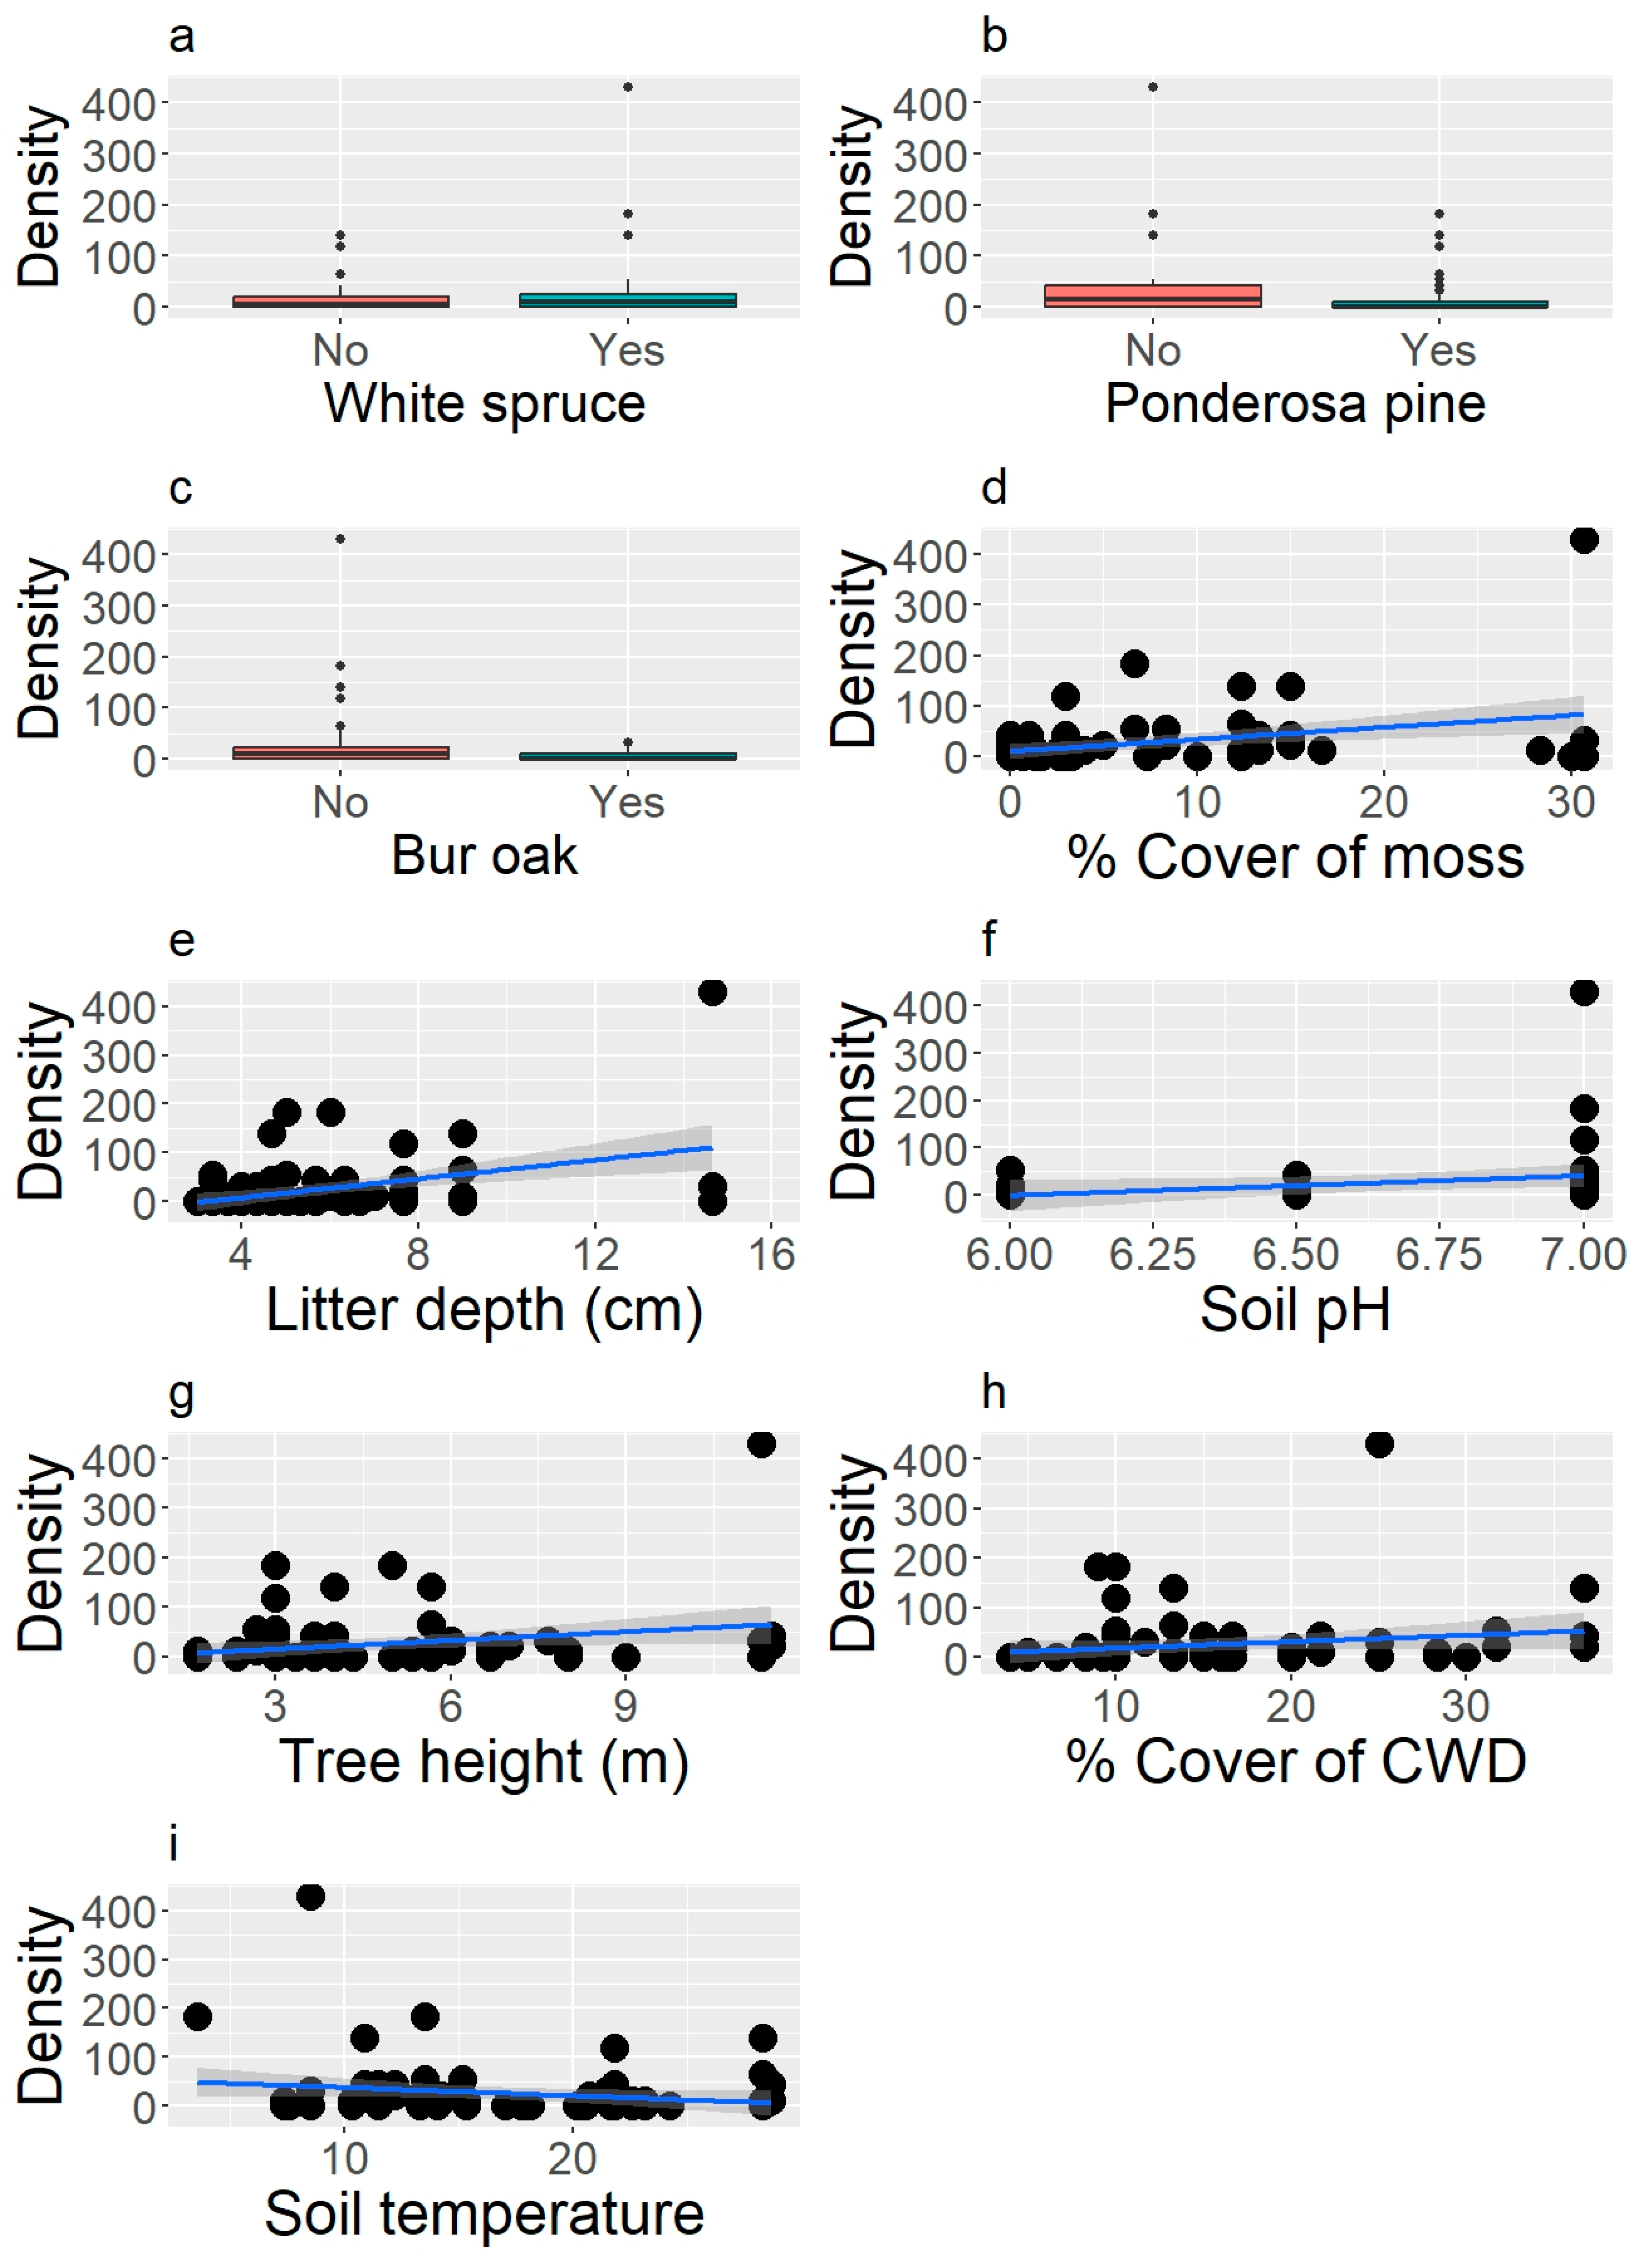
The total density of V. arthuri and V. paradoxa varied between 0 and 431 ind/m2 (average = 25) in the litter samples. Twenty-eight percent of V. arthuri and V. paradoxa were alive in samples (0–100%), 30% of individuals had recently died (0–100%) and 42% of individuals were long dead (0–100%). The density of live V. arthuri and V. paradoxa in the litter was inversely related to White spruce (t = 2.1, p = 0.03; Figure 5a), Ponderosa pine (t = −3.0, p = 0.002: Figure 5b), Bur oak (t = −2.4, p = 0.016; Figure 5c), moss cover (t = 3.7, p = 0.0002; Figure 5d) and litter depth (t = 3.0, p = 0.002; Figure 5e), and positively related to soil pH (t = 3.7, p = 0.0002; Figure 5f), tree height (t = 2.2, p = 0.03; Figure 5g), CWD (t = 2.0, p = 0.05; Figure 5h) and soil temperature (t = −2.1, p = 0.03; Figure 5i). Vertigo arthuri and V. paradoxa were marginally related to the number of logs (t = 1.8, p = 0.07) and were not related to rock cover (t = 0.17, p = 0.87), litter cover (t = −0.77, p = 0.44), soil moisture (t = −0.29, p = 0.77), percent canopy cover (t = −1.2, p = 0.21), understory height (t = 0.58, p = 0.56) or relative humidity (t = 0.87, p = 0.39).
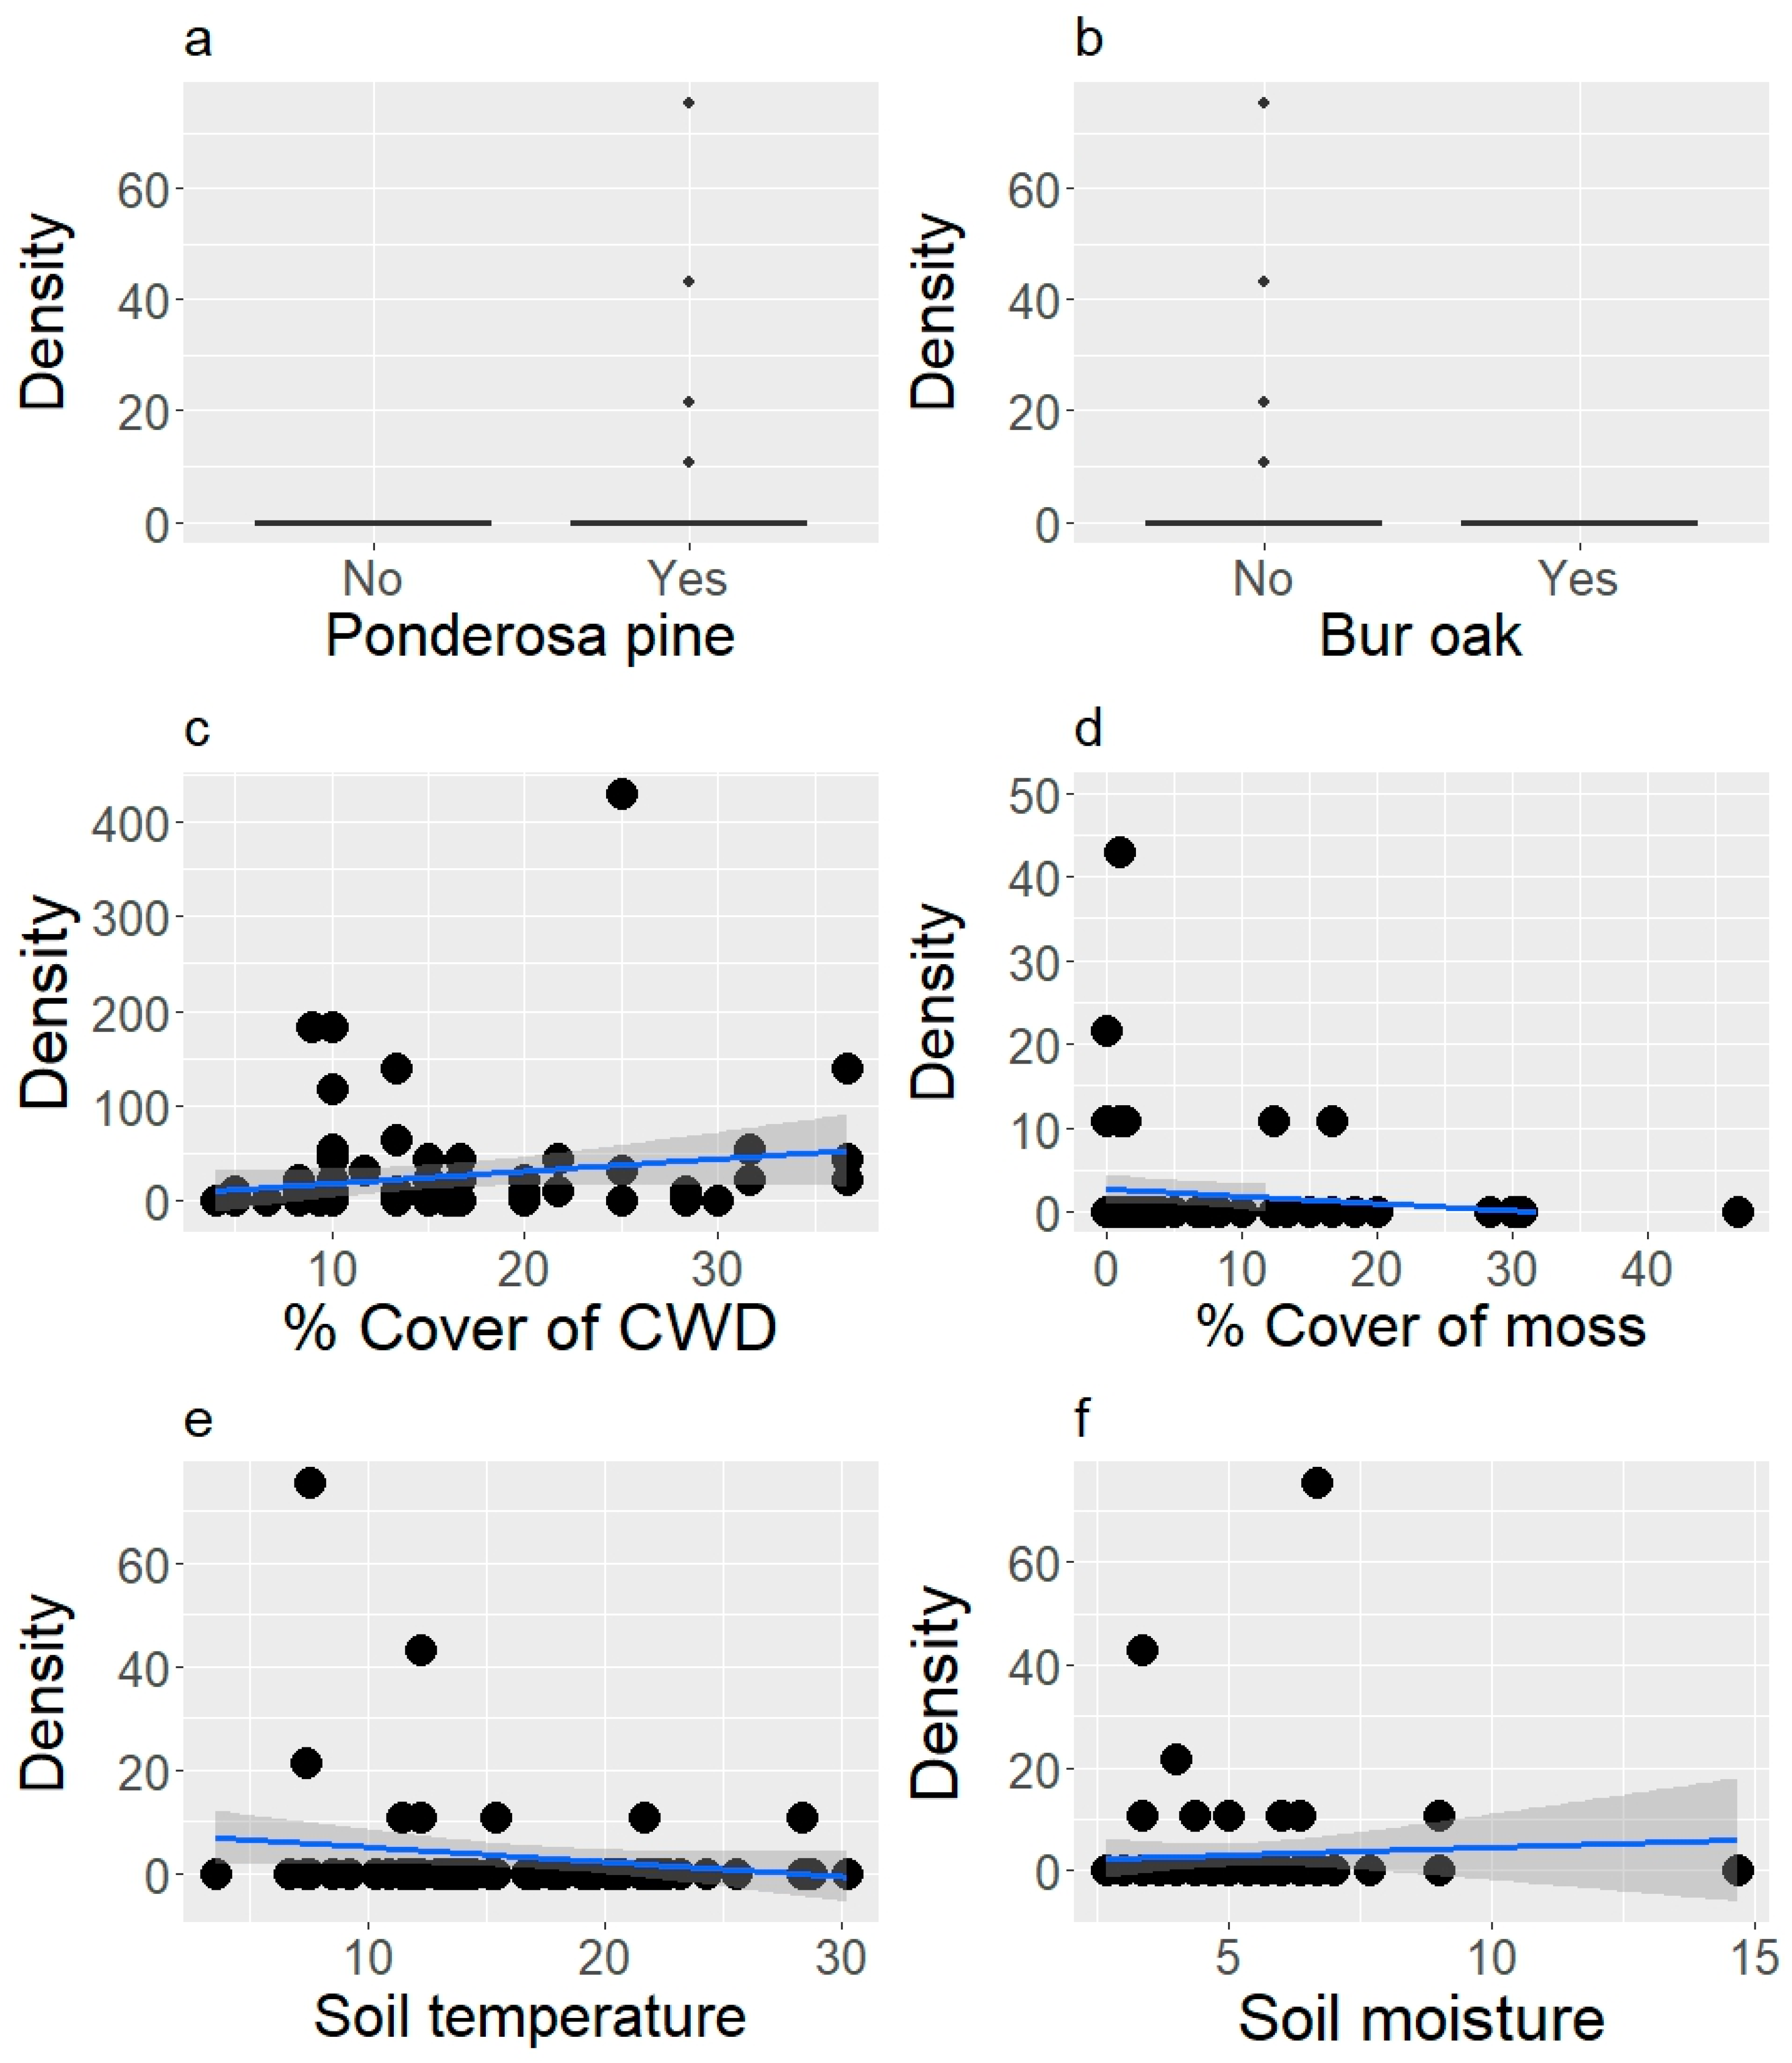
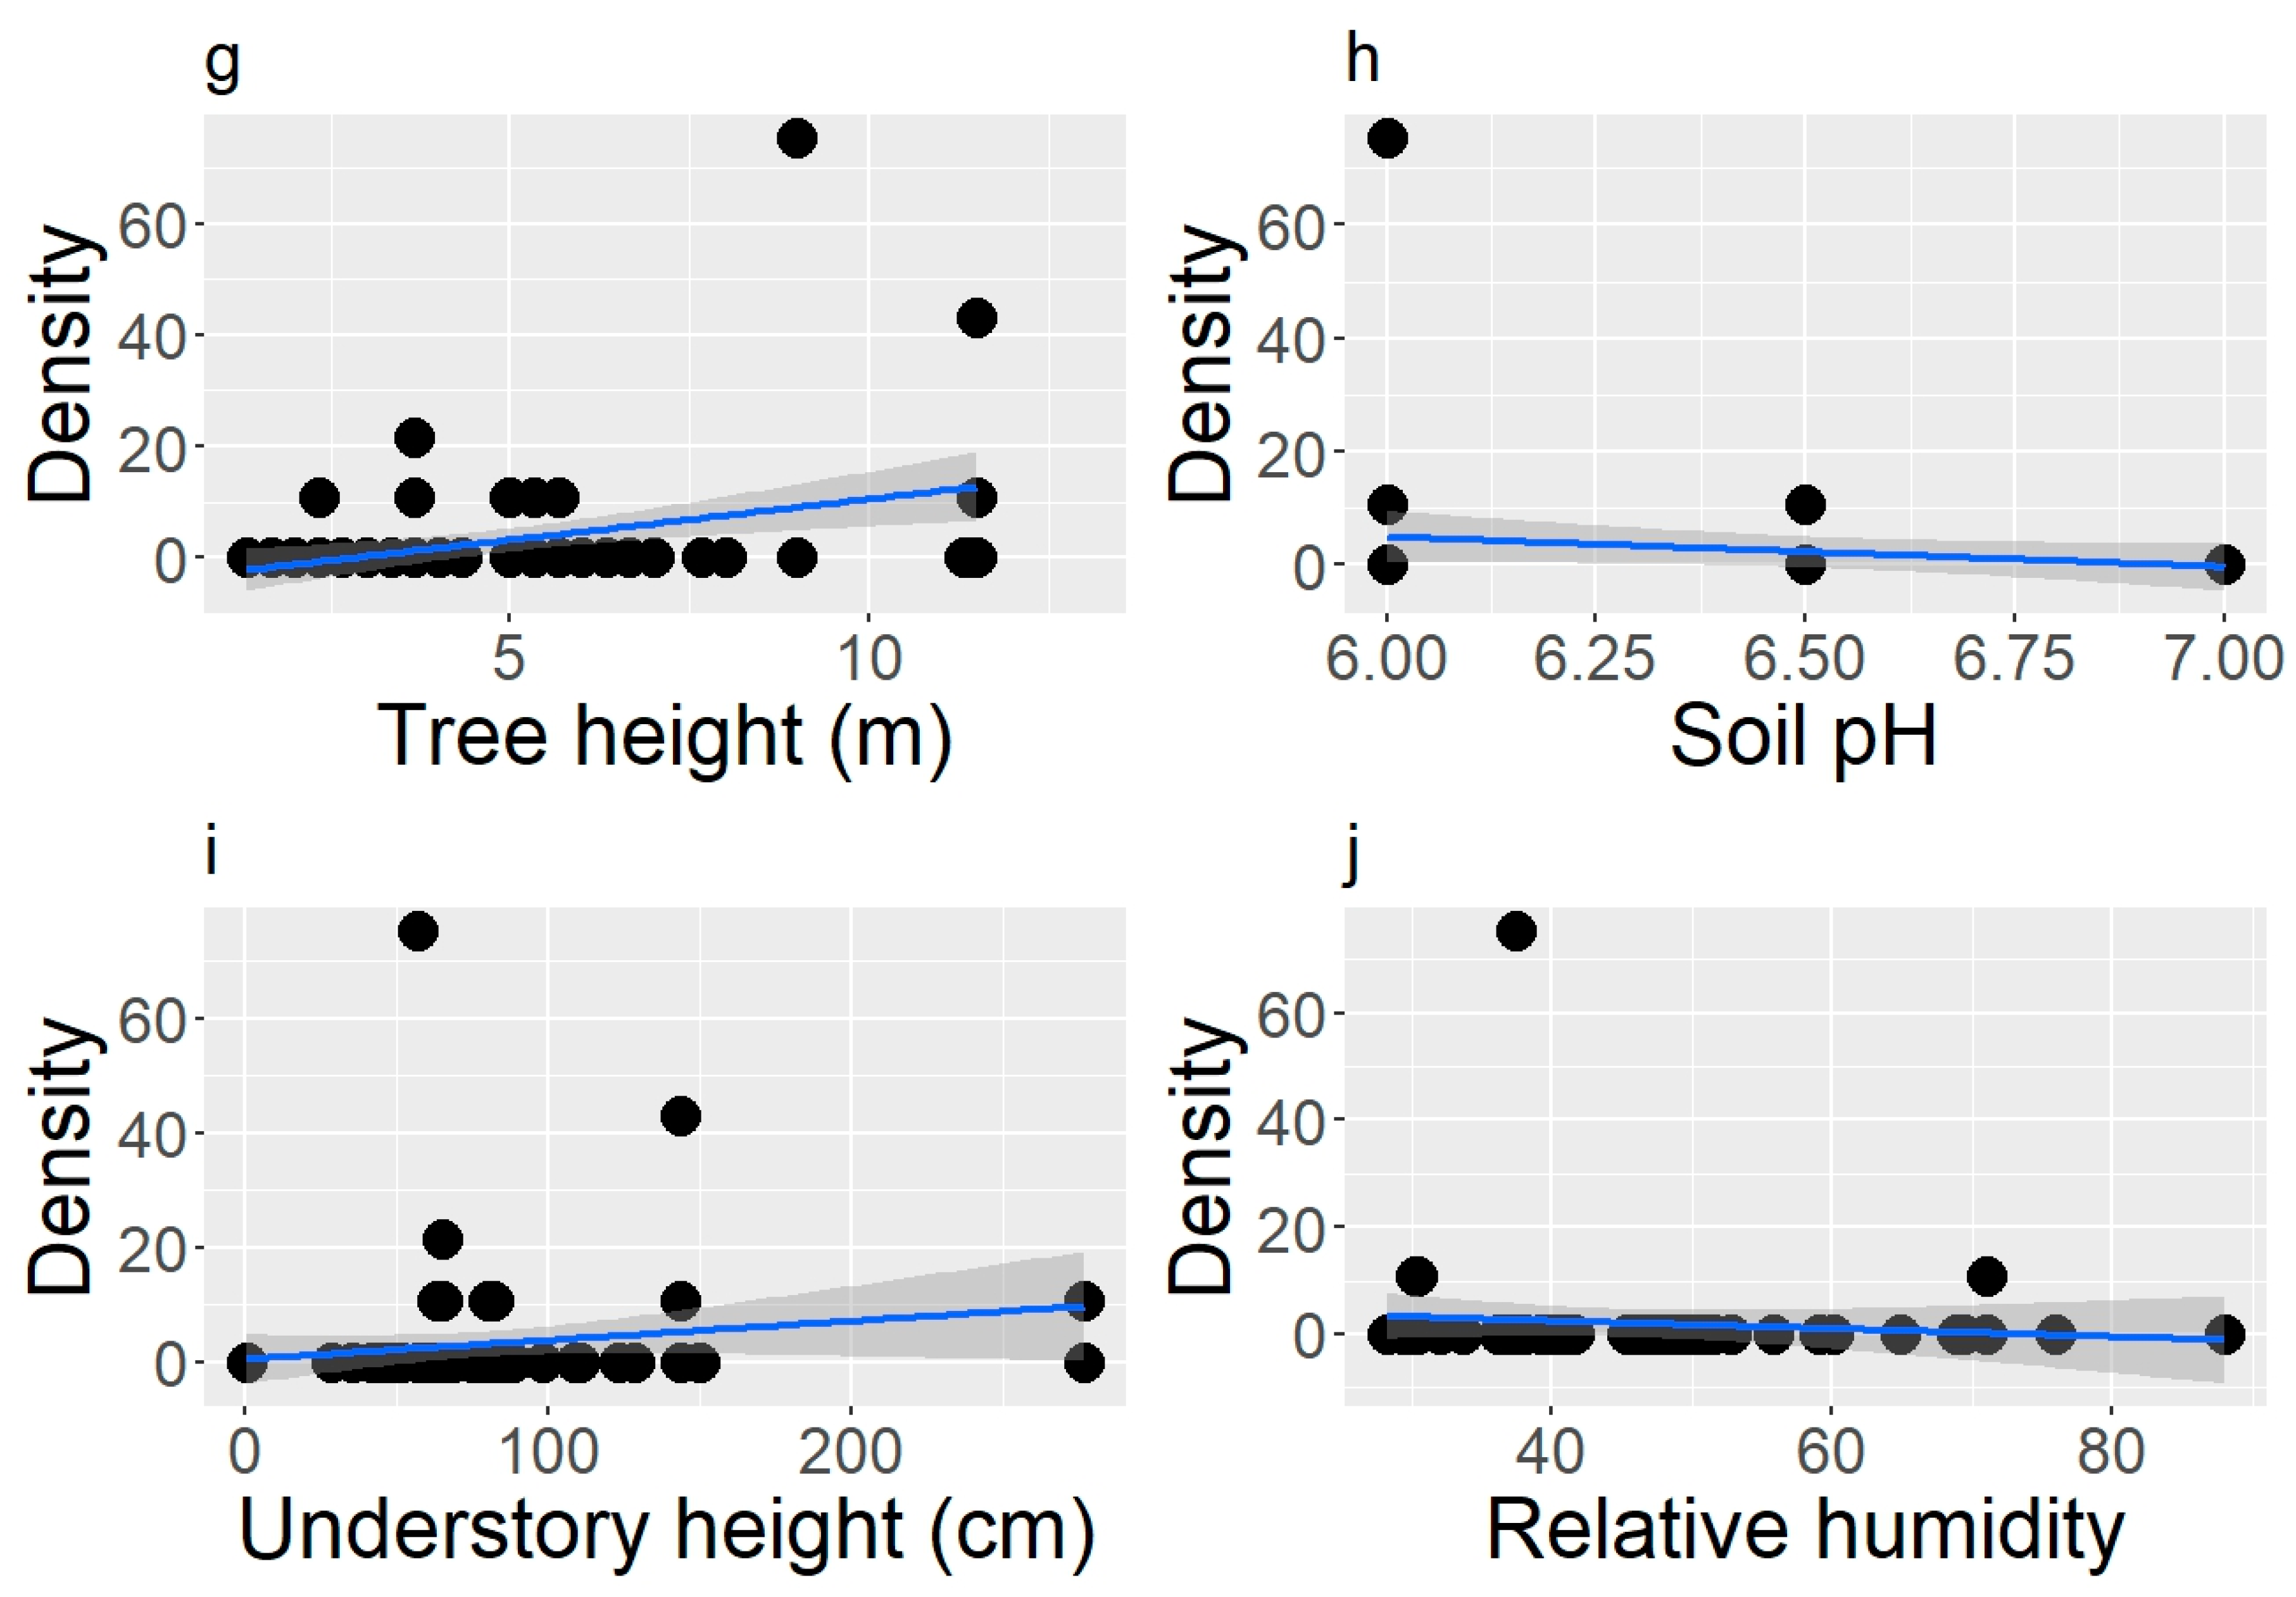
Twelve percent of Succineidae were alive in litter (0–100%), 20% recently perished (0–100%) and 68% were long dead (0–100%). The mean density of Succineidae was 9 ind/m2 (0–75). The density of live Succineidae in litter was related to the dominance of Ponderosa pine (t = 5.3, p < 0.0001; Figure 6a), Bur oak (t = −3.7, p < 0.0001; Figure 6b), CWD (t = −2.0, p = 0.046; Figure 6c), moss cover (t = −2.5, p = 0.013; Figure 6d), soil temperature (t = −3.3, p = 0.001; Figure 6e), soil moisture (t = 3.5 p = 0.0005; Figure 6f), tree height (t = 5.3, p < 0.0001; Figure 6g), soil pH (t = −3.7, p = 0.0025; Figure 6h), understory height (t = 2.2, p = 0.03; Figure 6i) and relative humidity (t = −2.6, p = 0.009; Figure 6j). Succineidae were marginally related to the number of logs (t = −1.8, p = 0.065), and they were not related to sites dominated by White spruce (t = −0.59, p = 0.56), rock cover (t = 1.5, p = 0.13), litter cover (t = −0.44, p = 0.66), litter depth (t = 1.0, p = 0.30) and canopy cover (t = −0.62, p = 0.53).

3.3. Relationship Between Snails in Visual Encounter Surveys and Their Habitat

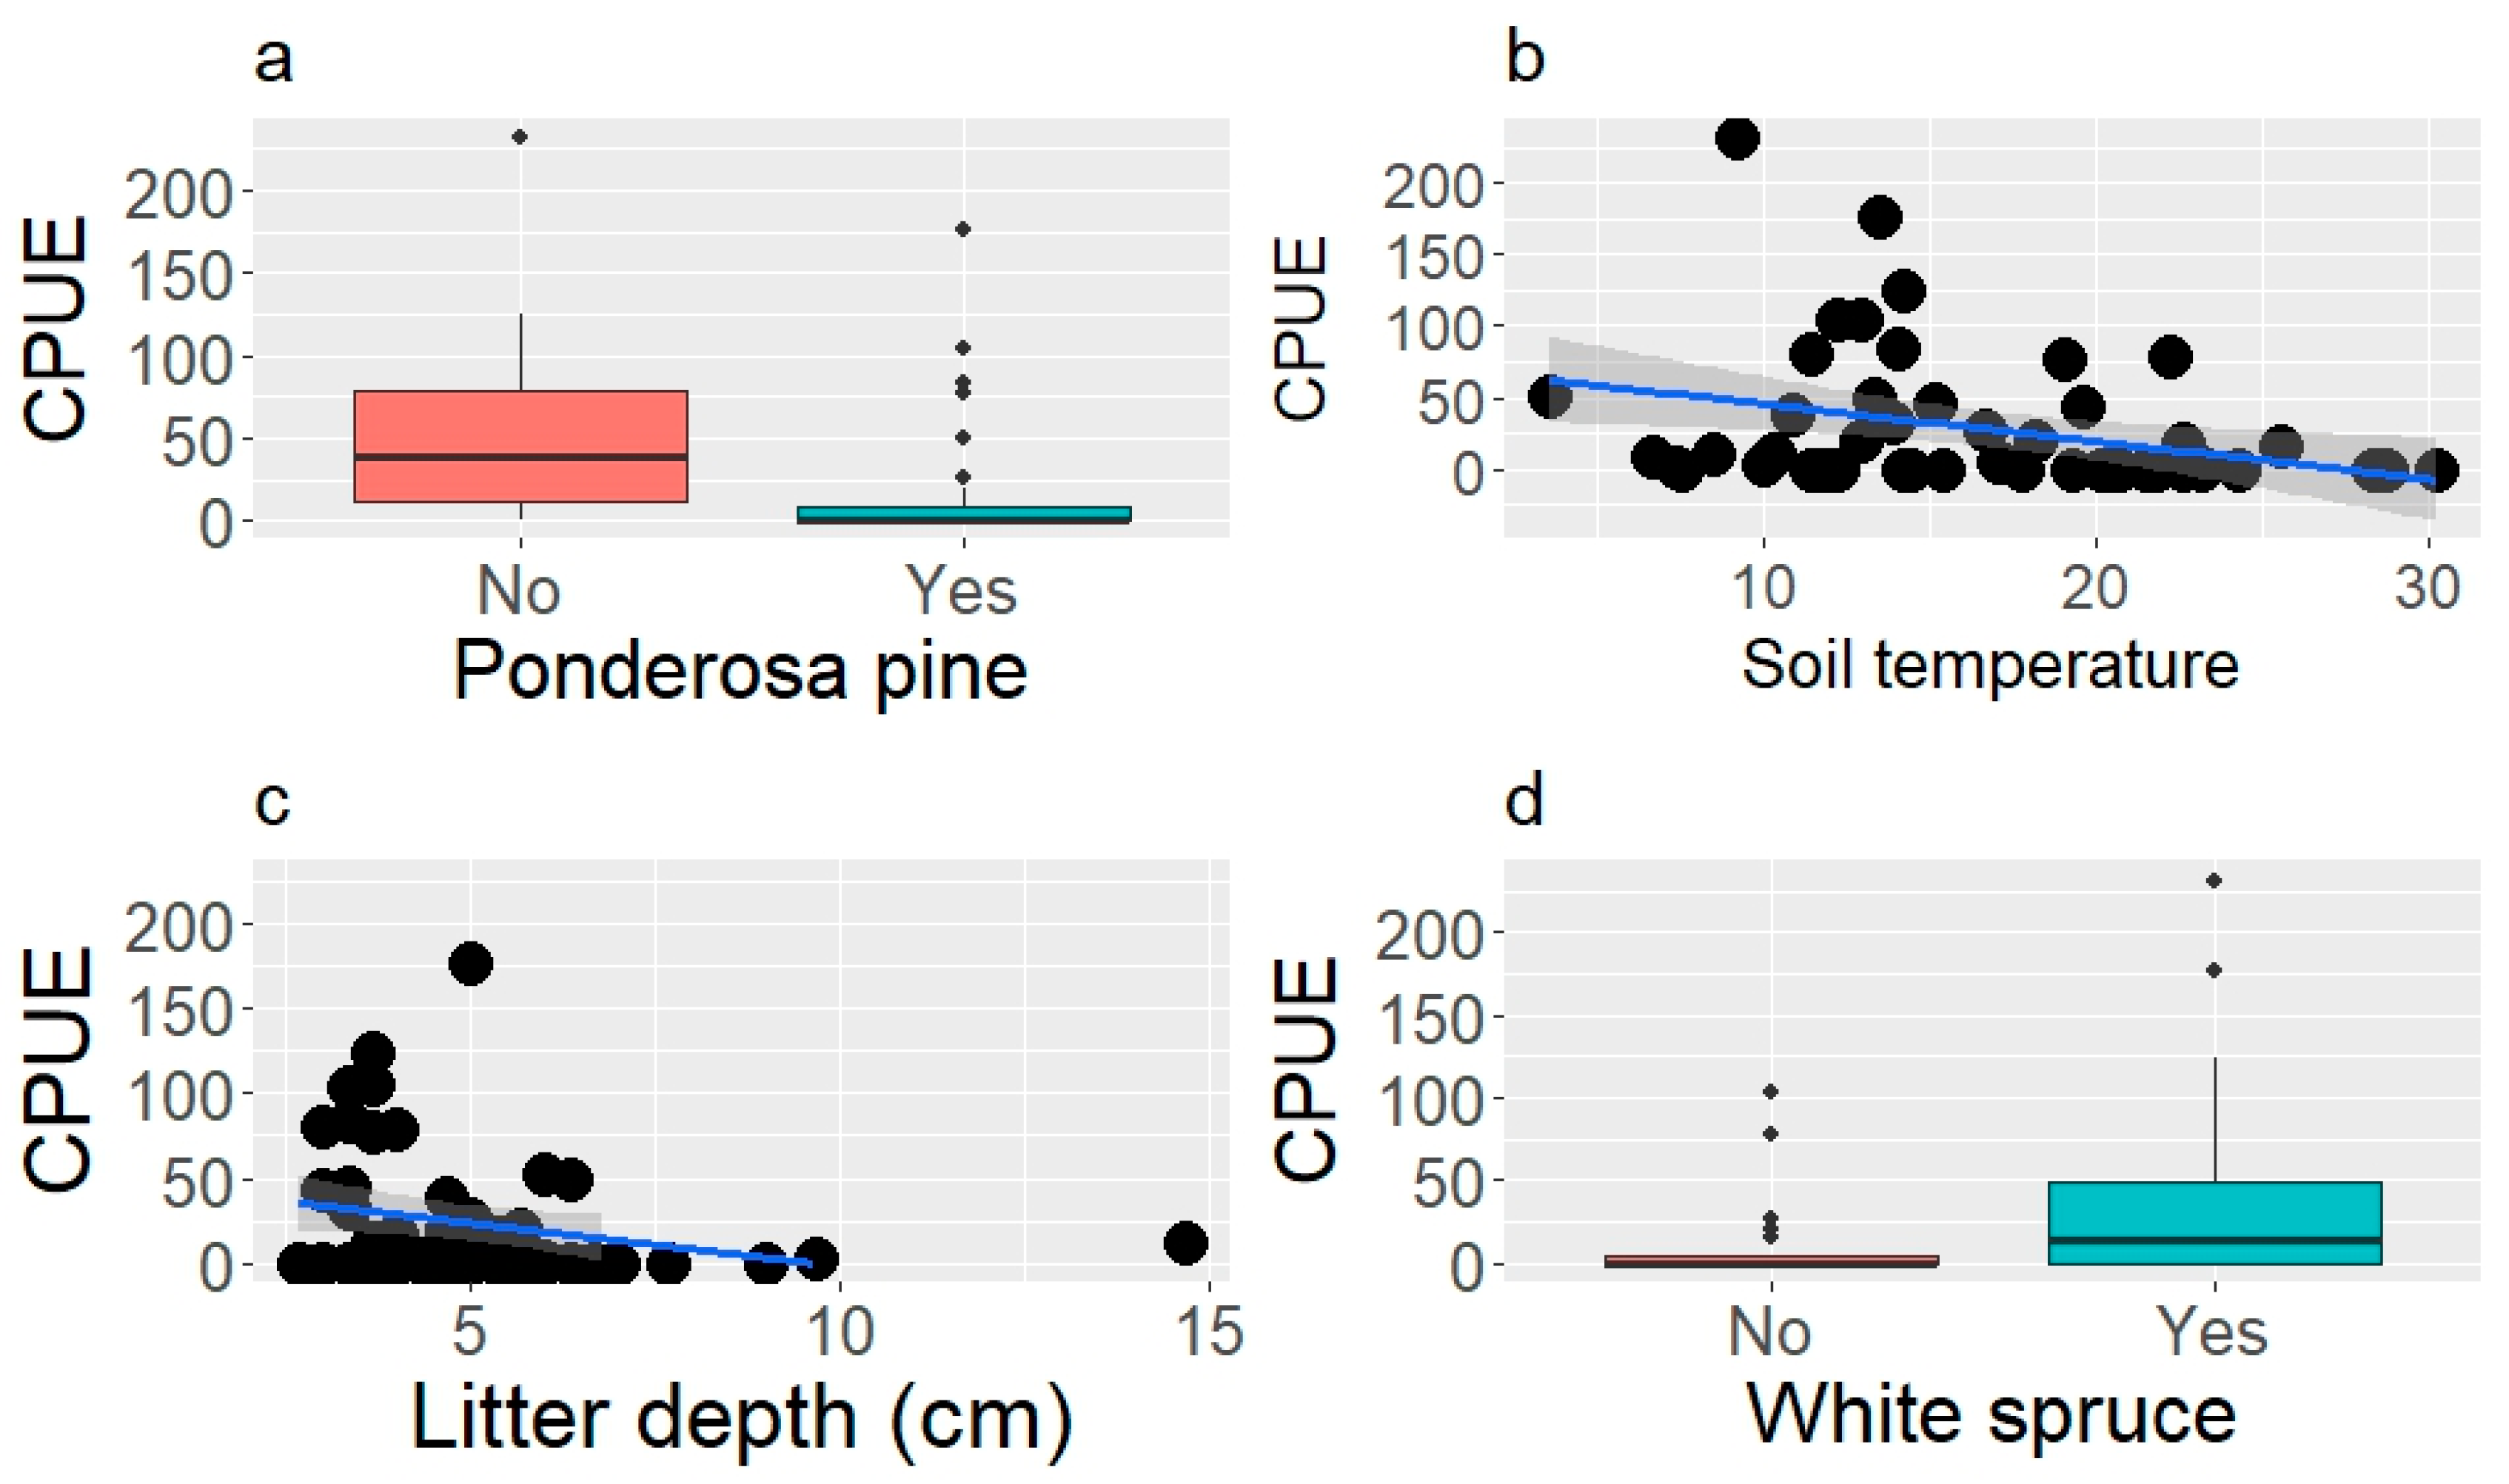
We discovered 23 snail taxa in visual encounter surveys. The most common taxa were Discus whitenyi (23%), Zonitoides arboreus (20%) and Euconulus fulvus (13%), while the least common species (<1%) were Striatura milium, Oxychilus cellarius, Gastrocopta pentodon, Vallonia pulchella and Vertigo arthuri. The CPUE for Oreohelix varied between 0 and 231 ind person−1 h−1 (average = 27) during the visual encounter surveys. The abundance of Oreohelix was inversely related to Ponderosa pine (t = −2.6, p = 0.009; Figure 7a), soil temperature (t = −4.1, p < 0.0001; Figure 7b) and litter depth (t = −2.9, p = 0.036; Figure 7c), and positively related to White spruce (t = 2.7, p = 0.006; Figure 7d). Oreohelix was not related to Bur oak (t = −0.46, p = 0.64), rock cover (t = 0.19, p = 0.85), litter cover (t = −0.35, p = 0.73), CWD (t = 0.55, p = 0.58), moss cover (t = 1.2, p = 0.30), number of logs (t = −1.3, p = 0.19), soil moisture (t = 0.54, p = 0.59), soil pH (t = 0.27, p = 0.79), canopy cover (t = 1.4, p = 0.16), tree height (t = −1.4, p = 0.16), understory height (t = 0.27, p = 0.79) and relative humidity (t = 1.4, p = 0.15).
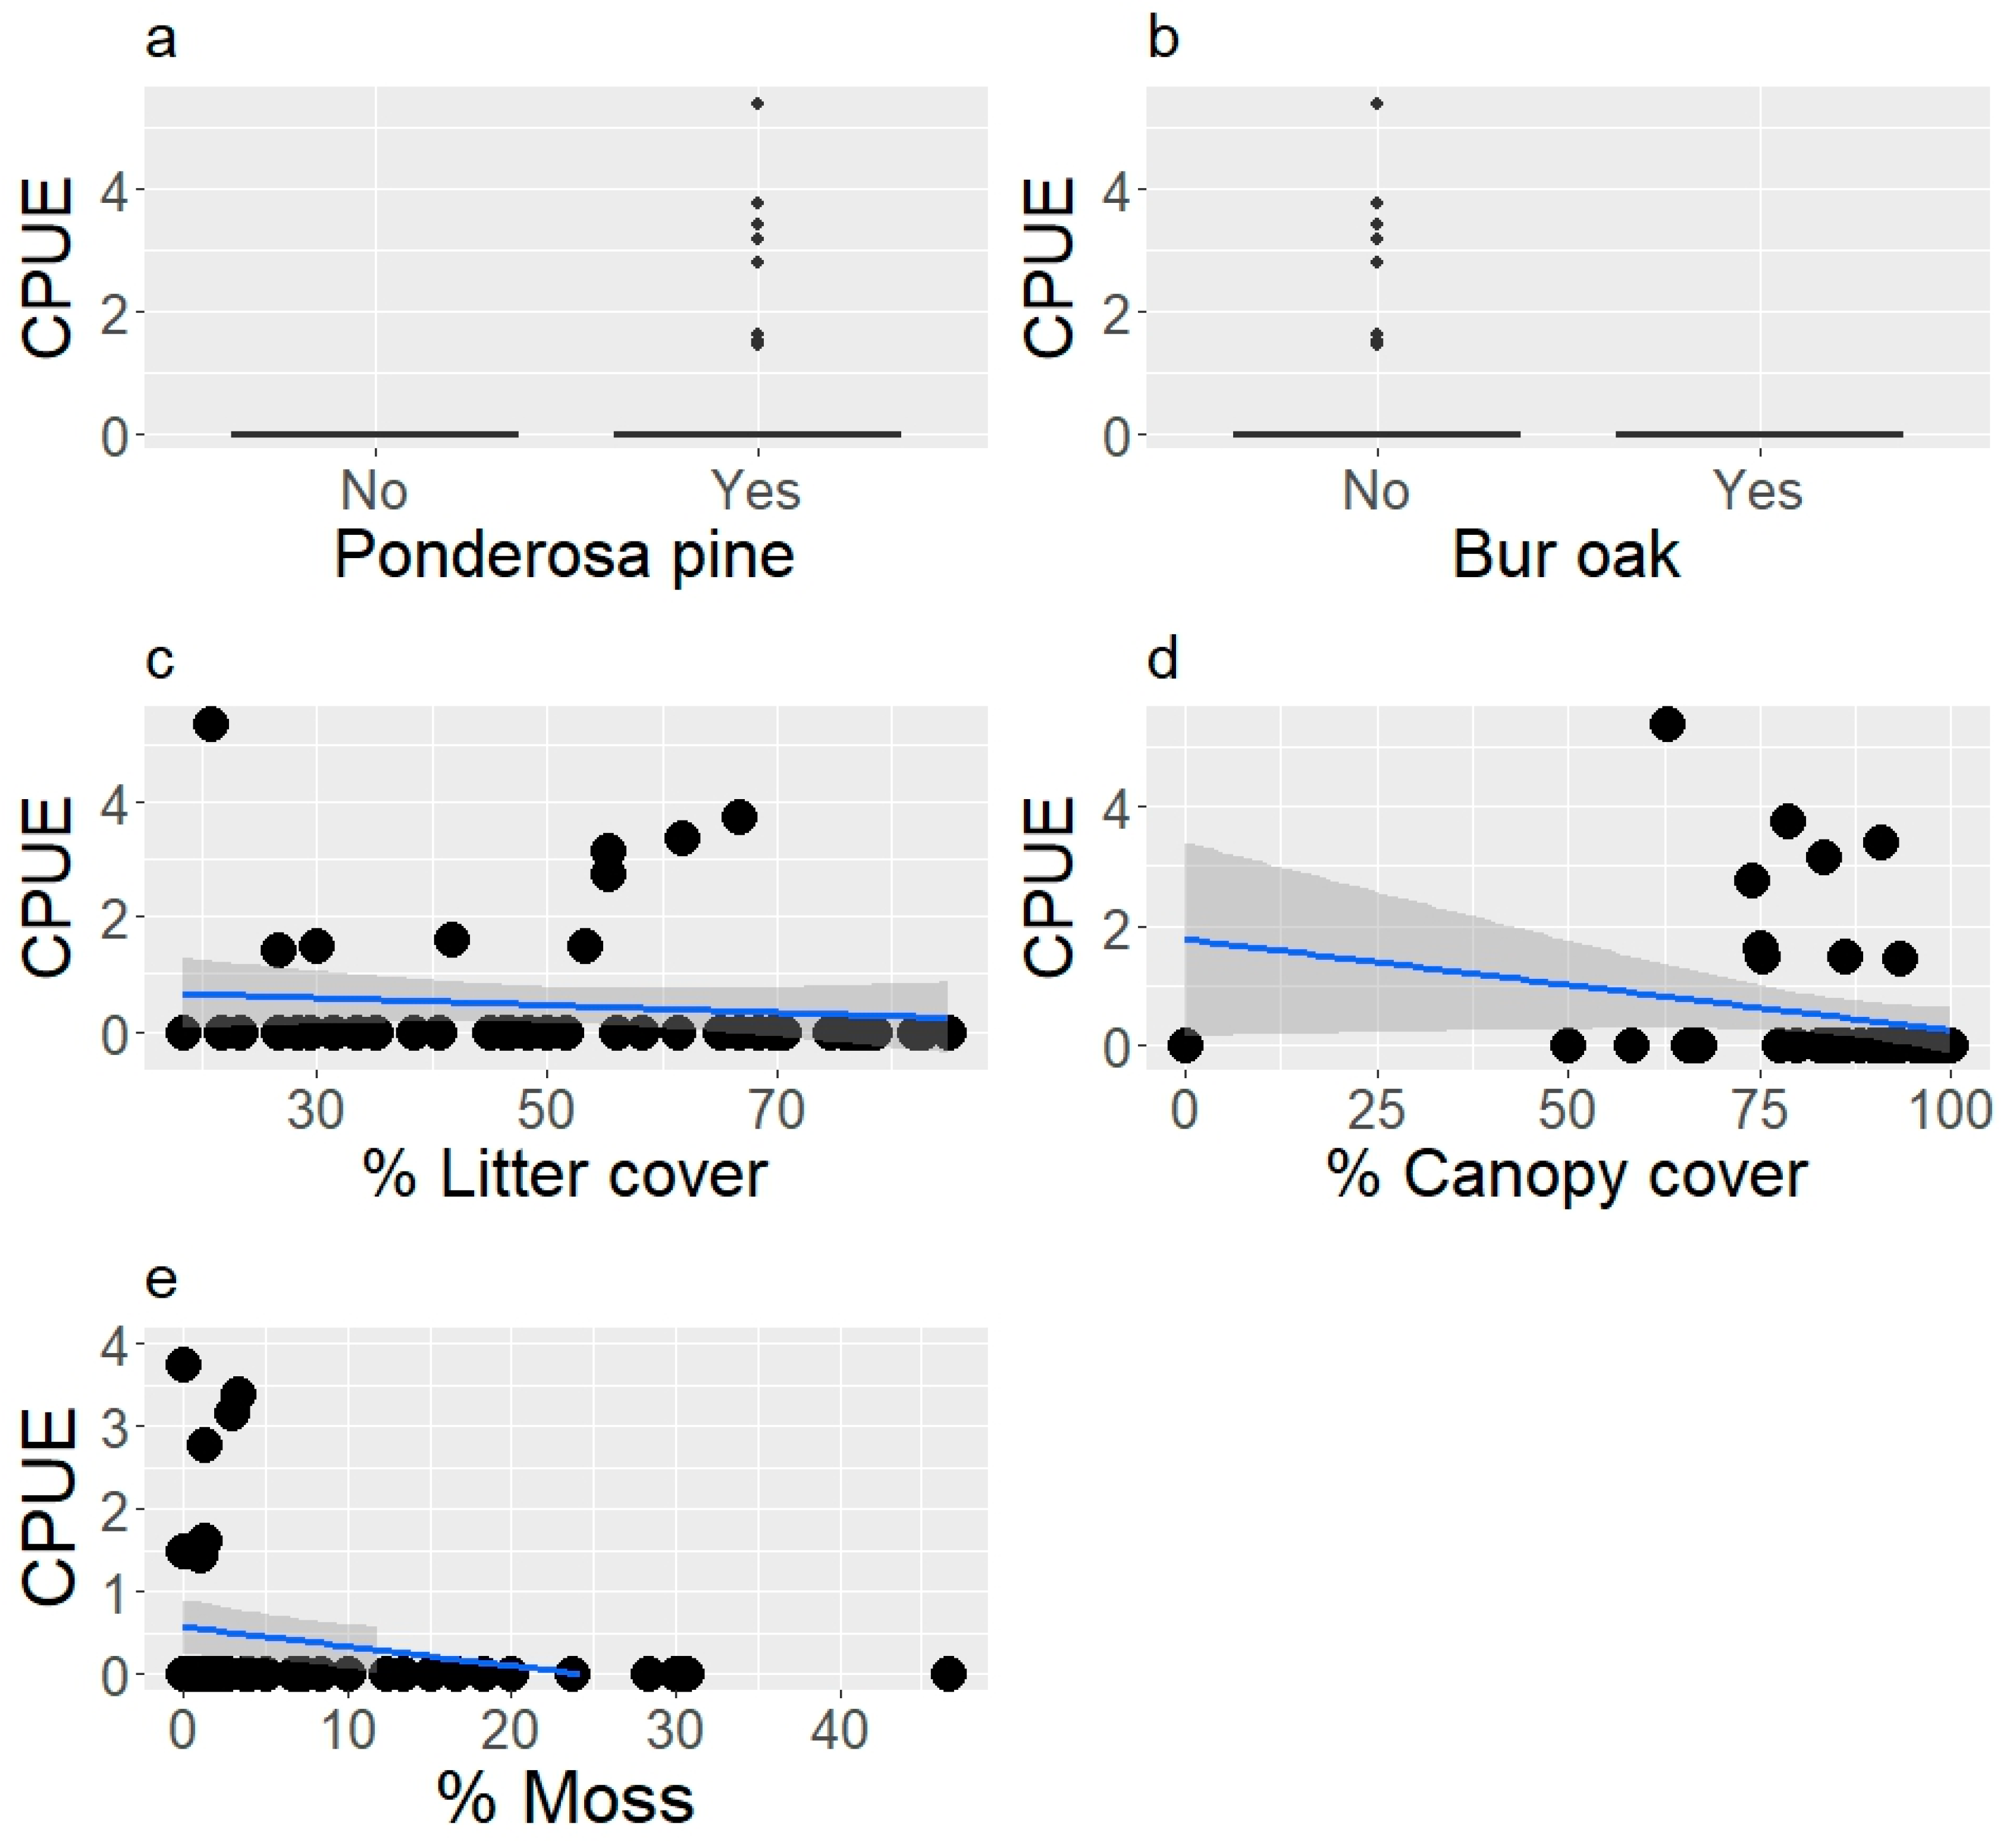
The CPUE of Succineidae varied between 0 and 5 ind person−1 h−1 during visual encounter surveys. The abundance of Succineidae was related to Ponderosa pine (t = 3.3, p = 0.0009; Figure 8a), Bur oak (t = −2.2, p = 0.03; Figure 8b), litter cover (t = −1.2, p = 0.23; Figure 8c), canopy cover (t = −2.7, p = 0.0071; Figure 8d) and moss cover (t = −3.3, p = 0.001; Figure 8e); however, these relationships are tenuous due to the small number of detections. Succineidae were not related to White spruce (t = −0.57, p = 0.57), rock cover (t = 0.14, p = 0.89), CWD (t = −0.24, p = 0.81), number of logs (t = 1.5, p = 0.13), litter depth (t = −0.37, p = 0.71), soil moisture (t = 0.11, p = 0.91), soil pH (t = 0.32, p = 0.75), soil temperature (t = −0.24, p = 0.81), tree height (t = −1.9, p = 0.60), understory height (t = −0.084, p = 0.93) and relative humidity (t = 1.5, p = 0.13).

3.4. Habitat Selection

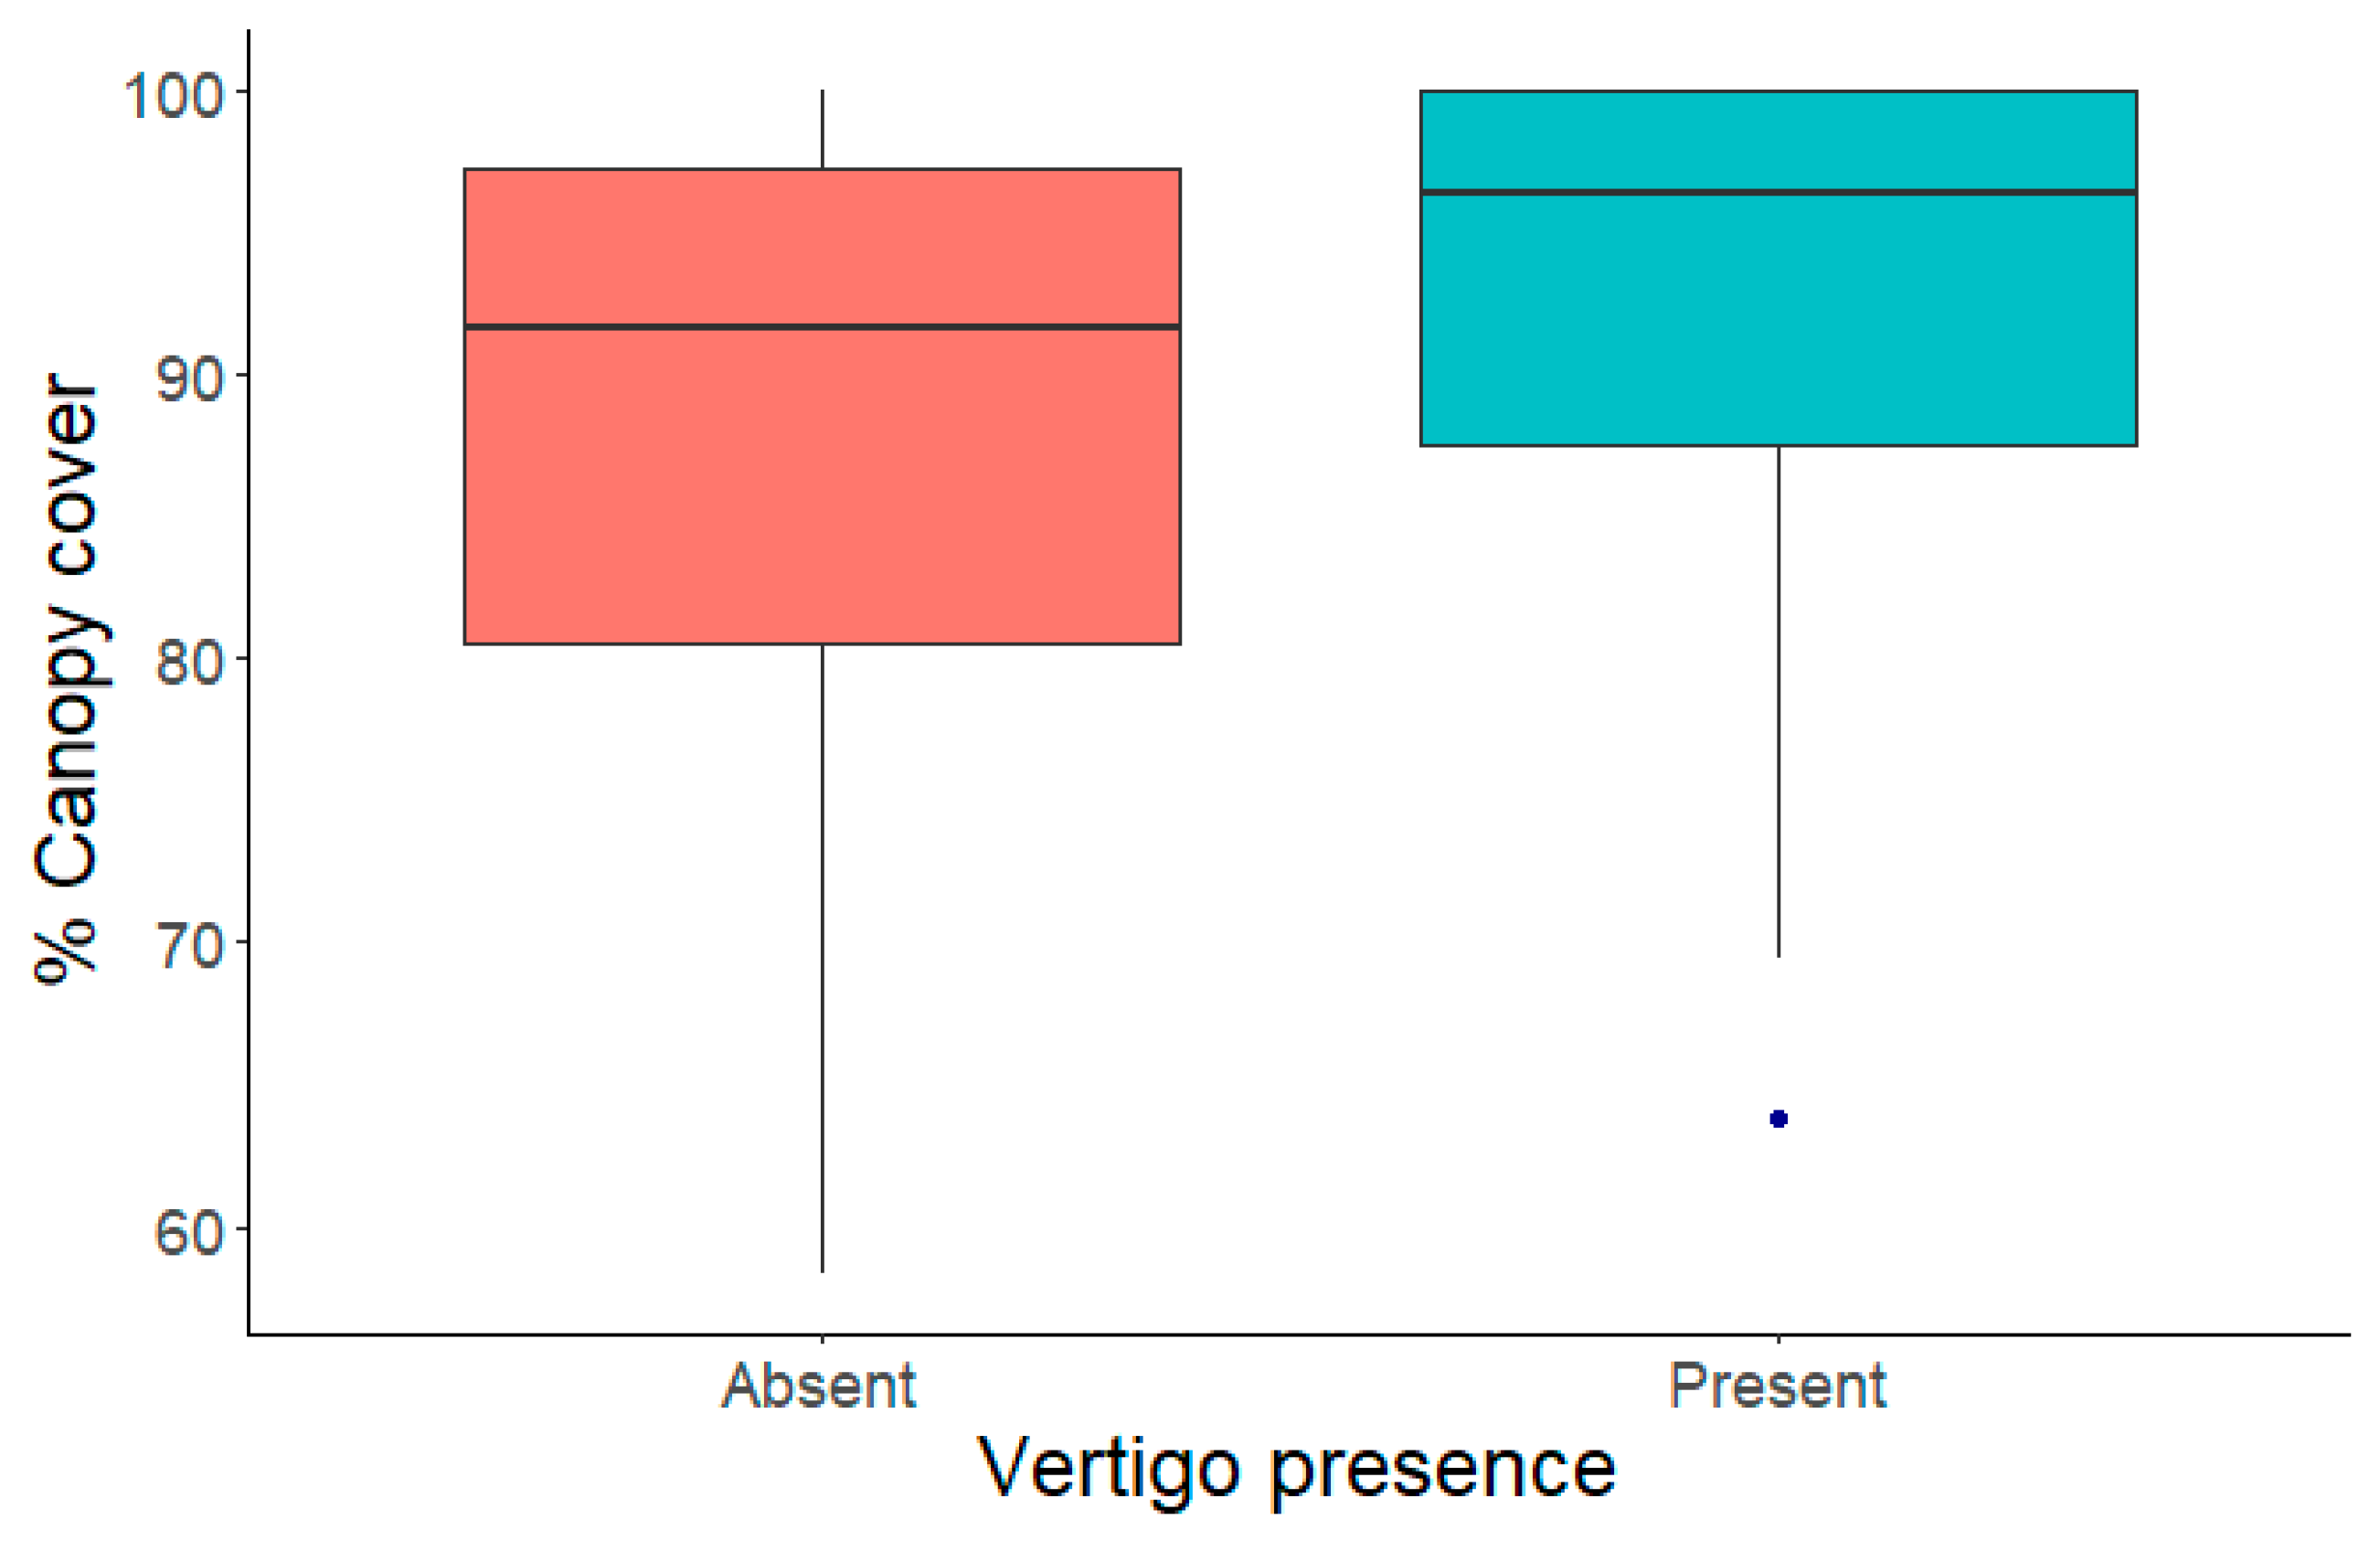
Land snails selected a few habitat characteristics overall using a presence–absence approach. Oreohelix did not select any macrohabitat variables (n = 17 sites with live individuals) or any microhabitat variables (n = 21 sites with live snails; Table 2). Discus shimekii did not select any habitat at the macro- (n = 7 sites with live and dead snails) or microhabitat scale (n = 10 sites with live and dead snails). Succineids did not select any habitat characteristics at the macro- (n = 8 sites with live snails) or microhabitat scale (n = 8 sites with live snails). Vertigo did not select any habitat characteristics at the macrohabitat scale (n = 18 sites with live individuals), but Vertigo preferred locations with higher canopy cover (z = 2.06, p = 0.03, odds ratio = 2.58, CIs = 0.13, 1.98) compared to available locations (Figure 9) at the microhabitat scale (n = 20 sites with live snails). For every 5% increase in canopy cover, the odds that Vertigo selected that location increased by a factor of 2.5.

3.5. Long-Term Trends

We identified Oreohelix at 28 sites in 2024 using visual encounters and litter samples. These snails were detected in litter samples at 25 sites (17 sites with live individuals; Table A1) and 30 sites during visual encounter surveys (live individuals at 29 sites). We did not detect live Oreohelix at 3 sites where they had been found in the 1990s and at 3 sites where they were found live in 2010. We found 1 new Oreohelix site using litter samples and 1 new site during visual encounter surveys.
We identified Discus shimekii at 8 sites (live and dead) and observed live individuals at 3 sites. We detected D. shimekii in litter samples at 7 sites, but only one site had live individuals (Table A2). We observed Discus shimekii at 4 sites during visual encounter surveys (live individuals or shells) and found live individuals at 3 sites. We did not observe live individuals at 4 sites where they had been previously observed. Six of these sites had live D. shimekii in the 1990s and 2010, but we detected live individuals at only 3 sites in 2024. We discovered 1 new site with dead D. shimekii in litter samples.
We identified V. arthuri or V. paradoxa at 38 sites, and 26 sites had live individuals (Table A3). Litter samples detected V. arthuri or V. paradoxa at all sites except 2, where we found them during visual encounter surveys. No live V. arthuri or V. paradoxa were detected at 3 sites where live individuals had been found in the past. We found live individuals at 3 sites where only shells had been found in the past. Additionally, we found these snails at 20 new sites due to collecting litter samples.
We identified Succineidae at 15 sites, with live individuals at 13 of these sites. Litter samples detected Succineidae at 15 sites, but only 9 sites had live individuals (Table A4). We observed Succineidae at 9 sites during visual encounter surveys (live individuals or shells) and found live individuals at 9 sites. We did not detect live individuals at 1 site where they had previously been found, and we found live individuals at 2 sites where previously only shells had been found. We discovered Succineidae at 8 new sites where they had not previously been found, based on a combination of litter and visual encounter surveys.

4. Discussion

The original land snail surveys in the Black Hills identified 7 species that were of conservation concern [17,21]. The number of species has reduced 34 years later due to modern genetic techniques [19], but large knowledge gaps still exist for Oreohelix and Succineidae, whose taxonomies are unknown and still debated. Based on our surveys in 2024, Discus shimekii was detected at the fewest sites, and we found live individuals at a subset of those locations. Discus shimekii was found at 7 sites surveyed in 1991–1992 (of those we surveyed in 2024), and we detected them at 15% of our sites. Succinidae were also found at a small number of sites, but we were unable to differentiate among the three species due to the lack of taxonomic revision and morphology. Vertigo paradoxa and V. arthuri were found alive at nearly half of the sites we sampled, including 20 new sites, demonstrating that litter samples are better at detecting minute species. Similarly, we detected live Oreohelix at >50% of the sites we surveyed. Future taxonomic work will help resolve the number of species inhabiting the Black Hills and inform population management.
Past samples noted the presence of live, recently dead or long-dead snails at sites; however, presence and absence data are not very sensitive for assessing long-term trends [35]. We attempted to quantify the number of snails at sites so that more information would be available for future surveys for comparison. Quantifying the abundance or density of invertebrates is not easy, and estimates typically have a lot of variability; however, estimates with means and variance provide far more data to assess changes over time [36]. Presence and absence data only alert managers when a species disappears at a site, while abundance or density allows them to see a decline or increase in numbers over time. Additionally, estimates of abundance or density will allow managers to measure how management actions may alter populations.
Invertebrates are frequently sampled qualitatively and quantitatively. For example, butterflies are sampled along transects [37,38,39,40], and their numbers are assessed by distance (ind/km) or time walked (ind/h). Fish abundance can be measured using a CPUE estimate (ind person−1 h−1) because they have low abundance, making other methods ineffective [41,42,43]. We modeled our visual encounter surveys after mussel and butterfly surveys we conducted in rivers by recording the number of snails observed, the number of people doing surveys and the duration of the surveys. This measure allowed an estimate of abundance for larger species, where quadrat sampling does not capture their patchy distribution. These surveys are easily repeated for future comparisons and allow comparisons of abundance over time. Visual encounter surveys are especially effective for Oreohelix because they are larger, more conspicuous snails. Potentially, only one species of Oreohelix lives in the Black Hills, making visual encounter surveys especially effective.
Litter samples from known quadrat areas allowed us to measure snail density. Quadrat sampling is very common for invertebrates, including aquatic invertebrates within Surber samples [44,45,46] and terrestrial insects within a quadrat [47,48,49]. Variance can be calculated when at least 3 quadrat samples are collected within a site, which increases the power of detecting trends over time [50]. Litter samples worked very well to detect the Vertigo species. These minute snails are not reliably found during visual encounter surveys due to their small size. Litter sampling does a much better job of detecting Vertigo and other small species because we separated the litter by size class using sieves in the laboratory. Focusing on a single size class of snails when sorting debris increased the detection of small species. The controlled environment in the laboratory makes it easier to see such minute snails and does not depend on optimal field conditions such as light, wind or mosquitoes. Comparisons among sites were more difficult due to our unbalanced sampling design (i.e., 3 litter samples at known Vertigo sites and 1 litter sample at all other sites); however, we were surprised to observe Vertigo target species at 20 new sites despite only collecting one litter sample. Additionally, litter samples also worked well for Discus shimekii and Succineidae, where we detected their presence at more sites compared to visual encounter surveys. We urge others to collect litter samples for studying minute to medium-sized species as we gained much more insight from these samples. Litter samples are more costly due to increased processing time (i.e., sorting litter), but they yielded far more information than visual surveys. We suggest collecting the same number of litter samples at all sites when funding allows.
Habitat relationships suggest that target snails are associated with moister habitats. Vertigo arthuri, V. paradoxa and Discus selected sites that had higher moss cover, which is indicative of wetter habitats. This agrees with an analysis showing that soil moisture drove niche diversification in Vertigo [51]. Oreohelix, Discus and Succineidae were associated with lower soil temperatures, suggesting that the occupied sites are less parched by the sun compared to other sites, and canopy cover and tree height were associated with Succineidae and Vertigo, further supporting cooler conditions provided by the overstory. Forest type can predict the presence of land snails [52], as was found for Vertigo arthuri, V. paradoxa, Oreohelix and Discus, which inhabited sites where Ponderosa pine was not common, and Succineidae, which tended to occupy sites where this tree dominated. Sites with abundant Ponderosa pine had more acidic soil (pH < 7), and pH is known to influence the distribution of land snails [52]. Sites dominated by Ponderosa pine may contain less limestone, which buffers pH and provides calcium to build shells [53]. Similarly, land snails were more abundant and diverse at forested sites with soils of near-neutral pH and with more calcium in general [54]. Other studies suggest that the most diverse sites have the highest habitat complexity [55]. The target species responded independently to litter depth and cover. Vertigo arthuri and V. paradoxa were associated with deeper litter, but Oreohelix was more abundant at sites with shallower litter. Similarly, Succineidae and Discus lived at sites with less litter cover, and Discus was associated with more cover from CWD and logs. The low number of Succineidae detections limited our ability to infer from habitat associations, so we advise that these relationships be interpreted with caution. Many of the relationships are tenuous, and more datapoints are needed to assess their habitat associations. Our general observations suggest that land snails prefer cool, moist habitats (e.g., north-facing slopes, riparian areas) with some litter to feed on. They require canopy cover to retain moisture at sites that are supplied by a mixture of canopy and understory cover. Clear cutting, thinning trees or removing understory vegetation can result in fewer snails or extirpate the target species from a site [56].
Understanding habitat selection can provide key information about which resources animals are more likely to use, while analyzing relationships between animal density and habitat features enables long-term monitoring of populations. Incorporating multiple spatial scales in habitat selection analyses (e.g., macro- and microhabitat) identifies which scale(s) may be most constraining for snails [57]. Due to our low sample size and a 1:1 ratio of used (where the snail species was present) to available (where the snail species was absent) study design, we most likely did not collect enough data to sufficiently analyze the selection of the habitat characteristics we measured. Normally, a 1:3 ratio of used to available locations is the minimum requirement for habitat selection analyses [58]; however, the finding that Vertigo selected microhabitats with higher canopy cover compared to available microhabitats likely identifies a key habitat characteristic. More surveys with an increased number of available locations at each site would further identify habitat preferences for these snails, which could better inform managers about the habitat needs for the persistence of target species of management concern.

5. Conclusions

Land snails walk a tightrope between living in a dry terrestrial environment and retaining enough water in their bodies to prevent desiccation. Terrestrial snails have adaptations to retain body water, such as sealing their shell opening, becoming inactive during dry periods or burying themselves in the litter [59]. Changes in habitat, such as altered precipitation or an opened canopy, can make a site uninhabitable or reduce the land snail population [56]. Understanding what habitat characteristics drive habitat selection of target land snails can help managers make informed decisions to maintain wildlife while actively managing forest activities. For example, harvesting timber can compact soil, fragment the habitat, increase microclimate extremes, and reduce litter and CWD, but the response of land snails is species-dependent [60]. Providing larger patches of untouched habitat within the treated area can increase the persistence of land snail species and add to habitat complexity [55,60]. More information is needed to estimate the minimal canopy cover for snail species and other vital habitat characteristics. Our results support the assertion, as we measured a higher density and richness of snails in areas with taller understory vegetation and higher canopy cover. Resolving taxonomy and understanding the minimum habitat needs of land snails remain critical information gaps to fill in the future, and we recommend using a combination of visual encounter surveys and litter samples to measure responses.

Supplementary Materials

The following supporting information can be downloaded at https://www.mdpi.com/article/10.3390/environments13020089/s1: Figure S1: Site photos from 2024 surveys in the Black Hills National Forest. Site numbers match those in Frest and Johannes [17] and Tronstad and Andersen [22].

Author Contributions

Conceptualization, L.M.T. and K.A.C.; methodology, L.M.T. and K.A.C.; formal analysis, B.P.T., L.M.T. and K.A.C.; identification, B.P.T.; investigation, B.P.T., L.M.T. and K.A.C.; resources, L.M.T.; writing—original draft preparation, L.M.T. and K.A.C.; writing—review and editing, B.P.T., L.M.T. and K.A.C.; visualization, L.M.T. and K.A.C.; project administration, L.M.T.; funding acquisition, L.M.T. All authors have read and agreed to the published version of the manuscript.

Funding

This research was funded by the South Dakota Game, Fish and Parks (grant number F23-AF01471) and the US Forest Service, Black Hills National Forest (grant number 24-CS-11020300-017).

Data Availability Statement

The data can be requested from the Wyoming Natural Diversity Database (https://www.uwyo.edu/wyndd/index.html) accessed on 31 January 2026.

Acknowledgments

Thank you to Melissa Martin and Latisha Hammer for sorting the samples. Madison Mazur educated us in plant identification.

Conflicts of Interest

The authors declare no conflicts of interest.

Appendix A

Table A1. Trends in Oreohelix snails since 1991 in the Black Hills. Data prior to 2000 were from Frest and Johannes [17,21] during surveys in 1991–1992 and in 1999. Surveys were done by Tronstad and Andersen [22] in 2010. Past surveys noted when long-dead (D; white shells), recently dead (R; pigmented shell only) and live snails (L) were detected at sites. We estimated the density of snails in litter samples (ind/m2) and their abundance in visual encounter (VE) surveys (ind person−1 h−1).
1991–1992199920102024 Litter 2024 VEVE
Site AliveRecentLongLiveNotes
1L,R,DL,R,DL,R,D033104R,D
2L,R,D L,R,D0020R,D
3LlL,R,D000105R,D
4L,R,DL,R,DL,R,D22452R,D
11L,R,DL,R,DL,R,D658177R,D
14L,R,D L,R,D1112R,D
23L,R,D L,R,D001231R,D
32L,R,DL,R,DL,R,D11332R,D
76L,RL,R 34839R,D
81L,RL,RL,R120124R,D
118 L,R,D0009
119LDD1221R,D
139L,R,D L,R,D11575045R,D
154LLL,D11311R,D
167 L,RL,R,D0290R,D
170L L,R,D10463878R,D
174L,R L,R,D00017R,D
182L,R,D L,R,D0101143R,D
193/194L L,R,D0003R,D
195 2370
199L R,D01155D
203L L,R,D22336349R,D
210L L,R,D21011R,D
213 LL,R,D00026
220 L,R,DL,R,D0000R,D
231 R,DL,R,D0332R,D
252 L.RL,R,D42478R,D
254 L,R,DL,R,D00384R,D
256 L,RL,R,D58980R,D
337 LL,R,D14320R,D
338 L,R,DL,R,D00015R,D
358 L,R,D5103620R,D
359 0005R,D
Table A2. Trends in Discus shimekii snails since 1991 in the Black Hills. Data prior to 2000 were from Frest and Johannes [17,21] during surveys in 1991–1992 and in 1999. Surveys were done by Tronstad and Andersen [22] in 2010. Past surveys noted when long-dead (D; white shells), recently dead (R; pigmented shell only) and live snails (L) were detected at sites. We estimated the density of snails in litter samples (ind/m2) and their abundance in visual encounter (VE) surveys (ind person−1 h−1). Visual encounter surveys counted Discus, and we corrected abundance by the portion of individuals identified as D. shimekii in the table.
Site1991–1992199920102024 in Litter2024 VE
AliveRecentLongAliveNotes
4 0010
11L,RLL,D0150
76L,RL,RL,D06270
81 L0020R
153L,RL,RL,R0002R,D
210L 0010
256 L,RL,R0138
289 L,R,DL2292025
Table A3. Trends in Vertigo arthuri and V. paradoxa snails since 1991 in the Black Hills. Data prior to 2000 were from Frest and Johannes [17,21] during surveys in 1991–1992 and in 1999. Surveys were done by Tronstad and Andersen [22] in 2010. Past surveys noted when long-dead (D; white shells), recently dead (R; pigmented shell only) and live snails (L) were detected at sites. We estimated the density of snails in litter samples (ind/m2) and their abundance in visual encounter (VE) surveys (ind person−1 h−1).
1991–1992199920102024 in Litter2024 VE
Site AliveRecentLongAliveNotes Species
2 301 paradoxa
4 1701 paradoxa
11RD 2205 paradoxa
32 0001 arthuri
57 D001 arthuri
58L,RLL,R610 both
76L,RL,RL,R19820 paradoxa
81 0002 paradoxa
96 300 paradoxa
112 171014 both
114 086 arthuri
119 D2271Rboth
122 181 arthuri
129L,R D20180126 both
139 773 both
153 004 paradoxa
154 121 both
155L,R,DL,R,DR,D65478 paradoxa
164D,L 012 arthuri
167 LR,D001 arthuri
174 1002 paradoxa
175 200 both
193/194 2113 paradoxa
195 056 both
199L 0615 both
203L R31416 both
206L 001 paradoxa
210L D433647 paradoxa
231 R 142 both
254 001 paradoxa
272 001 arthuri
273 1127 both
289 L,RL003 paradoxa
317 LD215 paradoxa
321 201 arthuri
337 013 both
348 LL5151Rboth
349 L 71013 Rboth
Table A4. Trends in Succineidae snails since 1991 in the Black Hills. Data prior to 2000 were from Frest and Johannes [17,21] during surveys in 1991–1992 and in 1999. Surveys were done by Tronstad and Andersen [22] in 2010. Past surveys noted when long-dead (D; white shells), recently dead (R; pigmented shell only) and live snails (L) were detected at sites. We estimated the density of snails in litter samples (ind/m2) and their abundance in visual encounter (VE) surveys (ind person−1 h−1).
Site1991–1992199920102024 in Litter2024 VE
LiveRecentLongLiveNotes
57RRR,D1263L
58L,R,DLL,R,D624261L
60L,R,DDL,R,D0012R
112 0043R
114 2738
119 2065L
122 1410
129L R,D219520L,R
155L,R,DL,R,DR007
199 R,D0262L
206L L,R761
272 0023
273 12124R
321 001
349 LR1112
359 0000L

References

  1. Lydeard, C.; Cowie, R.H.; Ponder, W.F.; Bogan, A.E.; Bouchet, P.; Clark, S.A.; Cummings, K.S.; Frest, T.J.; Gargominy, O.; Herbert, D.G.; et al. The global decline of nonmarine mollusks. Bioscience 2004, 54, 321–330. [Google Scholar] [CrossRef]
  2. Cowie, R.H.; Bouchet, P.; Fontaine, B. The Sixth Mass Extinction: Fact, fiction or speculation? Biol. Rev. 2022, 97, 640–663. [Google Scholar] [CrossRef]
  3. Overton, J.M.; Barker, G.M.; Price, R. Estimating and conserving patterns of invertebrate diversity: A test case of New Zealand land snails. Divers. Distrib. 2009, 15, 731–741. [Google Scholar] [CrossRef]
  4. Teles, W.S.; Silva, D.d.P.; Vilela, B.; Lima-Junior, D.P.; Pires-Oliveira, J.C.; Miranda, M.S. How Will the Distributions of Native and Invasive Species Be Affected by Climate Change? Insights from Giant South American Land Snails. Diversity 2022, 14, 467. [Google Scholar] [CrossRef]
  5. Coufal, R.; Horsáková, V.; Peterka, T.; Ryelandt, J.; Skujienė, G.; Horsák, M. Ecology and Current Distribution of Three Habitat-Specialized Land Snail Species of the Genus Vertigo (Gastropoda: Eupulmonata) in Europe. Zool. Stud. 2024, 63, e19. [Google Scholar] [CrossRef] [PubMed]
  6. Muller, J.; Bassler, C.; Stratz, C.; Klocking, B.; Brandl, R. Molluscs and climate warming in a low mountain range national park. Malacologia 2009, 51, 89–109. [Google Scholar] [CrossRef]
  7. Lucid, M.K.; Wan, H.Y.; Ehlers, S.; Robinson, L.; Svancara, L.K.; Shirk, A.; Cushman, S. Land snail microclimate niches identify suitable areas for climate refugia management on a montane landscape. Ecol. Indic. 2021, 129, 107885. [Google Scholar] [CrossRef]
  8. Willig, M.; Sandlin, E.A.; Gannon, M.R. Structural and taxonomic correlates of habitat selection by a Puerto Rican land snail. Southwest Nat. 1998, 43, 70–79. [Google Scholar]
  9. Nandy, G.; Barman, H.; Pramanik, S.; Banerjee, S.; Aditya, G. Land snail assemblages and microhabitat preferences in the urban areas of Kolkata, India. J. Urban Ecol. 2022, 8, juac004. [Google Scholar] [CrossRef]
  10. Matthiopoulos, J.; Fieberg, J.R.; Aarts, G. Species-Habitat Associations: Spatial Data, Predictive Models, and Ecological Insights; University of Minnesota: Minneapolis, MN, USA, 2023. [Google Scholar]
  11. Mayor, S.J.; Schneider, D.C.; Schaefer, J.A.; Mahoney, S.P. Habitat selection at multiple scales. Ecoscience 2009, 16, 238–247. [Google Scholar] [CrossRef]
  12. Schlaepfer, M.A.; Runge, M.C.; Sherman, P.W. Ecological and evolutionary traps. Trends Ecol. Evol. 2002, 17, 474–480. [Google Scholar] [CrossRef]
  13. Van Horne, B. Density as a misleading indicator of habitat quality. J. Wildl. Manag. 1983, 47, 893–901. [Google Scholar] [CrossRef]
  14. Gheoca, V.; Benedek, A.M.; Schneider, E. Exploring land snails’ response to habitat characteristics and their potential as bioindicators of riparian forest quality. Ecol. Indic. 2021, 132, 108289. [Google Scholar] [CrossRef]
  15. Li, R.; Li, X.; Yang, R.; Farooq, M.; Tian, Z.; Xu, Y.; Shao, N.; Liu, S.; Xiao, W. Bioassessment of macroinvertebrate communities influenced by gradients of human activities. Insects 2024, 15, 131. [Google Scholar] [CrossRef]
  16. Northrup, J.M.; Vander Wal, E.; Bonar, M.; Fieberg, J.; Laforge, M.P.; Leclerc, M.; Prokopenko, C.M.; Gerber, B.D. Conceptual and methodological advances in habitat-selection modeling: Guidelines for ecology and evolution. Ecol. Appl. 2022, 32, e02470. [Google Scholar] [CrossRef] [PubMed]
  17. Frest, T.J.; Johannes, E.J. Land Snail Survey of the Black Hills National Forest, South Dakota and Wyoming, Summary Report, 1991–2001; Deixis Consultants: Seattle, WA, USA, 2002; p. 451. [Google Scholar]
  18. Nekola, J.C. Terrestrial gastropod fauna of Northeastern Wisconsin and the Southern Upper Peninsula of Michigan. Am. Malacol. Bull. 2003, 18, 21–44. [Google Scholar]
  19. Nekola, J.C.; Chiba, S.; Coles, B.F.; Drost, C.A.; Von Proschwitz, T.; Horsák, M. A phylogenetic overview of the genus Vertigo OF Müller, 1773 (Gastropoda: Pulmonata: Pupillidae: Vertigininae). Malacologia 2018, 62, 21–161. [Google Scholar] [CrossRef]
  20. Anderson, T.K. Field Guide to Black Hills Land Snails; University of Colorado Museum: Boulder, CO, USA, 2004; p. 31. [Google Scholar]
  21. Frest, T.J.; Johannes, E.J. Land Snail Survey of the Black Hills National Forest, South Dakota and Wyoming; By Deixis Consultants for the USDA Forest Service: Seattle, WA, USA, 1993; p. 278. [Google Scholar]
  22. Tronstad, L.M.; Andersen, M.D. Monitoring Rare Land Snails in the Black Hills National Forest; Report Prepared by the Wyoming Natural Diversity Database, Laramie, Wyoming for the Black Hills National Forest, Custer, South Dakota; University of Wyoming: Laramie, WY, USA, 2011. [Google Scholar]
  23. Wilson, J.S.; Bernard, M.R. Rocky Mountainsnails (Oreohelix strigosa) are Detritivores. Am. Malacol. Bull. 2022, 39, 87–90. [Google Scholar] [CrossRef]
  24. Linscott, T.M.; Weaver, K.; Morales, V.; Parent, C.E. Assessing species number and genetic diversity of the Mountainsnails (Oreohelicidae). Conserv. Genet. 2020, 21, 971–985. [Google Scholar] [CrossRef]
  25. Weaver, K.F.; Anderson, T.; Guralnick, R. Combining phylogenetic and ecological niche modeling approaches to determine distribution and historical biogeography of Black Hills mountain snails (Oreohelicidae). Divers. Distrib. 2006, 12, 756–766. [Google Scholar] [CrossRef]
  26. Chak, S. Phylogenetic Relationships and Population Differentiation of Oreohelix Landsnails in Wyoming and Adjacent South Dakota. Ph.D. Thesis, University of Wyoming, Laramie, WY, USA, 2007. [Google Scholar]
  27. Anderson, T.K.; Weaver, K.F.; Guralnicki, R.P. Variation in adult shell morphology and life-history traits in the land snail Oreohelix cooperi in relation to biotic and abiotic factors. J. Molluscan Stud. 2007, 73, 129–137. [Google Scholar] [CrossRef]
  28. Schileyko, A. Treatise on Recent terrestrial pulmonate molluscs, Part 15 Oopeltidae, Anadenidae, Arionidae, Philomycidae, Succineidae, Athoracophoridae. Ruthenica Suppl. 2007, 2, 2049–2209. [Google Scholar]
  29. Nekola, J.C.; Coles, B.F. Pupillid land snails of eastern North America. Am. Malacol. Bull. 2010, 25, 29–57. [Google Scholar] [CrossRef]
  30. Tronstad, L.M.; Tronstad, B.P. Land Sails at Mount Rushmore National Memorial Prior to Forest Thinning and Chipping; University of Wyoming: Laramie, WY, USA, 2013; p. 46. [Google Scholar]
  31. Brooks, M.E.; Kristensen, K.; Van Benthem, K.J.; Magnusson, A.; Berg, C.W.; Nielsen, A.; Skaug, H.J.; Mächler, M.; Bolker, B.M. glmmTMB balances speed and flexibility among packages for zero-inflated generalized linear mixed modeling. R J. 2017, 9, 378–400. [Google Scholar] [CrossRef]
  32. R Development Core Team. R: A Language and Environment for Statistical Computing; R Foundation for Statistical Computing: Vienna, Austria, 2023. [Google Scholar]
  33. Wickham, H. The Split-Apply_Combine Strategy for Data Analysis. J. Stat. Softw. 2011, 40, 1–29. [Google Scholar] [CrossRef]
  34. Wickham, H. ggplot2: Elegant Graphics for Data Analysis; Springer: Berlin/Heidelberg, Germany, 2016. [Google Scholar]
  35. Rosenberg, D.M.; Resh, V.H. (Eds.) Freshwater Biomonitoring and Benthic Macroinvertebrates; Chapman and Hall: New York, NY, USA, 1993; p. 512. [Google Scholar]
  36. Tronstad, L.M.; Hotaling, S. Long-term trends in aquatic ecosystem bioassessment metrics are not influences by sampling method: Empirical evidence from the Niobrara River. Knowl. Manag. Aquat. Ecosyst. 2017, 418, 28. [Google Scholar] [CrossRef]
  37. Ries, L.; Debinski, D.M. Butterfly Responses to Habitat Edges in the Highly Fragmented Prairies of Central Iowa. J. Anim. Ecol. 2001, 70, 840–852. [Google Scholar] [CrossRef]
  38. Barkmann, F.; Huemer, P.; Tappeiner, U.; Tasser, E.; Rüdisser, J. Standardized butterfly surveys: Comparing transect counts and area-time counts in insect monitoring. Biodivers. Conserv. 2023, 32, 987–1004. [Google Scholar] [CrossRef]
  39. Attiwilli, S.; Ravikanthachari, N.; Kunte, K. A comparison between time-constrained counts and line transects as methods to estimate butterfly diversity and monitor populations in tropical habitats. Insect Conserv. Divers. 2024, 17, 88–101. [Google Scholar] [CrossRef]
  40. Viliani, L.; Bonelli, S.; Vercelli, M.; Roy, D.B.; Riva, F. Does a short Pollard walk transect capture butterfly and bee diversity? A test to inform pollinator monitoring and community science initiatives. Insect Conserv. Divers. 2022, 15, 645–654. [Google Scholar] [CrossRef]
  41. Hoyle, S.D.; Campbell, R.A.; Ducharme-Barth, N.D.; Grüss, A.; Moore, B.R.; Thorson, J.T.; Tremblay-Boyer, L.; Winker, H.; Zhou, S.; Maunder, M.N. Catch per unit effort modelling for stock assessment: A summary of good practices. Fish. Res. 2024, 269, 106860. [Google Scholar] [CrossRef]
  42. Ducharme-Barth, N.D.; Grüss, A.; Vincent, M.T.; Kiyofuji, H.; Aoki, Y.; Pilling, G.; Hampton, J.; Thorson, J.T. Impacts of fisheries-dependent spatial sampling patterns on catch-per-unit-effort standardization: A simulation study and fishery application. Fish. Res. 2022, 246, 106169. [Google Scholar] [CrossRef]
  43. Hsu, J.; Chang, Y.-J.; Ducharme-Barth, N.D. Evaluation of the influence of spatial treatments on catch-per-unit-effort standardization: A fishery application and simulation study of Pacific saury in the Northwestern Pacific Ocean. Fish. Res. 2022, 255, 106440. [Google Scholar] [CrossRef]
  44. Giersch, J.J.; Jordan, S.; Luikart, G.; Jones, L.A.; Hauer, F.R.; Muhlfeld, C.C. Climate-induced range contraction of a rare alpine aquatic invertebrate. Freshw. Sci. 2015, 34, 53–65. [Google Scholar] [CrossRef]
  45. González, C.E.O. A Comparative Analysis of Sampling Methods for Aquatic Macroinvertebrates. Preprints 2023. [Google Scholar] [CrossRef]
  46. Pasqualini, J.; Majdi, N.; Brauns, M. Effects of incomplete sampling on macroinvertebrate secondary production estimates in a forested headwater stream. Hydrobiologia 2023, 850, 3113–3124. [Google Scholar] [CrossRef]
  47. Zaller, J.; Kerschbaumer, G.; Rizzoli, R.; Tiefenbacher, A.; Gruber, E.; Schedl, H. Monitoring arthropods in protected grasslands: Comparing pitfall trapping, quadrat sampling and video monitoring. Web Ecol. 2015, 15, 15–23. [Google Scholar] [CrossRef]
  48. Song, X.; Ji, L.; Liu, G.; Zhang, X.; Hou, X.; Gao, S.; Wang, N. Patterns and drivers of aboveground insect diversity along ecological transect in temperate grazed steppes of Eastern Eurasian. Insects 2023, 14, 191. [Google Scholar] [CrossRef]
  49. Rosenberg, Y.; Bar-On, Y.; Fromm, A.; Ostikar, M.; Shoshany, A.; Giz, O.; Milo, R. The global biomass and number of terrestrial arthropods. Sci. Adv. 2023, 9, eabq4049. [Google Scholar] [CrossRef] [PubMed]
  50. Tronstad, L.M.; Tronstad, B.P. Assessing Methods to Monitor Aquatic Invertebrates in a Large River: Comparing Rock Baskets and Hess Samplers in the Snake River, Wyoming, USA. Hydrobiology 2024, 3, 209–223. [Google Scholar] [CrossRef]
  51. Horsák, M.; Ortiz, D.; Nekola, J.C.; Van Bocxlaer, B. Intercontinental dispersal and niche fidelity drive 50 million years of global diversification in Vertigo land snails. Glob. Ecol. Biogeogr. 2024, 33, e13820. [Google Scholar] [CrossRef]
  52. Gómez, P.; Espinoza, S.; Barahona-Segovia, R.M.; Valenzuela, M.; Ormazábal, Y.; Hahn, S. Forest type and pH affecting the occurrence and life status of land snails in South American temperate forest. Pedobiologia 2022, 93, 150824. [Google Scholar] [CrossRef]
  53. Linscott, T.M.; Recla, N.K.; Parent, C.E. Geology constrains biomineralization expression and functional trait distribution in the Mountainsnails. J. Biogeogr. 2023, 50, 2122–2134. [Google Scholar] [CrossRef]
  54. Martin, K.; Sommer, M. Effects of soil properties and land management on the structure of grassland snail assemblages in SW Germany. Pedobiologia 2004, 48, 193–203. [Google Scholar] [CrossRef]
  55. Gheoca, V.; Benedek, A.M.; Schneider, E. Taxonomic and functional diversity of land snails reflects habitat complexity in riparian forests. Sci. Rep. 2023, 13, 9808. [Google Scholar] [CrossRef] [PubMed]
  56. Hylander, K.; Nilsson, C.; Gothner, T. Effects of buffer-strip retention and clearcutting on land snails in boreal riparian forests. Conserv. Biol. 2004, 18, 1052–1062. [Google Scholar] [CrossRef]
  57. Altmoos, M.; Henle, K. Relevance of multiple spatial scales in habitat models: A case study with amphibians and grasshoppers. Acta Oecologica 2010, 36, 548–560. [Google Scholar] [CrossRef]
  58. Nad’o, L.; Kaňuch, P. Why sampling ratio matters: Logistic regression and studies of habitat use. PLoS ONE 2018, 13, e0200742. [Google Scholar] [CrossRef]
  59. Schweizer, M.; Triebskorn, R.; Köhler, H.R. Snails in the sun: Strategies of terrestrial gastropods to cope with hot and dry conditions. Ecol. Evol. 2019, 9, 12940–12960. [Google Scholar] [CrossRef]
  60. Jordan, S.; Black, S. Effects of Forest Land Management on Terrestrial Mollusks: A Literature Review; Xerces Society for Invertebrate Conservation: Portland, OR, USA, 2012; p. 87. [Google Scholar]
Figure 1. Photos of (a) Oreohelix cooperi; (b) the dorsal and (c) ventral shell surfaces of Discus shimekii, (d) Succineidae, (e) Vertigo arthuri; and (f) the front and (g) lateral view of Vertigo paradoxa collected in the Black Hills.
Environments 13 00089 g001
Figure 2. We surveyed 55 survey locations in the Black Hills, USA. Core sites are surveyed each time monitoring is done, and random sites are selected based on information needs. Numbers represent site numbers. The Black Hills proper is the main area that straddles the South Dakota and Wyoming border. The Bearlodge Mountains are part of the Black Hills and are located to the northwest. The inset map shows the location of the Black Hills in the continental USA.
Environments 13 00089 g002
Figure 3. The total density of snails in litter samples (ind/m2) was related to (a) understory vegetation height, (b) litter depth and (c) percent canopy cover.
Environments 13 00089 g003
Figure 4. The richness of snails in litter samples was related to (a) dominance of White spruce, (b) Bur oak, (c) Ponderosa pine, (d) number of fallen logs, (e) moss cover, (f) litter depth, (g) soil temperature (°C), (h) soil moisture, (i) soil pH, (j) understory height, (k) tree height and (l) soil humidity.
Environments 13 00089 g004aEnvironments 13 00089 g004b
Figure 5. The density of Vertigo arthuri and V. paradoxa (ind/m2) was related to (a) the dominance of White spruce, (b) Ponderosa Pine, (c) Bur oak, (d) percent cover of moss, (e) litter depth, (f) soil pH, (g) tree height, (h) coarse woody debris (CWD) and (i) soil temperature (°C).
Environments 13 00089 g005
Figure 6. The density of Succineidae in litter (ind/m2) was related to (a) sites that were dominated by Ponderosa pine and (b) Bur oak, (c) coarse woody debris (CWD), (d) percent cover of moss, (e) soil temperature (°C), (f) soil moisture, (g) tree height, (h) soil pH, (i) understory height and (j) relative humidity.
Environments 13 00089 g006aEnvironments 13 00089 g006b
Figure 7. The catch per unit effort (CPUE) of Oreohelix (snails person−1 h−1) in visual encounter surveys was higher in areas where (a) Ponderosa Pine did not dominate, (b) sites with cooler soil temperatures (°C) and (c) shallower litter depths and (d) sites where White Spruce dominated.
Environments 13 00089 g007
Figure 8. The catch per unit effort (CPUE) of Succineidae (snails person−1 h−1) in visual encounter surveys was higher in areas where (a) Ponderosa Pine dominated and (b) Bur oak did not. Succineidae snails were less abundant in areas with higher (c) litter cover, (d) canopy cover and (e) moss cover. These relationships are tenuous and require more data to develop further.
Environments 13 00089 g008
Figure 9. Vertigo species collected from litter samples were more likely to be found in microhabitats with a higher percentage of canopy cover.
Environments 13 00089 g009
Table 1. Land snail species identified in litter samples and visual encounter surveys in the Black Hills, USA, in 2024.
Cionella lubricaNesovitrea binneyanaVallonia perspectiva
Columella simplexNesovitrea electrinaVallonia pulchella
Discus shimekiiOreohelix strigosa cooperiVertigo arthuri
Discus whitneyiOxychilus cellariusVertigo modesta modesta
Euconulus fulvusPunctum minutissimumVertigo paradoxa
Gastrocopta armiferaStriatura miliumVertigo tridentata
Gastrocopta holzingeriStrobilops labyrinthicaVitrina alaskana
Gastrocopta pentodonSuccineidaeZonitoides arboreus
Hawaiia minusculaVallonia parvulaZoogenetes harpa
Table 2. Statistical results of analyzing habitat selection for our target snail species at the macro- (20 m radius) and microhabitat scales (0.093 m2). The number of logs and % rock cover were not included in the model for Vertigo.
OreohelixDiscusSuccineidaeVertigo
Macrohabitat scalezpzpzpzp
Number logs−0.450.65−0.640.52−0.310.75--
Understory height0.230.810.930.35−0.520.590.210.83
Tree height1.020.300.590.55−1.460.14−0.170.86
% rock cover1.170.240.100.91−0.520.59--
% CWD cover−0.820.400.610.54−0.120.89−0.950.34
% litter cover0.130.890.250.800.160.860.540/58
% moss cover−0.330.73−0.420.67−0.210.830.940.34
Microhabitat scalezpzpzpzp
Canopy cover0.470.630.400.680.630.522.060.03
Soil moisture−0.270.780.180.85−0.280.771.600.10
Litter depth−1.090.270.120.890.410.671.120.26
Disclaimer/Publisher’s Note: The statements, opinions and data contained in all publications are solely those of the individual author(s) and contributor(s) and not of MDPI and/or the editor(s). MDPI and/or the editor(s) disclaim responsibility for any injury to people or property resulting from any ideas, methods, instructions or products referred to in the content.