Article

Assessing Microplastic Contamination and Depuration Effectiveness in Farmed Pacific Oysters (Crassostrea gigas)

1
Interdisciplinary Centre of Marine and Environmental Research (CIIMAR), University of Porto, Terminal de Cruzeiros do Porto de Leixões, 4450-208 Matosinhos, Portugal
2
Institute of Biomedical Sciences Abel Salazar (ICBAS), University of Porto, Rua de Jorge Viterbo Ferreira nº 228, 4050-313 Porto, Portugal
3
Chemistry and Biochemistry Department, Faculty of Sciences, University of Porto, Rua do Campo Alegre, s/n, 4169-007 Porto, Portugal
4
Biology Department, Faculty of Sciences, University of Porto, Rua do Campo Alegre, s/n, 4169-007 Porto, Portugal
*
Author to whom correspondence should be addressed.
Environments 2025, 12(8), 254; https://doi.org/10.3390/environments12080254
Submission received: 25 June 2025 / Revised: 22 July 2025 / Accepted: 23 July 2025 / Published: 25 July 2025
(This article belongs to the Special Issue Editorial Board Members’ Collection Series: Plastic Contamination)

Abstract

This study assessed the presence, abundance, and characteristics of microplastics (MPs) in farmed Pacific oysters (Crassostrea gigas) and evaluated the efficacy of depuration in reducing MPs under laboratory-controlled and commercial conditions. Oysters cultivated in the Lima estuary (NW Portugal) were sampled in autumn and winter, along with adjacent surface water and sediment, to investigate potential contamination sources. MP concentrations in oysters varied temporally, with higher levels in October 2023 (0.48 ± 0.34 MPs g−1 ww) than in February 2024 (0.09 ± 0.07 MPs g−1 ww), while the environmental levels remained stable across dates. All MPs were fibres, predominantly transparent, followed by blue and black. Fourier-Transform Infrared Spectroscopy (FTIR) confirmed cellulose and polyethylene terephthalate (PET) as dominant polymers in oysters and environmental samples. No clear correlation was found between MPs in oysters and surrounding compartments. Laboratory depuration reduced MPs by 78% within 48 h, highlighting its potential as a mitigation strategy. However, depuration was less effective under commercial conditions, possibly due to lower initial contamination levels. These findings suggest that oysters may act as a vector for human exposure to MPs via seafood consumption. While depuration shows promise in reducing contamination, further research is needed to optimise commercial protocols and enhance the safety of aquaculture products.

1. Introduction

Human activities have significantly impacted ecosystems worldwide, leading to widespread environmental contamination from chemical and solid waste. Among these, plastic pollution has emerged as one of the most pressing environmental challenges due to its persistence and ability to function as a pathway for other chemical pollutants and biological agents [1,2,3]. Since the onset of mass production in the 1950s, plastics have become ubiquitous due to their durability, versatility, and low cost [4,5]. However, most plastic waste remains unrecycled, often entering natural ecosystems through pathways such as wastewater and urban runoff [6,7].
In aquatic environments, plastics undergo physical, chemical, and biological degradation, fragmenting into microplastics (MPs), defined as plastic particles smaller than 5 mm in diameter [8]. Some MPs are intentionally manufactured at this size for use in personal care products and industrial applications [9]. Their small size and widespread occurrence facilitate ingestion by marine organisms across various trophic levels, raising concerns about bioaccumulation and contaminant transfer in food chains [10]. Moreover, MPs can act as vectors for adsorbed pollutants and pathogens, exacerbating their environmental and toxicological impacts [11,12,13].
Estuarine environments, transitional areas between freshwater and marine ecosystems, are particularly susceptible to MP accumulation due to substantial inputs from urban, industrial, and agricultural sources [1,14,15]. High sedimentation rates in these areas contribute to MP retention, potentially making estuaries as long-term reservoirs that release MPs into marine environments during tidal exchanges and sediment resuspension events [1]. These ecosystems are also highly productive, supporting natural resource harvesting, including bivalve aquaculture [16].
Bivalve molluscs, such as clams, oysters and mussels, are directly exposed to MPs present in seawater, sediment, and air. As suspension feeders, they ingest a variety of microscopic particles, including MPs (e.g., [17]), which may accumulate in their tissues [18], raising concerns for both bivalve health and human consumption. While there are still insufficient data to fully assess the toxicity of MPs in humans [19,20], documenting MP contamination in commercial bivalves farmed in estuarine areas is essential, as these organisms are among the primary seafood sources with the potential to transfer MPs to humans [20,21]. Unlike fish, bivalves are consumed whole, with their digestive tract intact, placing heavy seafood consumers at a higher risk of MP ingestion [21].
In Portugal, a major seafood-consuming country [22], research on MP contamination in farmed bivalves remains limited despite the growing importance of the bivalve aquaculture industry [23]. MPs have been documented in Portuguese river and estuarine waters, sediments, and biota (e.g., [24,25,26,27,28,29,30,31,32]), with an estimated 4.1 trillion MPs released annually from untreated wastewater [30]. While some studies have detected MPs in wild marine bivalves along the Portuguese coast [25,29,33,34], there is still limited information on commercially cultured species [26,27,35,36].
Beyond quantifying MP concentrations in bivalves, understanding their physical characteristics and how they relate to environmental contamination is crucial for evaluating MP accumulation and its implications for seafood safety. However, it remains unclear whether bivalves reliably reflect environmental MP levels due to their ability to select and reject particles [17,37,38]. Additionally, the influence of environmental fluctuations, such as rainfall, river runoff, and water flow/discharge, on MP contamination [39,40], as well as the role of sediment resuspension in increasing MP exposure in bivalve-farming areas, remains poorly understood.
Moreover, the effectiveness of bivalve depuration as a strategy to reduce human exposure to MPs is still uncertain. Depuration is a post-harvest process commonly used in the shellfish industry, in which bivalves are placed in clean seawater to expel contaminants [41]. While effective in reducing toxins and microbial pathogens, its ability to remove MPs is not well understood, with only a few recent studies addressing this issue [42,43,44]. Several factors likely influence depuration efficiency, including species-specific physiology, depuration conditions, and MPs’ characteristics such as size, shape, and initial concentrations [43,45,46]. Further research is needed to assess the feasibility of MP removal through depuration and optimise protocols for its effectiveness.
This study aims to address some of these knowledge gaps by investigating the MP levels in estuarine farmed oysters and evaluating the factors influencing contamination levels. Additionally, it seeks to assess the effectiveness of depuration as a potential mitigation strategy for MP removal. Using an oyster farm in the Lima estuary (NW Portugal) as a case study, the specific objectives of this research are to (i) quantify the MP levels in farmed Pacific oysters (Crassostrea gigas) and examine temporal variations; (ii) assess the relationship between MP contamination in oysters and their surrounding environment, including in water and sediment; and (iii) evaluate the efficacy of depuration in reducing MPs in oysters under controlled laboratory conditions and in a commercial depuration facility.

2. Materials and Methods

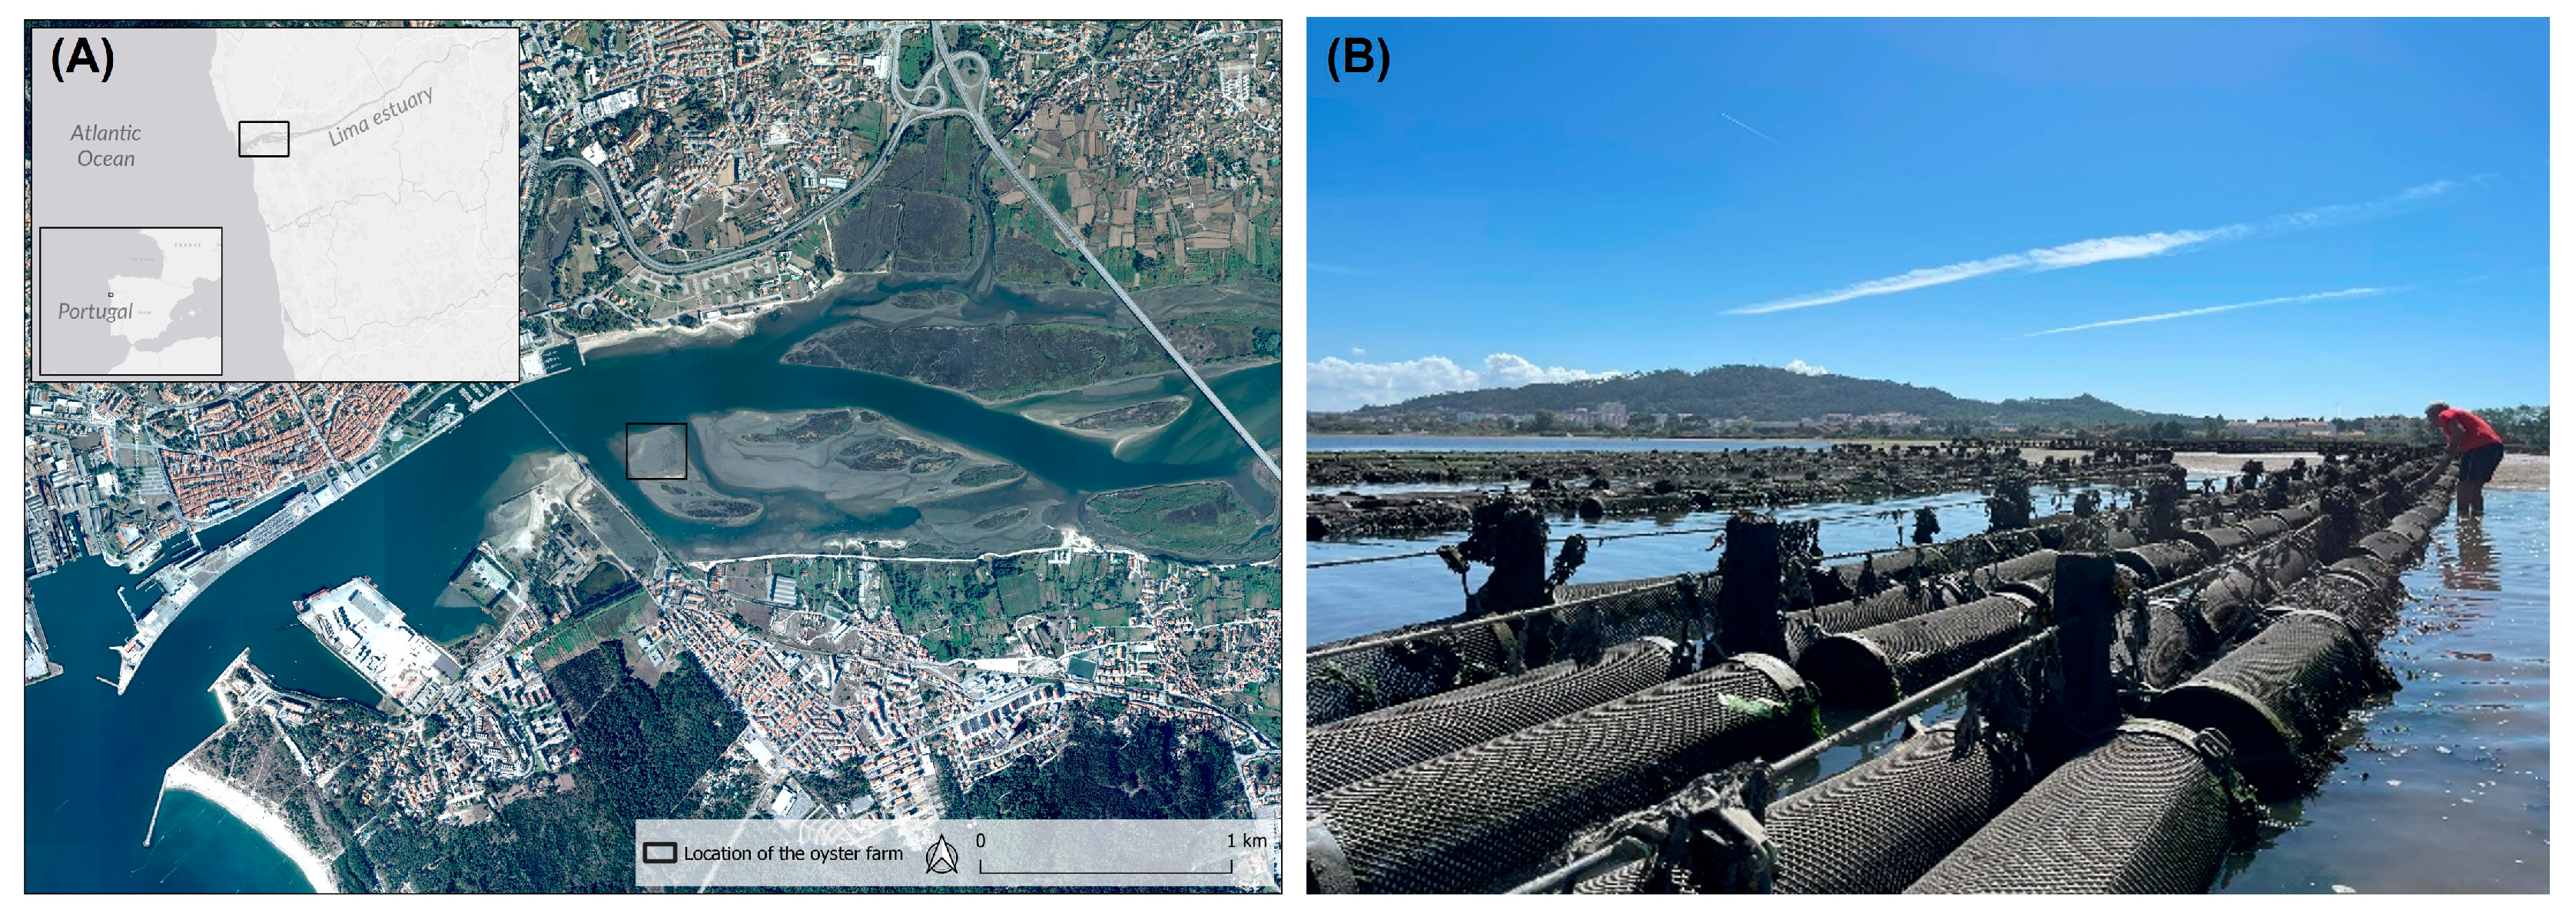
2.1. Study Area—Oyster Farm

Samples were collected from an oyster farm located in an intertidal area in the Lima River estuary (41°41′21″ N 8°48′44″ W), near Viana do Castelo, northwest Portugal (Figure 1A). The Lima estuary is a temperate, partially mixed estuary, with a semidiurnal and mesotidal regime [47]. The annual mean freshwater discharge of Lima River is 70 m3 s−1 [47], with minimum values during the summer and maximum values during the winter, originated from discharges of upstream hydropower dams and precipitation. Despite significant ecological relevance, the Lima estuary is subject to various anthropogenic pressures, particularly in its lower section, which is influenced, among other factors, by urban settlement and by shipping and port activities [47]. The entire estuary receives diffuse pollution from multiple sources, including agriculture and untreated urban and industrial wastewater [47,48], with recent studies also documenting MP contamination in abiotic (water, sediment) and biotic (zooplankton) compartments [24,28].
The oyster farm occupies an area of 3.6 ha in the middle section of the estuary and cultivates Pacific oysters (C. gigas) using a longline system with suspended high-density polyethylene baskets (Figure 1B). Triploid oyster seeds are obtained from commercial hatcheries and reared in the estuary until they reach market size. As an intertidal grow-out system, oysters are submerged during high tide, and at low tide, they are exposed to air for a few hours. The sampling site is a designated bivalve production area with a sanitary classification of B [49], meaning that bivalves harvested for human consumption are required to undergo depuration, transposition, or processing in an industrial unit before being sold and consumed.

2.2. Sample Collection

To assess MP contamination in oysters, two sampling campaigns were conducted, on 6 October 2023 (autumn) and 23 February 2024 (winter), to capture temporal variability in environmental factors (e.g., temperature, precipitation, river inflow) and oyster biochemical composition [50]. At each sampling campaign, 30 adult oysters of commercial size (mean shell length: 79 ± 6 mm; Table A1Appendix A) were randomly collected by hand during low tide, stored in aluminium foil, and frozen at −20 °C. During each sampling campaign, three sediment samples (top 5 cm, 100 g each) were collected around the location of the oysters using a pre-clean metal shovel, wrapped in aluminium foil, and frozen at −20 °C in the laboratory until processing. Additionally, three 1-L surface water samples were collected from the same location during each campaign using in pre-cleaned glass bottles and stored at room temperature until processing. A small sample of the plastic baskets used for oyster cultivation was also collected to compare its polymer composition with that of the MPs found in oysters and environmental samples.
For the depuration trials, oysters were sampled on 21 November 2023 and 22 April 2024, as these trials could not be conducted simultaneously with the MP contamination assessment due to logistical constrains. For the trials, 45 and 60 oysters were collected, respectively, and transported to the laboratory or the depuration plant immediately before experiments began.

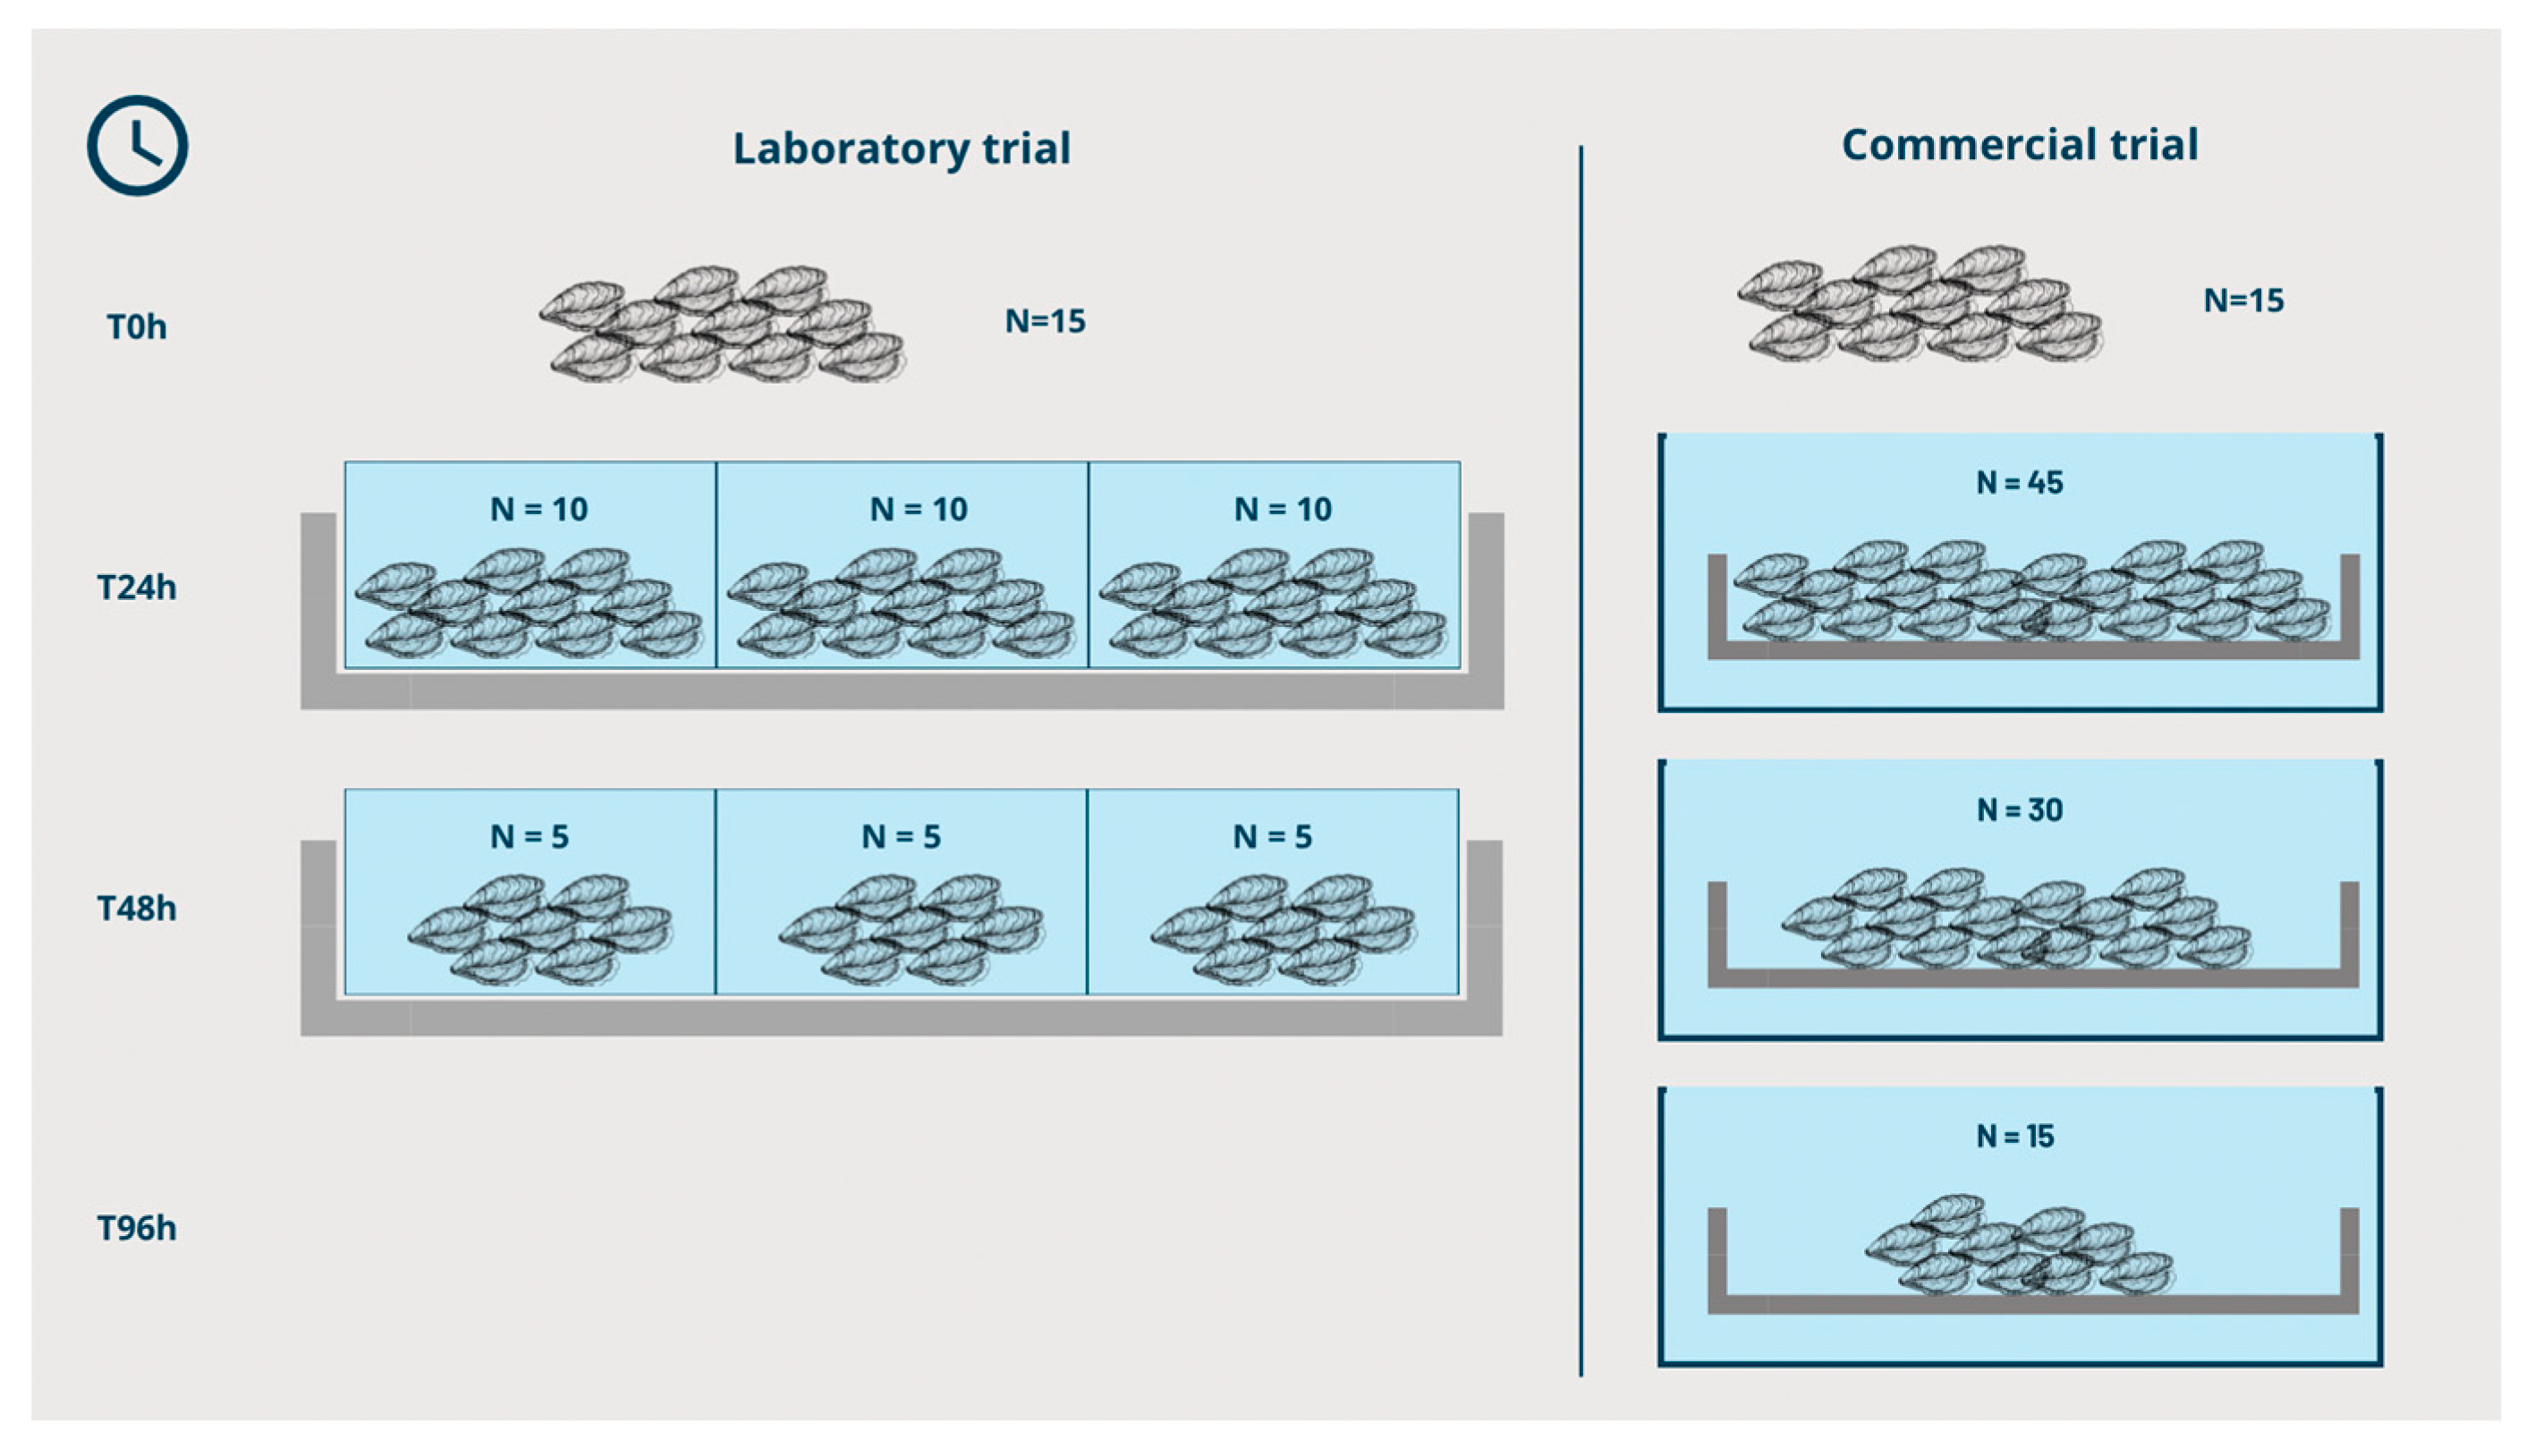
2.3. Depuration Trials

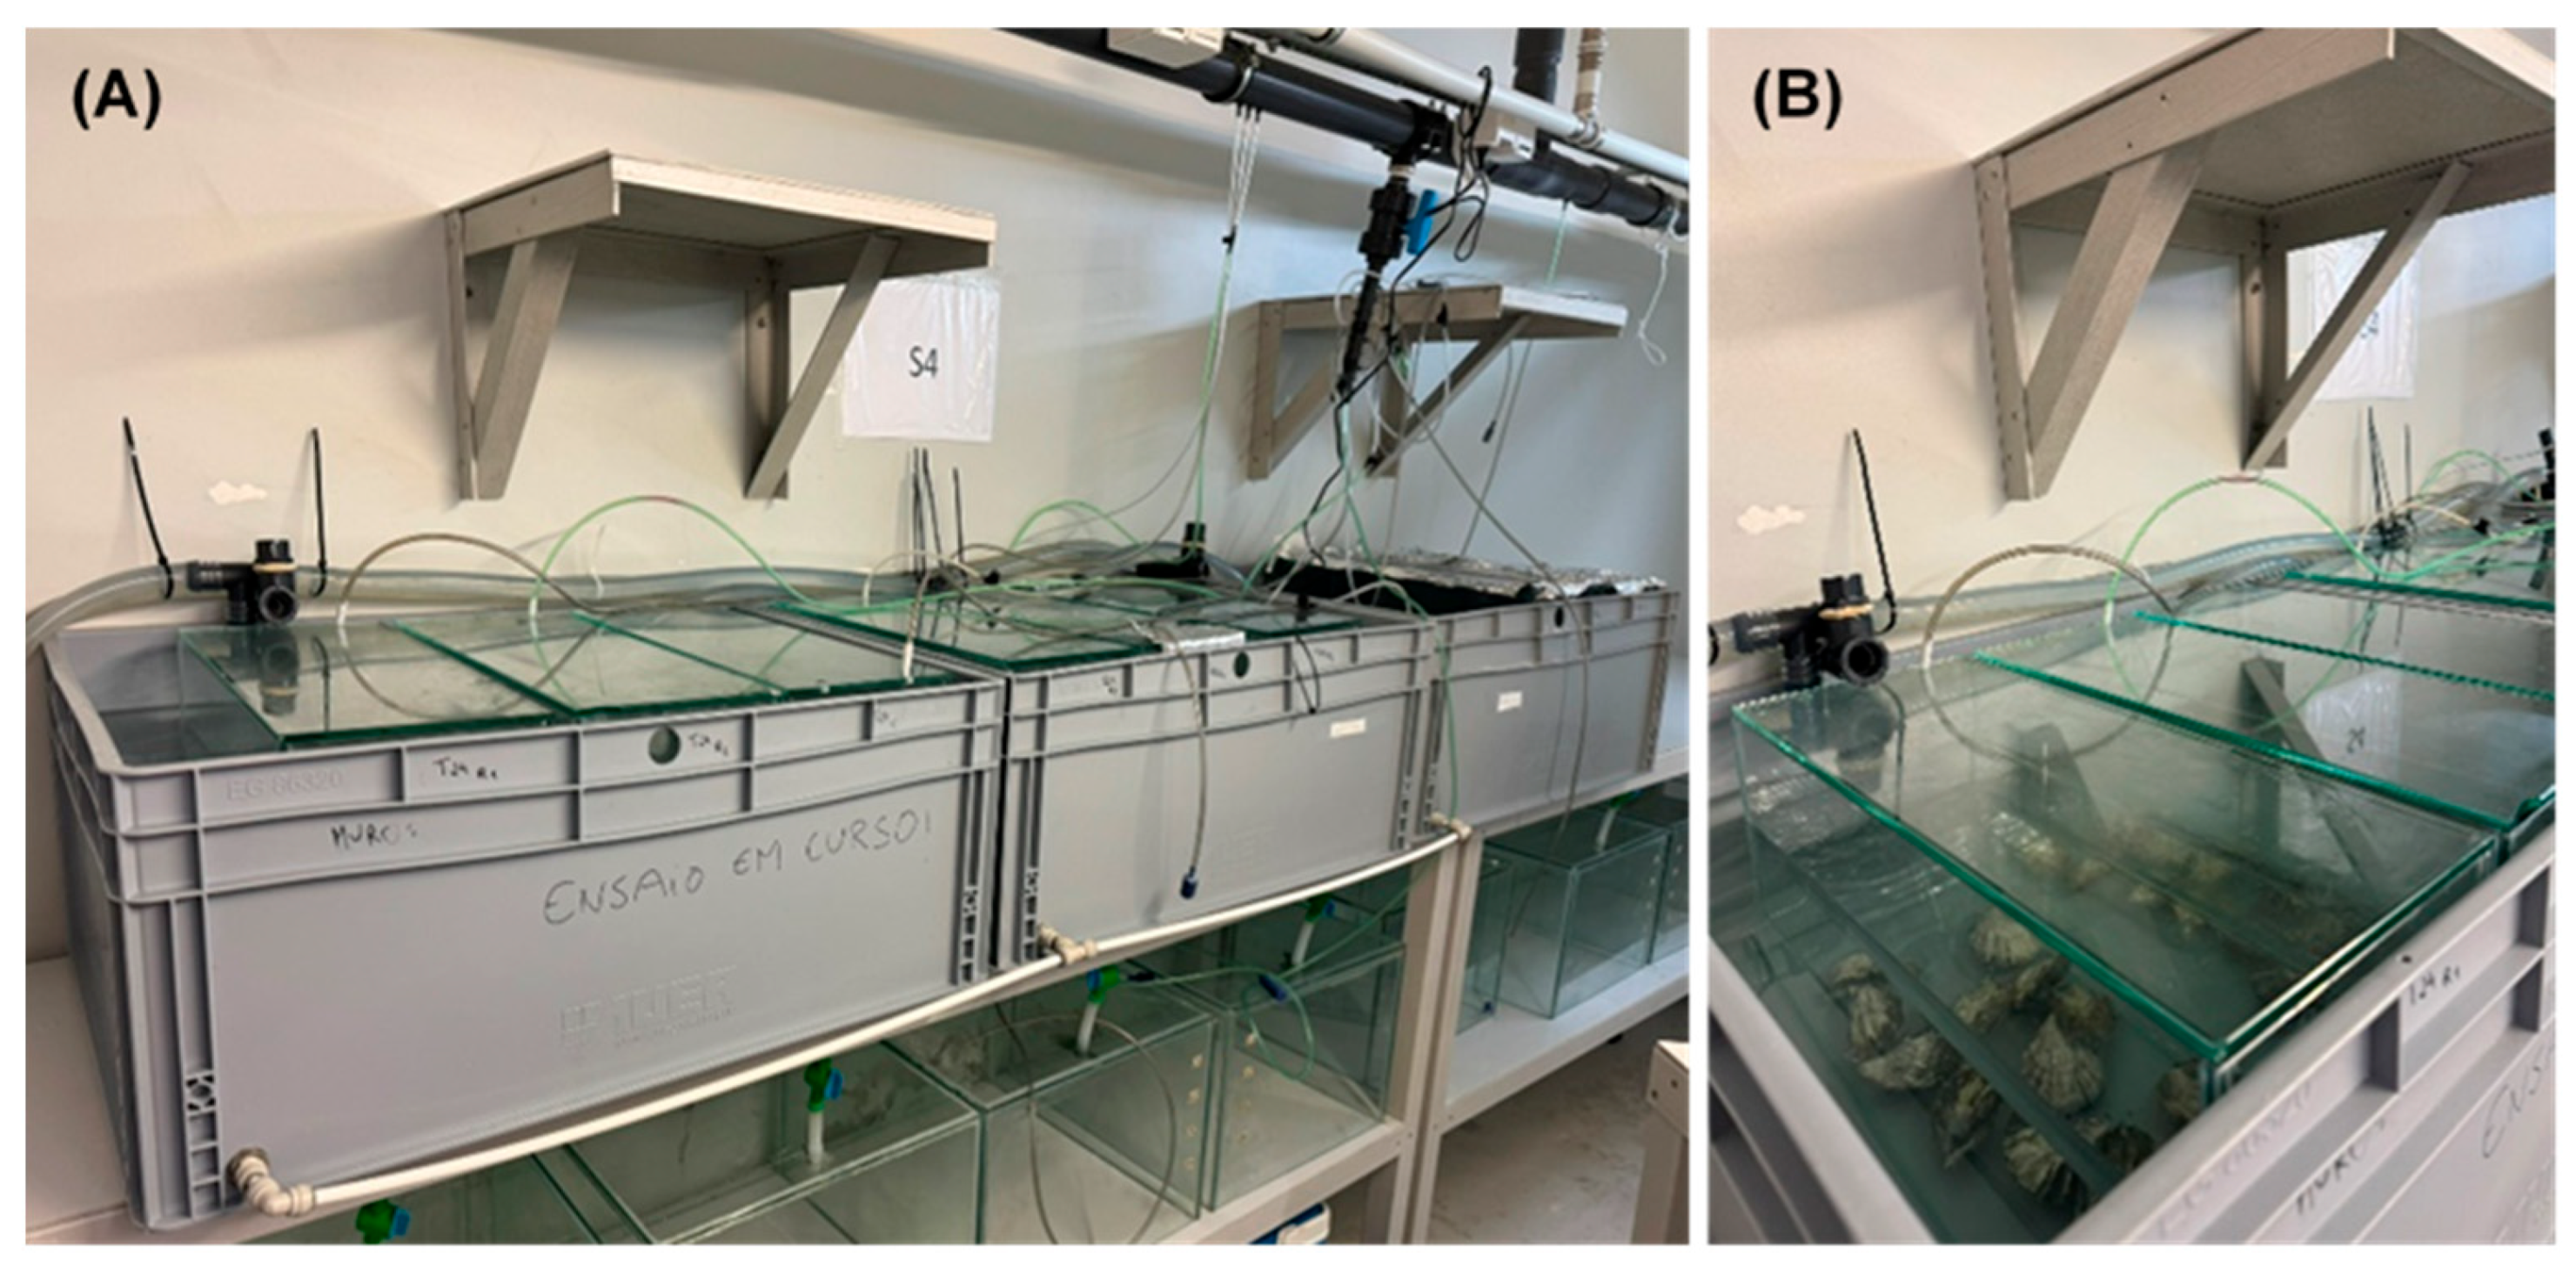
2.3.1. Laboratory Trial

A static depuration system was set up in laboratory control conditions at the CIIMAR Bioterium in November 2023. This setup consisted of six 30 L glass tanks placed in a water bath connected to chillers that maintained a stable water temperature of 16.0 ± 0.2 °C throughout the experiment. Each tank was filled with 16 L of natural seawater (29–30‰) pre-treated in the CIIMAR Bioterium system (which includes mechanical and activated carbon filtration and UV disinfection) and filtered through 0.45 µm cellulose nitrate filters. Aeration of the tanks was provided using glass Pasteur pipettes connected to tubes (Figure 2).
Oysters collected from the oyster farm (mean shell length: 74 ± 6 mm) were thoroughly scrubbed with a metal scrubber to remove sand and biofouling, washed with tap water, and rinsed with deionised water before introducing them in the aquaria. Fifteen oysters (control group, non-depurated) were immediately frozen at −20 °C to determine initial MP concentrations. The remaining 30 oysters were divided into 3 groups of 10 oysters and placed in each of the experimental tanks, ensuring at least 1 L of water per oyster [51] (Figure A1Appendix A). No acclimation was performed as the experimental water temperature was similar to field conditions. The oysters were not fed during the experiment to replicate industry depuration practices. After 24 h, five oysters from each tank (n = 15) were removed and frozen at −20 °C until analysis. The remaining 5 oysters per tank were transferred to new tanks containing new pre-treated and filtered seawater to prevent re-filtration of previously egested particles and maintained for another 24 h (48 h depuration trial). After this second depuration period, the five oysters per tank (n = 15) were removed and frozen at −20 °C until further laboratorial analysis.

2.3.2. Commercial Depuration

A separate trial was conducted at a commercial depuration facility in April 2024. Sixty oysters (mean shell length: 69 ± 5 mm) were collected from the oyster farm and transported to the depuration facility, where they were divided into two groups: a non-depurated control group (n = 15), which was immediately transported to the laboratory and frozen at −20 °C until analysis, and a depuration group (n = 45), which underwent depuration for 24, 48, and 96 h. Oysters in the depuration group were placed in a perforated plastic tray within a single depuration tank (Figure A1Appendix A). Depuration was conducted using natural seawater treated with chlorine, and maintained at room temperature, in accordance with the facility standard operational practices. The seawater was continuously circulated and was replaced twice a day to maintain optimal dissolved oxygen levels. At the end of each 24 h depuration period, 15 oysters were collected and stored at −20 °C for subsequent laboratorial analysis.

2.4. Sample Preparation and MP Extraction

In the laboratory, the oysters were removed from the freezer, carefully rinsed with deionised water and individually measured for shell length (umbo to the longest edge) using a digital caliper (nearest mm) and allowed to thaw at room temperature. Shells were opened with a clean scalpel, and edible tissues (whole soft body and pallial fluid) were transferred to pre-weighed, clean, aluminium containers, and weighed using a digital scale (Radwag, d = 0.01 g). Soft tissues were left unrinsed to account for potential MP contamination adhering to the oyster tissues, relevant from a human consumption perspective (i.e., considering that not only the edible tissue but also the pallial fluid is consumed by humans). MP extraction was performed according to [52], using an optimised protocol for seafood samples. Briefly, oyster tissues were transferred into a glass beaker, dried overnight at 40 °C to reduce moisture, and digested with 30% hydrogen peroxide (H2O2) at 65 °C for 48 h in oven. The digested solution was then filtered through cellulose nitrate membranes (0.45 μm mesh size, 47 mm diameter) using a glass vacuum filtration system in a fume hood. Sample residues in the beaker were rinsed with deionised water and filtered. The filters were left to dry at room temperature in covered Petri dishes and stored afterwards in the dark until MP analysis.
MP extraction from sediment samples was conducted by adapting a previously optimised protocol [53]. Sediments were thawed and air-dried at room temperature in covered aluminium containers. Samples of the sediment (100 g each) were divided into replicates of approximately 20 g and subjected to density separation with a saturated NaCl solution. The suspension was allowed to settle until the water phase became transparent (approximately 3 h). At this point, additional saturated NaCl solution was carefully added to facilitate the separation of the floating layer. This layer was subsequently treated with a 30% H2O2 solution at 65 °C overnight. Following digestion, the samples were filtered using a 0.45 μm cellulose nitrate membrane filter, following the procedure described for oysters.
To extract MPs from water samples, a simplified version of the protocol developed by [54] was used, given the low organic matter content. The samples were treated with 30% H2O2 (~100 mL per L of water) at room temperature to digest residual organic matter, followed by filtration using the same procedure as for oysters and sediment samples.

2.5. MP Characterisation

After MP extraction from the different samples (oysters, sediment and water), all filters were visually examined under a stereomicroscope (Leica EZ4W, Wetzlar, Germany) with an integrated camera using LAS X Office 1.4.4 software. The filters were examined from left to right and top to bottom to avoid overcounting. Potential MPs were counted and classified by shape (e.g., fragment, film, or fibre) and colour. MPs with dual colours were categorised by their apparent original colour. For instance, a predominantly transparent particle with a small blue section was classified as blue, as the blue portion likely reflects the original hue before fading [55,56]. MPs were also measured along their longest axis and grouped into three size categories: <0.5 mm, 0.5–2 mm, and >2–5 mm.
A minimum of 10% of visually identified MPs from each matrix (oysters, water, sediment) were subsampled for polymer identification by Fourier-Transform Infrared Spectroscopy (FTIR), in accordance with the European Union’s Marine Strategy Framework Directive (MSFD) guidelines [57]. A total of 143 suspected MPs were analysed: 52 from oysters, 23 from water, and 68 from sediment, representing 15%, 37%, and 10% of the total MPs detected in each matrix, respectively. From the depuration trials, 16% (laboratory) and 26% (commercial) of MPs visually identified in oysters were analysed by FTIR. Polymer identification was performed using a PerkinElmer FT-IR Spectrum 2 spectrometer (Waltham, MA, USA) with attenuated total reflectance (ATR), and a detection limit of 10 µm. Spectra were averaged over four scans (4000–800 cm−1) and matched against the instrument’s reference library. For water and sediment samples, only matches with ≥75% confidence were accepted [24,31]. For oyster samples, a lower threshold of ≥65% was used to account for potential polymer degradation or spectral alteration during gut passage [58].

2.6. Contamination Control

No measures were taken to assess airborne contamination during field sampling or sample transport under the assumption that contamination of edible tissues would be minimal due to tightly closed shells. In contrast, in the laboratory, all sample processing and digestions were conducted in a fume hood to minimise airborne and cross-contamination. Work surfaces were pre-cleaned with 70% ethanol, and non-plastic tools (e.g., glassware, metal instruments) were washed with filtered deionised water (0.45 µm cellulose nitrate membrane filters) and ethanol before use and between samples. The filtered deionised water was regularly checked under a stereomicroscope to confirm the absence of MP contamination. Hydrogen peroxide (H2O2) solutions were also filtered through 0.45 µm cellulose nitrate membrane filters. Disposable nitrile gloves and grey 100% cotton lab coats were worn at all times, and sample containers were covered with aluminium foil throughout. Oyster shells were rinsed with filtered deionised water before measurement and dissection to remove surface debris. Blanks (open Petri dishes with deionised water) were used throughout sample preparation, MP extraction, and MP visual analysis to monitor airborne contamination. These blanks were examined under a stereomicroscope at the beginning and end of each procedure, with the results reported in the Results section.
During the laboratory depuration trial, additional measures were taken to minimise contamination, including (i) filtering all system water through 0.45 μm membrane filters; (ii) aerating the aquaria with glass pipettes; and (iii) covering the aquaria with glass lids lined with aluminium foil. In contrast, no specific contamination control measures were implemented at the commercial depuration facility to mimic industry practices.
Despite measures taken to minimise procedural contamination, some airborne fibres were detected in blank controls. The highest level of contamination occurred during the visual analysis phase under the stereomicroscope (i.e., MPs characterisation), with up to 7 fibres per blank recorded (Table A2, Appendix A). These airborne fibres were predominantly transparent and black, similar to those observed in the samples. Accordingly, fibres matching those identified in blanks were excluded from the analysis. Contamination during all other phases of sample processing, including preparation and MP extraction, was minimal and considered negligible.

2.7. Data Analysis

Microplastic (MP) abundance in oysters was expressed as MPs per gram of wet weight (MPs g ww−1) and per individual (MPs ind−1). MP concentrations in water and sediment were standardised as MPs per litre (MPs L−1) and MPs per gram of dry weight (MPs g dw−1), respectively.
Due to violations of normality and homogeneity of variance, non-parametric tests were used to compare MP abundances across sampling periods (autumn and winter) and depuration time points of each trial. Kruskal–Wallis and Mann–Whitney U tests were applied as appropriate, with Dunn’s post hoc test for multiple comparisons. Differences in MP colour and size class distributions across matrices and depuration times were assessed using Fisher’s exact test. When overall differences were significant, pairwise Fisher’s tests of independence were conducted to identify specific group differences.
All statistical analyses were performed in R (version 4.4.1; R Core Team, 2024) with a significance level of p < 0.05. Graphs were produced using Prism and R, with boxplots generated using the ggplot2 package [59]. Dunn’s tests were performed with the dunnTest() function from the FSA package [60].

3. Results

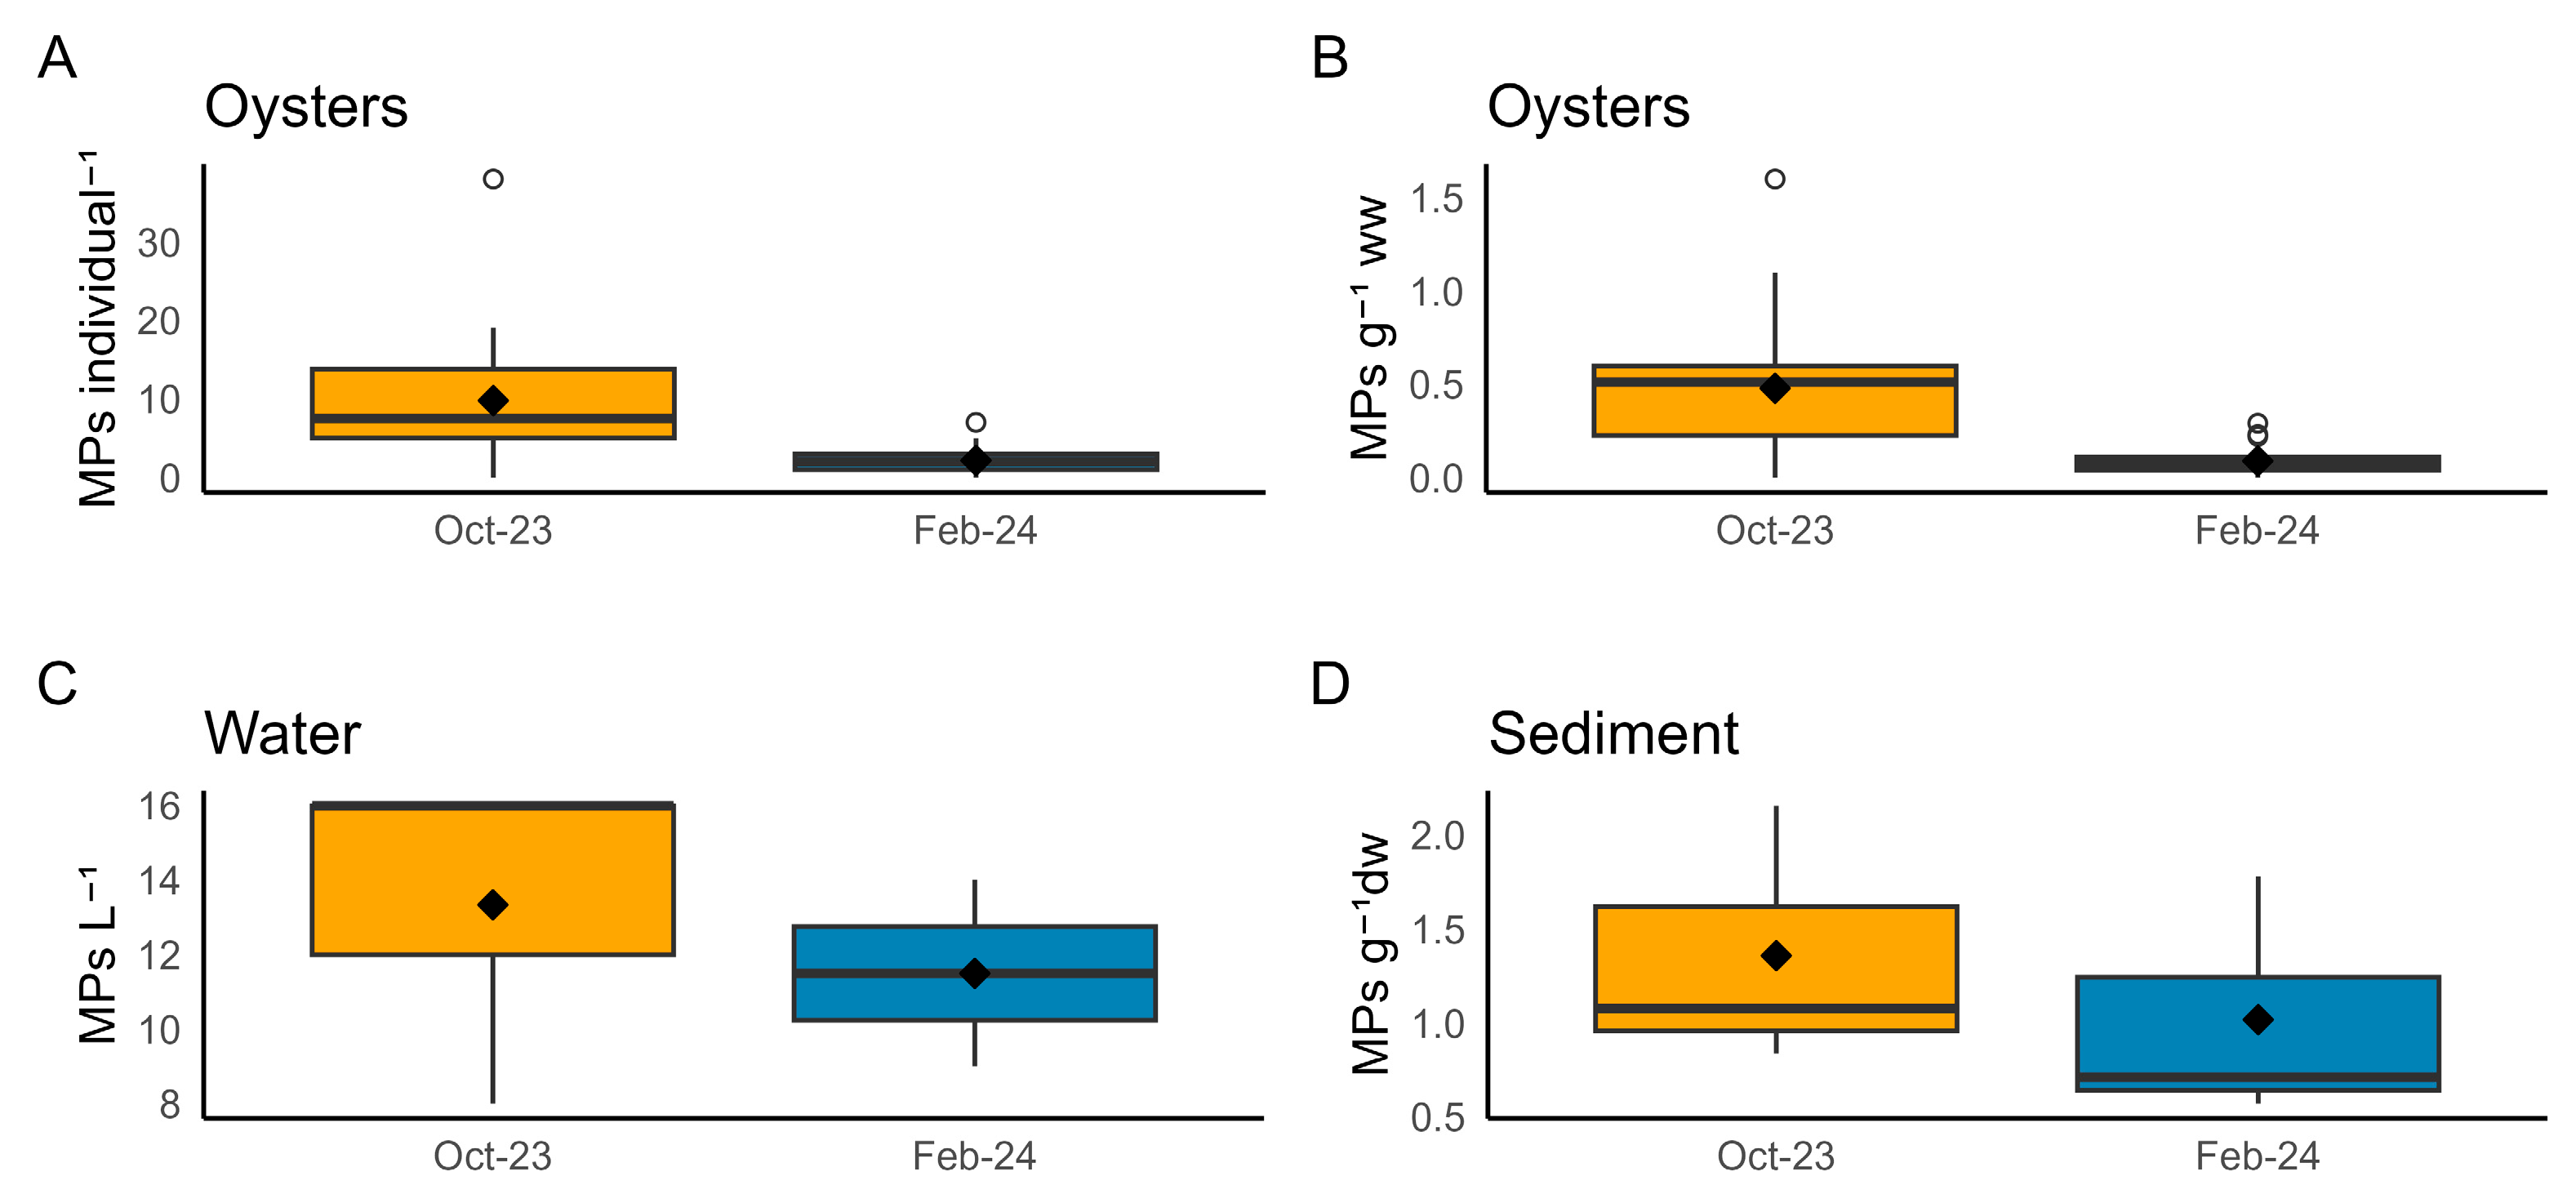
3.1. Microplastics in Oysters and Environmental Samples

MP concentrations in oysters varied significantly between seasons (Mann–Whitney U = 807.0, p < 0.001), with higher levels in autumn (mean ± SD: 9.8 ± 7.5 MPs ind−1 and 0.48 ± 0.34 MPs g−1 ww) compared to winter (2.2 ± 1.7 MPs ind−1 and 0.09 ± 0.07 MPs g−1 ww) (Table A1Appendix A, Figure 3A,B).
In environmental samples, mean concentrations in autumn were 13.3 ± 4.6 MPs L−1 in water (Figure 3C) and 1.36 ± 0.70 MPs g−1 dw in sediment (Figure 3D). In winter, concentrations were 11.5 ± 3.5 MPs L−1 in water and 0.64 ± 0.10 MPs g−1 dw in sediment. However, these seasonal differences were not statistically significantly for water or sediment (Mann–Whitney tests, p > 0.05).
Fibres were the only MP shape found across all matrices and sampling periods. A total of nine different fibre colours were identified in oysters, compared to eight in sediments and seven in surface water. In oysters, transparent fibres were dominant in both autumn (61%) and winter (60%), followed by black (11% and 19%) and grey (10% and 14%, respectively). Blue fibres were present in autumn (14%) but absent in winter. Other colours (e.g., red, green, white, orange, yellow) were rare, each contributing ≤3% of the total. Water and sediment samples also showed a predominance of transparent fibres (71% and 56%, respectively), followed by blue, black, and grey. Less common colours, including red, green, orange, pink, and purple, were detected in low proportions (≤4%) depending on the matrix and season (Figure 4A).
MP colour distributions differed significantly between oysters and sediment in both sampling periods (Fisher’s exact test, p < 0.001), and between oysters and water in winter, primarily due to the absence of blue fibres in oysters. No significant differences were observed between water and sediment (p > 0.05).
Across all samples and seasons, MPs in the 0.5–2 mm size range were the most prevalent (60–81%) (Figure 4B). In autumn, smaller MPs (<0.5 mm) were more frequent in oysters (23%) and water (20%) than in sediment (5%). In contrast, larger MPs (>2–5 mm) were more common in water (20%) and sediment (14%) than in oysters (5%). MP size distributions differed significantly among matrices in autumn (Fisher’s exact test, p < 0.05), particularly between oysters and sediment (p < 0.001), while in winter, no significant differences were observed (p > 0.05).
Polymer analysis confirmed the identity of 71 fibres (29 from oysters, 11 from water, and 31 from sediment) as plastic or cellulosic materials. Cellulose and polyethylene terephthalate (PET) were the dominant polymers in all matrices, while rayon, poly(vinyl stearate) and polypropylene (PP) were detected exclusively in oysters (Table 1). Cellulosic fibres, including rayon, were classified as anthropogenic based on their varied colours (Table 1) and thus included in the MP contamination assessment. Adipate, a plastic additive, was detected in 41% of oyster fibres, 9% in water, and 3% in sediment, and was used as a proxy of MP contamination. An additional 72 fibres analysed by FTIR showed indications of the same materials but could not be confirmed due to low spectral match percentages and insufficient signal, likely related to small fibre size. Polymer analysis of aquaculture gear (lid and basket) revealed a composition of high-density polyethylene (HDPE), a polymer not detected in any environmental or oyster samples.

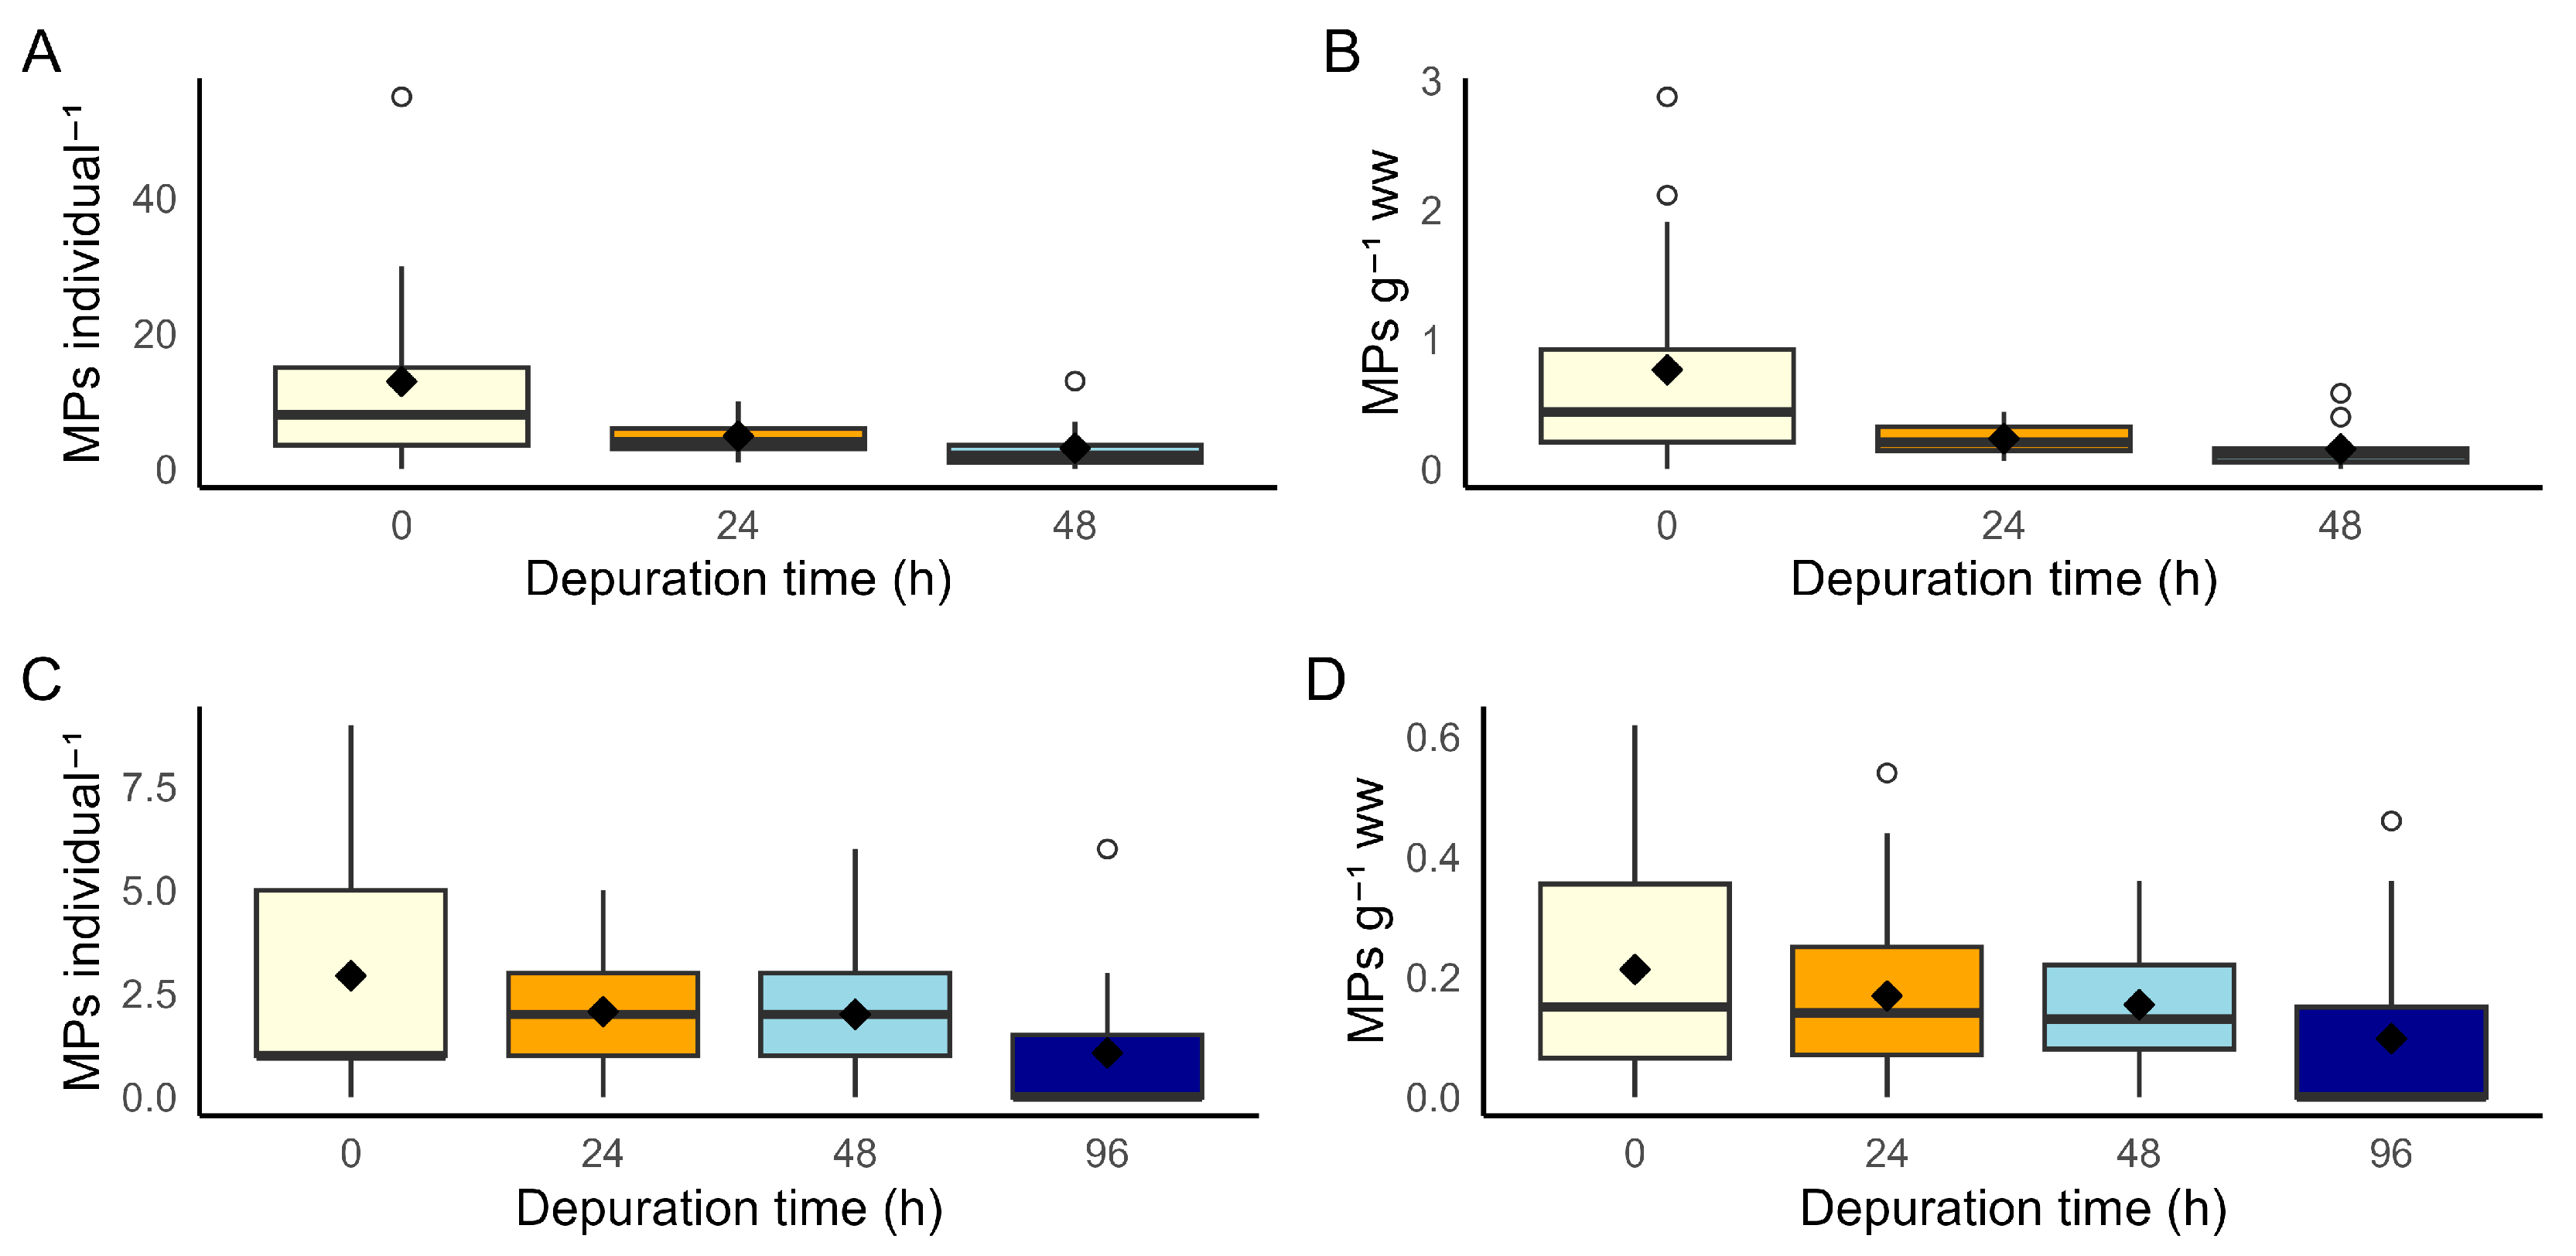
3.2. Depuration Trials

3.2.1. Laboratory Controlled Conditions

In non-depurated oysters, the initial MP abundance was 12.9 ± 14.9 MPs ind−1 and 0.77 ± 0.86 MPs g−1 ww. All visually identified MPs were fibres, predominantly transparent (61%), followed by blue (13%), grey (12%), and black (10%). Most fibres (76%) were 0.5–2 mm in length, while 16% were <0.5 mm. These patterns of MP abundance, colour, and size were consistent with those observed in oysters collected during the autumn field campaign (Section 3.2).
After 24 h of depuration, MP concentrations in oysters decreased by 66%, to 4.9 ± 2.6 MPs ind−1 and 0.23 ± 0.12 MPs g−1 ww. A further reduction was observed after 48 h, with MP levels decreasing significantly by 78% compared to initial levels, reaching 3.1 ± 3.2 MPs ind−1 (Kruskal–Wallis test H = 9.644, df = 2, p < 0.05) and 0.15 ± 0.15 MPs g−1 ww (Kruskal–Wallis test H = 11.368, df = 2, p < 0.05).
MP size and colour distributions remained unchanged throughout depuration (Fisher’s exact test, p > 0.05), with transparent fibres dominating (61%), primarily in the 0.5–2 mm size class (Figure 5A,B). Polymer analysis confirmed 41 fibres as MPs, comprising six polymer types: cellulose, polyethylene (PE) and PET were most common, followed by polyacrylate, cellophane, and rayon. Adipate was detected in 24% of the fibres (Table 1). An additional nine fibres were analysed but could not be validated due to low spectral match or technical limitations related to small fibre size. No consistent pattern in the removal of specific polymer types was observed during depuration, as polymer composition remained variable.

3.2.2. Commercial Conditions

Non-depurated oysters sourced for the commercial trial showed lower initial MP concentrations (2.9 ± 3.1 MPs ind−1 and 0.2 ± 0.2 MPs g−1 ww) than those used in the laboratory trial or in the baseline assessment of contamination. All MPs were fibres, mostly blue (48%) and transparent (39%), with grey, green, red and black fibres collectively accounting only for 14%. This colour distribution differed slightly from that of the other analysed oysters. The dominant fibre size range was 0.5–2 mm (45%), in line with the other oyster samples.
After 24 h of depuration, MP concentrations decreased by 25% to 2.1 ± 1.7 MPs ind−1 and 0.17 ± 0.16 MPs g−1 ww. Concentrations further decreased to 1.9 ± 1.6 MPs ind−1 and 0.15 ± 0.12 MPs g−1 at 48 h, and by 96 h, these had declined by 59% (1.1 ± 1.7 MPs ind−1 and 0.10 ± 0.15 MPs g−1 ww) (Figure 5C,D). Despite this trend, no statistically significant differences were found among depuration times (Kruskal–Wallis test, p > 0.05).
MP size distribution remained stable during depuration, but fibre colour proportions changed significantly over time (Fisher’s exact test, p < 0.05), with a decrease in blue fibres after 24 h and complete removal of green and red fibres. Polymer analysis identified cellulose (n = 13), polyethylene terephthalate (PET; n = 2), polypropylene (PP; n = 2), and rayon (n = 1) (Table 1). The remaining fibres (n = 13) were likely cellulose or rayon but could not be classified due to low spectral match scores (37–63%). As in the laboratory trial, no consistent pattern in polymer removal was observed, with polymer composition remaining variable throughout.

4. Discussion

4.1. MP Contamination in Farmed Oysters and Surrounding Environment

This study investigated MP presence in Pacific oysters farmed for human consumption in the Lima estuary, NW Portugal. Overall, 90% of the oysters analysed in 2023/2024 contained at least one MP in their edible tissues.
MP contamination has previously been documented in other edible bivalves from Portuguese coastal and estuarine areas, including clams and mussels [25,27,29,33]. For Pacific oysters cultivated in intertidal areas, Manthopoulos [61] reported MP concentrations of ~0.1 MPs g−1 in the Sado estuary and <0.1 MPs g−1 in the Ria de Aveiro lagoon. These values, recorded in early spring (March), are comparable to our winter measurements (February: 0.09 ± 0.07 MPs g−1), but notably lower than those observed in autumn (October: 0.48 ± 0.34 MPs g−1 ww). Another study in the Ria de Aveiro reported MP concentrations in both diploid and triploid Pacific oysters from an aquaculture site: diploid oysters contained 6.75 ± 4.97 MPs ind−1 and 2.22 ± 1.93 MPs g−1, while triploids exhibited significantly lower levels, at 1.83 ± 2.38 MPs ind−1 and 0.53 ± 0.64 MPs g−1 [36]. Given that the oysters analysed in the present study are triploid, the MP levels reported in [36] are broadly comparable to our results (0.28 ± 0.31 MPs g−1) across both sampling seasons.
Overall, the MP concentrations in oysters from this study are consistent with values reported for C. gigas in other regions, including Oregon, USA [62], China [63,64], France [65], Brazil [35,66] and Argentina [67].
MP concentrations in oysters exhibited significant temporal variation, a trend also observed in other studies in Pacific oysters [36,62,64,68]. These fluctuations likely reflect seasonal changes in environmental conditions (e.g., temperature, precipitation, river discharge) affecting the availability of MPs, and oyster physiology. In temperate regions, warmer temperatures and increased food availability during summer and autumn can enhance metabolic and filtration rates, potentially increasing MP uptake [69,70]. Conversely, winter conditions such as lower phytoplankton availability, colder temperatures, and increased freshwater input, reducing salinity, may depress filtration activity and lower MP ingestion [71]. As no significant temporal differences were observed in MP levels in water or sediment, the variation in oyster contamination is likely driven by oyster physiology rather than environmental MP availability.
Only fibres were detected across all samples, aligning with other findings worldwide that microfibres are the dominant MP shape in aquatic environments [24,28,42,44,64,72,73,74]. In bivalves, fibres typically exceed 50% of MPs, likely due to their persistence in the digestive tract [74]. Common sources of microfibres include laundered synthetic textiles [75,76,77], and degraded fishing gear [78,79,80]. Fibres displayed a range of colours, with transparent fibres being the most frequent, followed by black, grey, and blue. This pattern is consistent with prior studies in the Lima estuary [24,28], and several studies worldwide [55,62,73,81]. The dominance of transparent fibres may result from environmental weathering and colour fading [56]. For this reason, and because further colour changes may occur during sample processing [51], colour should not be the primary characteristic for MP identification. However, it remains a useful category for comparisons across different matrices. In this respect, all MP extraction protocols used in this study were previously validated to ensure MP integrity, including its colour properties.
MP colour distribution differed between oysters and environmental samples, especially sediment. Grey fibres were common in oysters but rarely found in sediment, while blue fibres were present in oysters in autumn but absent in winter, despite consistent presence in water and sediment. Such mismatches have been reported in other studies [82,83]. For instance, in the Jackson estuary (Australia), black MPs were predominant in oysters, while white MPs were more common in sediment [82]. Although sediment resuspension can increase the presence of MPs in the water column [84], potentially enhancing MPs bioavailability, our results suggest that sediment was not the primary MPs source for oysters.
Most fibres found in oysters and environmental samples ranged from 0.5–2 mm, consistent with reports from other studies [24,28,64,81]. In C. gigas, MPs are typically <2 mm [63,64,85]. In autumn, oysters contained more small MPs (<0.5 mm) than those found in sediments, suggesting selective ingestion or differential retention of MPs. These findings support the growing view that oysters may not accurately reflect MP contamination in their surrounding environment, hampering their use as bioindicators [17,37,86].
Fibres can originate from both natural and synthetic materials, making their visual identification inherently difficult and requiring spectroscopic techniques for accurate chemical characterisation. Although not all MPs retrieved from samples were analysed, FTIR results identified eight distinct polymers in oysters, compared to only two polymers in water and sediment samples. This higher polymer diversity in oysters contrasts with findings from other studies on bivalves, including Pacific oysters, where the types of polymers found closely reflected those present in the surrounding environment [55,64,87]. However, our results are consistent with [37], who also reported a broader range of polymers in C. gigas digestive tracts compared to ambient seawater. This discrepancy likely reflects the oyster’s continuous filtration activity, which exposes them to a wider and more temporally integrated array of MPs than is captured by discrete environmental samples [88]. In contrast, water and sediment samples provide only a snapshot of local MP contamination at a specific time. High-frequency environmental sampling (e.g., weekly water sampling across seasons) is needed to better capture the MPs dynamics in estuarine systems [86].
Cellulose was consistently present in all matrices and sampling periods, indicating its widespread occurrence in the studied system, similar to other studies [73,89,90]. The inclusion of cellulose and semi-synthetic cellulose-based fibres (e.g., rayon, cellophane) in MPs assessments is debated, with some studies excluding them [37], and others including them due to anthropogenic origin or association with synthetic polymers [63]. In this study, these fibres were considered based on their diverse colours and co-occurrence with synthetic polymers such as PP and polyethylene terephthalate (PET) [91]. Cellulose-based fibres are common in hygiene products (e.g., wipes, sanitary towels) often mixed with synthetic polymers [91]. PET was the second most common polymer, likely derived from textiles and wastewater treatment plant (WWTPs) effluents [92,93], in agreement with previous findings [28,35,55,89].
Other polymers detected in oysters included poly(vinyl stearate), cellophane, polyacrylate, PP, and rayon. Poly(vinyl stearate) is rarely reported in microplastic studies [94] but has been found in fish and sediments [95] and is widely used in plastic manufacturing [96]. Cellophane and rayon, derived from modified cellulose, are widely used in packaging and textiles [97]. Polyacrylate is also textile-associated [98], while PP fibres are likely linked to hygiene products [91] and maritime activities [99]. The diverse polymer types observed highlight textiles as a major potential pollution source, reinforcing the role of laundry effluent and WWTPs discharge as major MPs sources [92,93].
Although concerns have been raised about aquaculture gear contributing to MP contamination in bivalves due to the extensive use of plastic materials throughout bivalve cultivation [20], no MPs matching the polymer of the aquaculture equipment (HDPE) were detected in oysters, water, or sediment. This is consistent with other studies showing that aquaculture infrastructure is not a major MP source [35,37]. Rather, land-based sources, particularly textiles, appear to be the dominant contributors [87,100], consistent with the polymer composition observed in this study.

4.2. Depuration Efficiency

This study demonstrated that oysters are capable of effectively clearing MPs particles from their digestive systems under both controlled depuration laboratory conditions and realistic depuration commercial settings. In the laboratory, a 78% reduction in fibre concentration was achieved with 48 h of depuration. Depuration in a commercial depuration facility resulted in a 59% reduction after 96 h. These results confirmed the potential of depuration to reduce MP loads in farmed oysters within relatively short time frames, consistent with findings from previous studies [43,44].
The efficiency observed in this study surpasses that reported in earlier depuration experiments in bivalves, including C. gigas. For instance, Van Cauwenberghe & Janssen [21] reported only a 33% reduction in Mytilus edulis and 25% in C. gigas after 72 h. Covernton et al. [43] achieved a 73% reduction in C. gigas, but only after 5 days of depuration, while [44] reported a 77% reduction after 96 h. Differences in the initial MP concentration in oysters and depuration conditions, such as temperature, water quality, and system maintenance, likely contribute to the variability among studies.
The higher efficiency achieved in the laboratory likely reflects the benefits of controlled “clean” conditions, including filtered water, tank covers to minimise airborne contamination, and water change after 24 h to prevent re-ingestion of egested MPs. Replicating these conditions in facilities within commercial settings remains challenging, limiting the extent to which full MP removal can be achieved. Furthermore, MPs can adhere to tissues or accumulate in organs beyond the digestive tract [101], suggesting that depuration efficacy may also depend on the specific water conditions and oyster physiology at the time [101]. This is particularly relevant given that oysters are often consumed whole and raw, without any pre-cleansing or further processing. These findings highlight the need for further research to optimise depuration protocols and understand the factors influencing MPs retention and clearance in bivalves. Given the current lack of guidelines or regulations for assessing MPs in aquaculture products [44], establishing evidence-based best practices for depuration is essential to support the industry in delivering safer seafood.

5. Conclusions

This study confirms that commercially farmed Pacific oysters (Crassostrea gigas) in the Lima estuary are exposed to widespread microplastic (MP) contamination, primarily from land-based sources such as textiles and wastewater discharges. MPs were predominantly microfibres of anthropogenic origin, with higher concentrations detected in autumn. The mismatch between MP profiles in oysters and those in surrounding water and sediment suggests that physiological factors may influence uptake and retention, limiting the suitability of C. gigas as direct bioindicators of local MP pollution.
While depuration was shown to significantly reduce MP loads—by up to 78% under laboratory conditions—our commercial trial revealed lower and more variable removal rates, highlighting operational constraints that may limit the full potential of depuration in real-world settings. Although preliminary, these findings emphasise the need to refine depuration protocols by extending retention times, improving water filtration systems, and minimising airborne contamination during handling.
Our results also underscore the importance of upstream mitigation strategies. These should include improved capture of textile fibres at wastewater treatment plants, stricter controls on industrial discharges, and increased public awareness to reduce domestic sources of microfibres. In parallel, the establishment of standardised protocols for MP monitoring in aquaculture, alongside the development of regulatory guidance, is essential to ensure seafood safety and support sustainable shellfish farming.

Author Contributions

Conceptualisation, C.M.R.A., S.R. and V.F.; Data Curation, C.M.; Formal analysis, C.M. and V.F.; Investigation, C.M.; Methodology, C.M., D.M.S., F.E., S.M.R., R.P., C.M.R.A., S.R. and V.F.; Resources, C.M.R.A., S.R. and V.F.; Supervision, C.M.R.A., S.R. and V.F.; Validation, C.M.R.A., S.R. and V.F.; Writing—Original Draft, C.M. and V.F.; Writing—Review and Editing, F.E., S.M.R., R.P., C.M.R.A., S.R. and V.F. All authors have read and agreed to the published version of the manuscript.

Funding

This research was supported by national funds through Fundação para a Ciência e a Tecnologia, I.P. (FCT), under the strategic funding of UIDB/04423/2020, UIDP/04423/2020, and LA/P/0101/2020. PhD scholarships were granted by FCT to S.M.R. (SFRH/BD/145736/2019), D.M.S. (2020.06088.BD), and R.P. (2021.04850.BD). This study also received partial funding from the FreeLitterAT project, co-financed by the European Regional Development Fund through the Interreg Atlantic Area Programme.

Data Availability Statement

The original contributions presented in this study are included in this article. Further inquiries can be directed to the corresponding author(s).

Acknowledgments

The authors are grateful to the industry partners who provided oyster samples and granted access to their facilities, which was essential for the successful completion of this study.

Conflicts of Interest

The authors declare no conflict of interest. The funders had no role in the design of this study; in the collection, analyses, or interpretation of data; in the writing of the manuscript; or in the decision to publish the results.

Abbreviations

The following abbreviations are used in this manuscript:
MPMicroplastic
FTIRFourier-Transform Infrared Spectroscopy
PETPolyethylene terephthalate
PEPolyethylene
PPPolypropylene
HDPEHigh-density polyethylene

Appendix A

Figure A1. Schematic diagram of the depuration setups used under laboratory and commercial conditions.
Environments 12 00254 g0a1
Table A1. Biometric parameters (mean and standard deviation, SD) and microplastic (MP) abundance in commercial-size, non-depurated Pacific oysters (Crassostrea gigas) farmed in the Lima estuary. N: number of oysters analysed.
Sampling DateNShell Length (cm)Soft Tissues Wet Weight (g)Total MPsNumber (and Percentage of Total Number, %) of Oysters ContaminatedMPs per IndividualMPs g−1 wwMPs ind−1
Field assessmentOct 2023 (autumn)3080 ± 721 ± 529329 (97)0–380.5 ± 0.39.8 ± 7.5
Feb 2024 (winter)3077 ± 425 ± 36525 (83)0–70.09 ± 0.072.2 ± 1.7
Depuration trials 1Nov 2023 (laboratory)1570 ± 517 ± 219413 (87)0–550.8 ± 0.912.9 ± 14.9
Apr 2024 (commercial)1571 ± 314 ± 24412 (80)0–90.2 ± 0.22.9 ± 3.1
1 data refer to the control group, i.e., non-depurated oysters (0 h).
Table A2. Airborne contamination detected across different laboratory procedures.
Methodological ProceduresAirborne ControlsDuration of ProcedureFibres Detected per Blank
Sample preparationOpen Petri dishes with filtered deionised waterLess than 1 h0–3 transparent
0–1 black
Microplastic extractionLess than 30 min0–2 transparent
Microplastic characterisationMore than 1 h0–5 transparent
0–2 black

References

  1. Ramos, S.; Rodrigues, S.M.; Pereira, R.; Silva, D.; Almeida, C.M.R. Floatables and plastic debris in estuarine and coastal marine environments. In Treatise on Estuarine and Coastal Science, 2nd ed.; Baird, D., Elliott, M., Eds.; Elsevier: Oxford, UK, 2024; Volume 6, pp. 467–511. [Google Scholar]
  2. Xiang, Y.; Jiang, L.; Zhou, Y.; Luo, Z.; Zhi, D.; Yang, J.; Lam, S.S. Microplastics and environmental pollutants: Key interaction and toxicology in aquatic and soil environments. J. Hazard. Mater. 2022, 422, 126843. [Google Scholar] [CrossRef] [PubMed]
  3. Yu, F.; Yang, C.; Zhu, Z.; Bai, X.; Ma, J. Adsorption behavior of organic pollutants and metals on micro/nanoplastics in the aquatic environment. Sci. Total Environ. 2019, 694, 133643. [Google Scholar] [CrossRef] [PubMed]
  4. Andrady, A.L. Microplastics in the marine environment. Mar. Pollut. Bull. 2011, 62, 1596–1605. [Google Scholar] [CrossRef] [PubMed]
  5. Jambeck, J.R.; Geyer, R.; Wilcox, C.; Siegler, T.R.; Perryman, M.; Andrady, A.; Narayan, R.; Law, K.L. Plastic waste inputs from land into the ocean. Science 2015, 347, 768–771. [Google Scholar] [CrossRef] [PubMed]
  6. Galvão, A.; Aleixo, M.; De Pablo, H.; Lopes, C.; Raimundo, J. Microplastics in wastewater: Microfiber emissions from common household laundry. Environ. Sci. Pollut. Res. 2020, 27, 26643–26649. [Google Scholar] [CrossRef] [PubMed]
  7. Kumar, M.; Chen, H.; Sarsaiya, S.; Qin, S.; Liu, H.; Awasthi, M.K.; Kumar, S.; Singh, L.; Zhang, Z.; Bolan, N.S.; et al. Current research trends on micro- and nano-plastics as an emerging threat to global environment: A review. J. Hazard. Mater. 2021, 409, 124967. [Google Scholar] [CrossRef] [PubMed]
  8. Wayman, C.; Niemann, H. The fate of plastic in the ocean environment—A minireview. Environ. Sci. Process. Impacts 2021, 23, 198–212. [Google Scholar] [CrossRef] [PubMed]
  9. Kazmiruk, T.N.; Kazmiruk, V.D.; Bendell, L.I.; Magar, V. Abundance and distribution of microplastics within surface sediments of a key shellfish growing region of Canada. PLoS ONE 2018, 13, e0196005. [Google Scholar] [CrossRef] [PubMed]
  10. Amato-Lourenço, L.F.; Carvalho-Oliveira, R.; Júnior, G.R.; dos Santos Galvão, L.; Ando, R.A.; Mauad, T. Presence of airborne microplastics in human lung tissue. J. Hazard. Mater. 2021, 416, 126124. [Google Scholar] [CrossRef] [PubMed]
  11. Amelia, T.S.M.; Khalik, W.M.A.W.M.; Ong, M.C.; Shao, Y.T.; Pan, H.-J.; Bhubalan, K. Marine microplastics as vectors of major ocean pollutants and its hazards to the marine ecosystem and humans. Prog. Earth Planet. Sci. 2021, 8, 12. [Google Scholar] [CrossRef]
  12. Li, C.; Busquets, R.; Campos, L.C. Assessment of microplastics in freshwater systems: A review. Sci. Total Environ. 2020, 707, 135578. [Google Scholar] [CrossRef] [PubMed]
  13. Wang, T.; Wang, L.; Chen, Q.; Kalogerakis, N.; Ji, R.; Ma, Y. Interactions between microplastics and organic pollutants: Effects on toxicity, bioaccumulation, degradation, and transport. Sci. Total Environ. 2020, 748, 142427. [Google Scholar] [CrossRef] [PubMed]
  14. Lebreton, L.C.M.; van der Zwet, J.; Damsteeg, J.-W.; Slat, B.; Andrady, A.; Reisser, J. River plastic emissions to the world’s oceans. Nat. Commun. 2017, 8, 15611. [Google Scholar] [CrossRef] [PubMed]
  15. Qian, J.; Tang, S.; Wang, P.; Lu, B.; Li, K.; Jin, W.; He, X. From source to sink: Review and prospects of microplastics in wetland ecosystems. Sci. Total Environ. 2021, 758, 143633. [Google Scholar] [CrossRef] [PubMed]
  16. Eurostat. Aquaculture in the EU: Mussels, Oysters and Clams Among the Top Products. European Commission. 2024. Available online: https://ec.europa.eu/eurostat/web/products-eurostat-news/w/ddn-20240430-3 (accessed on 1 May 2025).
  17. Ward, J.E.; Zhao, S.; Holohan, B.A.; Mladinich, K.M.; Griffin, T.W.; Wozniak, J.; Shumway, S.E. Selective ingestion and egestion of plastic particles by the blue mussel (Mytilus edulis) and eastern oyster (Crassostrea virginica): Implications for using bivalves as bioindicators of microplastic pollution. Environ. Sci. Technol. 2019, 53, 8776–8784. [Google Scholar] [CrossRef] [PubMed]
  18. Wu, Y.; Yang, J.; Li, Z.; He, H.; Wang, Y.; Wu, H.; Xie, L.; Chen, D.; Wang, L. How does bivalve size influence microplastics accumulation? Environ. Res. 2022, 214 Pt 1, 113847. [Google Scholar] [CrossRef] [PubMed]
  19. European Food Safety Authority. Statement on the presence of microplastics and nanoplastics in food, with particular focus on seafood. EFSA J. 2016, 14, 4501–4530. [Google Scholar]
  20. Lusher, A.; Hollman, P.; Mendoza-Hill, J. Microplastics in fisheries and aquaculture: Status of knowledge on their occurrence and implications for aquatic organisms and food safety. FAO Fish. Aquac. Tech. Pap. 2017, 615, 126. [Google Scholar]
  21. Van Cauwenberghe, L.; Claessens, M.; Vandegehuchte, M.B.; Janssen, C.R. Microplastics are taken up by mussels (Mytilus edulis) and lugworms (Arenicola marina) living in natural habitats. Environ. Pollut. 2015, 199, 10–17. [Google Scholar] [CrossRef] [PubMed]
  22. EUMOFA. The EU Fish Market; Publications Office of the European Union: Luxembourg, 2024. [Google Scholar]
  23. Dias, A.C.; Almeida, C.; da Costa, T.P.; Nunes, M.L.; Marques, A.; Quinteiro, P. Environmental assessment of oyster farming from a life cycle perspective. Sustain. Prod. Consum. 2025, 54, 102–114. [Google Scholar] [CrossRef]
  24. Almeida, C.M.R.; Sáez-Zamacona, I.; Silva, D.M.; Rodrigues, S.M.; Pereira, R.; Ramos, S. The Role of Estuarine Wetlands (Saltmarshes) in Sediment Microplastics Retention. Water 2023, 15, 1382. [Google Scholar] [CrossRef]
  25. Barboza, L.G.A.; Otero, X.L.; Guilhermino, L. Microplastic contamination in marine mussels from the Atlantic coast of North Portugal and human risk of microplastic intake through mussel consumption. Environ. Pollut. 2024, 352, 124133. [Google Scholar] [CrossRef] [PubMed]
  26. Botelho, M.J.; Vale, C.; Marques, F.; Moreirinha, C.; Costa, S.T.; Guilhermino, L.; Joaquim, S.; Matias, D.; Candeias, M.; Rudnitskaya, A. One-year variation in quantity and properties of microplastics in mussels (Mytilus galloprovincialis) and cockles (Cerastoderma edule) from Aveiro lagoon. Environ. Pollut. 2023, 333, 121949. [Google Scholar] [CrossRef] [PubMed]
  27. Cozzolino, L.; de los Santos, C.B.; Zardi, G.I.; Repetto, L.; Nicastro, K.R. Microplastics in commercial bivalves harvested from intertidal seagrasses and sandbanks in the Ria Formosa lagoon, Portugal. Mar. Freshw. Res. 2021, 72, 1092–1099. [Google Scholar] [CrossRef]
  28. Espincho, F.; Pereira, R.; Rodrigues, S.M.; Silva, D.M.; Almeida, C.M.R.; Ramos, S. Assessing microplastic contamination in zooplanktonic organisms from two river estuaries. Water 2024, 16, 992. [Google Scholar] [CrossRef]
  29. Pequeno, J.; Antunes, J.; Dhimmer, V.; Bessa, F.; Sobral, P. Microplastics in marine and estuarine species from the coast of Portugal. Front. Environ. Sci. 2021, 9, 579127. [Google Scholar] [CrossRef]
  30. Prata, J.C.; da Costa, J.P.; Lopes, I.; Duarte, A.C.; Rocha-Santos, T. Environmental status of (micro)plastics contamination in Portugal. Ecotoxicol. Environ. Saf. 2020, 200, 110753. [Google Scholar] [CrossRef] [PubMed]
  31. Rodrigues, S.M.; Almeida, C.M.R.; Ramos, S. Microplastics contamination along the coastal waters of NW Portugal. Case Stud. Chem. Environ. Eng. 2020, 2, 100056. [Google Scholar] [CrossRef]
  32. Rodrigues, S.M.; Almeida, C.M.R.; Silva, D.; Cunha, J.; Antunes, C.; Freitas, V.; Ramos, S. Microplastic contamination in an urban estuary: Abundance and distribution of microplastics and fish larvae in the Douro estuary. Sci. Total Environ. 2019, 659, 1071–1081. [Google Scholar] [CrossRef] [PubMed]
  33. Marques, F.; Vale, C.; Rudnitskaya, A.; Moreirinha, C.; Costa, S.T.; Botelho, M.J. Major characteristics of microplastics in mussels from the Portuguese coast. Environ. Res. 2021, 197, 110993. [Google Scholar] [CrossRef] [PubMed]
  34. Vital, S.A.; Cardoso, C.; Avio, C.; Pittura, L.; Regoli, F.; Bebianno, M.J. Do microplastic contaminated seafood consumption pose a potential risk to human health? Mar. Pollut. Bull. 2021, 171, 112769. [Google Scholar] [CrossRef] [PubMed]
  35. Brocardo, G.S.; Saldaña-Serrano, M.; Bertoldi, C.; Miranda Gomes, C.H.A.; Nogueira, D.J.; Leonel, J.; Fernandes, A.N.; Bainy, A.C.D. Microplastics in commercial bivalves and their association with farm structures: A case study in a relevant aquaculture area of Brazil. Reg. Stud. Mar. Sci. 2025, 81, 103965. [Google Scholar] [CrossRef]
  36. Silva, D.C.C.; Borba, A.; de Sousa, H.C.; Marques, J.C.; Gonçalves, A.M.M. Microplastic pollution in marine bivalves, surface water and sediments from an aquaculture in Portugal and possible intake by humans. Reg. Stud. Mar. Sci. 2025, 85, 104146. [Google Scholar] [CrossRef]
  37. Mladinich, K.; Holohan, B.A.; Shumway, S.E.; Ward, J.E. Abundance of microplastics at and near a shellfish aquaculture farm: An eastern oyster (Crassostrea virginica) transplant study. Mar. Environ. Res. 2024, 199, 106606. [Google Scholar] [CrossRef] [PubMed]
  38. Rosa, M.; Ward, J.; Shumway, S. Selective capture and ingestion of particles by suspension-feeding bivalve molluscs: A review. J. Shellfish. Res. 2018, 37, 727–746. [Google Scholar] [CrossRef]
  39. Talbot, R.; Chang, H. Microplastics in freshwater: A global review of factors affecting spatial and temporal variations. Environ. Pollut. 2022, 292, 118393. [Google Scholar] [CrossRef] [PubMed]
  40. Lerebours, A.; Bathie, M.; Kazour, M.; Amara, R.; Huet, V.; Thomas, H. Spatio-temporal contamination of microplastics in shellfish farming regions: A case study. Mar. Pollut. Bull. 2022, 181, 113842. [Google Scholar] [CrossRef] [PubMed]
  41. Lee, R.; Lovatelli, A.; Ababouch, L.; FAO Fisheries and Aquaculture Division. Bivalve Depuration: Fundamental and Practical Aspects; FAO: Rome, Italy, 2008. [Google Scholar]
  42. Birnstiel, S.; Soares-Gomes, A.; da Gama, B.A.P. Depuration reduces microplastic content in wild and farmed mussels. Mar. Pollut. Bull. 2019, 140, 241–247. [Google Scholar] [CrossRef] [PubMed]
  43. Covernton, G.A.; Dietterle, M.; Pearce, C.M.; Gurney-Smith, H.J.; Dower, J.F.; Dudas, S.E. Depuration of anthropogenic particles by Pacific oysters (Crassostrea gigas): Feasibility and efficacy. Mar. Pollut. Bull. 2022, 181, 113886. [Google Scholar] [CrossRef] [PubMed]
  44. Paul, A.T.; Hannon, C.; Švonja, M.; Connellan, I.; Frias, J. Efficacy of microplastic depuration on two commercial oyster species from the west coast of Ireland. J. World Aquac. Soc. 2023, 54, 1217–1234. [Google Scholar] [CrossRef]
  45. Graham, P.; Palazzo, L.; de Lucia, G.A.; Telfer, T.C.; Baroli, M.; Carboni, S. Microplastics uptake and egestion dynamics in Pacific oysters, Magallana gigas (Thunberg, 1793), under controlled conditions. Environ. Pollut. 2019, 252, 742–748. [Google Scholar] [CrossRef] [PubMed]
  46. Weinstein, J.E.; Ertel, B.M.; Gray, A.D. Accumulation and depuration of microplastic fibers, fragments, and tire particles in the eastern oyster, Crassostrea virginica: A toxicokinetic approach. Environ. Pollut. 2022, 308, 119681. [Google Scholar] [CrossRef] [PubMed]
  47. Ramos, S.; Cabral, H.; Elliott, M. Do fish larvae have advantages over adults and other components for assessing estuarine ecological quality? Ecol. Indic. 2015, 55, 74–85. [Google Scholar] [CrossRef]
  48. Amorim, E.; Ramos, S.; Elliott, M.; Franco, A.; Bordalo, A.A. Habitat loss and gain: Influence on habitat attractiveness for estuarine fish communities. Estuar. Coast. Shelf Sci. 2017, 197, 244–257. [Google Scholar] [CrossRef]
  49. European Union. Commission Implementing Regulation (EU) 2019/627 of 15 March 2019—Laying down Uniform Practical Arrangements for the Performance of Official Controls on Products of Animal Origin Intended for Human Consumption in Accordance with Regulation (EU) 2017/625. Off. J. Eur. Union. 2019, L131, 51–100. [Google Scholar]
  50. Gadelha, J.R.; Rocha, A.C.; Camacho, C.; Eljarrat, E.; Peris, A.; Aminot, Y.; Readman, J.W.; Boti, V.; Nannou, C.; Kapsi, M.; et al. Persistent and emerging pollutants assessment on aquaculture oysters (Crassostrea gigas) from NW Portuguese coast (Ria de Aveiro). Sci. Total Environ. 2019, 666, 731–742. [Google Scholar] [CrossRef] [PubMed]
  51. Shumway, S.E.; Mladinich, K.; Blaschik, N.; Holohan, B.A.; Ward, J.E. A critical assessment of microplastics in molluscan shellfish with recommendations for experimental protocols, animal husbandry, publication, and future research. Rev. Fish. Sci. Aquacult. 2023, 1–133. [Google Scholar] [CrossRef]
  52. Silva, D.M.; Almeida, C.M.R.; Guardiola, F.; Rodrigues, S.M.; Ramos, S. Optimization of an Analytical Protocol for the Extraction of Microplastics from Seafood Samples with Different Levels of Fat. Molecules 2022, 27, 5172. [Google Scholar] [CrossRef] [PubMed]
  53. Rivoira, L.; Castiglioni, M.; Rodrigues, S.M.; Freitas, V.; Bruzzoniti, M.C.; Ramos, S.; Almeida, C.M.R. Microplastic in marine environment: Reworking and optimisation of two analytical protocols for the extraction of microplastics from sediments and oysters. MethodsX 2020, 7, 101116. [Google Scholar] [CrossRef] [PubMed]
  54. Rodrigues, S.M.; Almeida, C.M.R.; Ramos, S. Adaptation of a laboratory protocol to quantify microplastics contamination in estuarine waters. MethodsX 2019, 6, 740–749. [Google Scholar] [CrossRef] [PubMed]
  55. Cho, Y.; Shim, W.J.; Jang, M.; Han, G.M.; Hong, S.H. Nationwide monitoring of microplastics in bivalves from the coastal environment of Korea. Environ. Pollut. 2021, 270, 116175. [Google Scholar] [CrossRef] [PubMed]
  56. Jang, M.; Shim, W.J.; Cho, Y.; Han, G.M.; Song, Y.K.; Hong, S.H. A close relationship between microplastic contamination and coastal area use pattern. Water Res. 2020, 171, 115400. [Google Scholar] [CrossRef] [PubMed]
  57. European Commission; Joint Research Centre. Guidance on the Monitoring of Marine Litter in European Seas: An Update to Improve the Harmonised Monitoring of Marine Litter under the Marine Strategy Framework Directive; Publications Office of the European Union: Luxembourg, 2021.
  58. Silva, D.M.; Almeida, C.M.R.; Guardiola, F.A.; Pereira, R.; Rodrigues, S.M.; Ramos, S. Uncovering Microplastics Contamination in Canned Seafood. Food Chem. 2024, 448, 139049. [Google Scholar] [CrossRef] [PubMed]
  59. Wickham, H. ggplot2: Elegant Graphics for Data Analysis; Springer: New York, NY, USA, 2016. [Google Scholar]
  60. Ogle, D.H.; Wheeler, P.; Dinno, A. FSA: Fisheries Stock Analysis, R Package Version 0.8.26; Computer Software. 2019. Available online: https://github.com/droglenc/FSA (accessed on 15 November 2024).
  61. Manthopoulos, M. Presence of Microplastic in Commercial Bivalves along the Portuguese Coast, Comparing Different Aquaculture Systems. Master’s Thesis, University of Algarve, Portugal, 2022. Available online: http://hdl.handle.net/10400.1/19188 (accessed on 25 June 2025).
  62. Baechler, B.R.; Granek, E.F.; Hunter, M.V.; Conn, K.E. Microplastic concentrations in two Oregon bivalve species: Spatial, temporal, and species variability. Limnol. Oceanogr. Lett. 2020, 5, 54–65. [Google Scholar] [CrossRef]
  63. Ding, J.; Sun, C.; He, C.; Li, J.; Ju, P.; Li, F. Microplastics in four bivalve species and basis for using bivalves as bioindicators of microplastic pollution. Sci. Total Environ. 2021, 782, 146830. [Google Scholar] [CrossRef] [PubMed]
  64. Du, Y.; Zhao, J.; Teng, J.; Ren, J.; Zheng, P.; Zhu, X.; Liu, Y.; Sun, X.; Yuan, S.; Wang, Q. Seasonal change of microplastics uptake in the Pacific oysters Crassostrea gigas cultured in the Yellow Sea and Bohai Sea, China. Mar. Pollut. Bull. 2022, 185, 114341. [Google Scholar] [CrossRef] [PubMed]
  65. Phuong, N.N.; Poirier, L.; Pham, Q.T.; Lagarde, F.; Zalouk-Vergnoux, A. Factors influencing the microplastic contamination of bivalves from the French Atlantic coast: Location, season and/or mode of life? Mar. Pollut. Bull. 2018, 129, 664–674. [Google Scholar] [CrossRef] [PubMed]
  66. Saldaña-Serrano, M.; Bastolla, C.L.V.; Mattos, J.J.; Lima, D.; Freire, T.B.; Nogueira, D.J.; De-la-Torre, G.E.; Righetti, B.P.H.; Zacchi, F.L.; Gomes, C.H.A.M.; et al. Microplastics and linear alkylbenzene levels in oysters Crassostrea gigas driven by sewage contamination at an important aquaculture area of Brazil. Chemosphere 2022, 307, 136039. [Google Scholar] [CrossRef] [PubMed]
  67. Fernández-González, V.; Andrade, J.M.; Ferreiro, B.; López-Mahía, P.; Muniategui-Lorenzo, S. Monitorization of polyamide microplastics weathering using attenuated total reflectance and microreflectance infrared spectrometry. Spectrochim. Acta A Mol. Biomol. Spectrosc. 2021, 263, 120162. [Google Scholar] [CrossRef] [PubMed]
  68. Ruangpanupan, N.; Ussawarujikulchai, A.; Prapagdee, B.; Chavanich, S. Seasonal variation in the abundance of microplastics in three commercial bivalves from Bandon Bay, Gulf of Thailand. Mar. Pollut. Bull. 2023, 197, 115600. [Google Scholar] [CrossRef] [PubMed]
  69. Dridi, S.; Romdhane, M.S.; Elcafsi, M.H. Seasonal variation in weight and biochemical composition of the Pacific oyster, Crassostrea gigas, in relation to the gametogenic cycle and environmental conditions of the Bizert lagoon, Tunisia. Aquaculture 2007, 263, 238–248. [Google Scholar] [CrossRef]
  70. Mao, Y.; Zhou, Y.; Yang, H.; Wang, R. Seasonal variation in metabolism of cultured Pacific oyster, Crassostrea gigas, in Sanggou Bay, China. Aquaculture 2006, 253, 322–333. [Google Scholar] [CrossRef]
  71. Barr, J.M.; Munroe, D.; Rose, J.M.; Calvo, L.; Cheng, K.M.; Bayer, S.; Kreeger, D. Seasonal Feeding Behavior of Aquaculture Eastern Oysters (Crassostrea virginica) in the Mid-Atlantic. Estuaries Coasts 2024, 47, 789–804. [Google Scholar] [CrossRef]
  72. Rezania, S.; Park, J.; Md Din, M.F.; Mat Taib, S.; Talaiekhozani, A.; Kumar Yadav, K.; Kamyab, H. Microplastics pollution in different aquatic environments and biota: A review of recent studies. Mar. Pollut. Bull. 2018, 133, 191–208. [Google Scholar] [CrossRef] [PubMed]
  73. Truchet, D.M.; López, A.D.F.; Ardusso, M.G.; Rimondino, G.N.; Buzzi, N.S.; Malanca, F.E.; Spetter, C.V.; Severini, M.D.F. Microplastics in Bivalves, Water and Sediments from a Touristic Sandy Beach of Argentina. Mar. Pollut. Bull. 2021, 173, 113023. [Google Scholar] [CrossRef] [PubMed]
  74. Zhang, S.; Ding, J.; Razanajatovo, R.M.; Jiang, H.; Zou, H.; Zhu, W. Interactive effects of polystyrene microplastics and roxithromycin on bioaccumulation and biochemical status in the freshwater fish red tilapia (Oreochromis niloticus). Sci. Total Environ. 2019, 648, 1431–1439. [Google Scholar] [CrossRef] [PubMed]
  75. Cesa, F.S.; Turra, A.; Baruque-Ramos, J. Synthetic fibers as microplastics in the marine environment: A review from textile perspective with a focus on domestic washings. Sci. Total Environ. 2017, 598, 1116–1129. [Google Scholar] [CrossRef] [PubMed]
  76. De Falco, F.; Di Pace, E.; Cocca, M.; Avella, M. The contribution of washing processes of synthetic clothes to microplastic pollution. Sci. Rep. 2019, 9, 6633. [Google Scholar] [CrossRef] [PubMed]
  77. Sillanpää, M.; Sainio, P. Release of polyester and cotton fibers from textiles in machine washings. Environ. Sci. Pollut. Res. 2017, 24, 19313–19321. [Google Scholar] [CrossRef] [PubMed]
  78. Sharma, D.; Dhanker, R.; Bhawna; Tomar, A.; Raza, S.; Sharma, A. Fishing gears and nets as a source of microplastic. In Microplastic Pollution; Shahnawaz, M., Adetunji, C.O., Dar, M.A., Zhu, D., Eds.; Springer: Singapore, 2024; pp. 127–140. [Google Scholar] [CrossRef]
  79. Wright, L.S.; Napper, I.E.; Thompson, R.C. Potential microplastic release from beached fishing gear in Great Britain’s region of highest fishing litter density. Mar. Pollut. Bull. 2021, 173, 113115. [Google Scholar] [CrossRef] [PubMed]
  80. Zhang, X.; Li, S.; Liu, Y.; Yu, K.; Zhang, H.; Yu, H.; Jiang, J. Neglected microplastics pollution in the nearshore surface waters derived from coastal fishery activities in Weihai, China. Sci. Total Environ. 2021, 768, 144484. [Google Scholar] [CrossRef] [PubMed]
  81. Hossain, M.J.; AftabUddin, S.; Akhter, F.; Nusrat, N.; Rahaman, A.; Sikder, M.N.A.; Monwar, M.M.; Chowdhury, M.S.N.; Jiang, S.; Shi, H.; et al. Surface water, sediment, and biota: The first multi-compartment analysis of microplastics in the Karnafully river, Bangladesh. Mar. Pollut. Bull. 2022, 180, 113820. [Google Scholar] [CrossRef] [PubMed]
  82. Jahan, S.; Strezov, V.; Weldekidan, H.; Kumar, R.; Kan, T.; Sarkodie, S.A.; He, J.; Dastjerdi, B.; Wilson, S.P. Interrelationship of microplastic pollution in sediments and oysters in a seaport environment of the eastern coast of Australia. Sci. Total Environ. 2019, 695, 133924. [Google Scholar] [CrossRef] [PubMed]
  83. Wang, D.; Su, L.; Ruan, H.D.; Chen, J.; Lu, J.; Lee, C.-H.; Jiang, S.Y. Quantitative and qualitative determination of microplastics in oyster, seawater and sediment from the coastal areas in Zhuhai, China. Mar. Pollut. Bull. 2021, 164, 112000. [Google Scholar] [CrossRef] [PubMed]
  84. Xia, F.; Yao, Q.; Zhang, J.; Wang, D. Effects of seasonal variation and resuspension on microplastics in river sediments. Environ. Pollut. 2021, 286, 117403. [Google Scholar] [CrossRef] [PubMed]
  85. Wootton, N.; Sarakinis, K.; Varea, R.; Reis-Santos, P.; Gillanders, B.M. Microplastic in oysters: A review of global trends and comparison to southern Australia. Chemosphere 2022, 307, 136065. [Google Scholar] [CrossRef] [PubMed]
  86. Zhu, J.; Zhang, Q.; Huang, Y.; Jiang, Y.; Li, J.; Michal, J.J.; Jiang, Z.; Xu, Y.; Lan, W. Long-term trends of microplastics in seawater and farmed oysters in the Maowei Sea, China. Environ. Pollut. 2021, 273, 116450. [Google Scholar] [CrossRef] [PubMed]
  87. Zhu, J.; Zhang, Q.; Li, Y.; Tan, S.; Kang, Z.; Yu, X.; Lan, W.; Cai, L.; Wang, J.; Shi, H. Microplastic pollution in the Maowei Sea, a typical mariculture bay of China. Sci. Total Environ. 2019, 658, 62–68. [Google Scholar] [CrossRef] [PubMed]
  88. Newell, R.I.E. Ecosystem influences of natural and cultivated populations of suspension-feeding bivalve molluscs: A review. J. Shellfish. Res. 2004, 23, 51–61. [Google Scholar]
  89. Ding, J.; Sun, C.; Li, J.; Shi, H.; Xu, X.; Ju, P.; Jiang, F.; Li, F. Microplastics in global bivalve mollusks: A call for protocol standardization. J. Hazard. Mater. 2022, 438, 129490. [Google Scholar] [CrossRef] [PubMed]
  90. Ribeiro, V.V.; Nobre, C.R.; Moreno, B.B.; Semensatto, D.; Sanz-Lazaro, C.; Moreira, L.B.; Castro, Í.B. Oysters and mussels as equivalent sentinels of microplastics and natural particles in coastal environments. Sci. Total Environ. 2023, 874, 162468. [Google Scholar] [CrossRef] [PubMed]
  91. Ó Briain, O.; Marques Mendes, A.R.; McCarron, S.; Healy, M.G.; Morrison, L. The role of wet wipes and sanitary towels as a source of white microplastic fibres in the marine environment. Water Res. 2020, 182, 116021. [Google Scholar] [CrossRef] [PubMed]
  92. Hernandez, E.; Nowack, B.; Mitrano, D.M. Polyester textiles as a source of microplastics from households: A mechanistic study to understand microfiber release during washing. Environ. Sci. Technol. 2017, 51, 7036–7046. [Google Scholar] [CrossRef] [PubMed]
  93. Šaravanja, A.; Pušić, T.; Dekanić, T. Microplastics in wastewater by washing polyester fabrics. Materials 2022, 15, 2285. [Google Scholar] [CrossRef] [PubMed]
  94. Wang, C.; Zhao, J.; Xing, B. Environmental source, fate, and toxicity of microplastics. J. Hazard. Mater. 2021, 407, 124357. [Google Scholar] [CrossRef] [PubMed]
  95. Hussien, N.A.; Mohammadein, A.; Tantawy, E.M.; Khattab, Y.; Al Malki, J.S. Investigating microplastics and potentially toxic elements contamination in canned Tuna, Salmon, and Sardine fishes from Taif markets, KSA. Open Life Sci. 2021, 16, 827–837. [Google Scholar] [CrossRef] [PubMed]
  96. Gooch, J.W. Polyvinyl stearate. In Encyclopedic Dictionary of Polymers; Gooch, J.W., Ed.; Springer: New York, NY, USA, 2011; p. 578. [Google Scholar] [CrossRef]
  97. Wu, F.; Wang, Y.; Leung, J.Y.S.; Huang, W.; Zeng, J.; Tang, Y.; Chen, J.; Shi, A.; Yu, X.; Xu, X.; et al. Accumulation of microplastics in typical commercial aquatic species: A case study at a productive aquaculture site in China. Sci. Total Environ. 2020, 708, 135432. [Google Scholar] [CrossRef] [PubMed]
  98. Della Torre, C.; Riccardi, N.; Magni, S.; Modesto, V.; Fossati, M.; Binelli, A. First comparative assessment of contamination by plastics and non-synthetic particles in three bivalve species from an Italian sub-alpine lake. Environ. Pollut. 2023, 330, 121752. [Google Scholar] [CrossRef] [PubMed]
  99. Xue, B.; Zhang, L.; Li, R.; Wang, Y.; Guo, J.; Yu, K.; Wang, S. Underestimated microplastic pollution derived from fishery activities and “hidden” in deep sediment. Environ. Sci. Technol. 2020, 54, 2210–2217. [Google Scholar] [CrossRef] [PubMed]
  100. Covernton, G.A.; Collicutt, B.; Gurney-Smith, H.J.; Pearce, C.M.; Dower, J.F.; Ross, P.S.; Dudas, S.E. Microplastics in bivalves and their habitat in relation to shellfish aquaculture proximity in coastal British Columbia, Canada. Aquac. Environ. Interact. 2019, 11, 357–374. [Google Scholar] [CrossRef]
  101. Kolandhasamy, P.; Su, L.; Li, J.; Qu, X.; Jabeen, K.; Shi, H. Adherence of microplastics to soft tissue of mussels: A novel way to uptake microplastics beyond ingestion. Sci. Total Environ. 2018, 610–611, 635–640. [Google Scholar] [CrossRef] [PubMed]
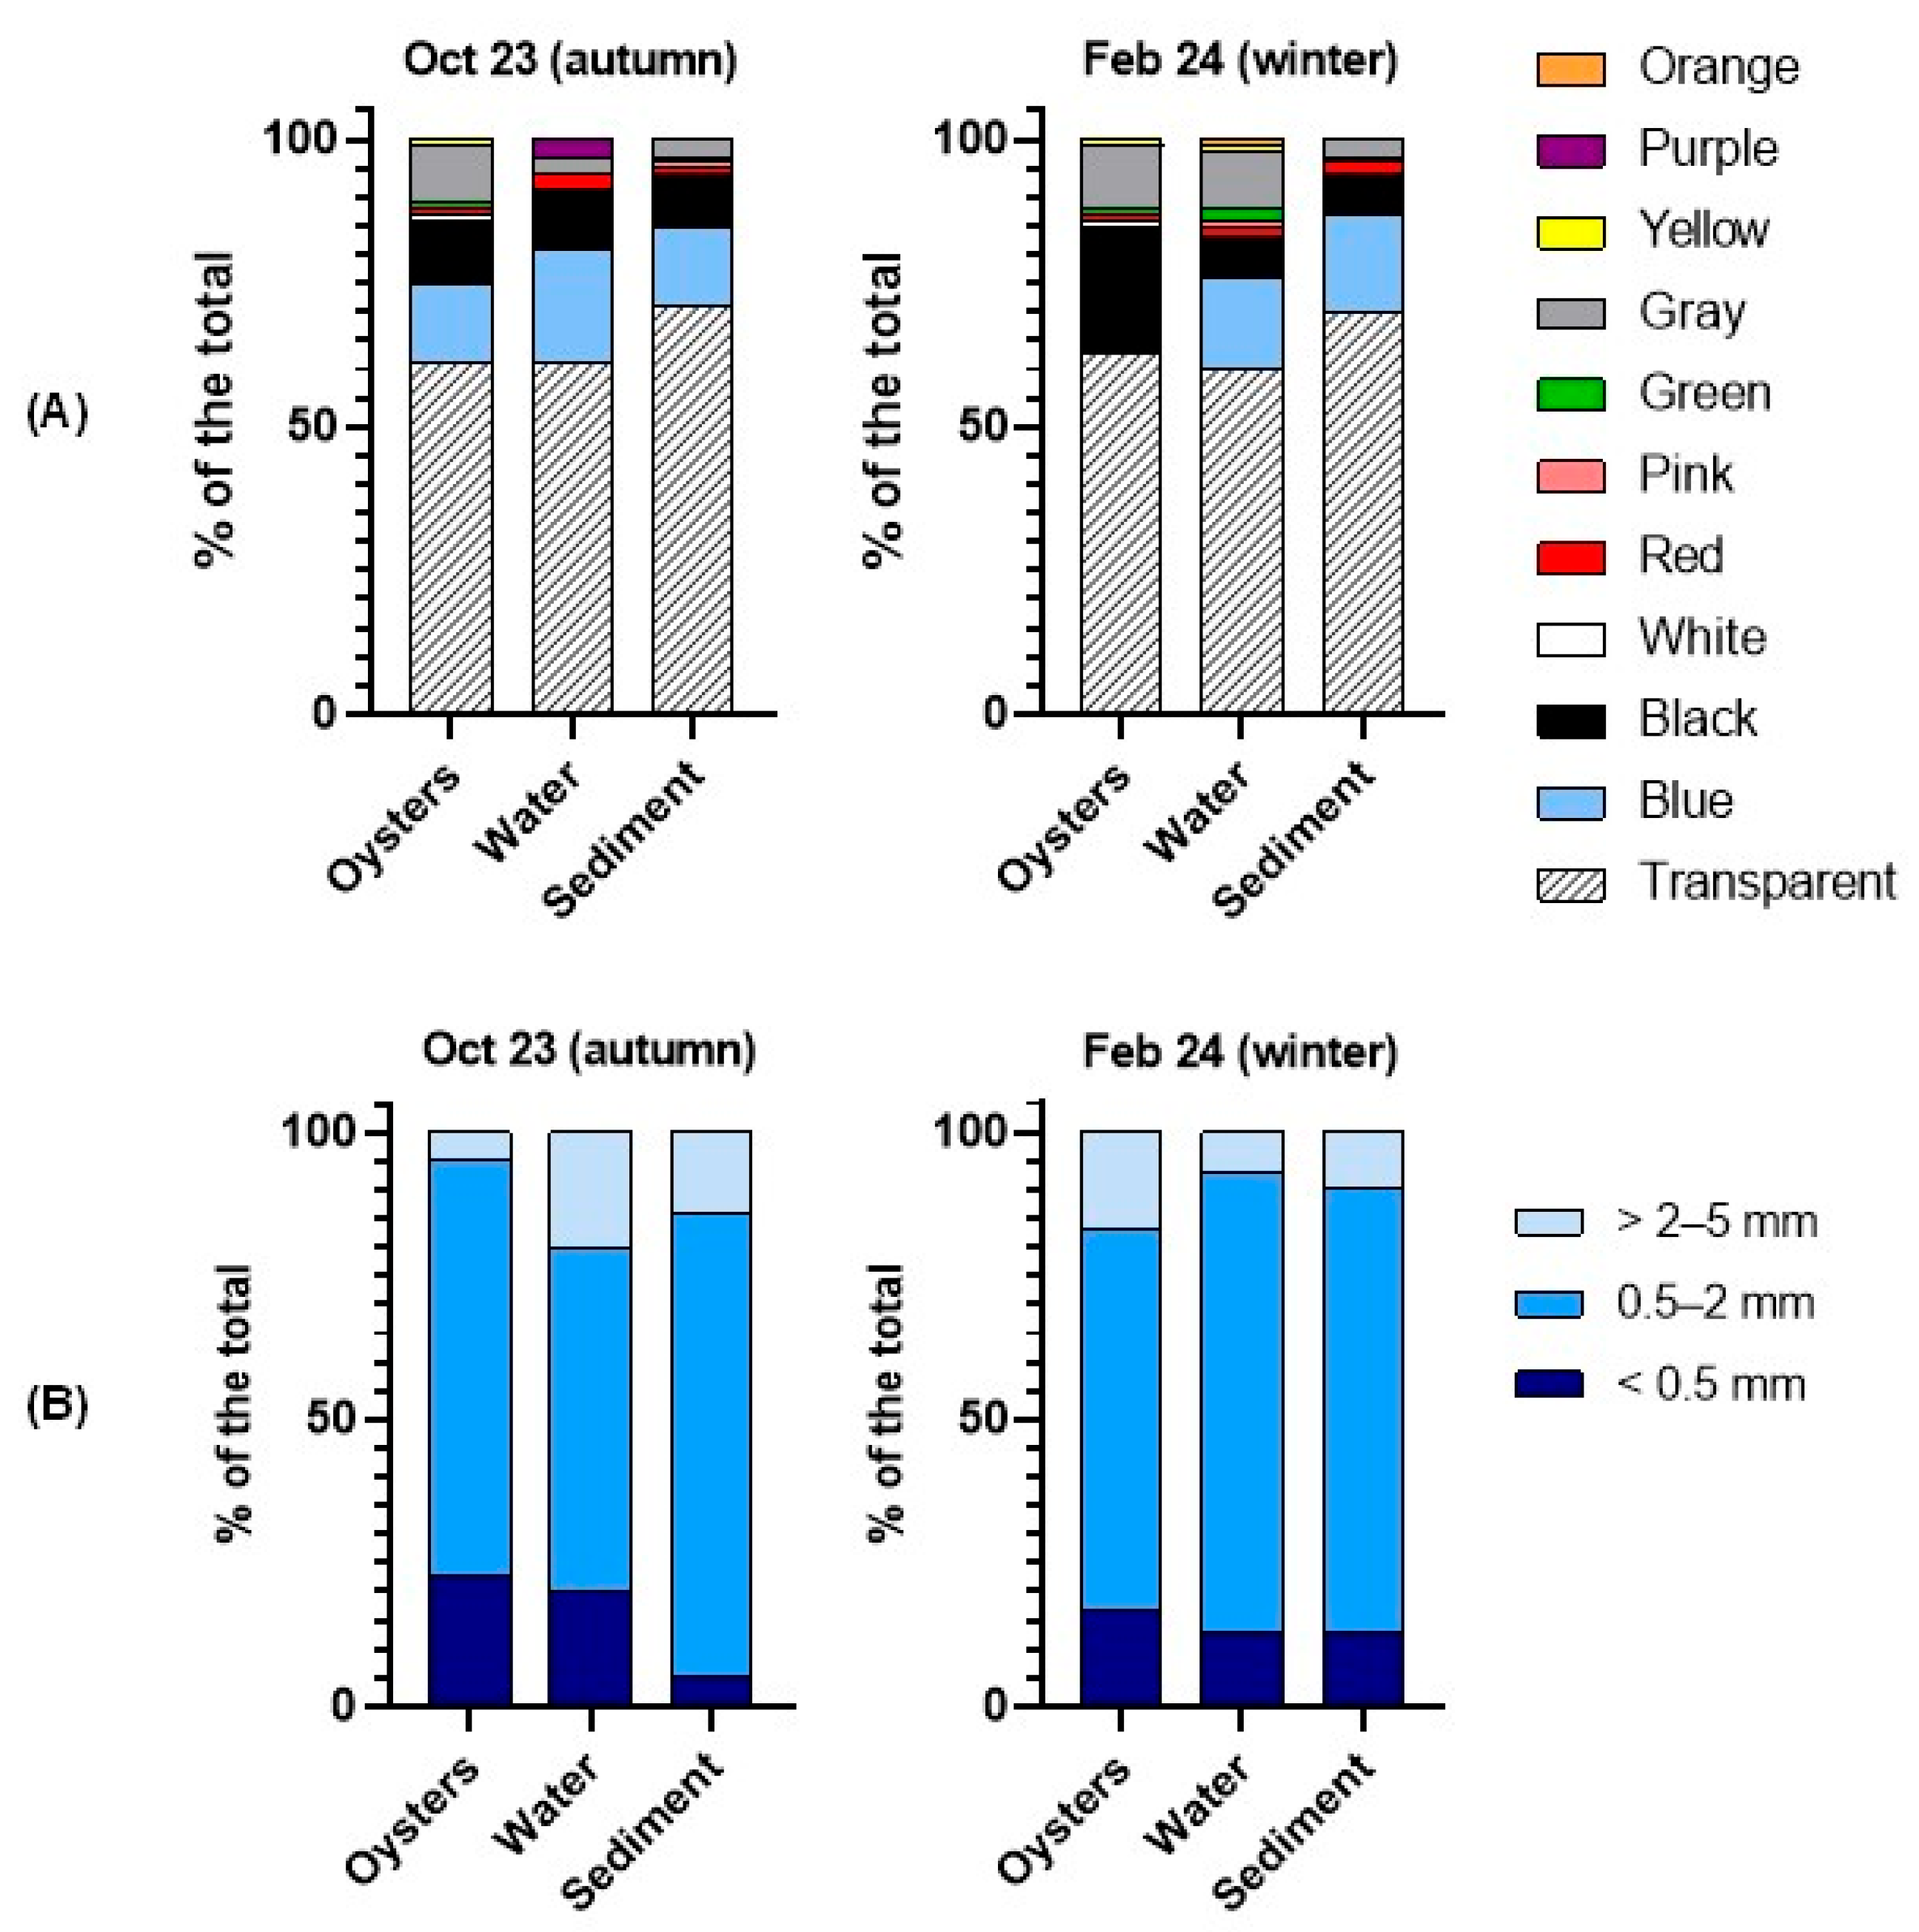
Figure 1. Location of the oyster farm in the Lima estuary (NW Portugal) (A), and general view of the oyster cultivation system at low tide (B).
Environments 12 00254 g001
Figure 2. Experimental depuration setup including (A) a water bath to keep water temperature constant, and (B) experimental tanks with oysters covered with glass lids to prevent airborne contamination.
Environments 12 00254 g002
Figure 3. Microplastic (MP) concentrations in oyster (A,B), water (C), and sediment (D) samples collected during autumn (October 2023) and winter (February 2024). Oyster data are expressed as MPs per individual (A) and MPs per gram of wet weight (B). Boxplots show the median (central line), interquartile range (boxes), mean (black diamonds), and outliers (white dots).
Environments 12 00254 g003
Figure 4. Distribution of microplastics (MPs) by colour (A) and size (B) in oysters, water and sediment samples collected in autumn (October 2023) and winter (February 2024).
Environments 12 00254 g004
Figure 5. Microplastic (MP) concentrations in oysters over depuration time, expressed per individual oyster (A,C) and per gram of wet weight (B,D), under laboratory (upper panel) and commercial (lower panel) conditions. Boxplots show the median (central line), interquartile range (boxes), mean (black diamonds), and outliers (white dots) beyond the whiskers.
Environments 12 00254 g005
Table 1. Polymer types and characteristics of the microplastics (MPs) detected in oysters, water, and sediment samples from the Lima estuary (NW Portugal), identified through FTIR spectroscopy. Abbreviations: PET = polyethylene terephthalate, PE = polyethylene, PP = polypropylene.
Sampling DateSamplesNumber and Colour of FibresPolymer Type
Field assessmentOctober 2023
(autumn)
Oysters3 transparent, 2 blue, 1 grey and 1 blackAdipate
4 transparent, 3 grey and 1 blackCellulose
2 black and 2 transparentPET
Water 1--
Sediment1 transparentAdipate
7 transparent, 2 grey, 5 blue and 1 redCellulose
February 2024 (winter)Oysters2 transparent, 1 blue and 1 greenAdipate
1 black and 1 blueCellulose
1 transparentPP
1 blackPoly(vinyl stearate)
1 black and 1 greyRayon
Water1 blueAdipate
4 blue and 3 transparentCellulose
2 black and 1 greyPET
Sediment10 transparent, 1 grey and 1 blueCellulose
1 transparent and 1 bluePET
Depuration trialsNovember 2023 (laboratory)Oysters1 green, 5 blue, 1 black, 1 transparent, 1 grey and 1 greenAdipate
4 grey, 3 transparent, 3 black, 3 blue, 1 purple, 1 green and 1 redCellulose
1 transparent, 1 grey and 1 blueCellophane
1 transparent and 1 blackPolyacrylate
3 transparent and 1 blackPET
3 transparent, 1 yellow and 1 blackPE
1 transparentRayon
April 2024 (commercial)Oysters6 transparent, 5 blue, 1 black and 1 greyCellulose
1 grey and 1 blackPET
1 transparent and 1 bluePP
1 transparentRayon
1 Polymer type could not be identified due to the low size of MPs and/or low matching scores with the FTIR reference library.
Disclaimer/Publisher’s Note: The statements, opinions and data contained in all publications are solely those of the individual author(s) and contributor(s) and not of MDPI and/or the editor(s). MDPI and/or the editor(s) disclaim responsibility for any injury to people or property resulting from any ideas, methods, instructions or products referred to in the content.

