1. Introduction
Indoor air quality (IAQ) in schools plays a critical role in the health, well-being, and academic performance of students and staff [
1]. Schools are unique environments where large numbers of students spend extended periods in enclosed spaces, making air quality a crucial factor in the overall learning experience [
2]. Maintaining good IAQ is essential to safeguarding the health of both students and staff, as poor air quality can contribute to allergen and pollutant exposure, transmission of respiratory pathogens, and difficulty in concentration, all of which can hinder students’ ability to learn and thrive [
3]. Several factors contribute to poor IAQ, including inadequate ventilation, elevated carbon dioxide (CO
2) levels, particulate matter (PM), and volatile organic compounds (VOCs). These pollutants have been linked to respiratory problems, reduced cognitive function, and increased absenteeism [
4]. Studies indicate that classroom ventilation is often insufficient, leading to CO
2 concentrations exceeding recommended thresholds, which negatively impact student performance and comfort [
5]. Additionally, exposure to indoor pollutants such as allergens, mold spores, and traffic-related air pollution has been associated with asthma exacerbation and other respiratory conditions in children [
6]. For the urban schools, the students are mainly transported by their parents’ cars. Therefore, car engine emissions could also be one of the important particulate matter (PM) sources [
7], especially at school entrances or parking lots [
8,
9]. In addition, if a school is located near a highway or a busy traffic street, the school air quality could also be affected by the road traffic [
10,
11]. The PM produced during the combustion process in engines is primarily due to incomplete combustion, which is often referred to as soot, and consists of a mixture of solid particles and liquid droplets [
12,
13]. The U.S. Environmental Protection Agency (EPA) emphasizes the importance of proper ventilation, air filtration, and pollutant source control in maintaining good IAQ in schools [
14]. Strategies such as increasing outdoor air exchange, using air purifiers, and regularly maintaining HVAC systems can significantly improve classroom air quality [
15], fostering a healthier environment for students and staff alike.
Recent studies underscore the impact of IAQ on student health and academic performance. The EPA highlights that poor IAQ in schools can lead to health issues such as respiratory illnesses and allergies, contributing to higher absenteeism rates and lower academic achievement [
14]. Research has shown that inadequate ventilation frequently results in elevated CO
2‚ levels, which can impair cognitive functions such as concentration and memory. A recent study reinforces the importance of maintaining optimal CO
2‚ levels through proper ventilation to support student performance [
16]. The COVID-19 pandemic has further emphasized the need for improved IAQ in educational settings. One study investigated whether improving classroom air quality with air purifiers can help reduce student absenteeism [
17]. Similarly, high-efficiency particulate air (HEPA) filter units in classrooms were found to significantly lower particulate matter and airborne viral RNA concentrations, thereby enhancing IAQ [
18]. Furthermore, studies suggest that poor IAQ can negatively affect students’ cognitive abilities. Research indicates that exposure to indoor pollutants can hinder students’ ability to concentrate and perform academically [
19]. Recognizing these challenges, many schools are taking steps to improve IAQ. For example, Richmond Public Schools in California (USA) received
$15.3 million in federal funding to enhance energy efficiency and air quality in 22 schools, aiming to create healthier learning environments and improve student outcomes [
20]. Collectively, these studies and initiatives highlight the critical need for maintaining good IAQ in schools to protect student health and enhance educational performance.
School cleaning policies also play an important role in maintaining IAQ through regular cleaning practices such as dusting, proper waste disposal, and timely filter replacement for portable air cleaners (PACs). These activities contribute significantly to PAC performance and help reduce the accumulation of dust, mold, and other allergens. Additionally, the physical arrangement of classrooms, including desk spacing and student movement, can influence air circulation. Crowded or poorly organized spaces may restrict airflow, while more open layouts can improve ventilation and reduce pollutant buildup [
21]. In addition, teacher preferences could also affect IAQ in naturally ventilated schools [
22].
This study examines the impact of teachers’ decisions and other factors on IAQ in mechanically ventilated school classrooms, where air quality is influenced by both centrally controlled HVAC systems and individually operated PACs. The use of the open-faced air sampler can help us to identify the differences between outdoor and indoor PMs for both morphologies and element compositions, therefore helping us to demonstrate the benefits of the use of PACs in mechanically ventilated classrooms [
23]. One of the studies aims to identify common sources of indoor pollutants and assess their effects on students and staff. Rather than intervening or providing instructions to teachers, this research focuses on monitoring real-world classroom conditions. It explores how teachers’ management of ventilation, PAC usage, and site-specific factors influence air quality. Conducting an after study survey to understand how the teacher handled their classroom and explain the reasons and thoughts why they operate the classroom in their way. These communications can help us further understand the monitoring results. By understanding the various factors that affect IAQ, this study seeks to provide insights and recommendations for schools and teachers to improve air quality, ultimately fostering healthier and more conducive learning environments.
The objectives of this study were to utilize low-cost sensors to monitor daily indoor air quality patterns over time, assess the power consumption of PACs to understand their usage, compare indoor and outdoor PM concentrations between weekdays and weekends, track CO2 concentration patterns during school and non-school days, evaluate the effects of ventilation conditions, PAC usage, and teachers’ decisions on classroom air quality, and analyze differences in PM morphology and chemistry between indoor and outdoor environments. Ultimately, this study aimed to highlight the significant role teachers play in managing classroom air quality through their decisions regarding ventilation, cleanliness, and PAC usage. The findings will demonstrate how an increased awareness of these factors can contribute to a healthier learning environment for students and staff.
2. Materials and Methods
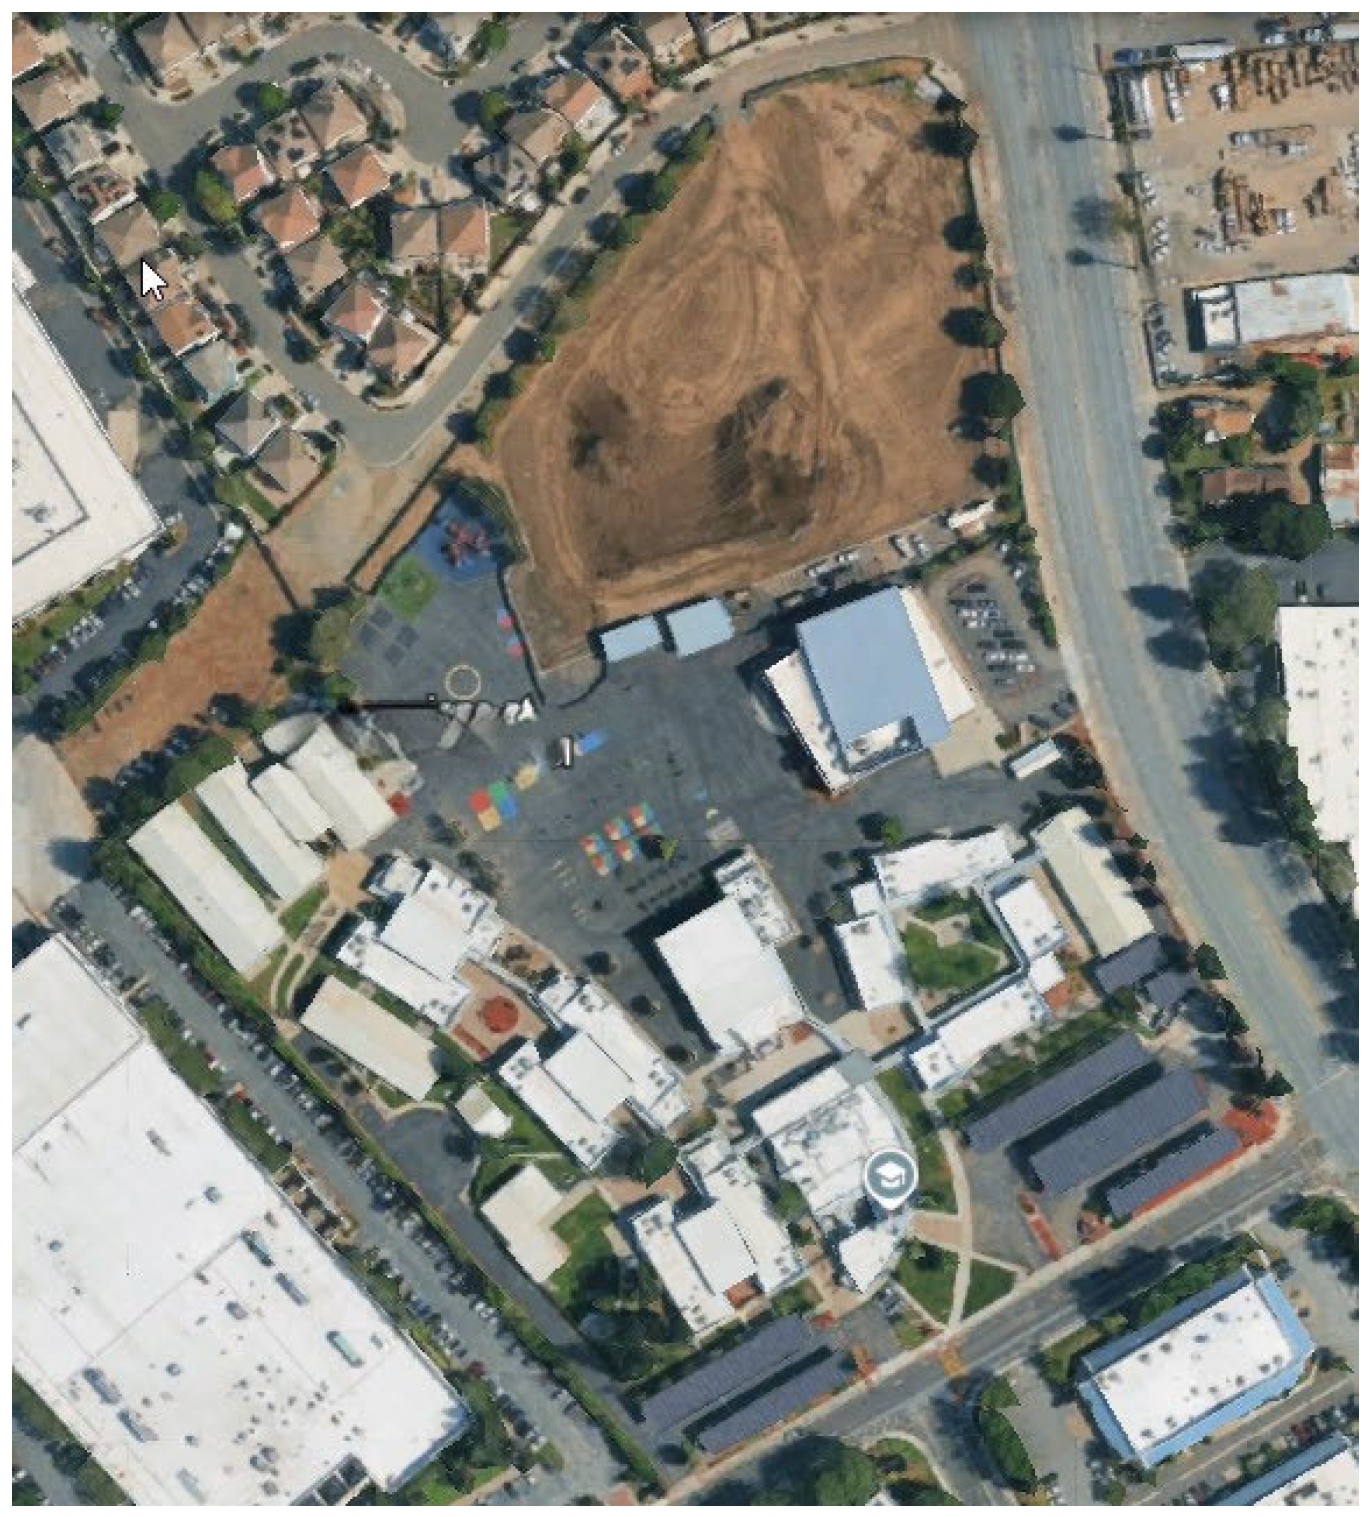
This pilot study was conducted in four mechanically ventilated classrooms at a kindergarten through eighth grade (K–8) school in San Jose, California. The school occupied an entire block and was bordered by roads on each side, as shown in
Figure 1. Traffic was generally light during the daytime, with increased activity in the mornings and afternoons when parents drop off and pick up children. There was an unpaved playground where physical education classes and games took place. Dust from the playground could potentially affect the school’s air quality.
Each classroom had its own separate but identical mechanical ventilation system equipped with MERV 13 filters (Aerostar MERV 13 filter, Coral Springs, FL 33065, USA), and the ventilation rates across the classrooms were comparable. The outdoor air dampers were set to a fixed position, allowing an outdoor air fraction of approximately 15–18%. The supply and return airflow rates for each classroom were measured using a balometer (CH-15D Standard Hood, Evergreen Telemetry, Mesa, AZ, USA), and the values were converted to air changes per hour (ACH). The supply ACH was approximately 12 for Classrooms 1, 3, and 4, while Classroom 2 had an ACH of about 13. The HVAC systems were scheduled to operate two hours before classes began and continued running until two hours after classes ended.
In addition to mechanical ventilation, each classroom was equipped with a portable air cleaner (PAC) with HEPA filters (medical-grade H13 True HEPA filters). The PACs used in Classrooms 1, 3, and 4 were Alen BreatheSmart 75i True HEPA Air Purifiers (Alen Corporation, Austin, TX, USA), typically set at level 2, which corresponds to an airflow rate of approximately 314 m3/h (184 cfm), based on the manufacturer’s specifications. The PAC used in Classroom 2 was a Medify Air MA-112 (Medify Air, Boca Raton, FL, USA), typically set at level 2, which corresponds to an airflow rate of approximately 491 m3/h (289.2 cfm), also based on the manufacturer’s specifications. For the classrooms in this study (volume: 260 m3), these settings correspond to clean air delivery rates (CADR) of approximately 1.2 and 1.9 ACH, respectively.
Mechanical ventilation was controlled by the operation of the central HVAC system managed by the school facility manager, but the PAC was controlled by the individual teacher of each classroom. The HVAC filters normally were changed every three months, but the HEPA filters for PAC were changed every 12 to 15 months.
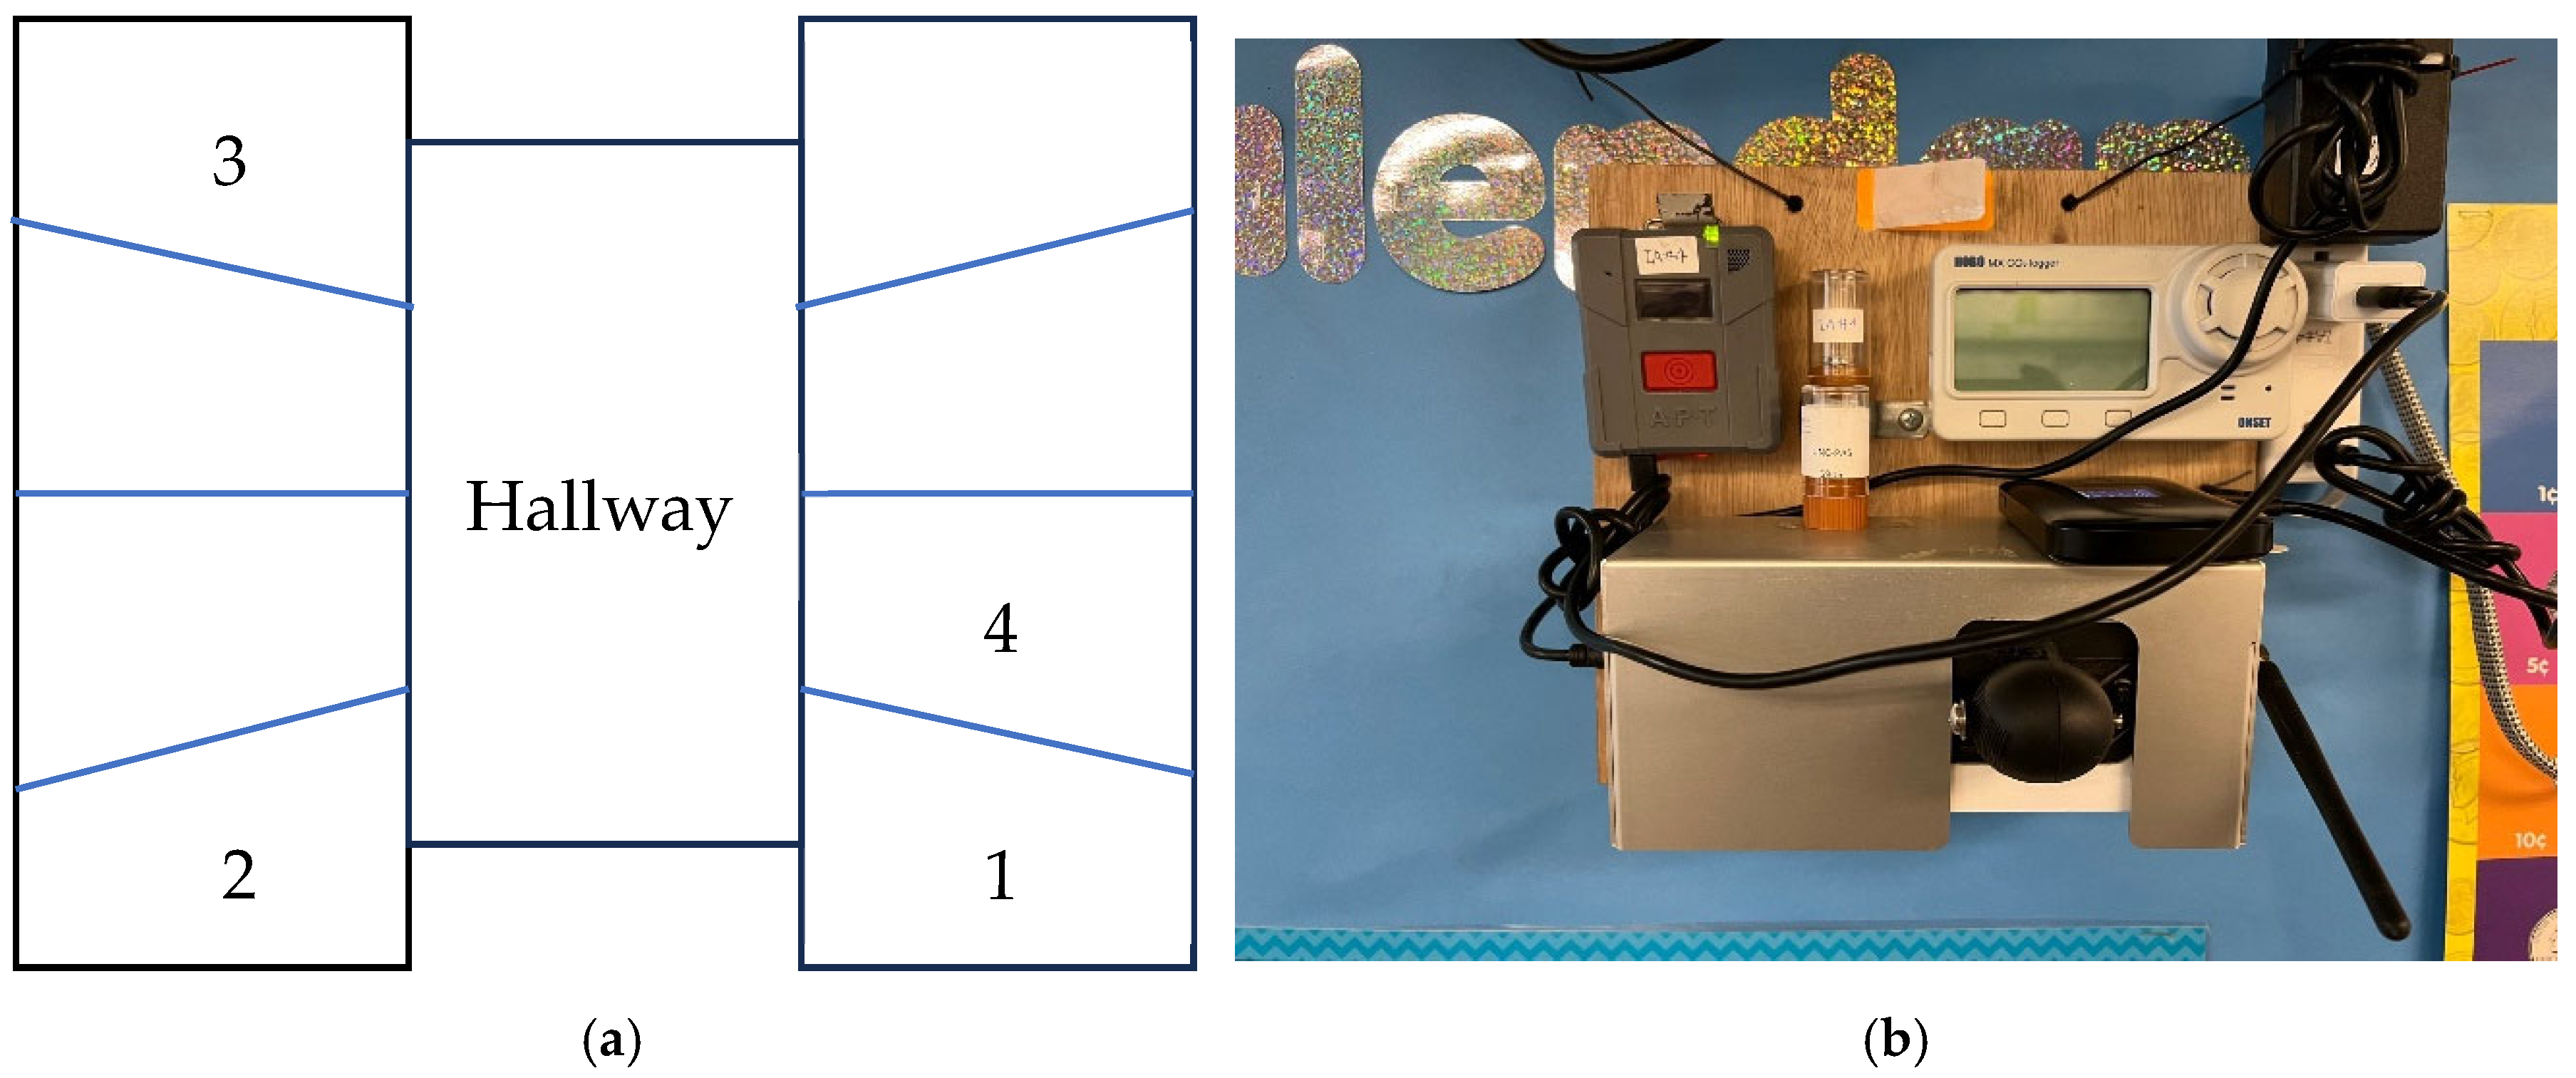
The layout of the classrooms is shown in
Figure 2a. This school was chosen due to its similar structure for each classroom and established ventilation systems, which provided a controlled environment to evaluate the impact of PACs and other IAQ factors. The selected classrooms were representative of typical school settings [
24], ensuring the findings could be applicable to similar educational environments. Each classroom had similar characteristics, including an area of approximately 260 m
2, a comparable number of students (19–22), and carpeted floors. Each classroom had two doors, one opening towards the hallway and the other opening towards the outside. Each classroom also had two windows opening to the outside.
For air monitoring, we installed the following devices and collected the following measurements: (1) two outdoor and two indoor sensors for each of four classrooms; (2) a PAC with a power consumption monitor in each classroom; (3) measurements of classroom dimensions, flooring type, and student occupant numbers; (4) bolometer measurements of total supply airflow to the classrooms and return airflow; and (5) microscopy analyses of Open-Face Passive Samplers (OPS) and used PAC filters for particle morphology and particle element composition. For more details on the parameters measured and the instruments and sensors used, refer to our previous publication [
25].
The duration of the operation of the PACs and selected IAQ parameters was continuously monitored over a seven-week period, from 25 April 2022 to 9 June 2022. The monitored IAQ parameters included particulate matter (PM2.5 and PM10), carbon dioxide (CO2) levels, temperature, and relative humidity (RH), providing a comprehensive view of the classroom environments. The monitors were installed during the school’s spring break (18–22 April 2022).
Each classroom was equipped with a sampling board that included a low-cost PM sensor, an OPS [
23], and a data logger with sensors for CO
2, temperature, and RH. These sampling boards were mounted on a side wall at a height of approximately 1.6–1.8 m from the floor and at least 2 m away from doors and operable windows (
Figure 2b). The PM sensor functioned using light-scattering technology and was remotely calibrated by the manufacturer. Two types of sensors, Clarity Nodes (Clarity, Berkeley, CA, USA) and APT Sensors (Applied Particulate Technology, St. Louis, MO, USA), were used in this study. The CO
2 sensor (HOBO MAX 1102A, ONSET, Bourne, MA, USA) operated on nondispersive infrared (NDIR) technology. Additionally, a plug load data recorder (ONSET, Bourne, MA, USA) was connected to each PAC to monitor its power consumption, allowing for the tracking of the duration of PAC operation and fan speed.
Field visits were conducted before and after this study to gather details about the classrooms, such as dimensions, floor material, and the type of PAC used. The selected classrooms for Grade 1 and 2 students were expected to have consistent groups of occupants daily. Attendance records were collected from the school office. There was an unpaved playground or soccer field at the school, located near the outdoor PM sensors. The school holds physical education (PE) classes for all grade levels, and we observed students playing on the playground during school hours. Visible dust was suspended from the playground surface while the children were playing, and this was also detected by the outdoor passive samplers.
To analyze particle morphology and chemical composition, OPS were installed indoors and outdoors. Understanding particle morphology and chemistry helps identify the sources of particulate matter, such as distinguishing between natural and anthropogenic particles, and the chemical composition provides additional insights into potential health impacts. This combined analysis is critical for assessing IAQ and determining effective mitigation strategies. The samplers and PAC filters were analyzed using scanning electron microscopy (SEM) to determine particle size, shape, and elemental composition. A new PAC filter was also analyzed for comparison purposes.
PM sensors measured both PM
2.5 and PM
10 concentrations, although this study focused on PM
2.5 due to accuracy concerns with PM
10 measurements from low-cost sensors [
23,
26]. The PM
2.5 data were analyzed for school hours, and indoor/outdoor (I/O) ratios and percent indoor reductions from outdoor PM
2.5 levels were calculated for each classroom.
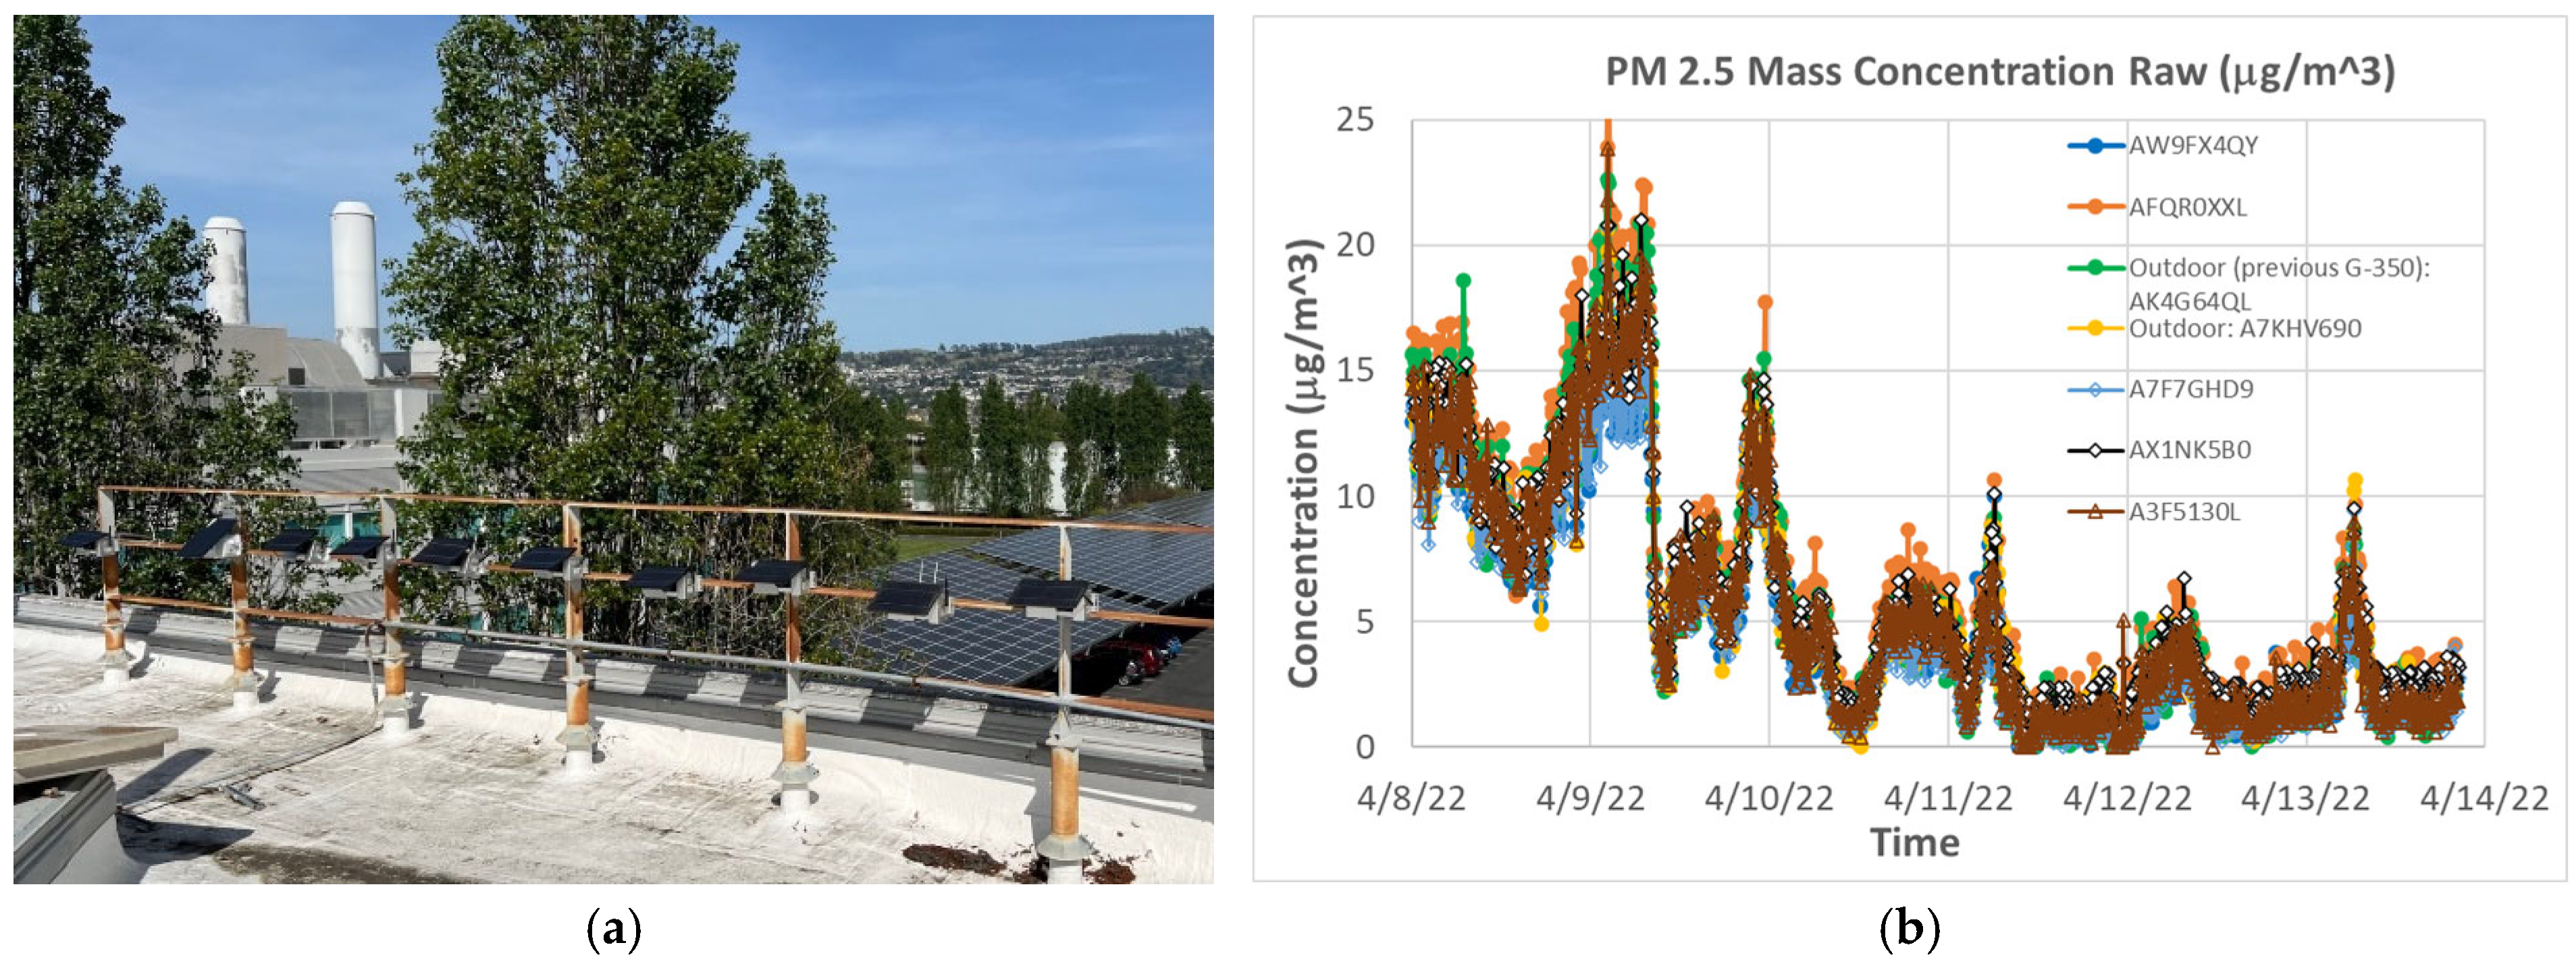
While low-cost sensors provide accessible and continuous monitoring, they have limitations in accuracy and sensitivity compared to high-end instruments. These limitations could introduce variability in the data, particularly under extreme environmental conditions, which should be considered when interpreting the results. Before deploying, the sensors were placed on the roof of the California Department of Public Health in Richmond for two weeks to conduct a comparison study of the two sensor types, as shown in
Figure 3a. This comparison study included data consultations by both vendors and enabled us to choose the best units for reliable deployment in the field.
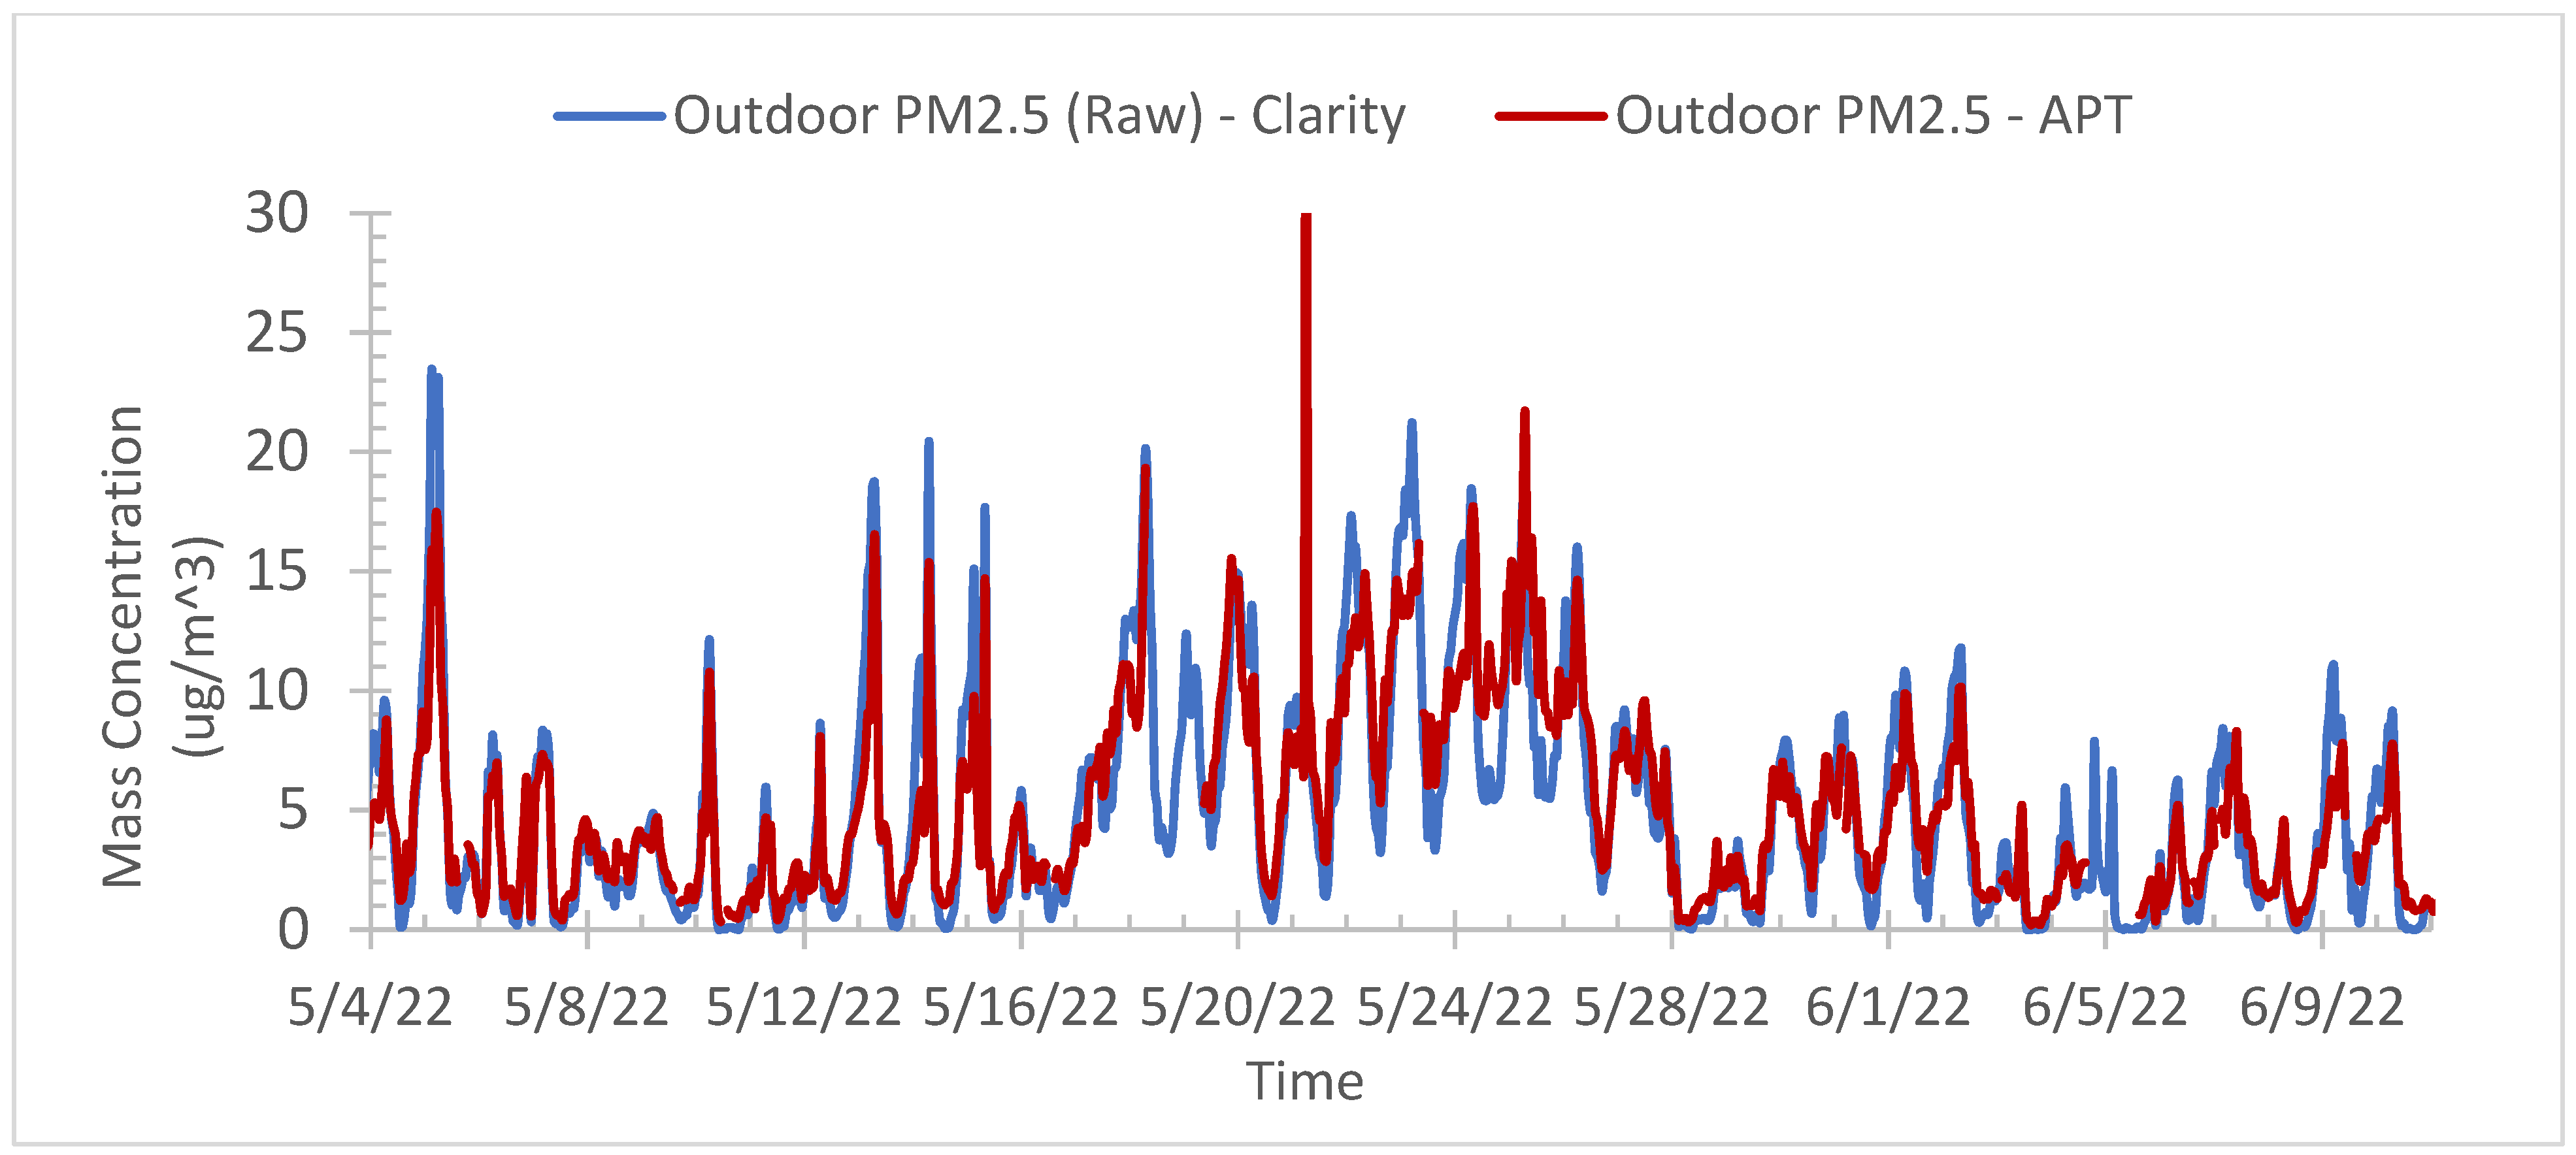
Figure 3b shows the comparison of the seven clarity sensors’ measurement results, and they have traced each other very well. The comparison between the Clarity Nodes and APT sensors is shown in
Figure 4.
No direct guidance or suggestions were provided to teachers or school staff, i.e., teachers managed ventilation and PACs as usual based on their own preferences. Teachers’ decisions that could affect air quality included the operation of PACs, the opening of doors and windows during class time, and the use of ventilation systems
3. Results and Discussion
Real-time PM
2.5 concentrations measured by the two sensor types used in the classrooms showed that they tracked closely with each other and demonstrated consistent trends over time. While there are slight differences in peak values, the timing of the peaks is nearly identical, as shown in
Figure 4.
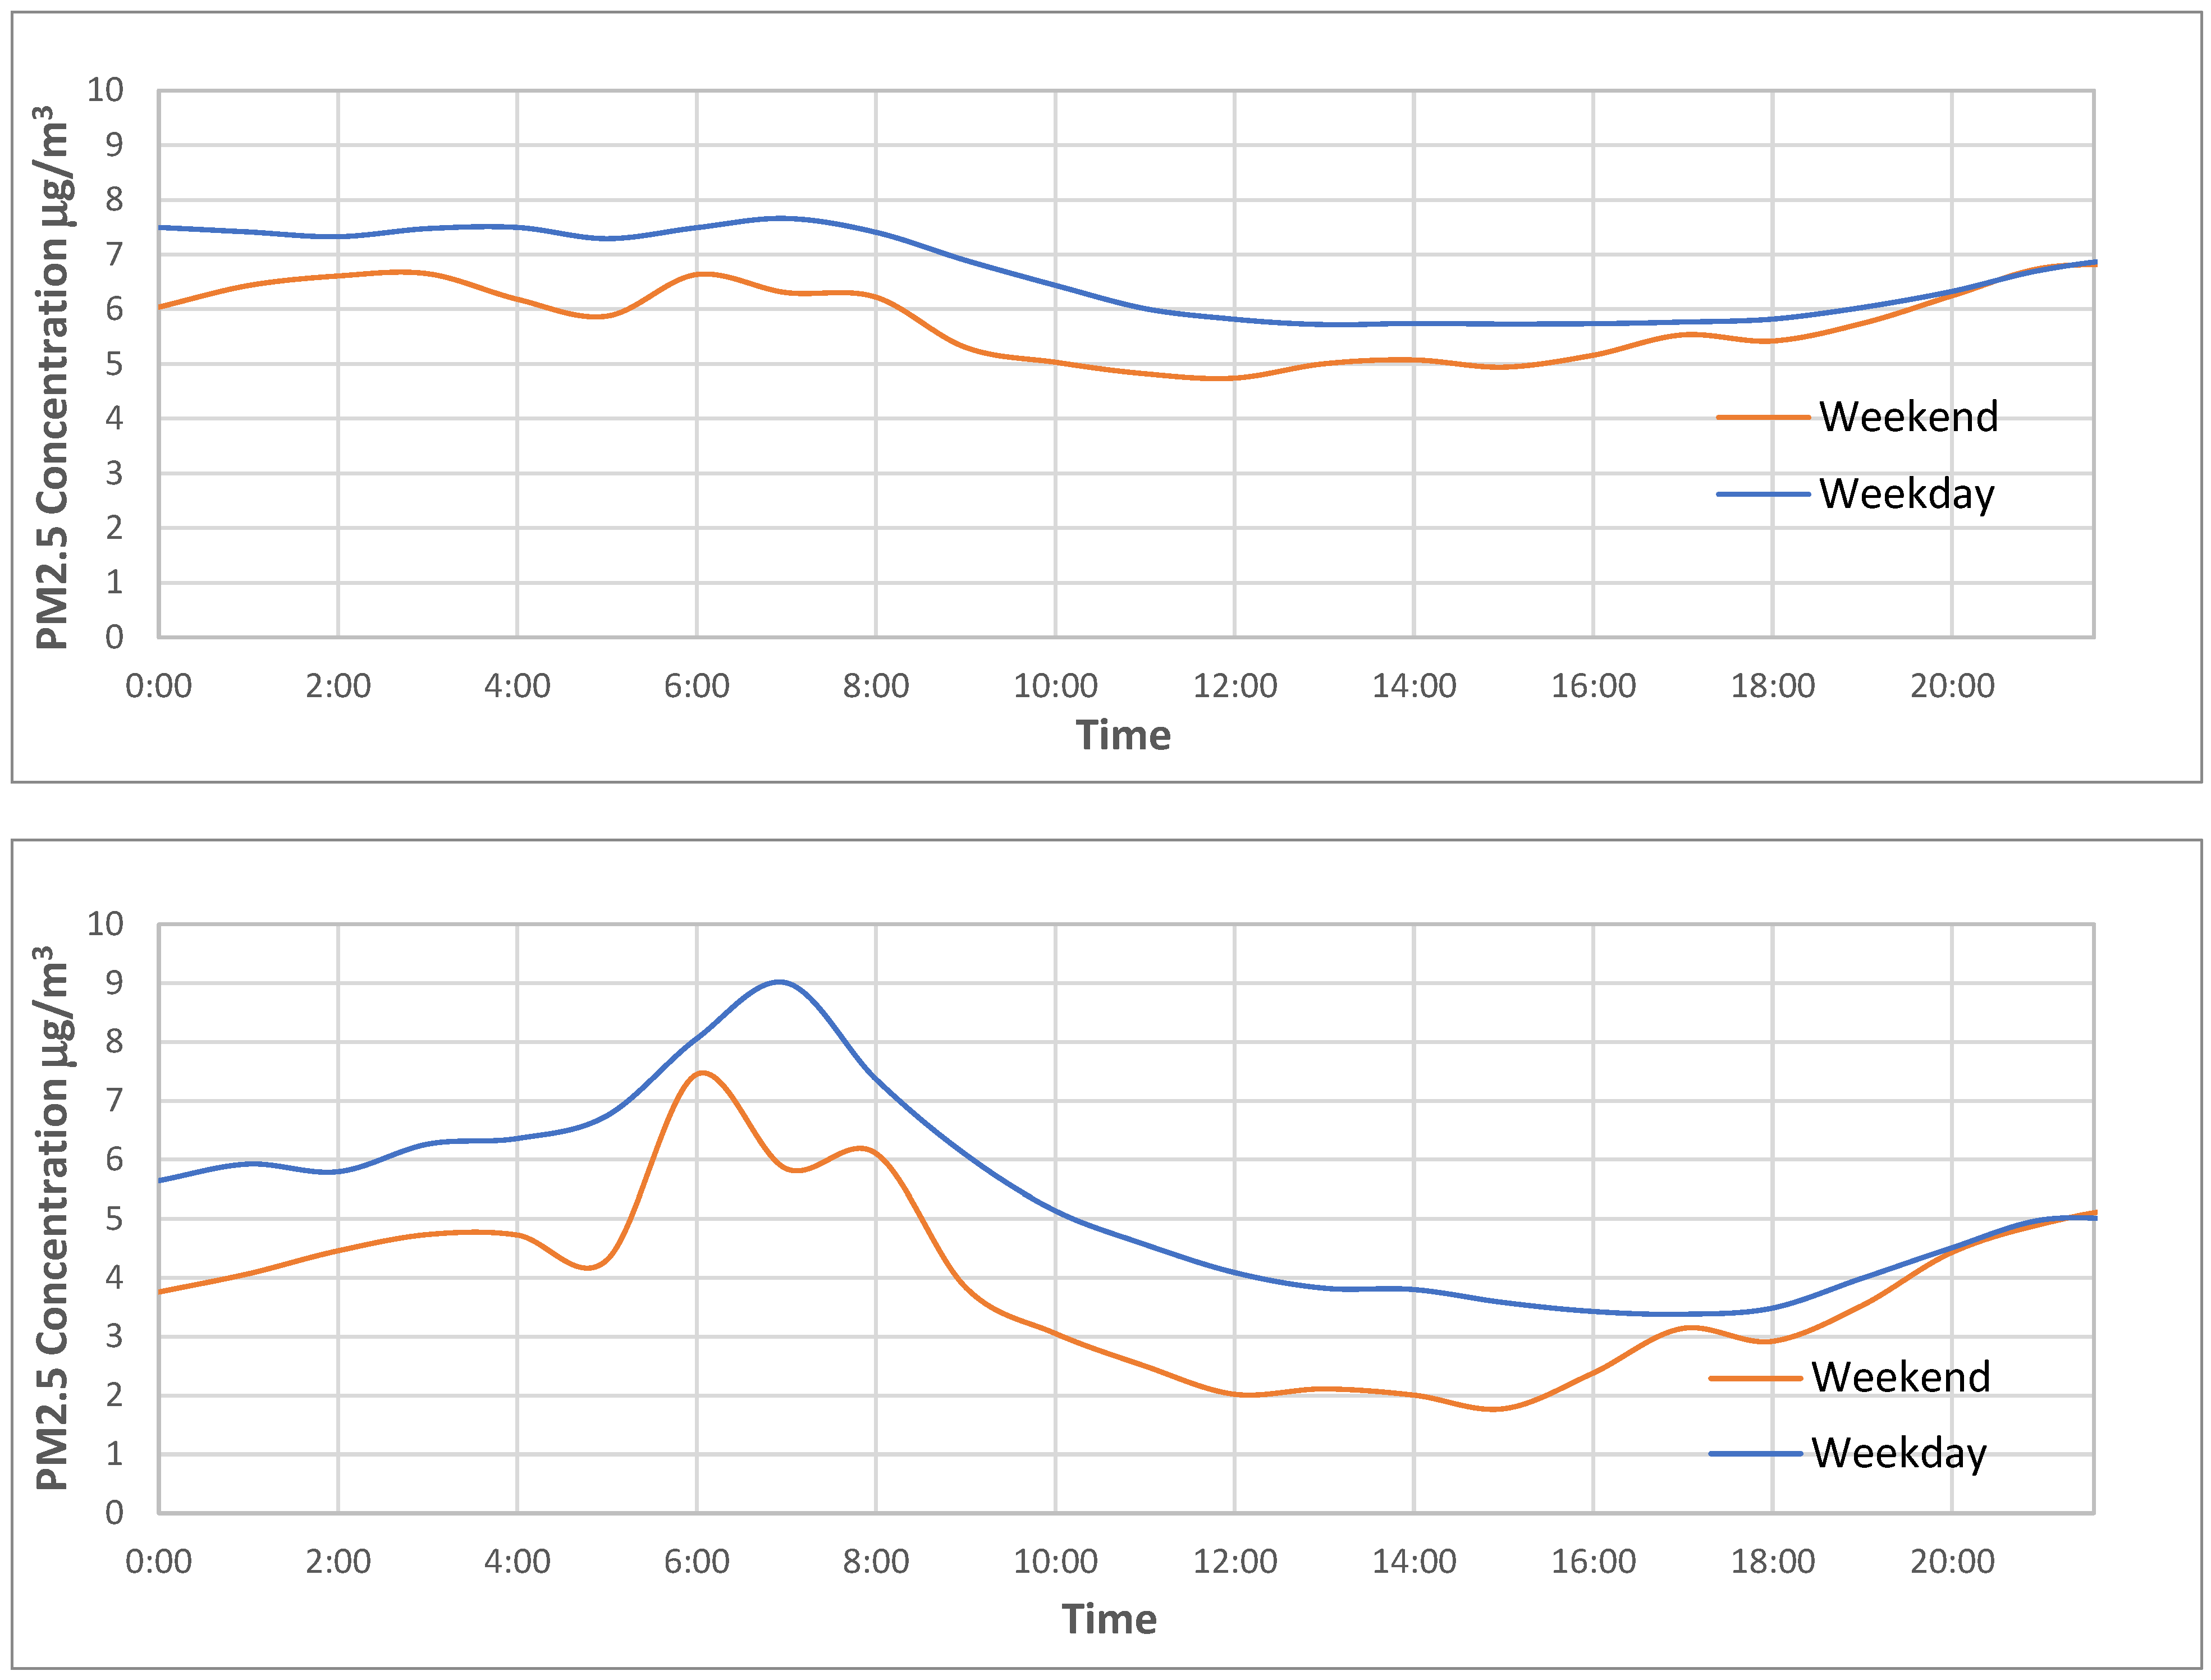
In general, the outdoor air quality of the school local area in this study was good, and even the peak PM
2.5 (both weekdays and weekend days) measured by both sensors was lower than the new US EPA ambient PM
2.5 standard (24-h average 9 μg/m
3) [
27], as shown in
Figure 5. Both sensors recorded peak concentrations around 7:00 AM during the weekdays, which corresponded to the morning commute traffic time and student drop-off time (the school’s official day is 8:10 AM to 2:30 PM).
According to the evaluations by the California South Coast Air Quality Management District, both Clarity and APT sensors demonstrate reasonable accuracy and high precision [
28,
29]. More specifically, the evaluation reports indicate that Clarity Node PM
2.5 mass measurements correlate well with corresponding FEM BAM data (R
2 > 0.84), while APT MINIMA sensors exhibited an even stronger correlation with FEM PM
2.5 data (R
2 > 0.99). In our study, as shown in
Figure 4, we observed that the two sensors closely tracked each other for outdoor PM
2.5 measurements. However, some indoor APT sensors experienced data loss due to wireless connectivity issues, resulting in partial gaps in indoor PM
2.5 measurements. In contrast, Clarity sensors achieved a 100% data recovery rate for all measurements, consistent with findings from prior field studies [
30]. Therefore, Clarity sensor data were used for indoor PM
2.5 comparisons between classrooms.
Figure 5,
Figure 6 and
Figure 7 present the hourly average PM
2.5 data collected over the five-week testing period. In
Figure 5, for all school days’ average outdoor PM
2.5, Clarity sensors showed hourly standard deviation (Stdev) ranges from 1.49 to 3.15, with Stdev-to-mean ratios ranging from 0.29 to 0.46. In comparison, APT sensors had higher Stdev values ranging from 3.06 to 5.04, and Stdev-to-mean ratios between 0.56 and 0.92.
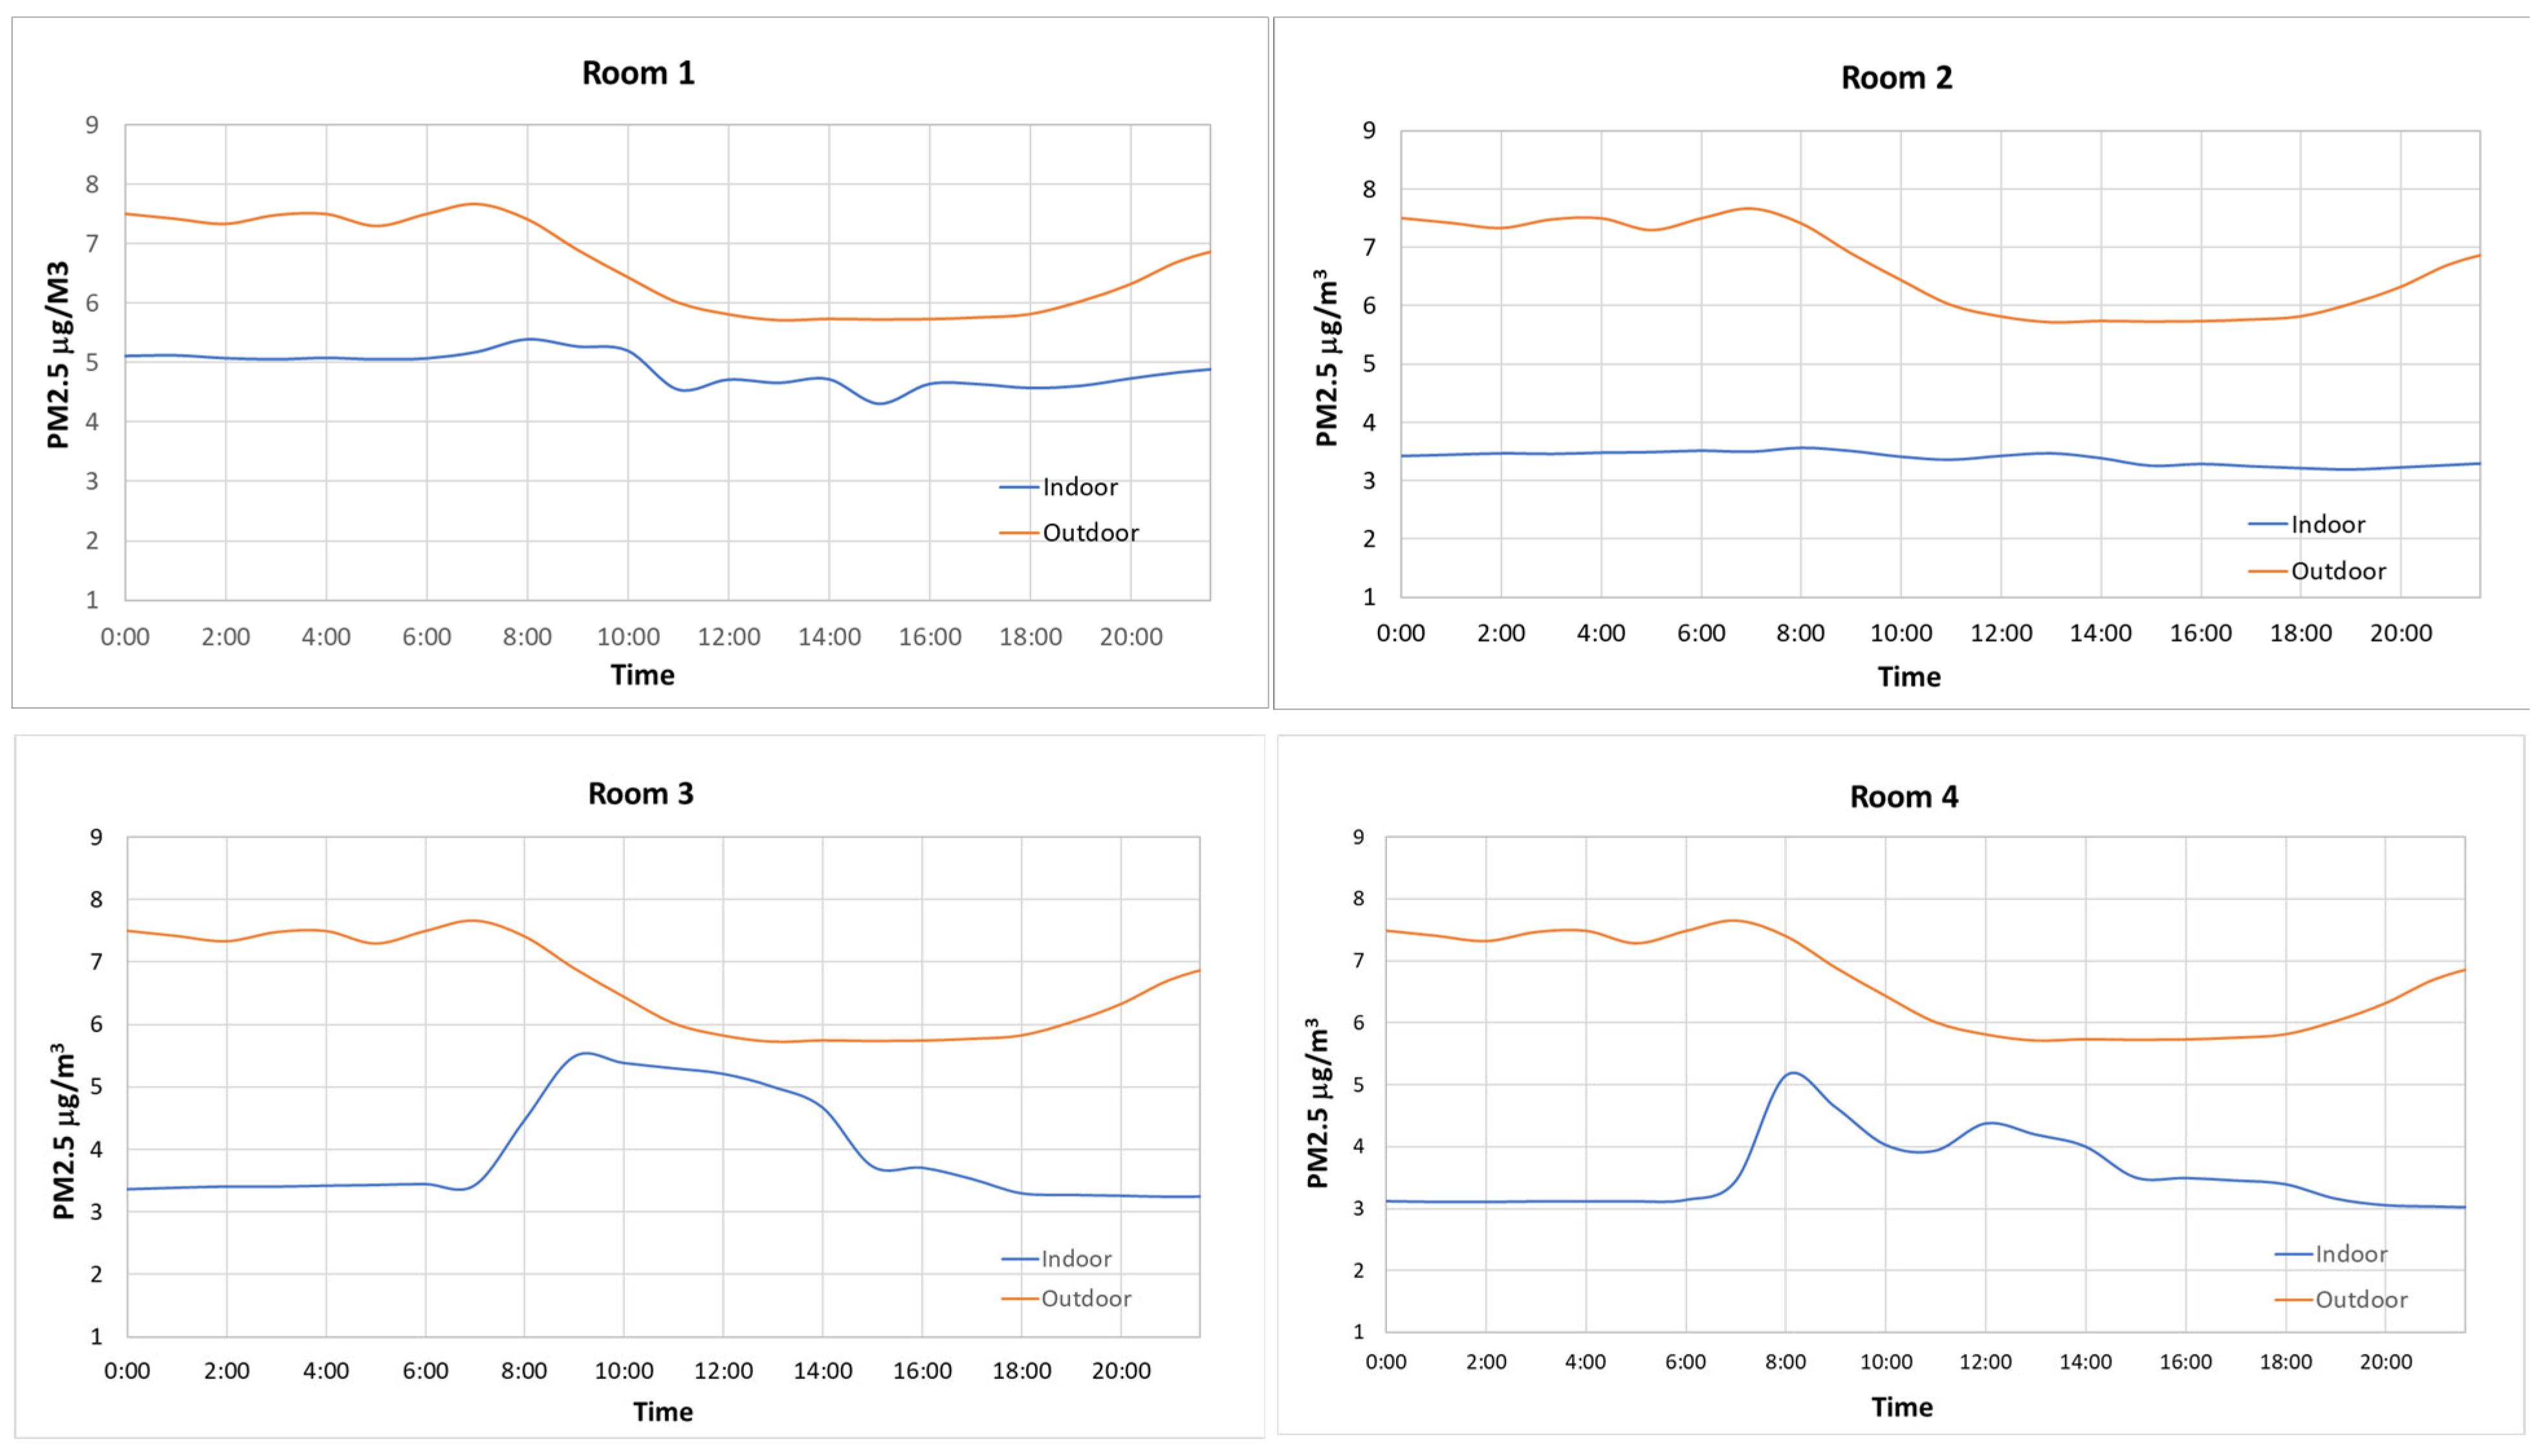
Figure 6 presents a comparison of hourly average PM
2.5 concentrations inside and outside the classrooms for all weekdays and weekends over the entire test period (7 weeks), as measured by Clarity Nodes. As shown in
Figure 5, all four classrooms had lower PM
2.5 concentrations compared to outdoor levels. This is expected, as all classrooms were equipped with mechanical ventilation systems operated in a similar manner by the school technician and were also fitted with portable air cleaners (PACs).
For the PM
2.5 results shown in
Figure 6, which were measured using Clarity Nodes. For school days, the hourly standard deviations (Stdev) for Classrooms 1, 2, 3, and 4 ranged from 0.51–0.88, 0.31–0.45, 0.40–0.82, and 0.07–0.75, respectively. The corresponding ratios of Stdev to the average PM
2.5 concentrations were 0.10–0.18 for Classroom 1, 0.08–0.13 for Classroom 2, 0.11–0.21 for Classroom 3, and 0.08–0.13 for Classroom 4.
As previously mentioned, the HVAC systems were identical across classrooms, all equipped with MERV 13 filters, and the air change rates (ACH) ranged from approximately 12 to 13. Assuming a PM
2.5 removal efficiency of 85% for MERV 13 filters [
31], the equivalent clean air delivery rate during school hours can be roughly estimated as follows:
0.85 × 12 ACH = 10.2 ACH
0.85 × 13 ACH = 11.1 ACH
Therefore, the total ACH (HVAC + PAC) for Classrooms 1, 3, and 4 was approximately 11.4 (10.2 + 1.2), and for Classroom 2 it was about 13.0 (11.1 + 1.9). These estimates suggest that the HVAC system with MERV 13 filters played a dominant role in controlling indoor PM2.5 levels in these mechanically ventilated classrooms, especially when compared to the contribution of PACs (i.e., 10.2 or 11.1 ACH vs. ≤1.9 ACH). With such high air exchange rates, the lower indoor PM2.5 levels are understandable.
It is also evident that indoor PM
2.5 levels in all four classrooms were below the 24-h average threshold of 12 µg/m
3 recommended by the Indoor Air Hygiene Institute, and even below the World Health Organization’s guideline of 5 µg/m
3 [
32]. These results are consistent with findings from other studies on mechanically ventilated classrooms [
33]. In contrast, naturally ventilated classrooms often exhibit indoor PM levels that are higher than outdoor levels [
34]. The results also showed that PM
2.5 levels were generally higher on weekdays compared to weekends.
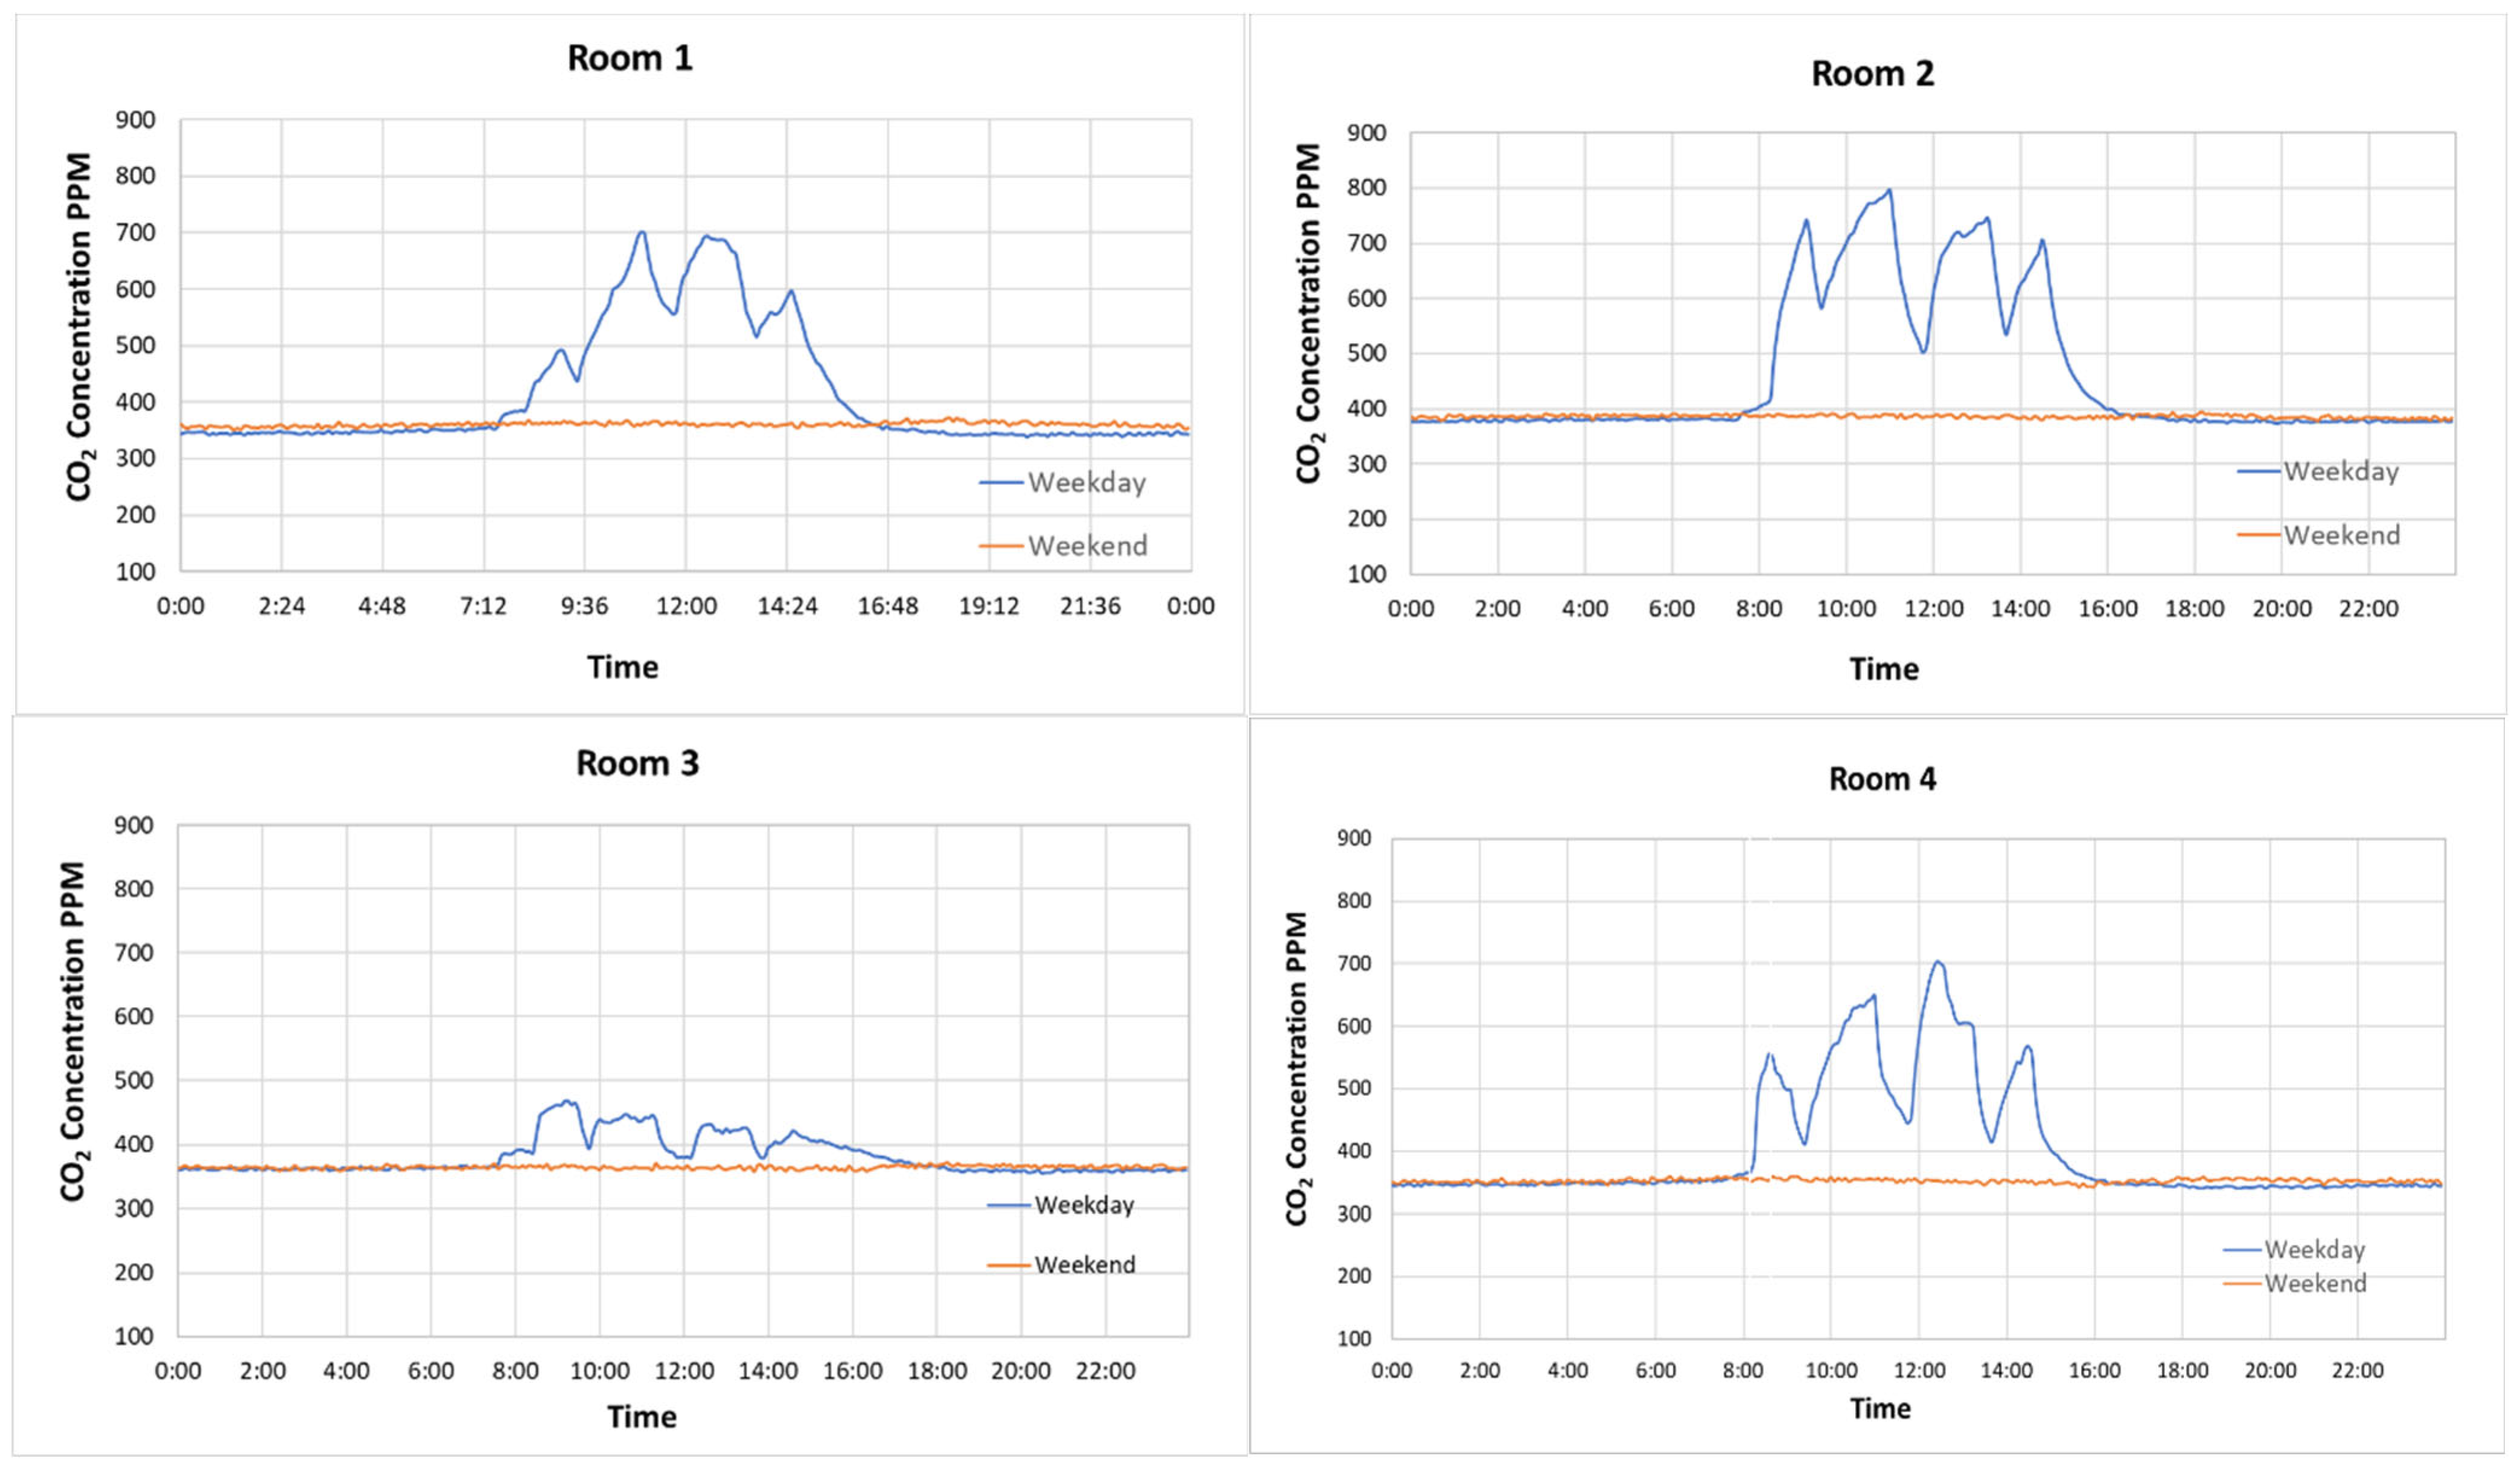
Figure 7 shows the CO
2 concentrations as a function of time for the four classrooms. As is well known, CO
2 is a key parameter for evaluating the outdoor air exchange rate (ACH) in indoor environments, particularly in classrooms. Since air quality in mechanically ventilated classrooms is closely tied to ACH, monitoring CO
2 levels is essential. Doing so helps ensure adequate ventilation, maintain proper indoor air quality, and improve thermal comfort [
35].
The CO
2 measurements presented in
Figure 7 were obtained using Onset HOBO MX1102 dataloggers (ONSET, Bourne, MA, USA), which logged the CO
2 concentration every 5 min. All CO
2 concentration data points measured at the same clock time of each day were averaged for the whole study period, and results were plotted in
Figure 7. According to the manufacturer, this CO
2 sensor has an accuracy of ±50 ppm or ±5% of reading from 0 to 5000 ppm. Typically, in this study, the standard deviations (Stdev) for school days in the study period, the standard deviations (Stdev) for Classrooms 1, 2, 3, and 4 ranged from 0.01–109.08, 11.44–209.62, 12.60–75.68, and 12.06–74.59, respectively. The corresponding ratios of Stdev to the CO
2 concentrations were 0.01–0.32 for Classroom 1, 0.03–0.30 for Classroom 2, 0.03–0.16 for Classroom 3, and 0.03–0.29 for Classroom 4.
To better understand the PM
2.5 profiles in
Figure 6 and CO
2 profiles in
Figure 7 for each classroom, teachers were surveyed to understand each classroom’s teacher preferences in how they managed classroom air quality and the rationale behind their behaviors and preferences.
Table 1 shows the survey summaries of the teachers’ decisions and the rationales for their choices in how they managed factors that influenced air quality in their classrooms. Through the survey, we could better explain the monitoring results. Based on the teacher survey, Classroom 1 used the PAC during school hours, while Classroom 2 only operated it randomly when the teacher felt it was needed. Classrooms 3 and 4 mostly ran the PAC continuously 24 h a day, seven days a week, during this study.
3.1. Indoor and Outdoor PM2.5 and CO2 Concentration Analysis
As shown in
Figure 6, all classrooms had lower PM
2.5 concentrations compared to outdoor levels. However, each classroom exhibited distinct PM
2.5 profiles. Notably, Classroom 3 had the highest PM
2.5 concentration during school hours (
Figure 6, room 3). According to survey responses, this was likely because the teacher preferred to keep both doors and windows open throughout the school day, allowing more outdoor air to enter. This observation aligns with the CO
2 concentration measurements (
Figure 7, room 3), where Classroom 3 recorded the lowest peak values, indicating a continuous influx of fresh air. It was also noted that even though the teacher in Classroom 3 kept the windows and doors open during school hours, the indoor PM
2.5 concentration remained slightly lower than the outdoor level. This was likely due to the high air exchange rate (ACH) provided by both the HVAC system and the PAC.
Conversely, Classroom 2 had the lowest PM
2.5 concentrations but the highest CO
2 levels. This is likely due to the teacher’s practice of keeping the door and windows closed to minimize outside noise, only opening them occasionally for ventilation. As shown in
Figure 6, the low PM
2.5 levels in Classroom 2 may also be attributed to its higher supply and return airflow rates (ACH ≈ 13.0, compared to 11.4 in the other classrooms), as confirmed by on-site HVAC flow measurements. For detailed ACH measurements, please refer to our previous paper [
25].
Classroom 4 showed a fluctuating PM
2.5 pattern (
Figure 6) and had the second-highest CO
2 concentration (
Figure 7, room 4). According to the teacher, the door and windows were typically kept closed during class, which likely contributed to these findings. In contrast, Classroom 1 consistently exhibited relatively high PM
2.5 levels. One possible explanation is that the teacher often kept the door open to the hallway, where PM
2.5 concentrations may have been more similar to outdoor levels. Other contributing factors might include the following: (1) poor sealing of windows or doors, allowing uncontrolled air exchange with the outdoors, or (2) improper installation of the HVAC filter, which could result in unfiltered air bypassing the system and entering the classroom directly.
In summary, teachers’ preferences regarding how they operate their classrooms can have a significant impact on indoor air quality. In mechanically ventilated classrooms equipped with MERV 13 filters, teachers who frequently opened windows or did not properly utilize the available ventilation systems could experience higher indoor PM2.5 concentrations, as outdoor air enters without passing through high-efficiency filtration. Conversely, teachers who preferred to keep windows closed in classrooms ventilated by HVAC systems with MERV 13 filters, in combination with PACs, could achieve lower PM2.5 concentrations when there are no significant indoor PM sources in classrooms. However, it is good practice to open the door and windows once a day to get rid of the odors and help minimize the CO2 buildup.
How teachers manage their classrooms is a broad and complex topic, and this study may not be able to provide a complete answer. Depending on a school’s specific conditions—such as geographic location, local air quality, building design, and available equipment (e.g., presence or absence of HVAC or PACs)—different strategies may be necessary to achieve optimal indoor air quality. Nonetheless, based on classroom monitoring and our results analysis, it is evident that teacher preferences and operational decisions can significantly influence classroom air quality. This could be particularly critical during periods of elevated outdoor particulate matter (PM) concentrations, such as during wildfires incident [
36].
Other factors that may affect classroom air quality include student occupancy and indoor activities, as well as outdoor influences such as unpaved playgrounds, vehicle traffic, engine emissions, and road dust—particularly during drop-off and pick-up times. PM and CO
2 concentrations can vary significantly at different times of the day and between weekdays and weekends, as illustrated in
Figure 5,
Figure 6 and
Figure 7.
3.2. Carbon Dioxide Concentration Trends
Figure 7 illustrates the CO
2 concentration trends throughout the school day. All four classrooms exhibited four distinct CO
2 peaks corresponding to class periods, with valleys representing break times. At the beginning and end of the school day, CO
2 levels were low, aligning with outdoor concentrations.
Classroom 3 had the lowest CO2 peaks, which aligns with the teacher’s practice of keeping doors and windows open to maximize fresh air intake. Classroom 2 recorded the highest average weekday CO2 concentrations, consistent with the teacher’s habit of keeping the door and windows closed to minimize external noise and enhance student focus.
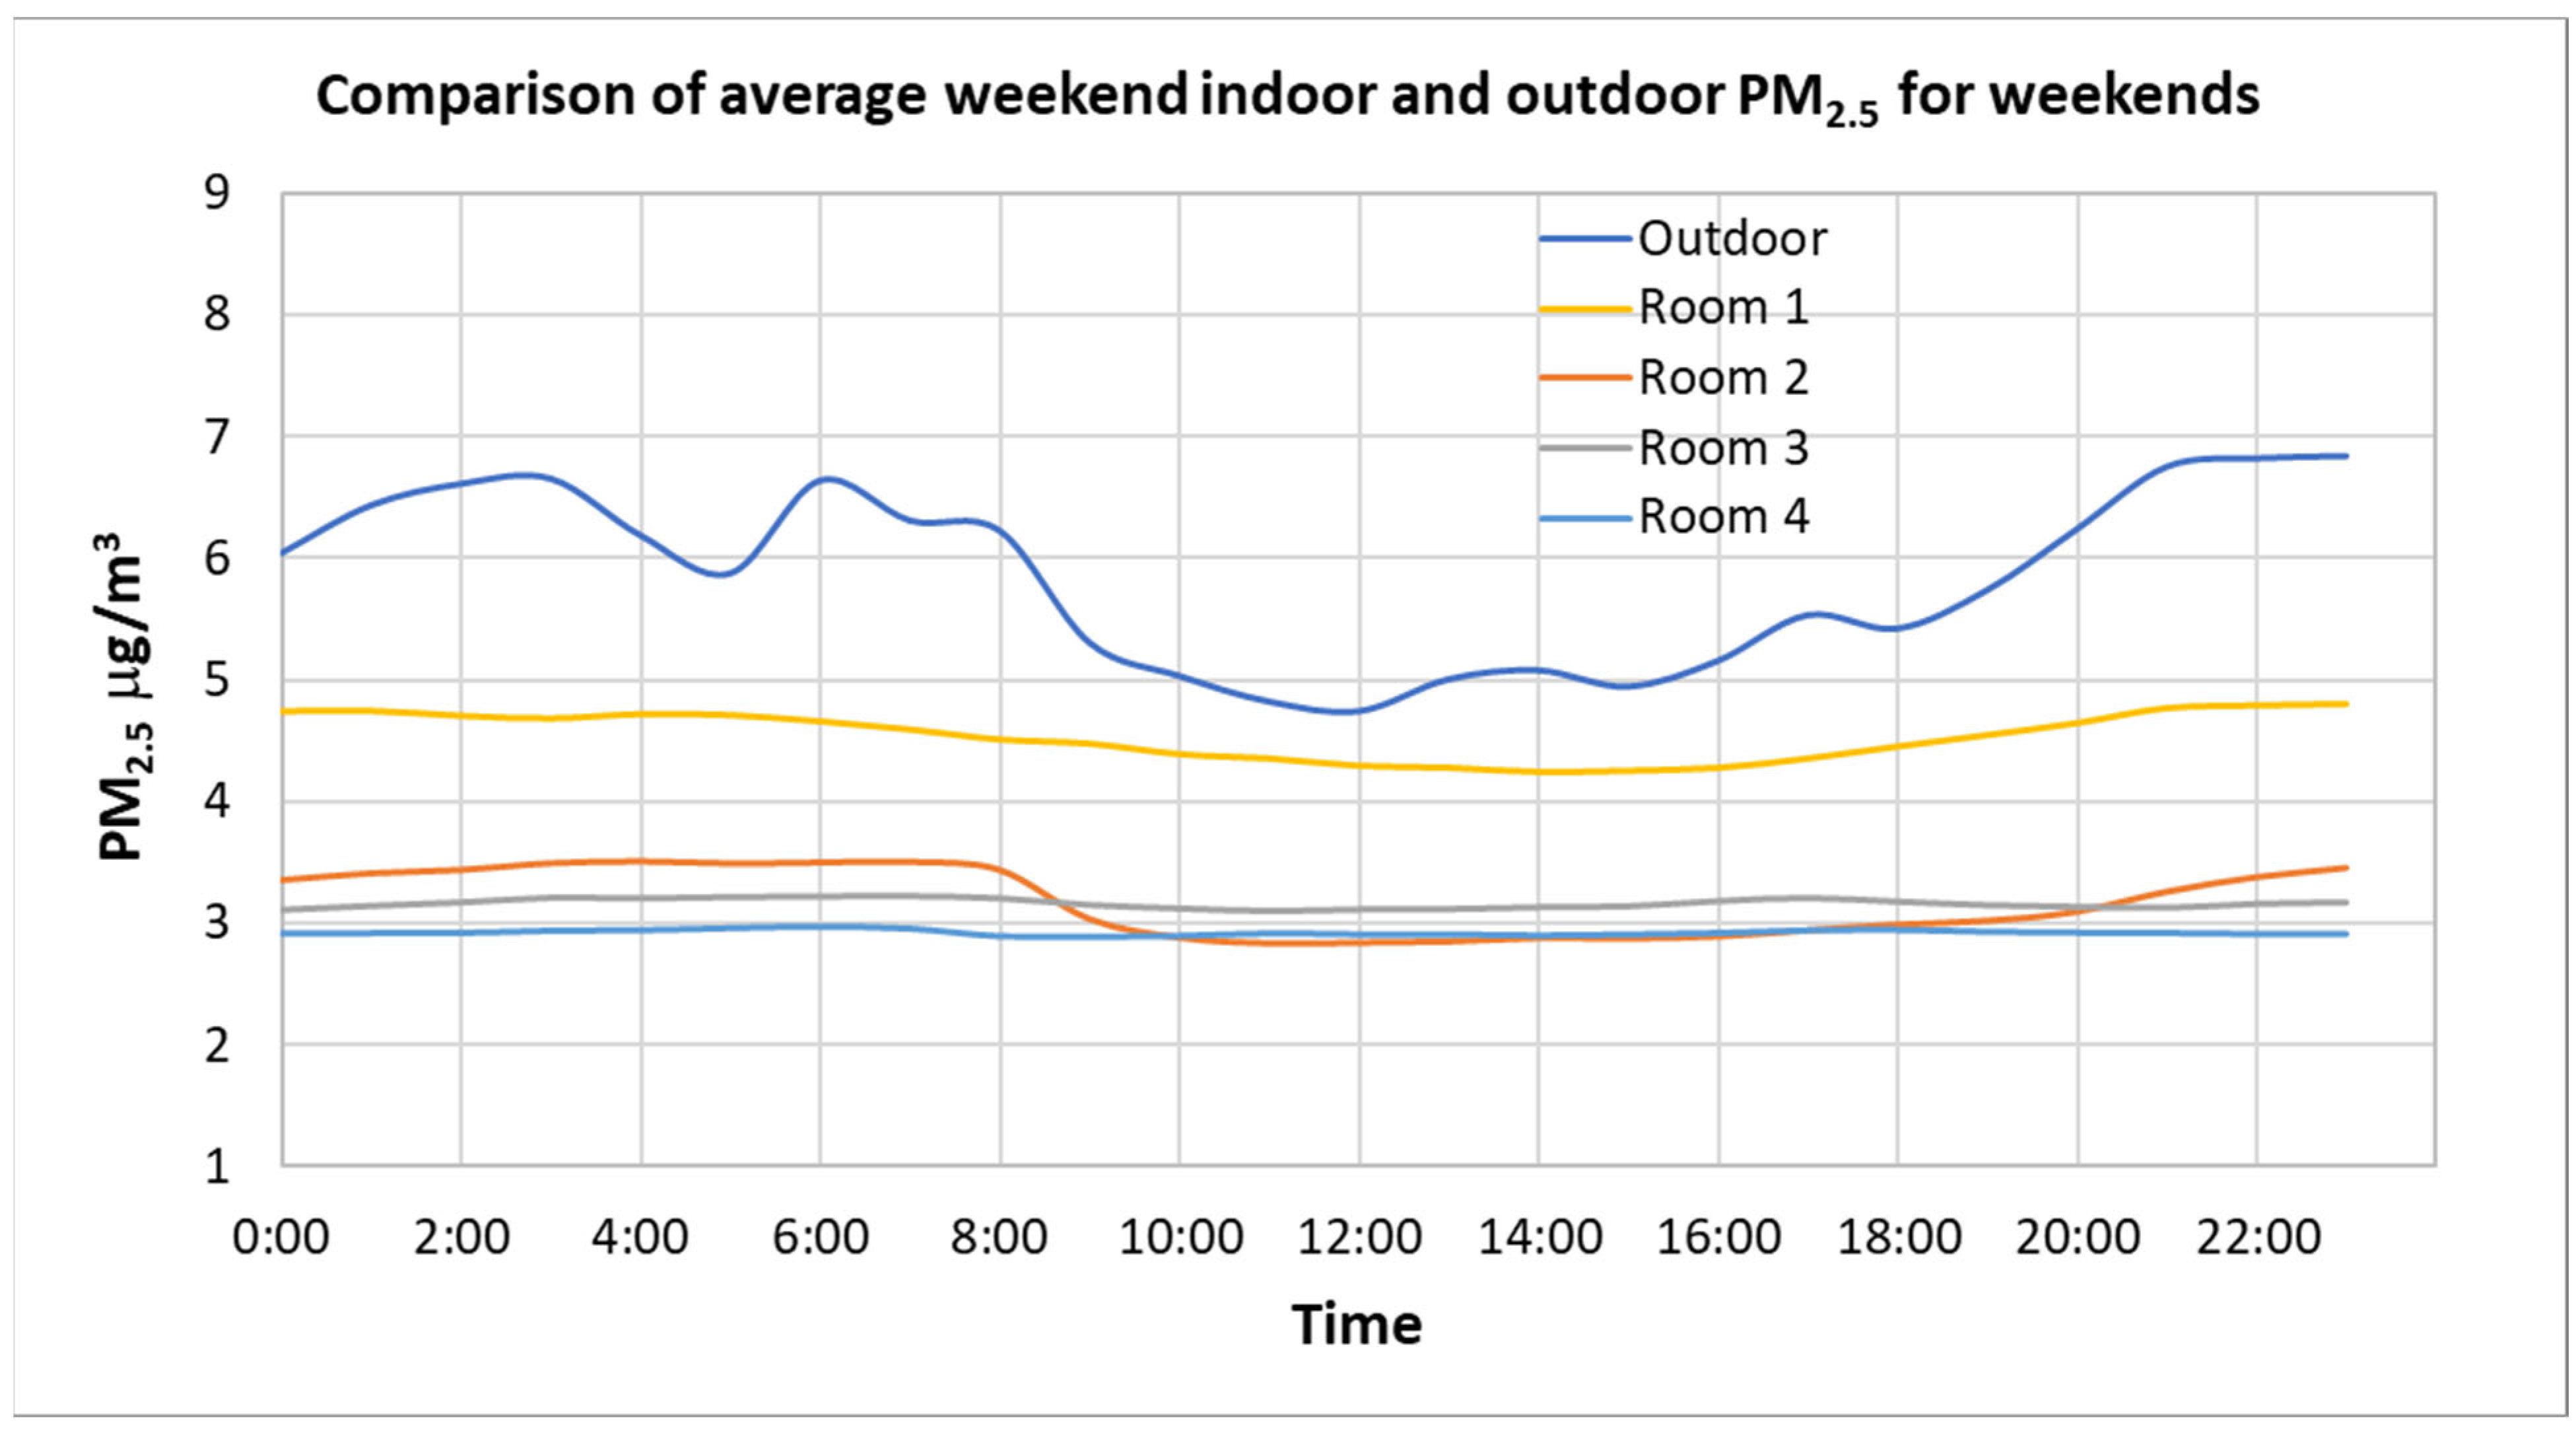
3.3. Indoor vs. Outdoor PM2.5 Levels on Weekends
Figure 8 compares average indoor and outdoor PM
2.5 concentrations over seven weekends. Across all classrooms, indoor PM
2.5 levels remained lower than outdoor levels. Since no students were present on weekends, indoor PM
2.5 concentrations remained relatively stable, despite fluctuations in outdoor levels. Classroom 1 with higher PM
2.5 indicates that there was probably some air exchange from the outdoors because of the leakage of the windows or doors.
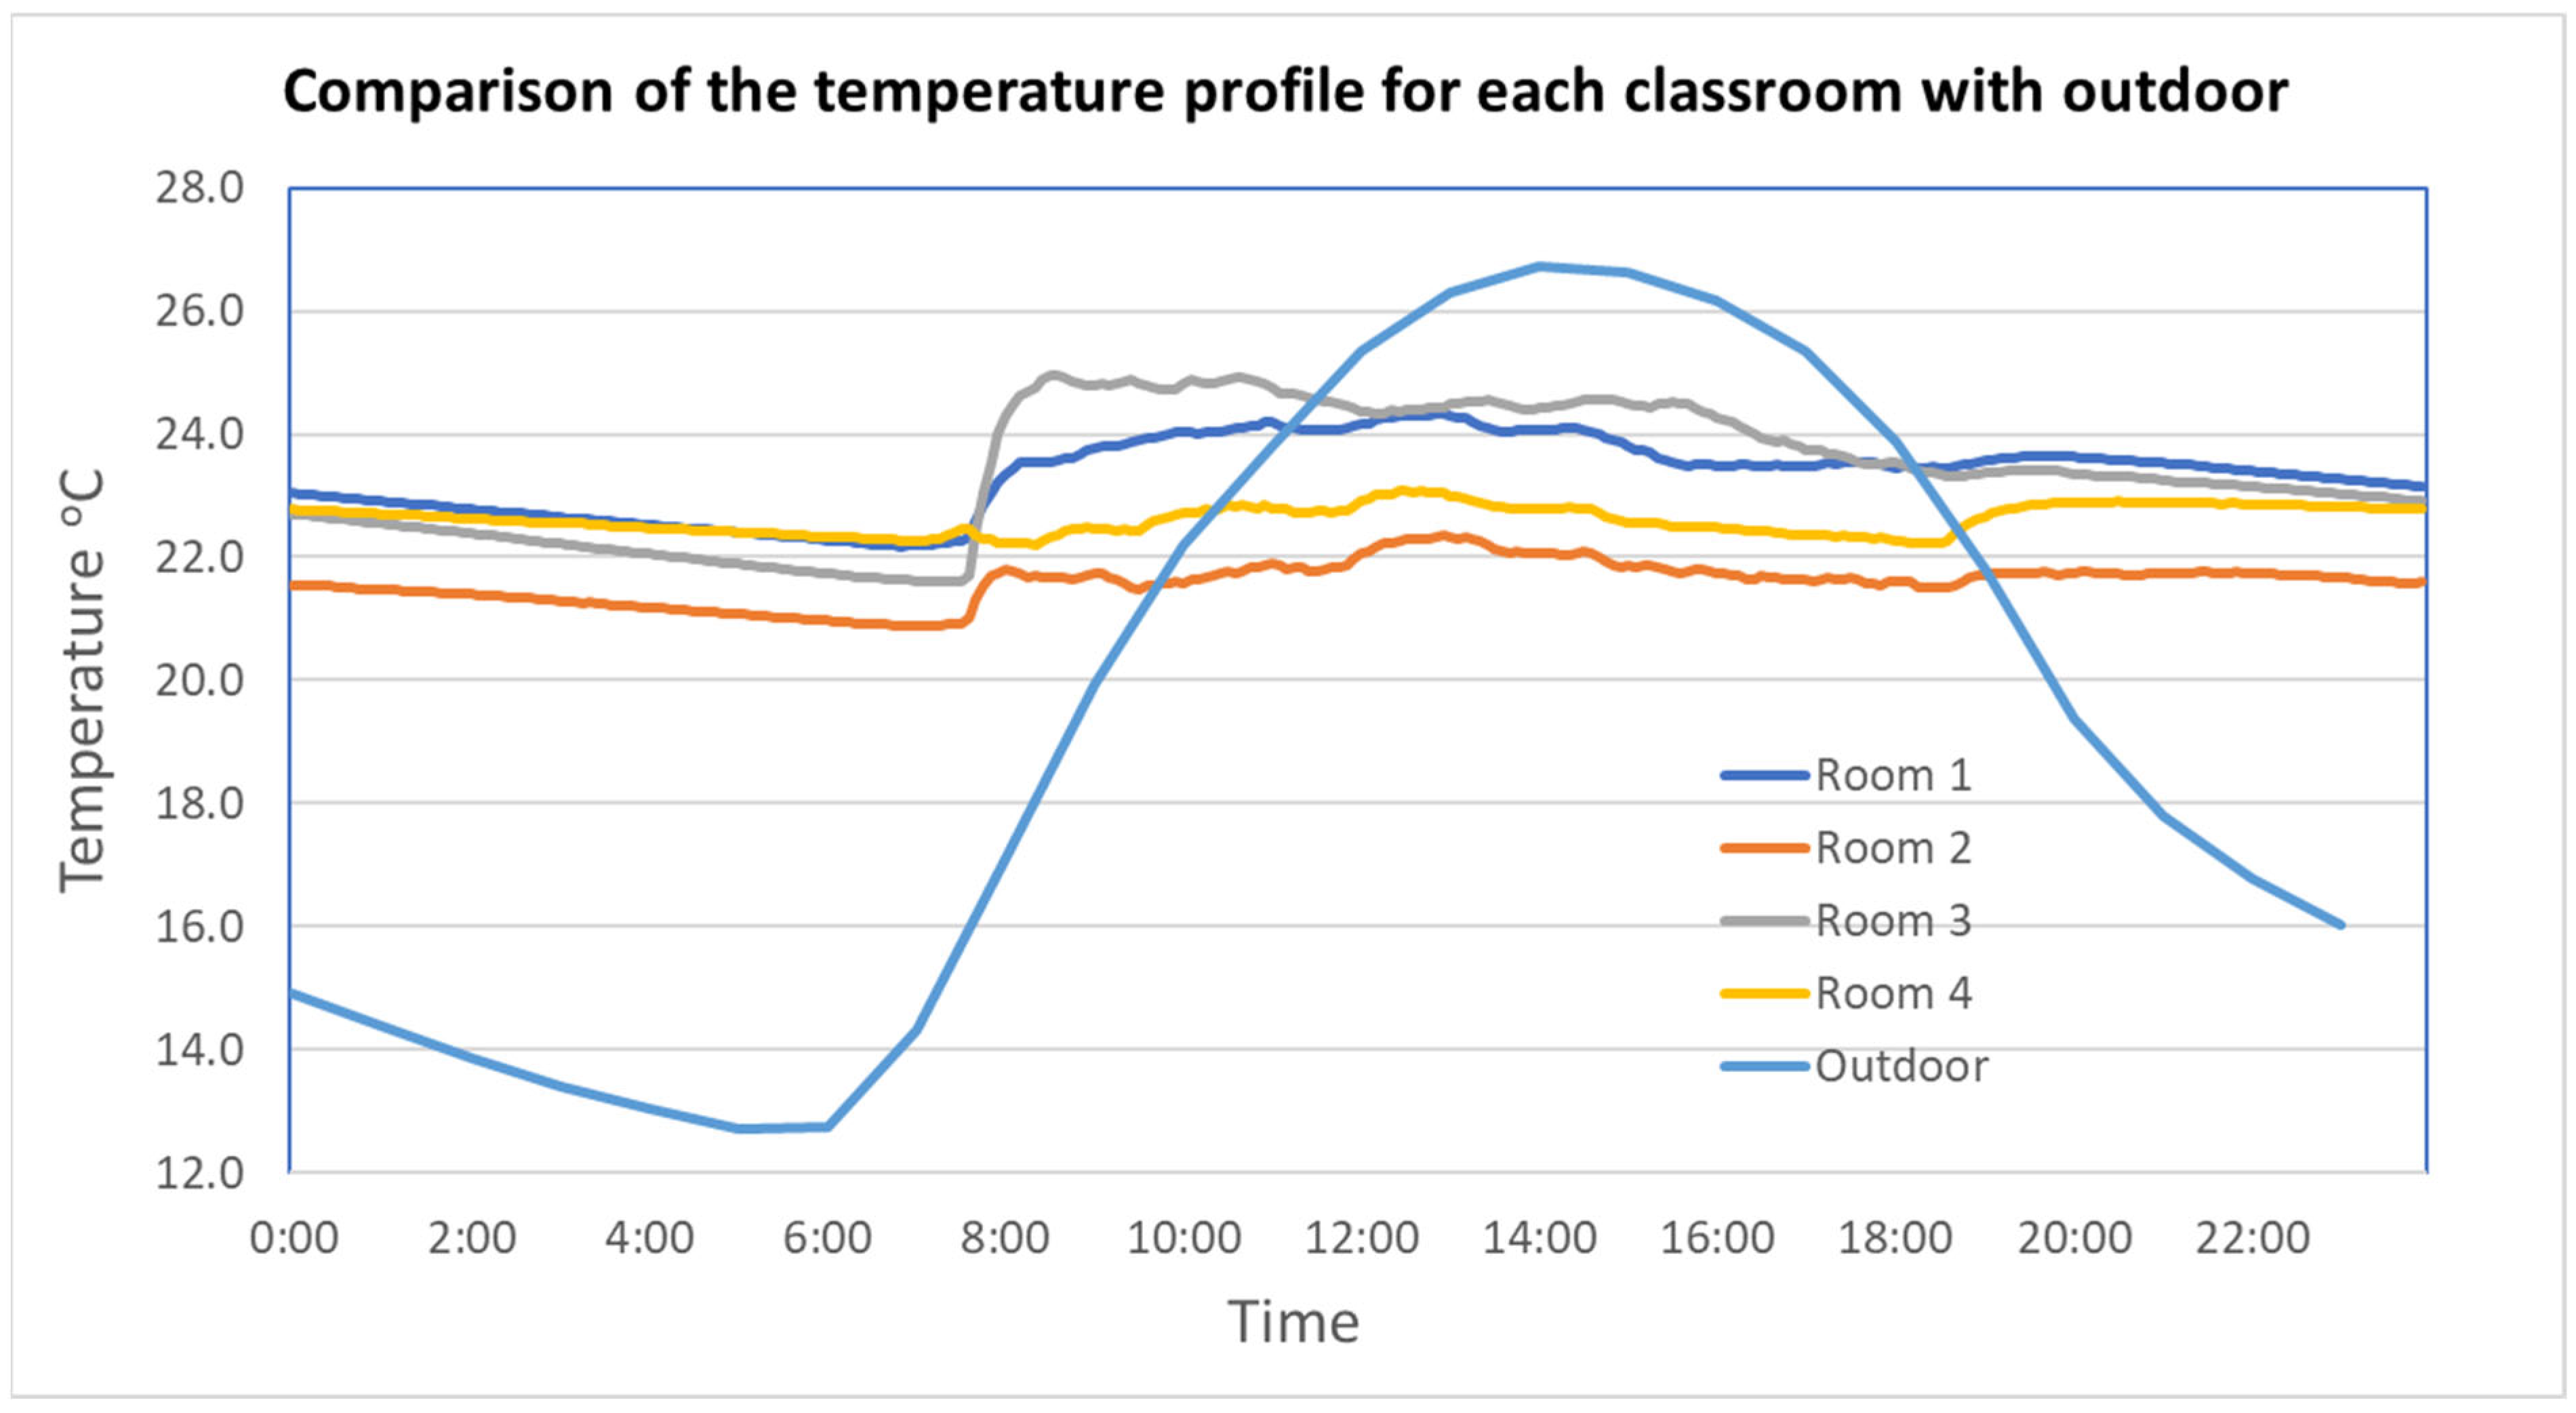
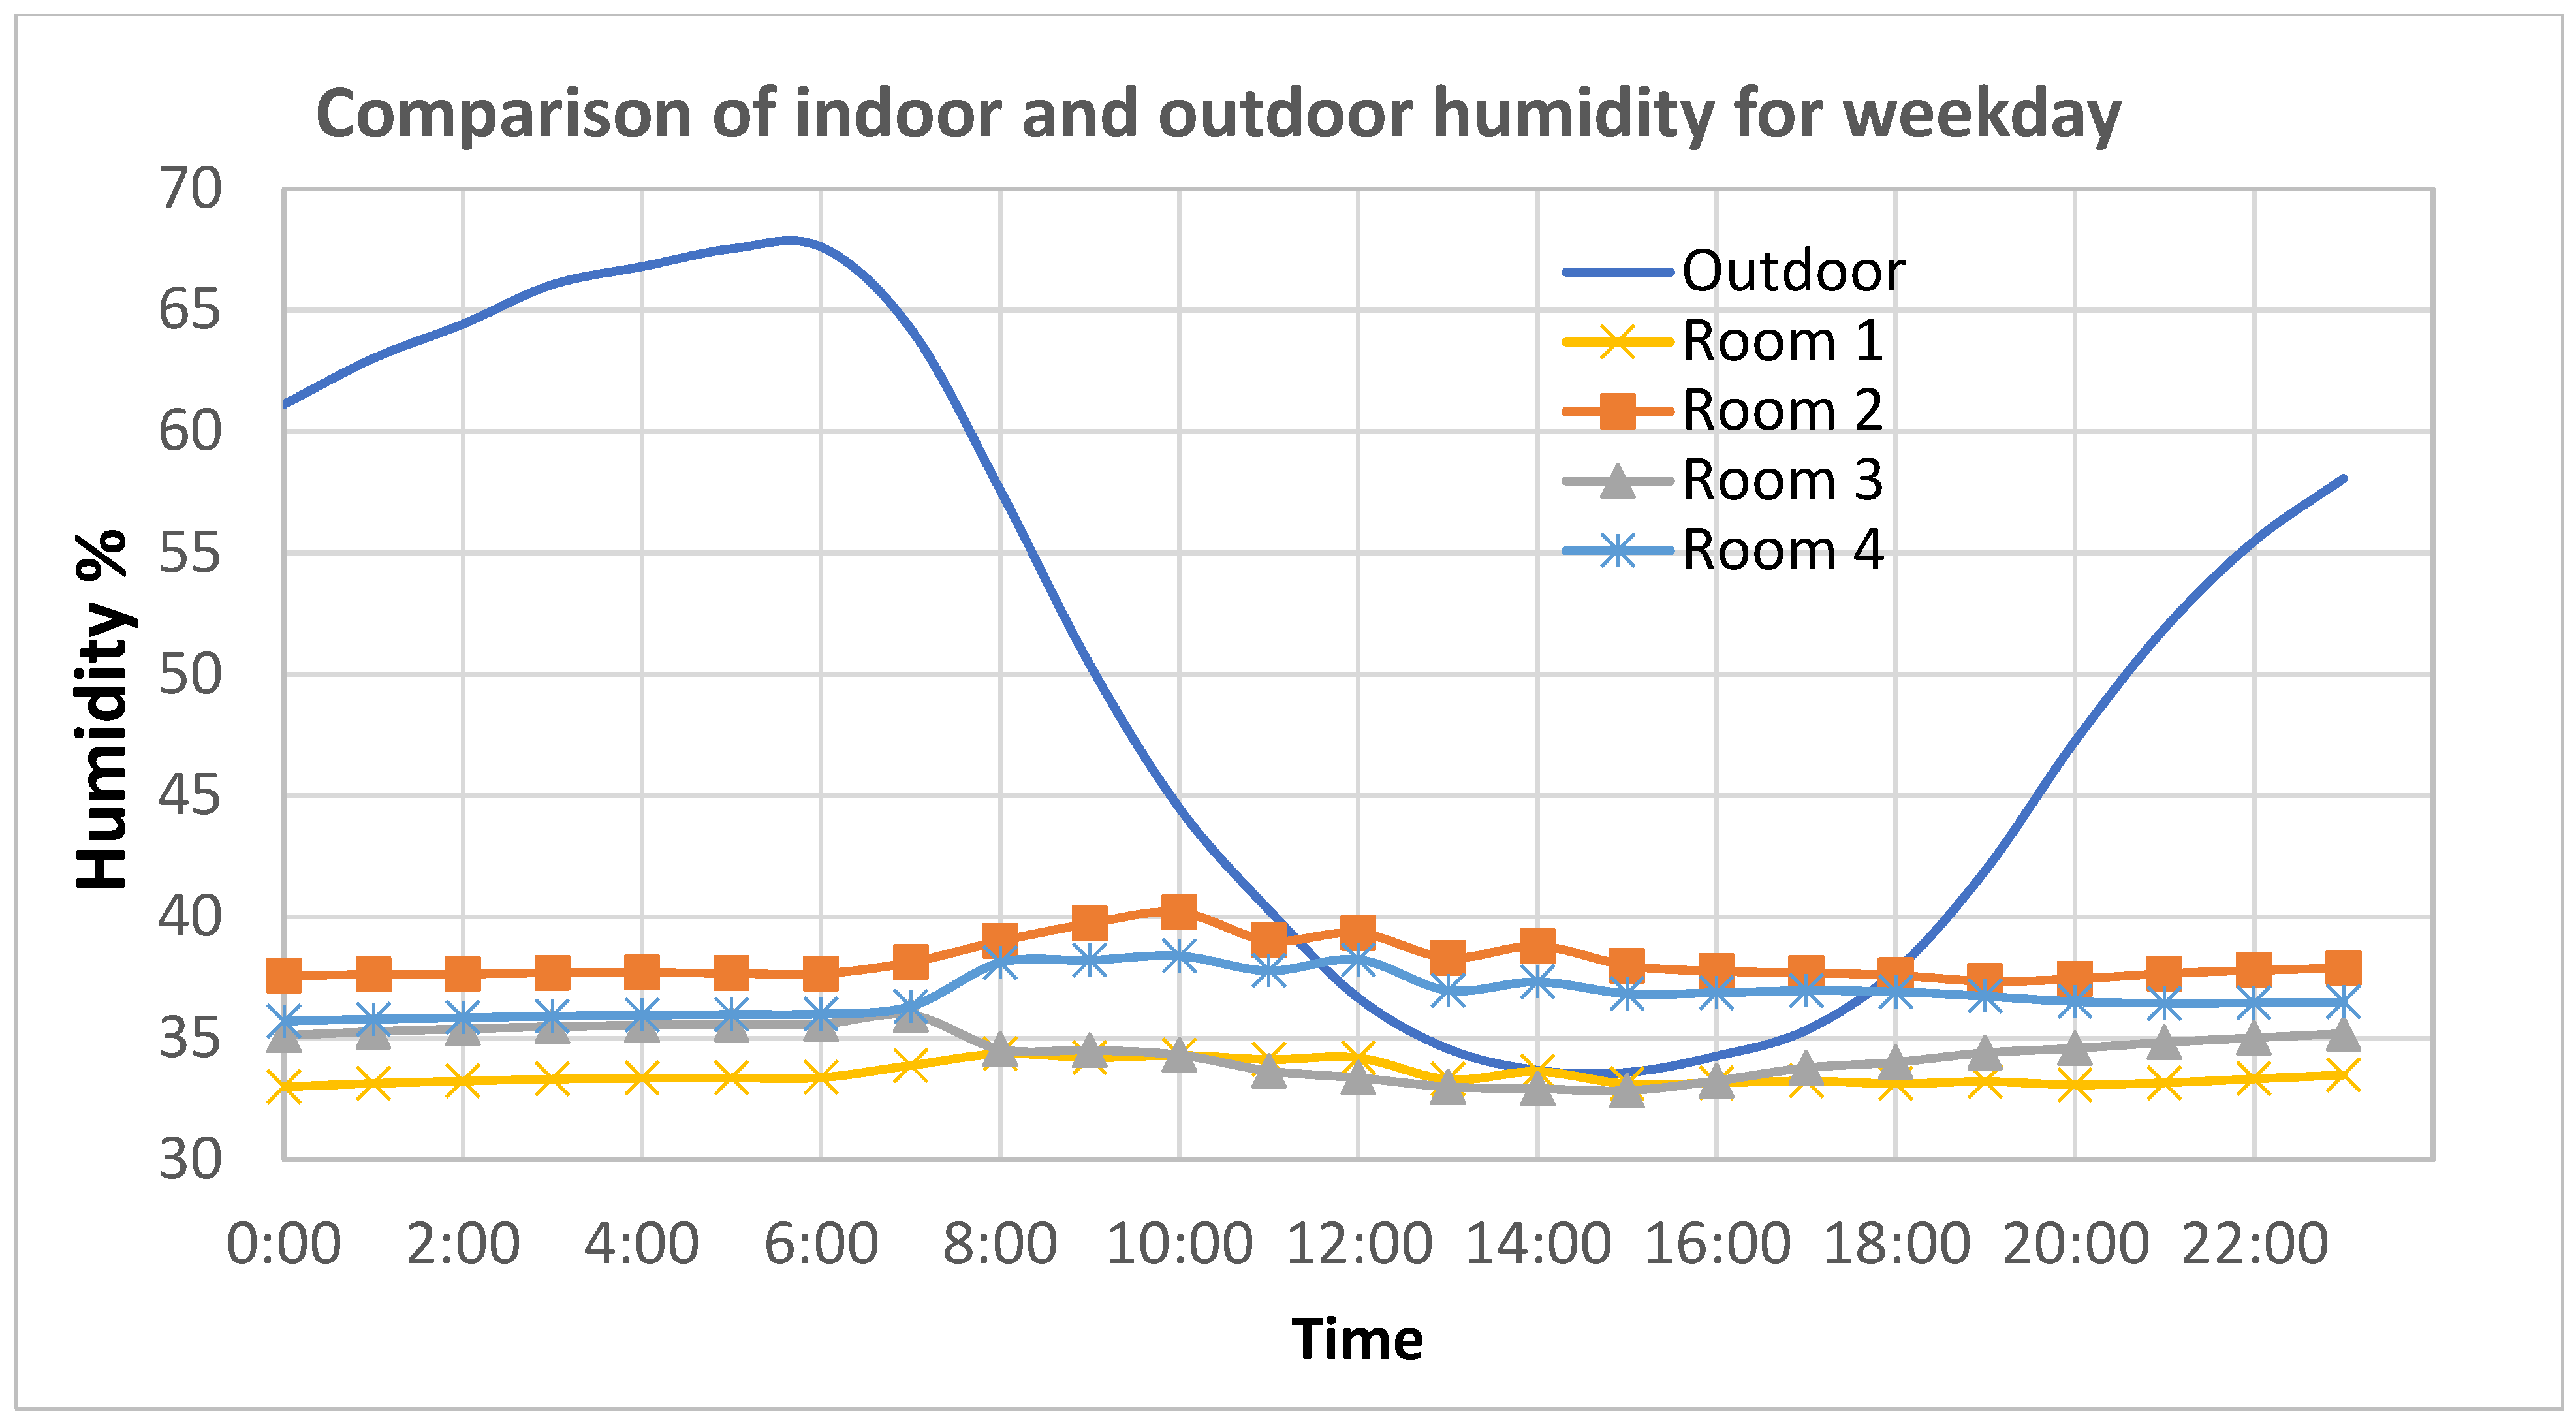
3.4. Temperature and Humidity Variations
Figure 9 and
Figure 10 further illustrate classroom environmental dynamics. As shown in
Figure 9, indoor temperature variations followed outdoor temperature trends, to an extent influenced by teachers’ ventilation decisions. Classroom 3, with frequent door and window openings, experienced the most rapid temperature fluctuations, while Classroom 2, which remained closed off, showed the slowest response to outdoor temperature changes.
Figure 10 shows that the RH levels in each classroom were influenced by both outdoor humidity and indoor temperature fluctuations. In classrooms where doors and windows remained closed, the HVAC system initially caused a slight drop in temperature when activated, followed by gradual warming. Combined with higher morning outdoor humidity, this led to a brief rise in indoor RH, which then slowly decreased as the temperature increased throughout the day. In contrast, Classroom 3, where doors and windows were kept open, experienced a different pattern. The open ventilation allowed outdoor air to mix quickly with warmer indoor air. As a result, the outdoor air rapidly warmed, leading to a decrease in relative humidity due to the increased air temperature. This finding reinforces the impact of teacher preferences on classroom ventilation and indoor environments during school hours. Consequently, the degree to which classroom humidity followed outdoor RH trends was, in descending order, as follows: Room 3, Room 1, Room 4, and Room 2—mirroring the order of temperature increases observed in
Figure 9.
3.5. Indoor PM Morphology and Air Filtration
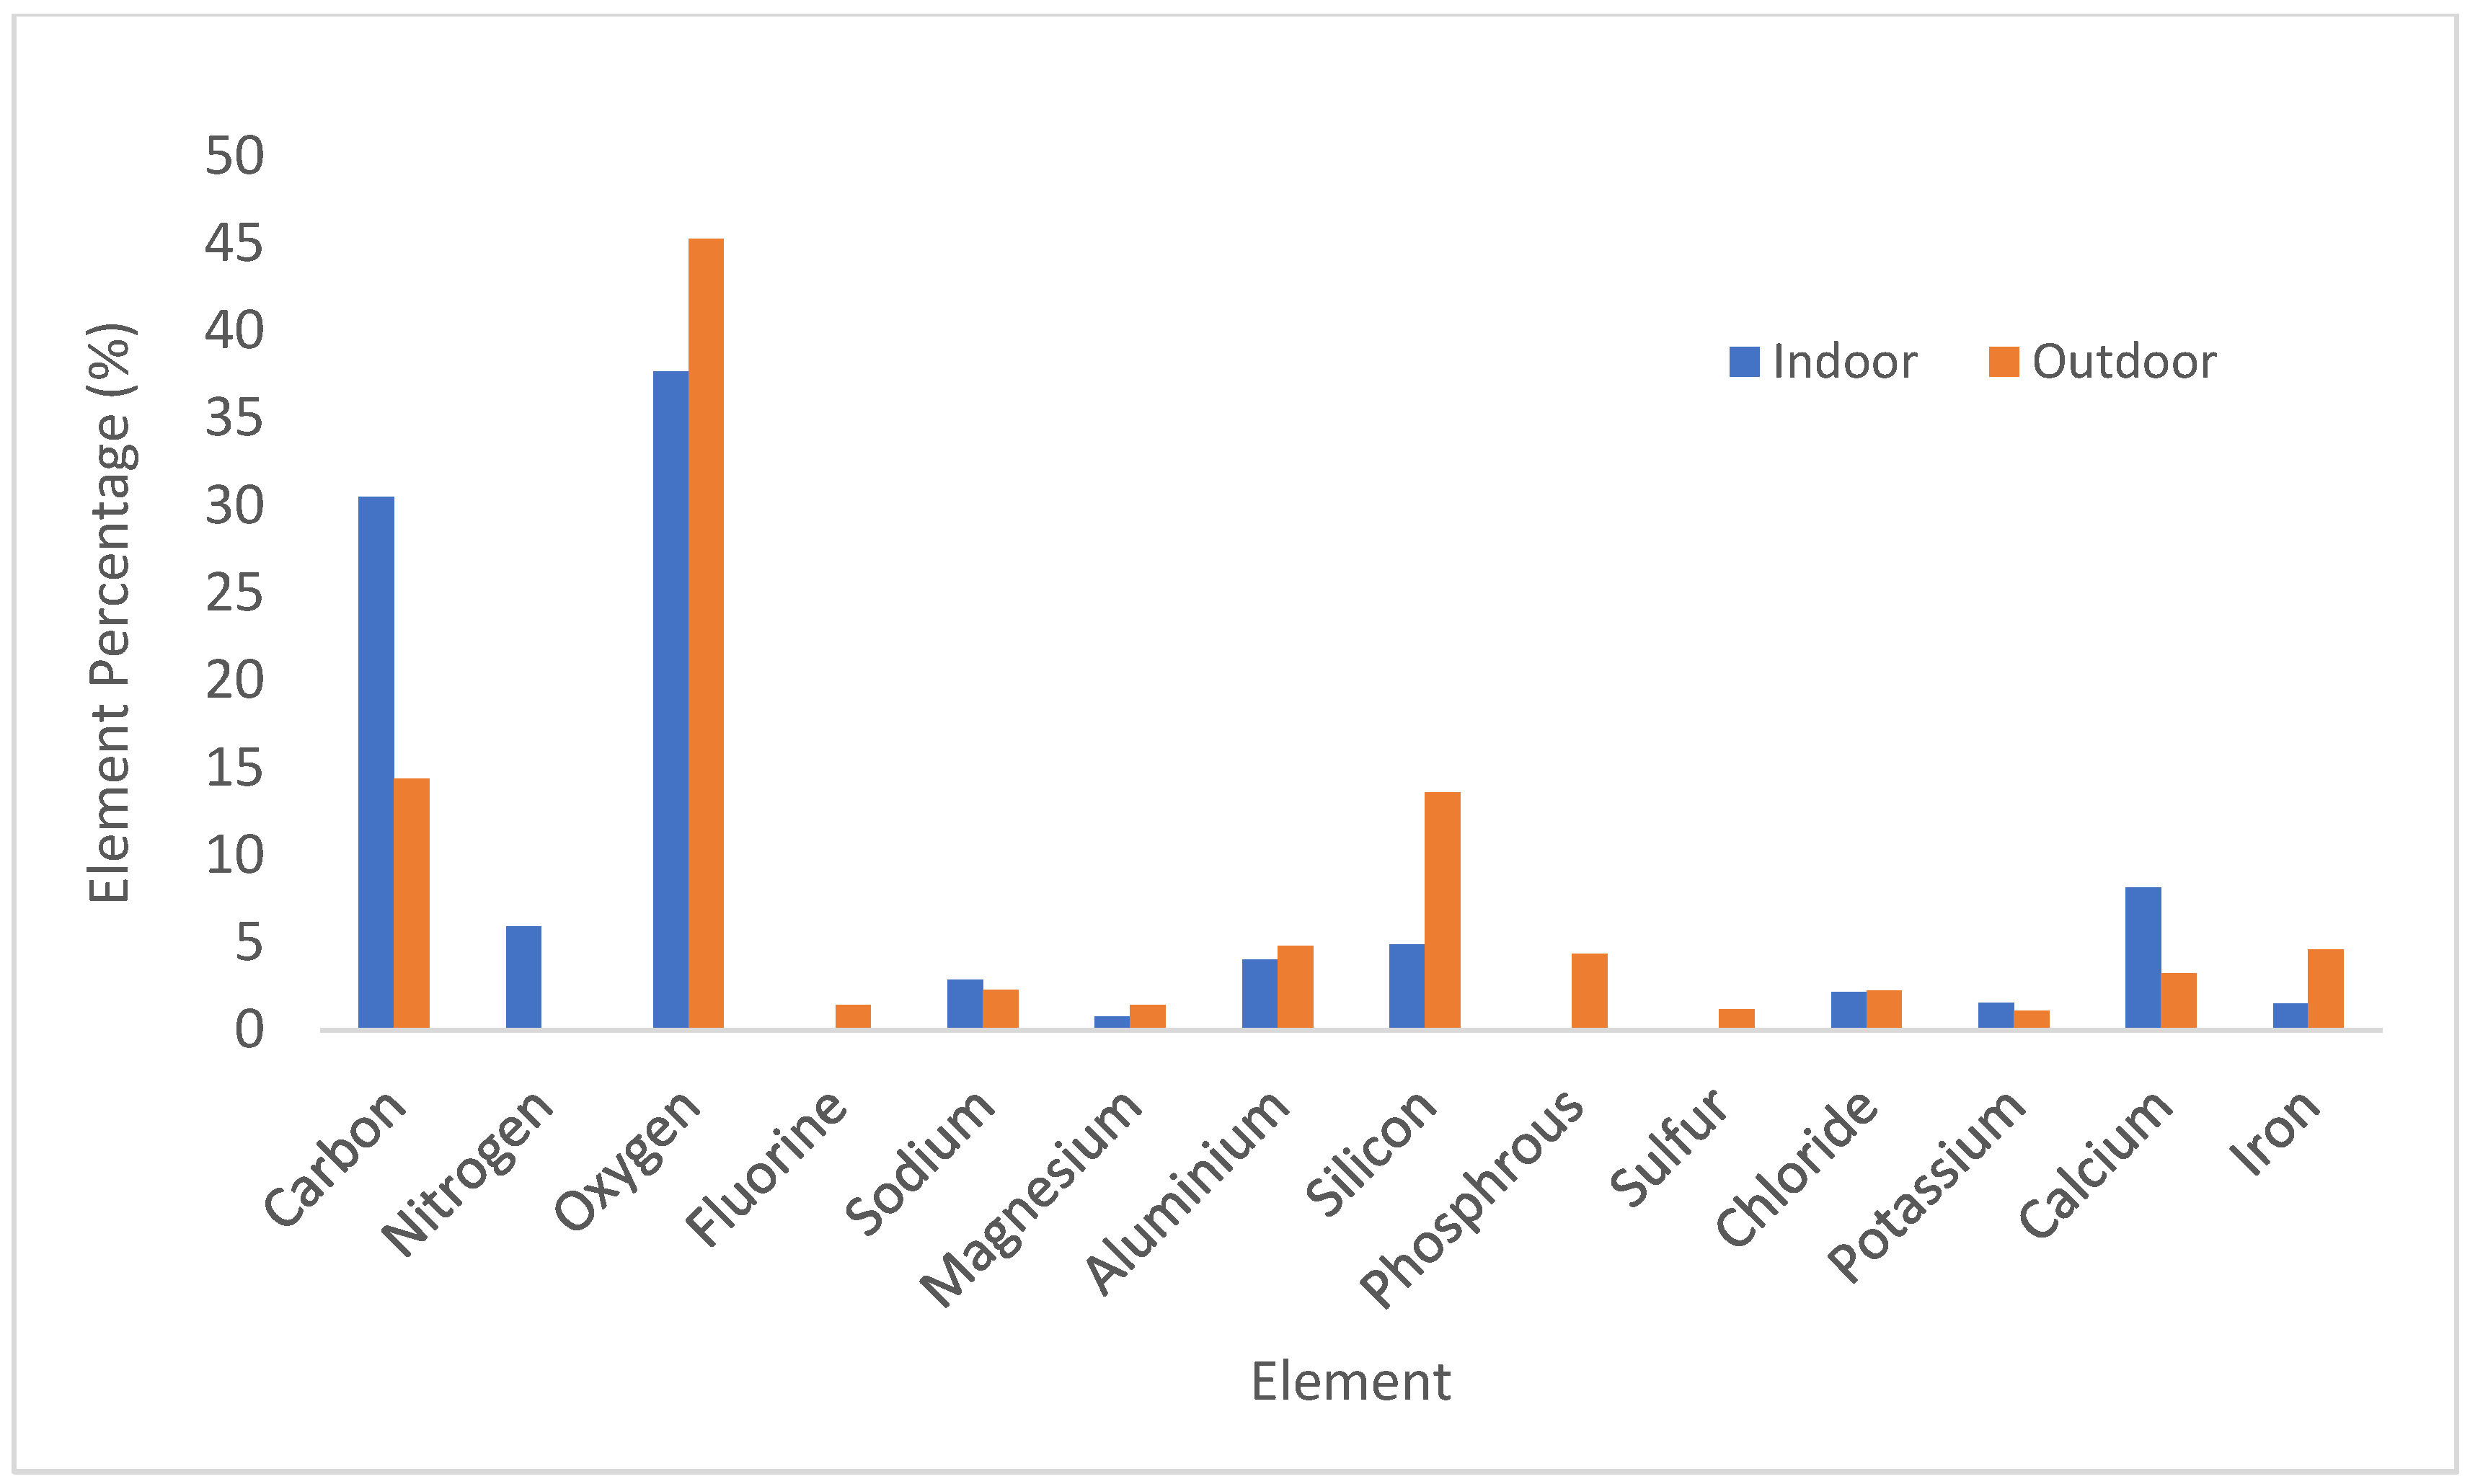
As indicated above, the use of the open-faced passive air sampler will help us to identify the differences between outdoor and indoor PMs for both morphologies and element compositions, therefore helping us to demonstrate the benefits of the use of PACs in mechanically ventilated classrooms. In general, outdoor PM contained higher concentrations of silicon, iron, and phosphorus from soil sources, while indoor PM had a higher carbon content from synthetic fiber sources.
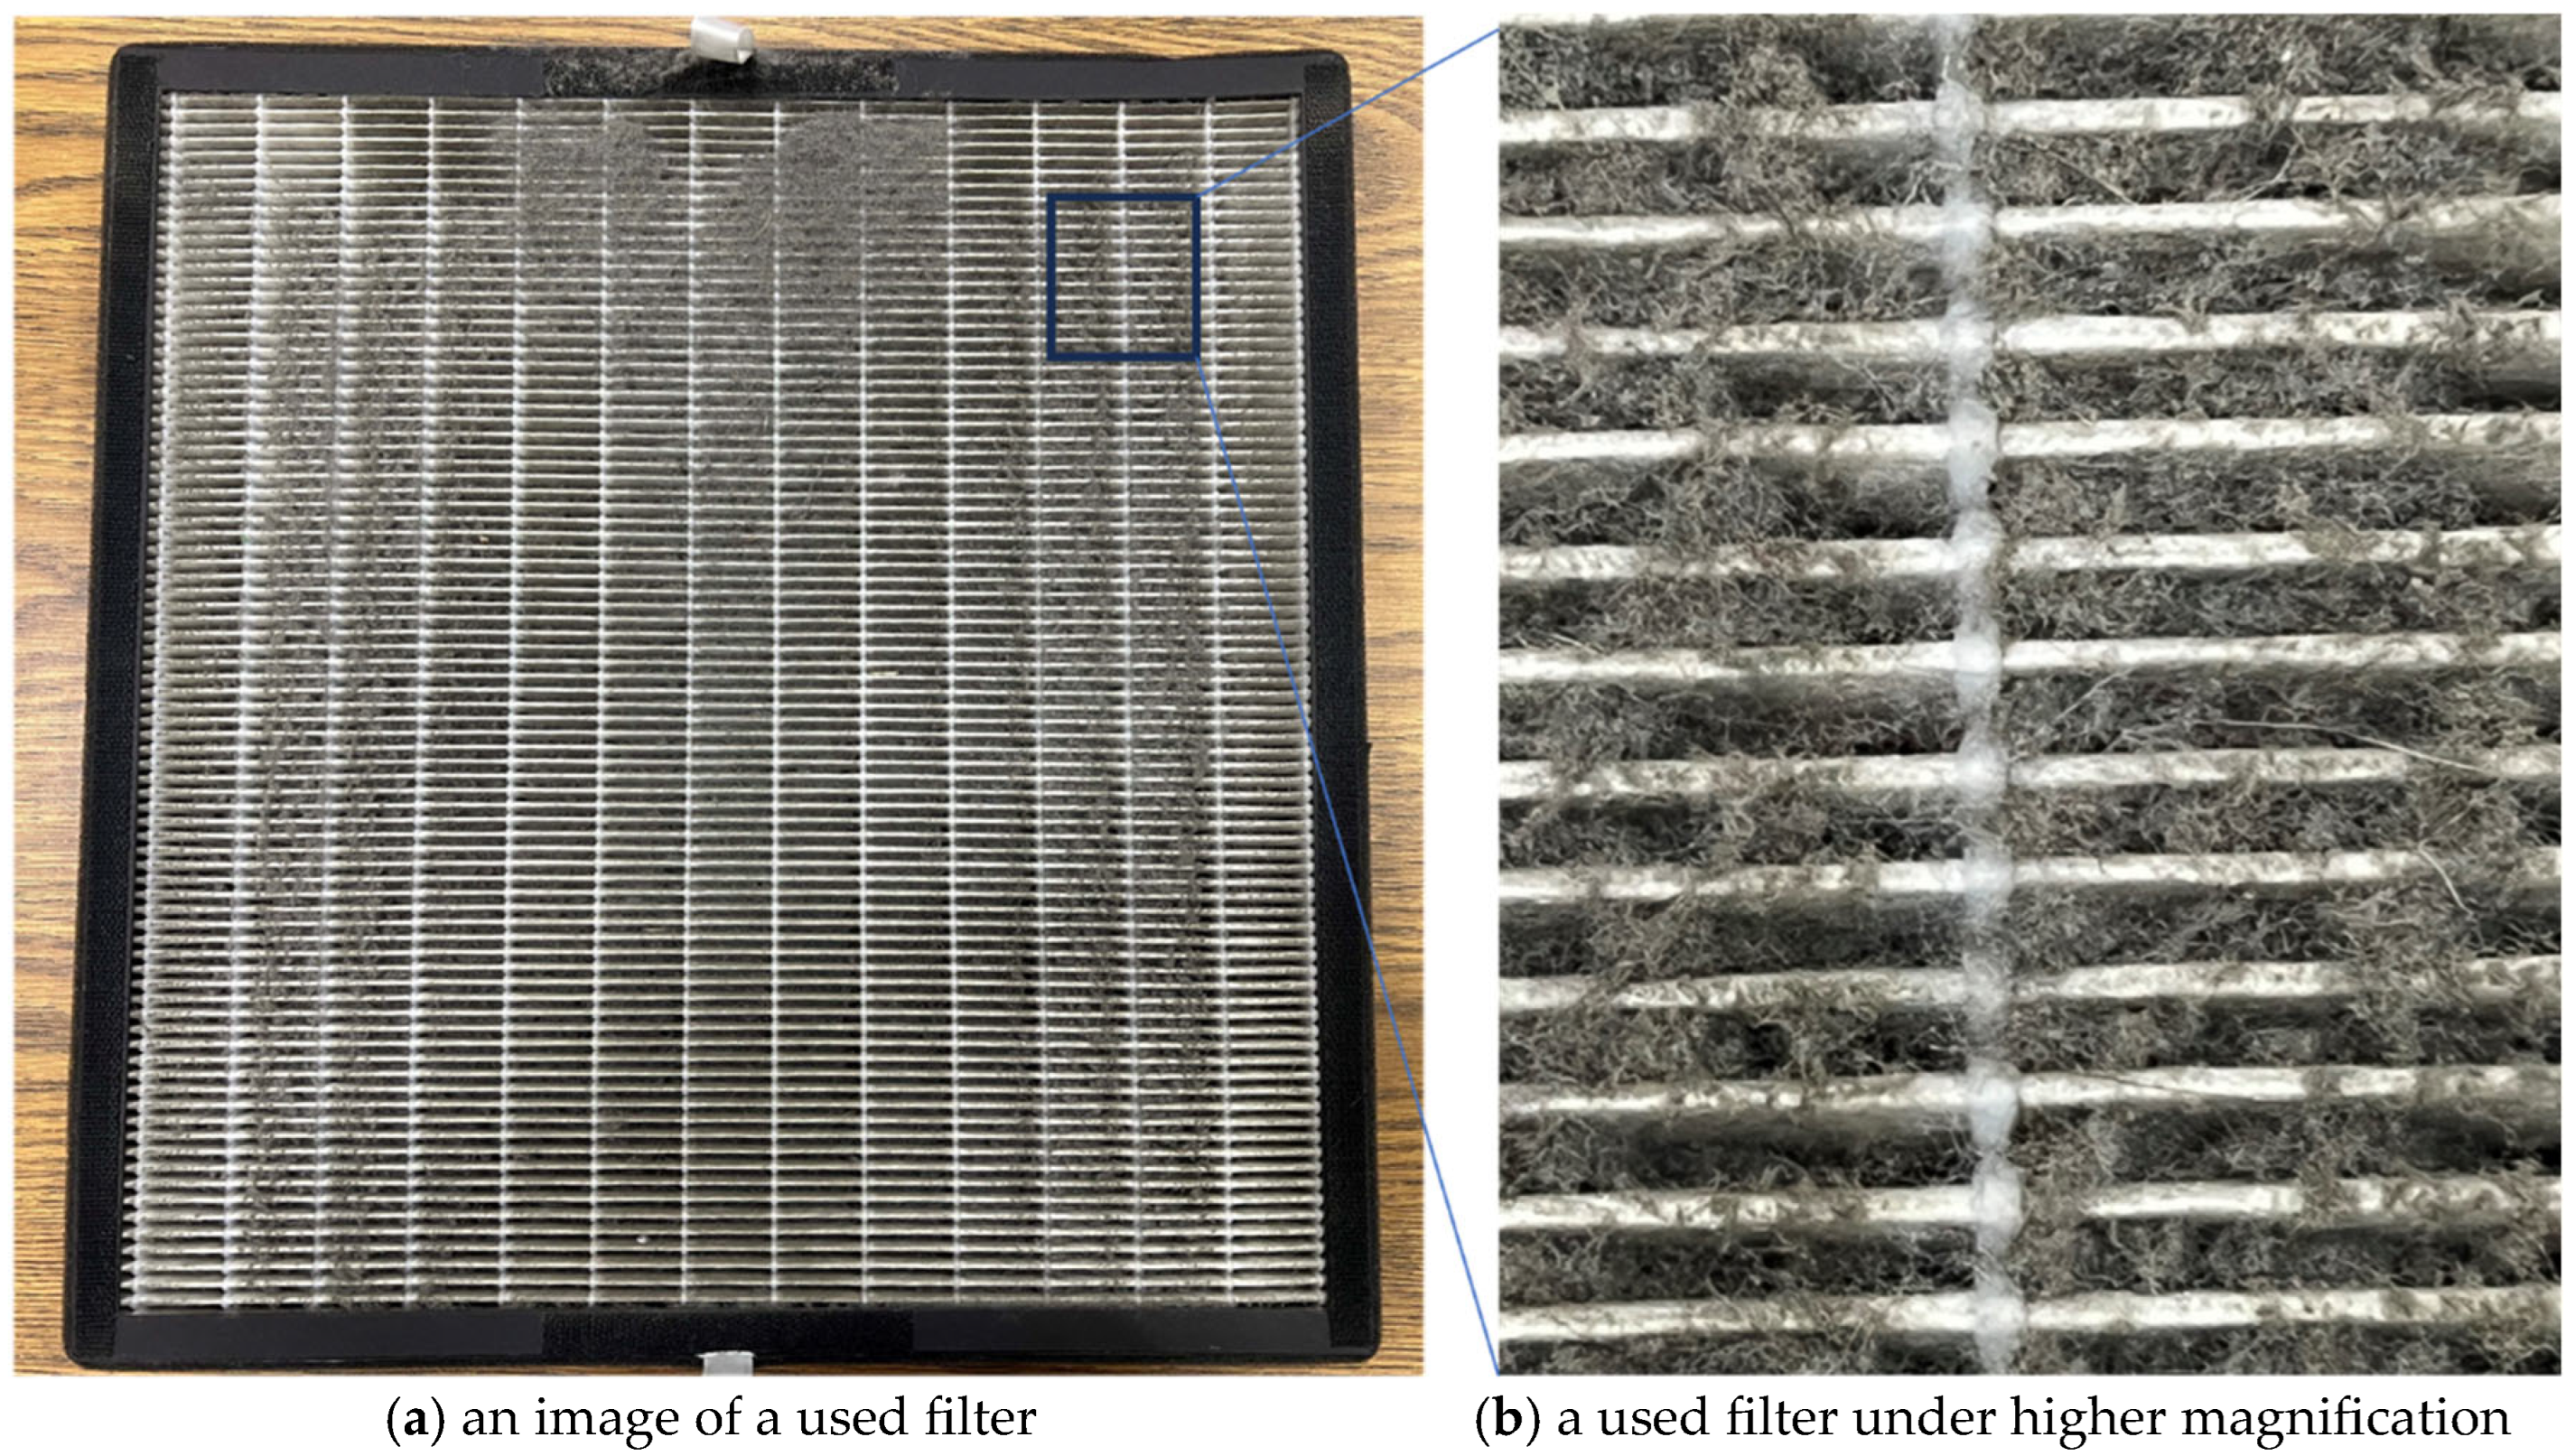
The used PAC filters (
Figure 11) exhibited substantial fiber accumulation on the filters. Even with high-efficiency HVAC systems equipped with MERV 13 filters, PACs effectively removed additional PM and fibers generated indoors.
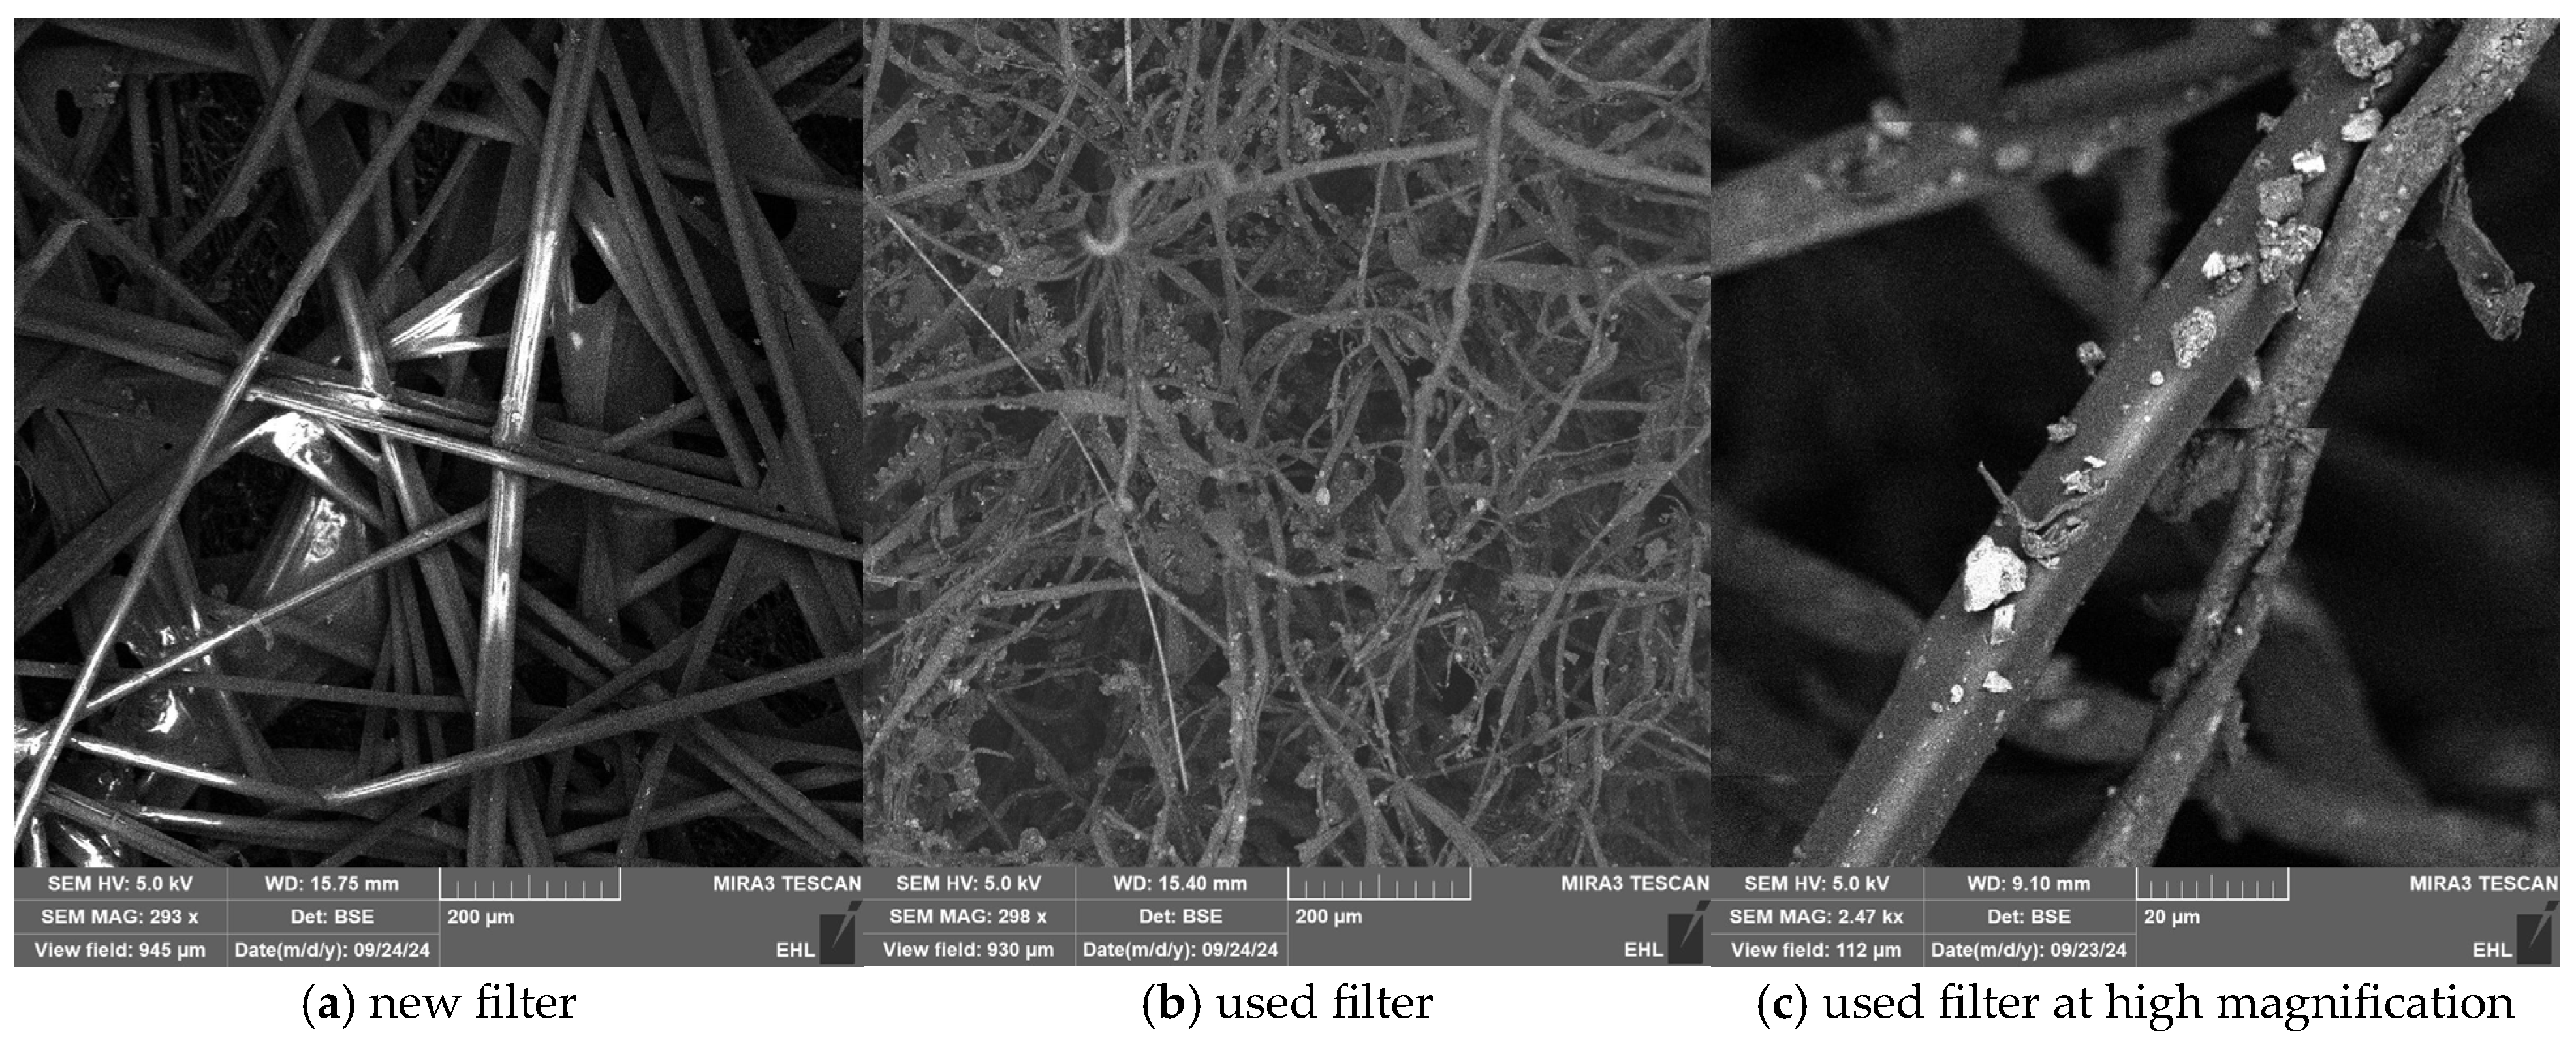
Figure 12 provides a closer look at these filters using SEM.
Figure 12a shows a new filter, while
Figure 12b displays a used filter (approximately three months old).
Figure 12c was imaged at higher magnification and highlights the presence of suspended fibers in the used filters, likely originating from carpeted floors and students’ clothing. These fibers included both natural and polymer fibers, which likely come from clothes, carpets, and hair.
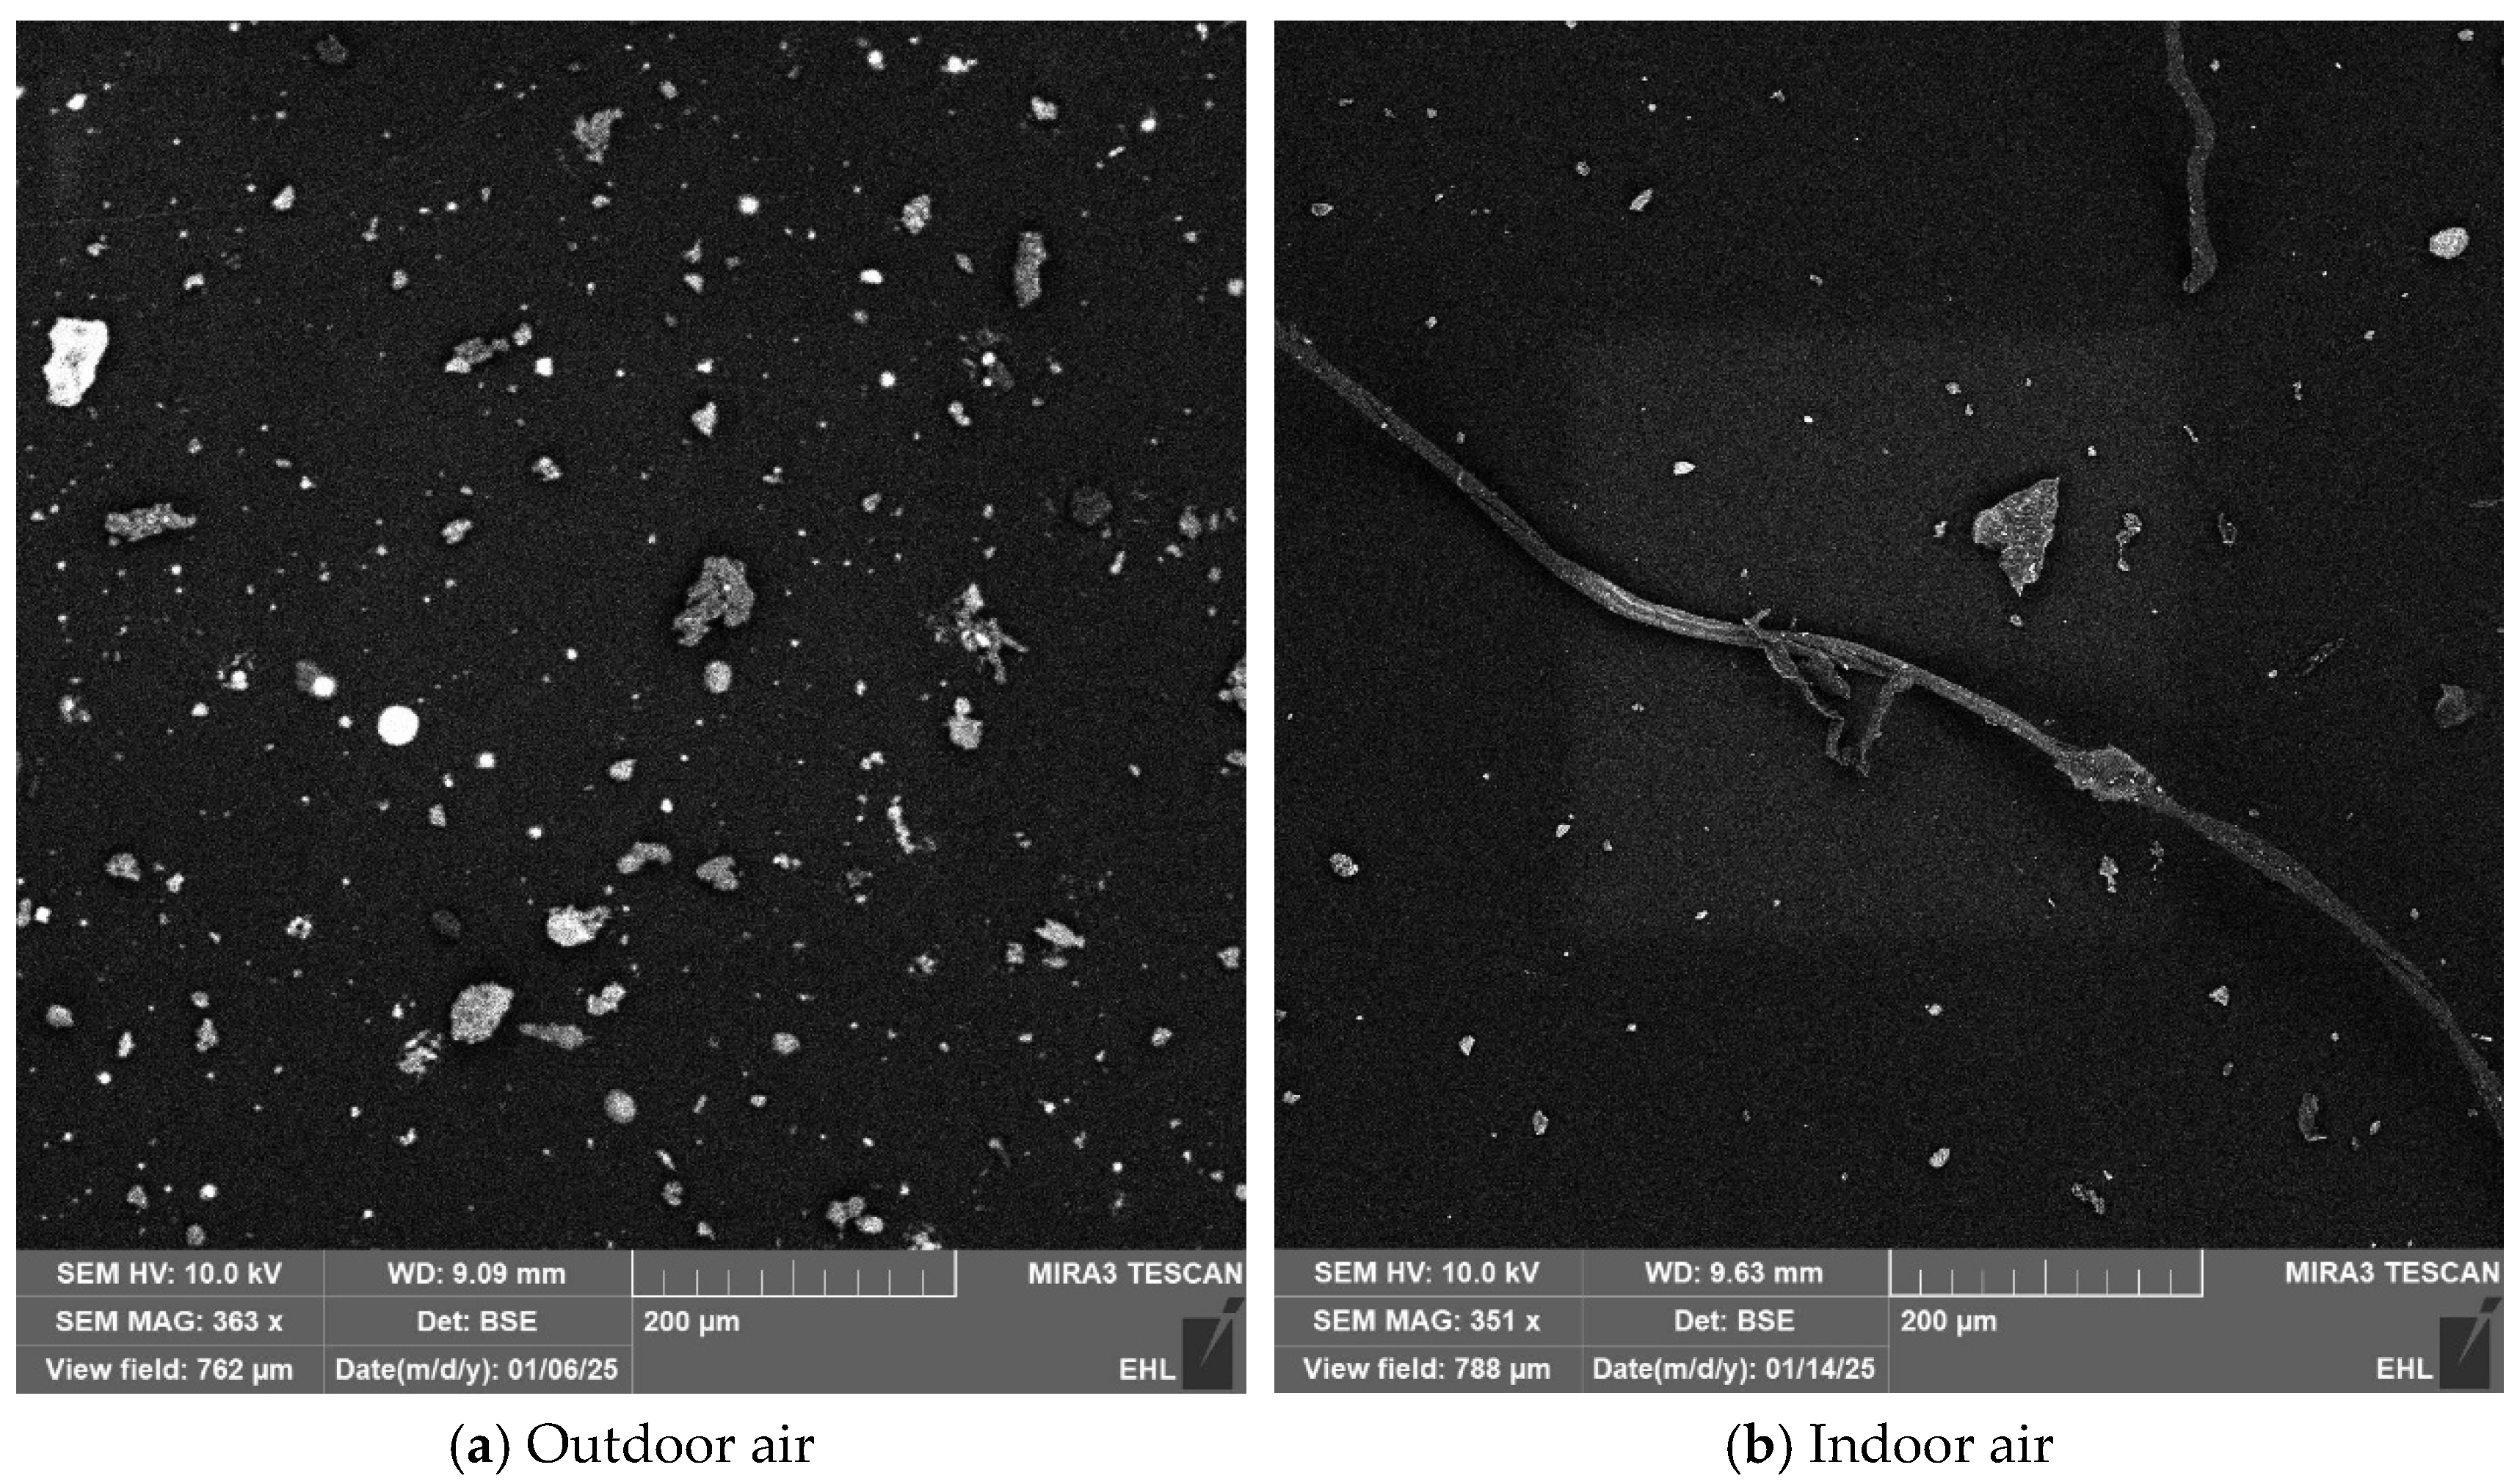
3.6. Differences in PM Morphology: Indoor vs. Outdoor
Figure 13 compares the morphology of outdoor and indoor PM collected with the OPS. Outdoor PM predominantly consisted of irregularly shaped particles with higher silicon, iron, and phosphorus concentrations (
Figure 14), likely originating from windblown dust and the school playground [
37]. In contrast, indoor PM had a higher carbon content of fibers, likely primarily derived from resuspended particles, carpet fibers, and dust from students’ clothing, which is similar to the previous finding [
25].


