1. Introduction
Air pollution represents a major risk factor for public health on a global scale, significantly affecting the continuously increasing the morbidity and mortality rates in the population. CO
2 represents the predominant GHG, constituting 80.6% of total emissions in Europe and significantly contributing to climate change [
1]. Moreover, if in 2021 around 73% of Europe’s population lived in urban areas, it is estimated that by 2050, this could exceed 80%. The consequence will be an increase in air pollution from fine particulate matter (PM
2.5), nitrogen dioxide (NO
2) and tropospheric ozone (O
3) [
2]. The presence of these global warming gases in the atmosphere intensifies extreme weather phenomena, which affects population health. Europe’s warming rate exceeds the global average [
3]. In 2023, heat waves led to 60,000 deaths and, additionally, air pollution impacts respiratory and cardiovascular health [
4,
5].
The growth of cities has increased the number of people living near major roads and highways, which has increased their exposure to air pollution from these roads. One solution to protect air quality is the implementation of vegetation barriers, which can reduce exposure to traffic emissions by influencing pollutant dispersion patterns. In this way CO
2, NO
X, PM concentrations would be reduced [
6].
Since the main problem in urban areas is vehicle emissions, it is necessary to distinguish between traffic-related sources and other sources of pollution in urban centers. For example, a case study from Varese, a city located in Northern Italy, indicated that 74% of global PM emissions are caused by non-industrial combustion and about 24% by road transport [
7,
8]. In addition, it is known that there are pollution hotspots at intersections and transport hubs, but also in pedestrian areas with limited traffic flow [
9,
10,
11]. Research conducted during the pandemic has indicated non-linear reductions in air pollution and unexpected pollution hotspots, although traffic has been significantly reduced [
10,
11]. One explanation would be heavy diesel vehicles serving port activities, construction, the public transport sector, building ventilation systems, as well as trapped pollutants from busy streets. This problem arises especially in the case of PM which are different in shape, composition, and dimensions, unlike gases which can be more easily identified [
10,
12].
In 2021, Romania ranked 48th worldwide in terms of GHG emissions, accounting for approximately 0.22% of total global emissions [
13]. The incomplete combustion of vehicle fuels accounts for the estimated 3.5 million deaths each year [
14], while the transport sector in total is responsible for about 4.2 million premature mortalities from external air pollution [
15]. CO
2 represents the main product of complete combustion of carbon-based fuels, but there is nevertheless a subtle link between incomplete combustion and CO
2 emissions. Incomplete combustion produces less CO
2 per unit of fuel because some of the carbon is converted to CO, HC, or particulates, which are intermediate or unoxidized forms of carbon. However, the overall impact on the climate may be more severe: CO and CH
4 (from incompletely burned fuels) are also greenhouse gases, and some are more potent than CO
2 (e.g., CH
4 is approximately 28–36 times more potent over a 100-year period) and incomplete combustion can also lead to a higher global warming potential (GWP), even with lower CO
2 levels. Even though CO
2 is technically the product of complete combustion, incomplete combustion still contributes to climate change through indirect CO
2 (from further oxidation), other powerful greenhouse gases, and reduced energy efficiency, which basically means higher fuel consumption. This points to the requirement for effective strategies to reduce CO
2 emissions from the transport sector, enhancing air quality and assisting in the global climate stabilization efforts. Identifying and implementing viable solutions becomes critical in addressing this pressing environmental challenge [
16].
Air pollution and climate change are essentially environmental problems, and their consequences for public health, the global economy, and quality of life are major obstacles to sustainable development. The relationship between the two phenomena is complex and interdependent, contributing to the intensification of climate change [
17]. Air quality is closely linked to the presence of greenhouse gases (GHGs), whose increased concentration has significant consequences for the global climate system. According to the report published in 2021 by the Intergovernmental Panel on Climate Change [
18,
19]. GHG emissions from human activities are the main factors responsible for the increase in global average temperatures and the accelerated changes observed in nature. CO
2 continues to be the main source of greenhouse gases, mainly due to our ongoing dependence on fossil fuels. This justifies the focus of climate policies on decarbonizing energy systems and electrifying transport. Pollutant emissions from transport, energy production, and industrial processes account for up to 8.2% of total global greenhouse gas emissions [
20]. The anthropogenic sources are driving the atmospheric concentration of CO
2, which are essential for exacerbating the greenhouse effect and the associated climate change phenomenon. Human activities significantly contribute to the accumulation of CO
2 in the atmosphere, reinforcing the greenhouse-effect and impacting the dynamics of climate change. As a result, the transport sector was identified as a major contributor, accounting for about 29% of global greenhouse gas emissions, mostly in the form of CO
2 [
18].
With constantly growing concerns about air quality, public health, and reduced energy consumption, recent years have witnessed a growing interest from public transport operators in switching more to hybrid and electric buses. Hybrid vehicles, which integrate an internal combustion engine and an electric motor, significantly help to reduce exhaust emissions. At the global level, hybrid buses have a market share of 14.5% [
21], showing a significant paradigm shift to achieve the 2030 UE targets of a net 55% reduction in greenhouse gas emissions and climate neutrality by 2050 [
1].
Bucharest has the most extensive transport network in Romania and the city has upgraded its bus fleet with hybrid and electric vehicles during the last 4 years. It also upgraded both the trolleybus and tram fleets with high-performance vehicles. The public transport operator in Bucharest has a network covering 1.335 km
2, of which 240 km
2 are in the urban area. Bucharest Public Transport Company, STB S.A. conveys 1.071 million passengers and has the following structure: a bus network with 1.640 vehicles operating on 122 lines, the trolleybus network with 265 vehicles on 13 lines and, finally, the tram network with 527 vehicles on 22 lines [
22,
23].
STB adopted traffic fluidity measures to encourage public transport using their own transport networks, the existing tram lines for bus traffic (where it is possible) and intelligent traffic management, underground, and overground passages, etc. These actions have been partly compromised by growing traffic and the opening of construction projects to fix public networks (heating, electricity, water, and sewage).
In this paper, we have conducted a comprehensive analysis and estimated the impacts of optimizing the urban transport system in Bucharest city, in the context of an increasing number of motorized vehicles which generate countless daily traffic jams and producing high levels of air pollution. We are focusing on the potential of renewing the vehicle fleet and infrastructure to improve the appeal and share of public transport, instead of personal vehicles. This analysis also highlights the need to identify urgent and specific measures, as well as sustainable environmental policies, to eliminate the negative effects on urban pollution.
2. Materials and Methods
Data were collected from the Department of Information Technology and Communications, the Traffic Planning and Dispatching Services, the Mechanical and Energy Services of the Infrastructure Directorate, and the Environmental Protection and Waste Management Services of the Technical Department of the Bucharest public transport operator. Data includes the number of vehicles, vehicle type, engine type, mileage, and fuel consumption. We recomputed the fuel values and used the JASPERS method to obtain the results.
The aggregate assessment method of the Joint Assistance to Support Projects in European Regions (JASPERS) initiative [
23] was applied to estimate GHG emissions from the transport sector [
24,
25,
26,
27,
28,
29] and have used the cumulative data on annual vehicle mileage for the bus fleet of the Bucharest transport network. The data used in this analysis was sourced from the transport model and includes the assessment year (as the reference year for projections) and annual vehicle mileage split by technology categories (EURO III, EURO IV, EURO VI, hybrid and electric buses).
For the electric vehicles, the value for kWh/km was sourced from the Web TAG database (United Kingdom), and the value is 1.1798 kWh/km [
28].
In the Granton bus technical data sheet, the total capacity [kWh] is 383.23, and the bus range is 314.3 km, according to the SORT 1—SORT UITP PROJECT report [
29]. Producers do not recommend lowering the battery capacity below 75–80%. Under these conditions, the specific consumption calculated is 1.22 kWh/km.
Data on the lab measurements of specific consumption for electric buses are not available. The total energy consumption for 2024 represents 2,108,035 kWh and a mileage of 2,081,429 km, which means that the value about 1.02 kWh/km is closer to that provided by Web TAG. The emission rate for electricity consumption corresponds to the amount of GHG emissions per unit (kWh/kg) of electricity consumption on the national electricity grid. Energy consumption and mileage were recorded under the real traffic conditions, so the accuracy of the measurements is lower than under standardized laboratory equipment assessment (standard charge, standard cycle—acceleration, driving, brake force, and high-precision tools).
STB S.A.’s bus fleet structure in December 2024 is presented in
Table 1.
The rate of emissions of each GHG per unit of fuel consumed (for petrol and diesel consumption) are presented in
Table 2 [
27].
N
2O and CH
4 are neglected in JASPERS estimates [
27], which represents a methodological simplification that is common in some emissions calculations, especially in the context of TTW (Tank-to-Wheel) or standardized direct emissions. CH
4 and N
2O occur in extremely small quantities when fossil fuels are burned.
The rate of emissions of each GHG for electricity for Romania is 0.517 kg CO
2/kWh is an official factor from JASPERS CBA Guidance [
26].
Equivalent GHG factors were used to convert each greenhouse gas into CO
2e, which represent CO
2-equivalent emission for GHG are present in
Table 3.
3. Results
GHG fleet buses emissions and mileage from buses owned by the Bucharest transport operator in 2021, 2022, 2023, and 2024 are estimated in
Table 4,
Table 5,
Table 6,
Table 7 and
Table 8.
GHG fleet buses emissions from buses owned by the Bucharest transport operator in 2022 are estimated in
Table 5.
GHG fleet buses emissions from STB S.A. in 2023 are estimated in
Table 6.
CO
2e emissions for entire fleet buses released in 2024 are estimated in
Table 8.
In the JASPERS method estimated calculations, the speed of buses has been differentiated according to urban, interurban, and rural route types, with the share of vehicle traffic in each of these three areas assumed to be 70%, 20%, and 10%, accordingly.
In 2024, electric buses traveled approximately 2,081,429 km, and diesel with hybrid buses traveled 58,027,781 km. The total mileage of diesel-only and electric buses in 2024 was 60,109,210 km. The electricity consumption for Granton buses in 2024 was 2,108,035 kWh and the estimated CO2e emissions are 74.5 kilotons, which represents a substantial reduction of almost 13% compared to 2023; this improvement is due to the decline in the mileage of the entire bus fleet, but also because of the introduction of electric buses. Emissions from buses operating exclusively on diesel engines have fallen by approximately 12 kilotons CO2e during the period analyzed, pointing to the onset of a shift towards a more sustainable urban transport system. During the period 2021–2022, the effects of the COVID-19 pandemic were strongly reflected in reduced traffic and more fluid traffic conditions. The results obtained for 2024 indicate the direct impact of reducing the number of diesel buses in favor of electric ones and proves the superior technological efficiency of electric buses in attenuating climate footprint. Consequently, the integration of electric buses into public transport fleets offers significant potential for decarbonization.
From a sustainability and transport planning perspective, these data are consistent with the best practices for public transport decarbonizing. The combination of reducing total emissions and improving efficiency per kilometer implies the following:
- ○
a scalable impact, i.e., interventions are effective both at the macro level (total emissions) and at the micro level (per km);
- ○
the effectiveness of policies; environmental or fleet management policies implemented after 2023 have generated quantified carbon emission reductions;
- ○
sustainable urban mobility; data supports strategies for transitioning to greener public transport systems in line with EU and global climate goals.
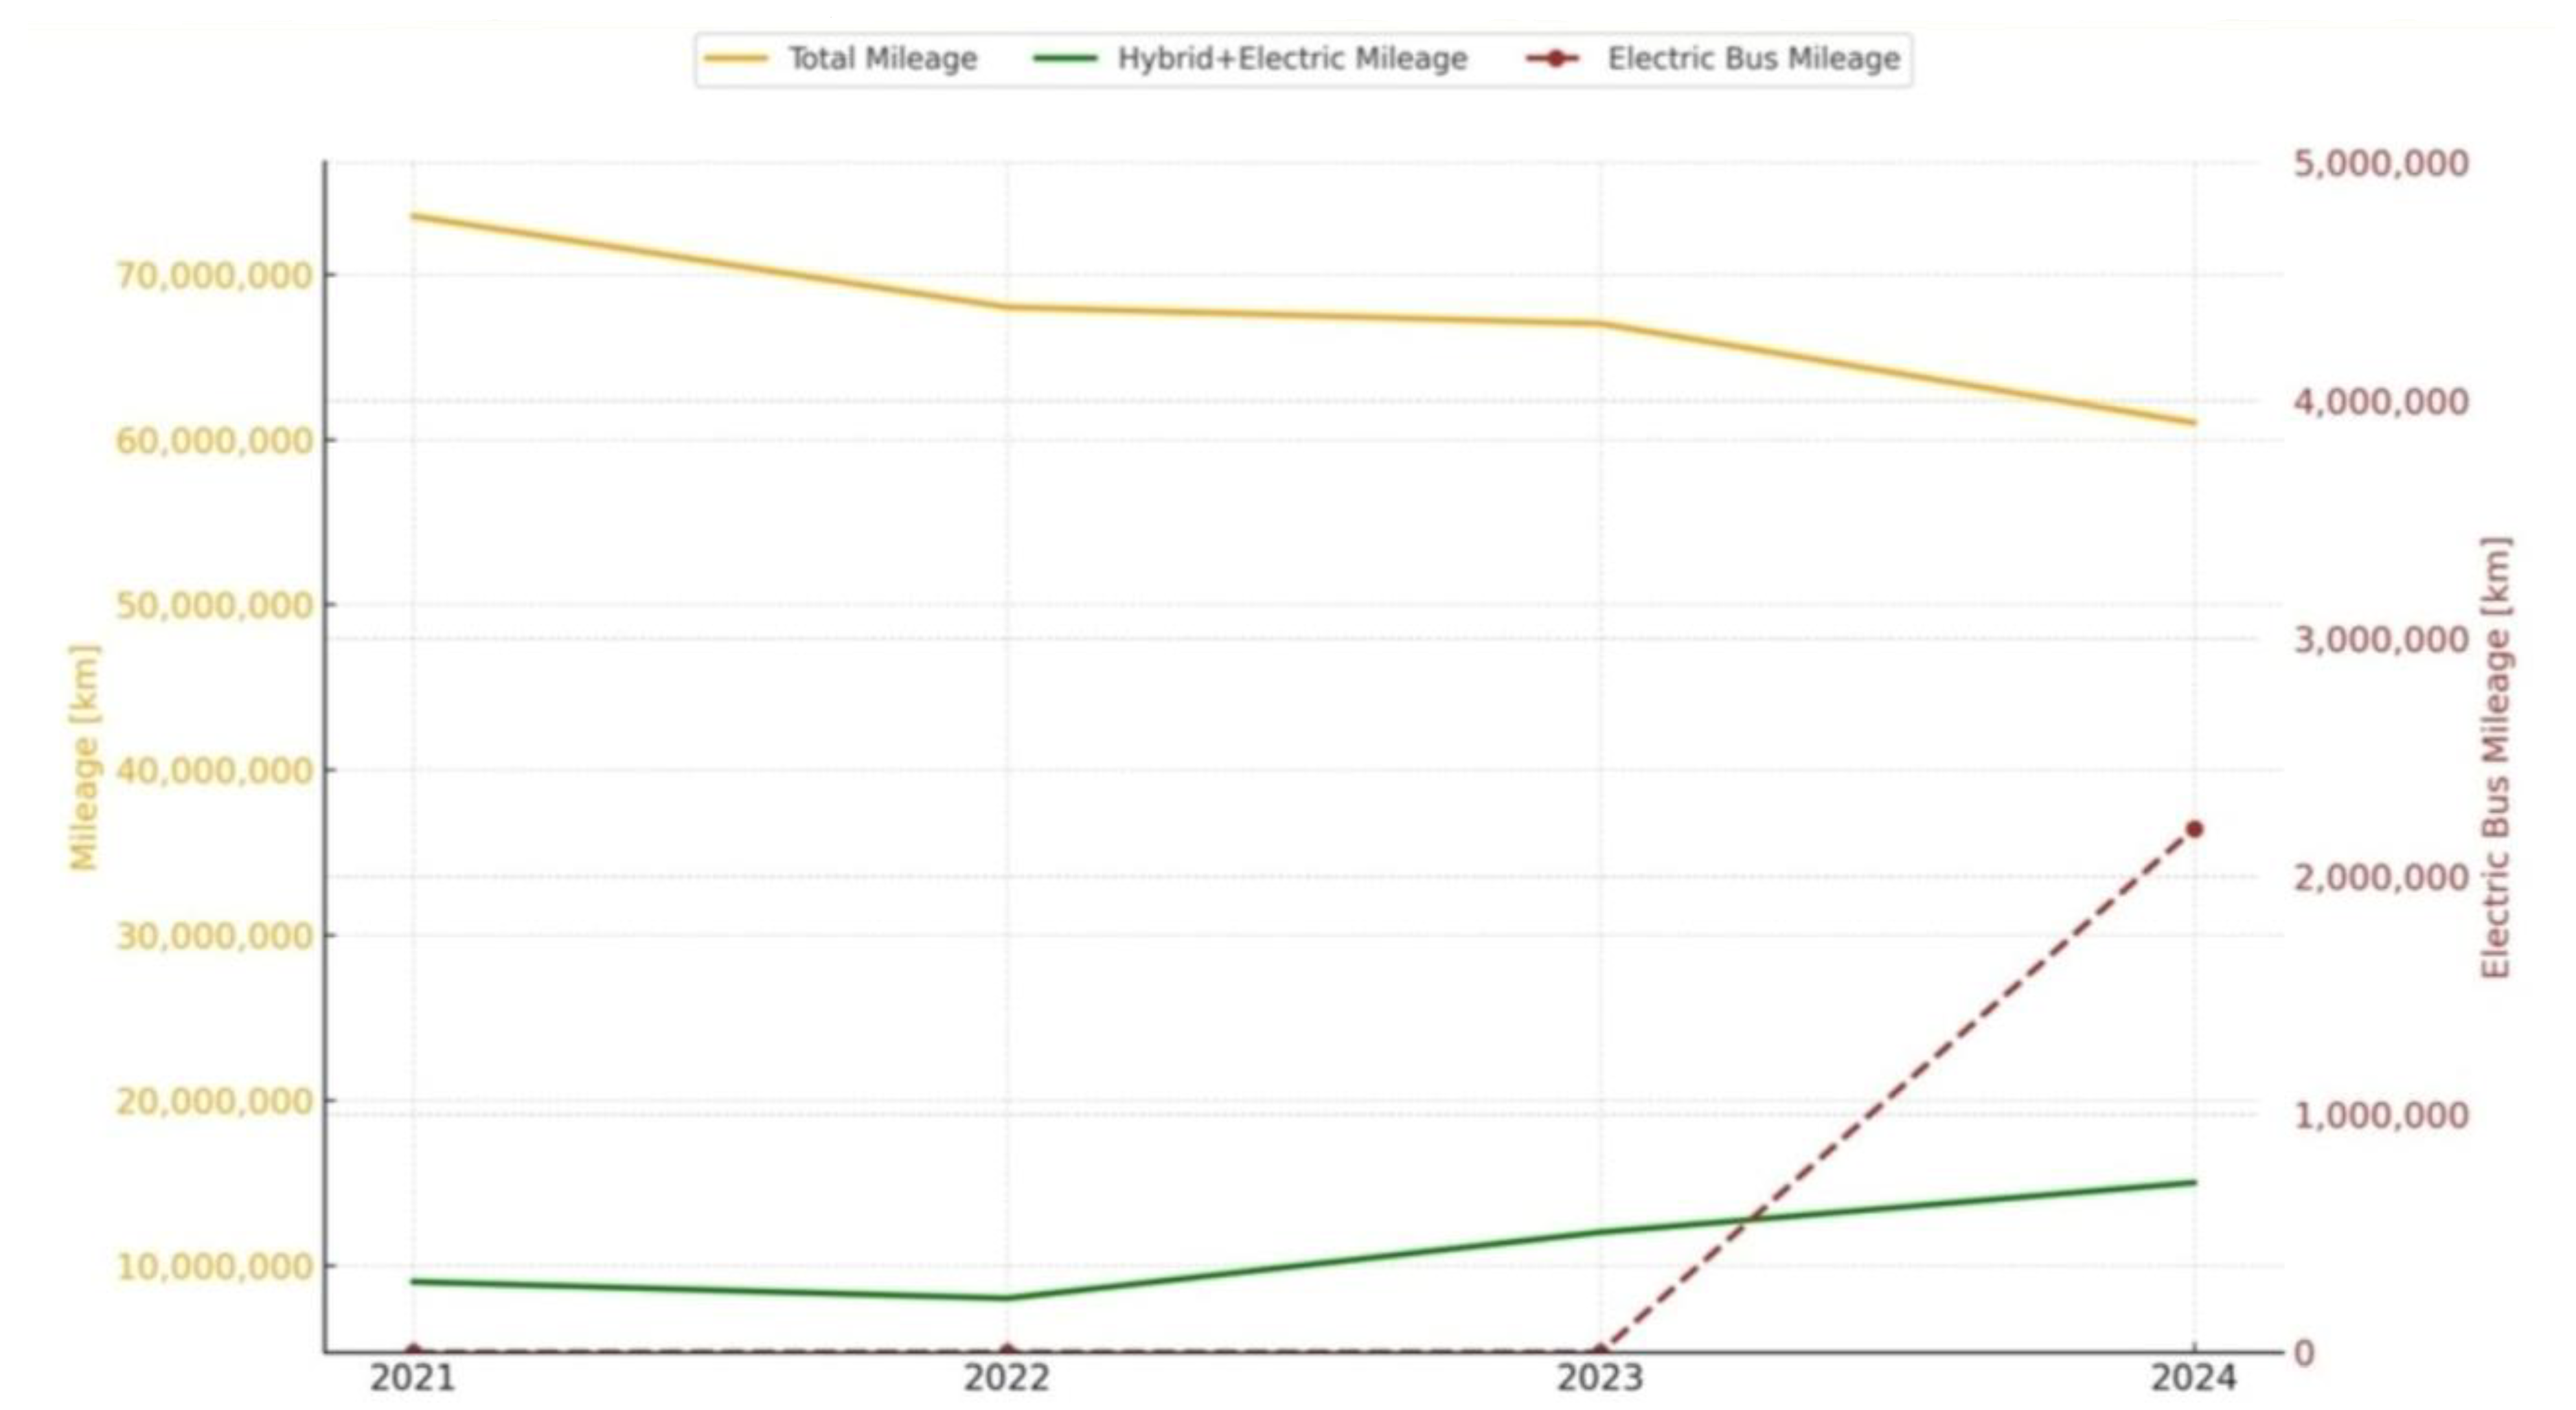
Figure 1 illustrates the evolution of the total annual mileage and the mileage specifically attributed to hybrid + electric buses and electric bus mileages from the STB S.A. bus fleet between 2021 and 2024.
Even though the electric and hybrid vehicles still account for a relatively low share of total mileage, their upwards trajectory reflects a positive shift towards reducing emissions and improving energy efficiency in urban transport (
Figure 1).
Figure 2 depicts the percentage of electric + hybrid bus mileage compared to the entire fleet and with electric bus mileage between 2021 and 2024.
In 2024, electric buses accounted for approximately 3.47% of the total distance traveled by the vehicle fleet. Significant progress was made between 2023 and 2024, confirming the improvement of infrastructure and the expansion of the fleet with environmentally friendly vehicles (
Figure 2).
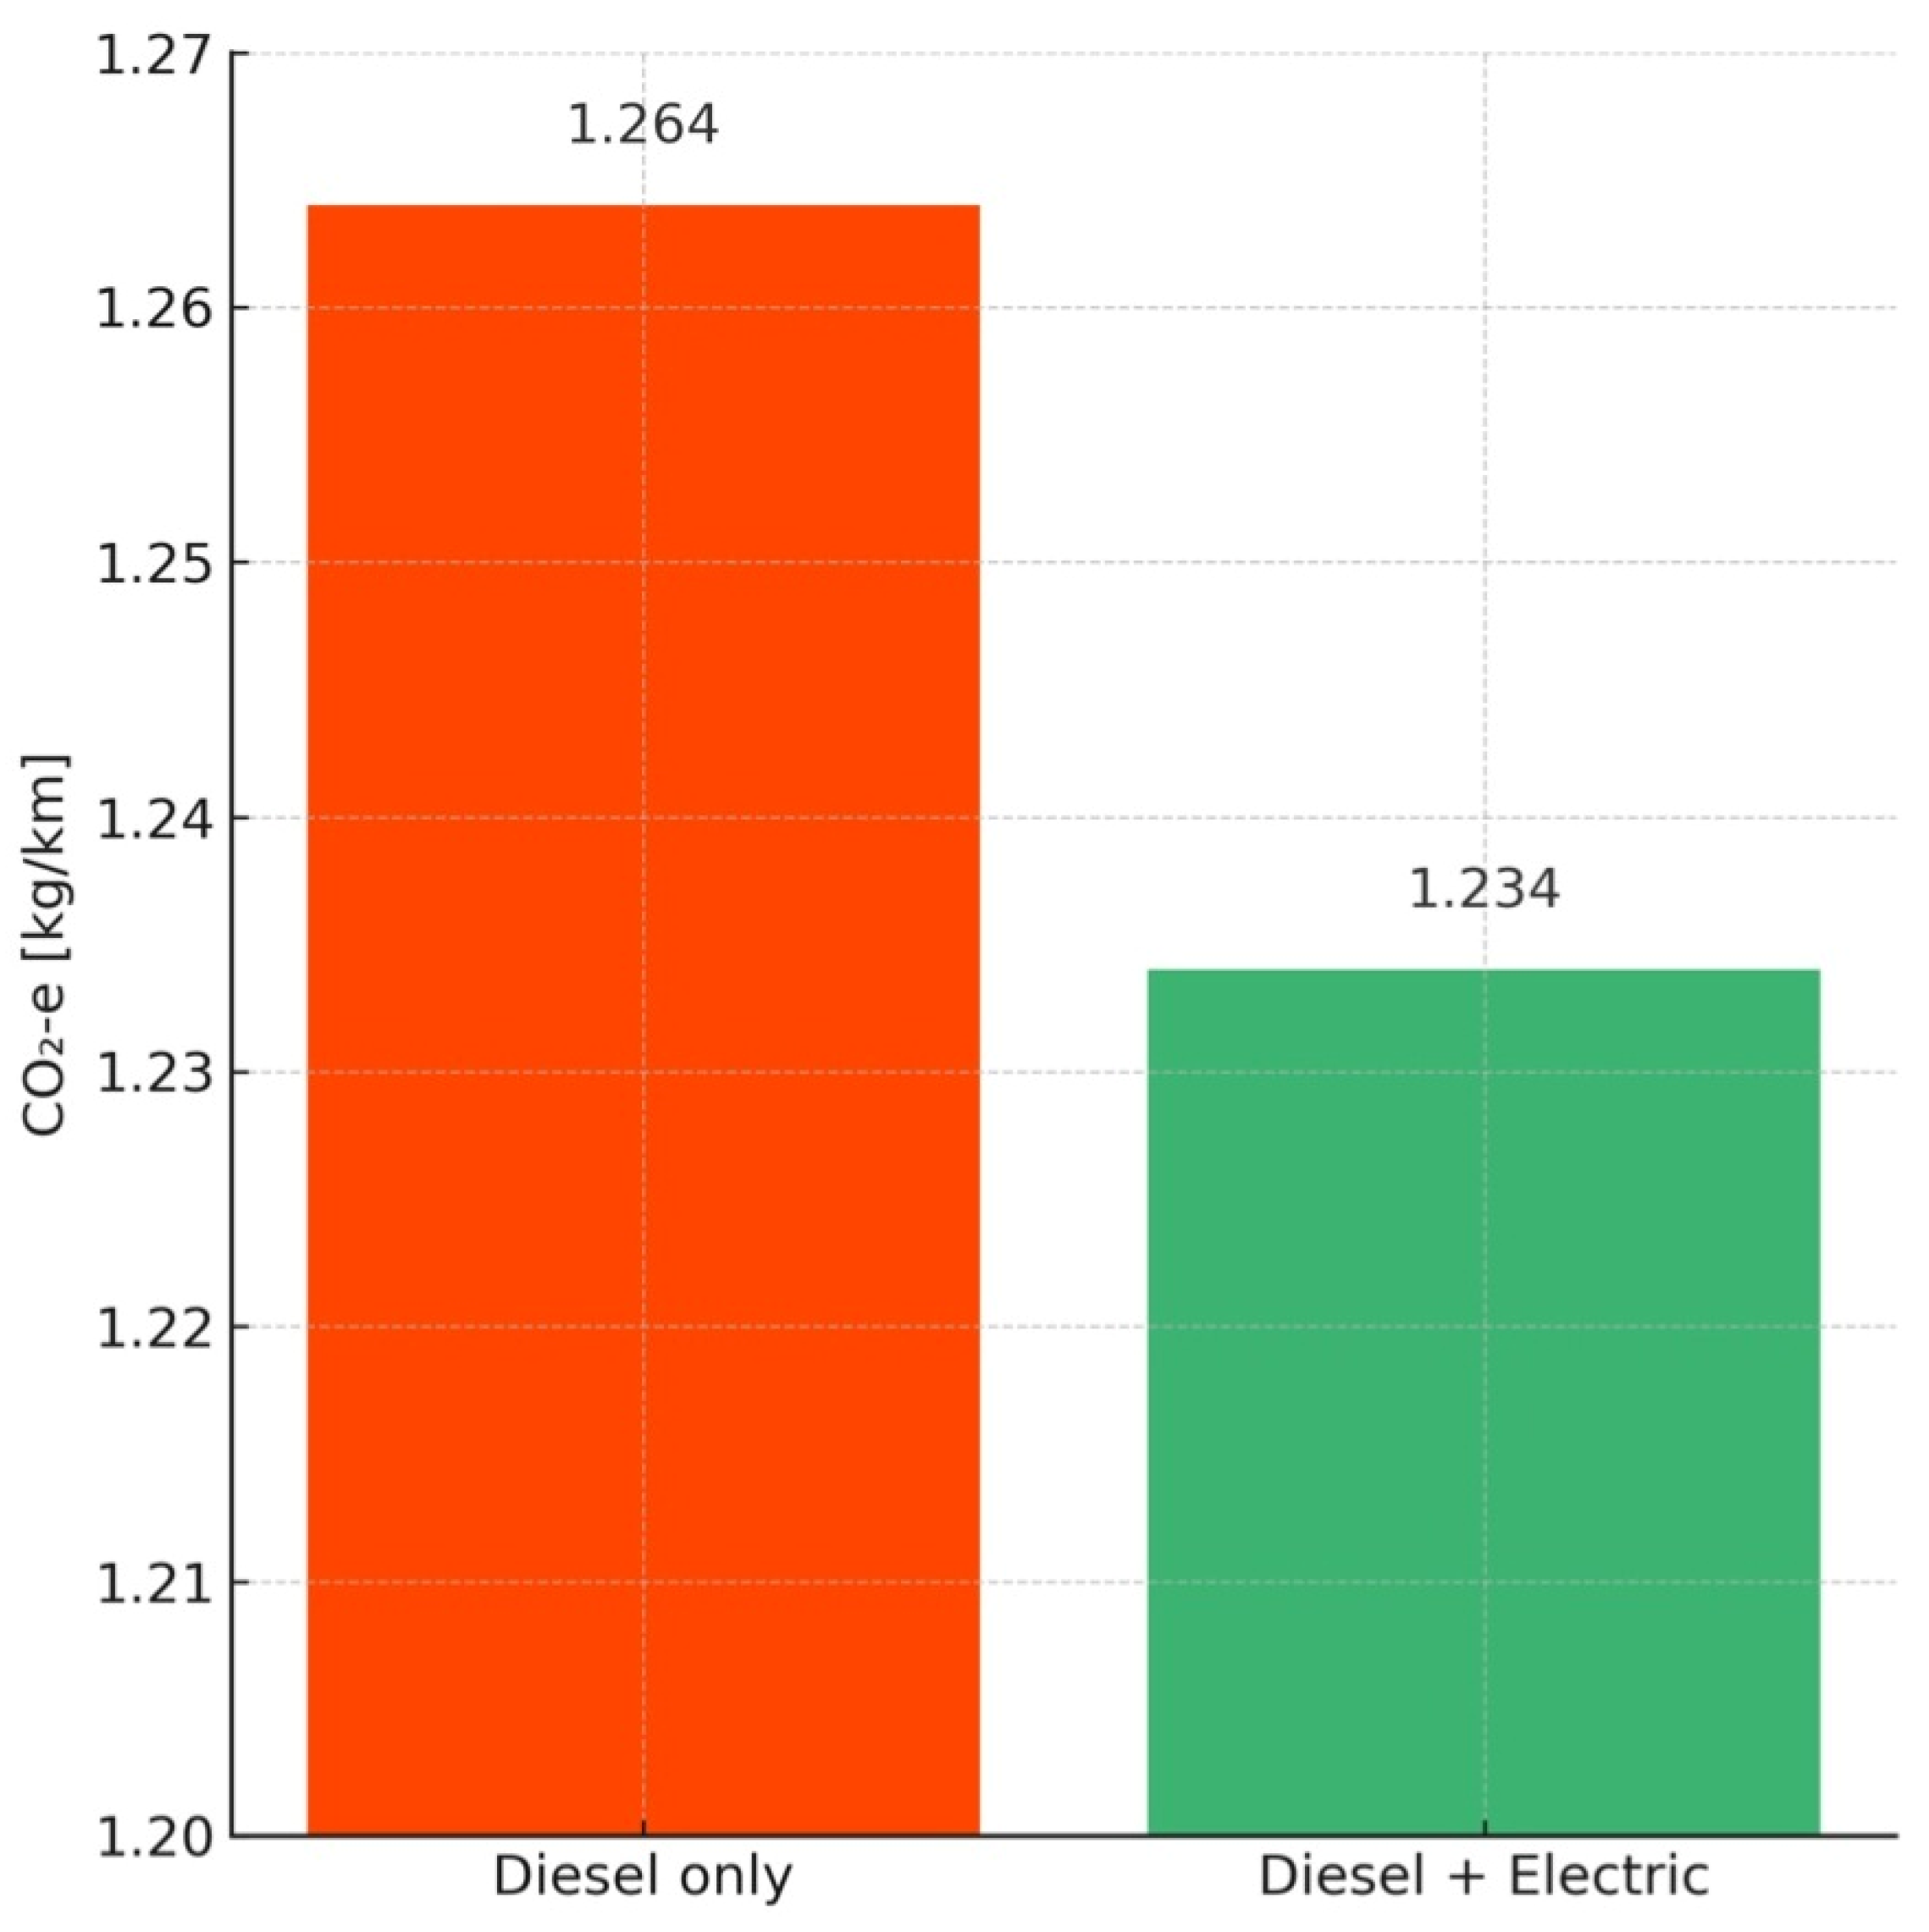
A relevant comparison can be made between the years 2023 and 2024: specific emissions per kilometer are very close in terms of value between these years, at 1.268 kg/km in 2023 and 1.264 kg/km in 2024, for diesel only (
Figure 3). With electric buses put into service in 2024, specific emissions per kilometer attained 1.234 kg/km, i.e., 2.68% reduction compared to the previous year. While the total CO
2e emissions are higher in the mixed scenario, specific emissions per kilometer are approximately 2.68% lower. This decrease demonstrates the superior technological efficiency of e-buses in reducing the carbon footprint.
This apparent reduction in specific emissions highlights the environmental benefits of integrating electric buses into the fleet. Although the reduction per kilometer may appear modest, over the long distances typical of urban transport systems, it leads to a substantial decrease in total greenhouse gas emissions. This supports wider sustainability ambitions, proving in practice that the partial electrification of bus fleets can deliver real emissions cuts. In this way, such improvements are essential for the alignment of public transport operations with climate goals and urban air quality standards. A significant impact on CO2 emission reduction is instantly visible when the share of electric vehicles increases in the total fleet. 2024 represents an important step in moving towards a greener vehicle fleet, with a significant growth in the share of electric vehicles, despite a modest decline in the total vehicle fleet. This trend is directly reflected by a reduction in carbon dioxide emissions. If the electrification rate is maintained in 2025, a significant emission reduction is projected, potentially exceedingly up almost to 14% reduction target, given that electric vehicles continue to gain market share.
CO2 is still the biggest emitter of greenhouse gases, together with N2O and CH4, which have a higher global warming potential, proving the importance of ensuring that emissions inventories are comprehensive and consider all major factors driving climate change.
The descendent trend of CO
2 and CO
2e emissions between 2021 and 2024 suggests an improvement in mitigation strategies as result of new technologies introduced to upgrade STB S.A.’s fleet (
Figure 4).
The estimated carbon footprint reduction for the entire fleet buses is about 11 kilotons CO2e, confirmed by previous evidence. This means that switching to electric cuts down on the total greenhouse gas emissions, especially since these vehicles do not have any direct CO2. We have considered that switching from a diesel-only scenario to an electric vehicle in 2024 reduce total emissions by more than 13% in comparison with 2023, with the simultaneously decreasing of diesel bus mileage. This reduction is climate-relevant, providing evidence of the real potential of electromobility in achieving decarbonization ambitions.
For Bucharest (Romania), indirect emissions can be estimated as follows: average emission factor for electricity in Romania (2024)—232 g CO
2e/kWh; CO
2e emission factor for electricity in 2024: 232 g CO
2e/kWh = 0.232 kg CO
2e/kWh [
30].
A comparison of Romania’s CO
2e/kWh with other European countries for CO
2e/kWh is available in
Table 9.
The charging stations for electric buses do not directly emit GHG, but there are indirect emissions caused by the source of electricity supplied. There are currently 13 charging stations in Bucharest, for which there are no data, as electric buses only entered service in 2024. Emissions from the permanent power supply units required to charge the electric fleet will be included in a separate study upon completion of the infrastructure works.
4. Discussion
The number of buses in use has varied over the years, including areas served by trams, where rehabilitation works have been performed. The annual fuel consumption is impacted by annual volume and traffic conditions. Traffic congestion leads to lower average travel speeds, which implies increased fuel consumption. During the COVID-19 pandemic, traffic has been significantly reduced due to the slowdown in economic and social activities, and the expansion of remote working.
The JASPERS analysis focuses exclusively on tailpipe emissions (“tank-to-wheel”) and does not include upstream emissions (“well-to-tank”), such as those generated by the production and transport of fuel or electricity. In the standard JASPERS methodology (used in CBA assessments—Cost–Benefit Analysis for public transport projects), greenhouse gas emissions (such as CO2) are calculated only for the operational phase, meaning the following:
- -
diesel fuel combustion in diesel or hybrid buses,
- -
electricity consumption in electric buses, but excluding the energy source used to generate electricity.
According to the JASPER method, only indirect CO
2 emissions are considered for electric vehicles, without including CH
4 or N
2O separately [
27].
The comparison between vehicle types only reflects differences in local pollution, not the full life cycle impact.
In conclusion, this approach may underestimate the actual emissions of the system, especially in countries with an electricity mix dominated by fossil fuels. For a complete assessment, it is recommended to supplement the JASPERS analysis with a well-to-wheel or even a LCA, especially in the context of system-wide decarbonization.
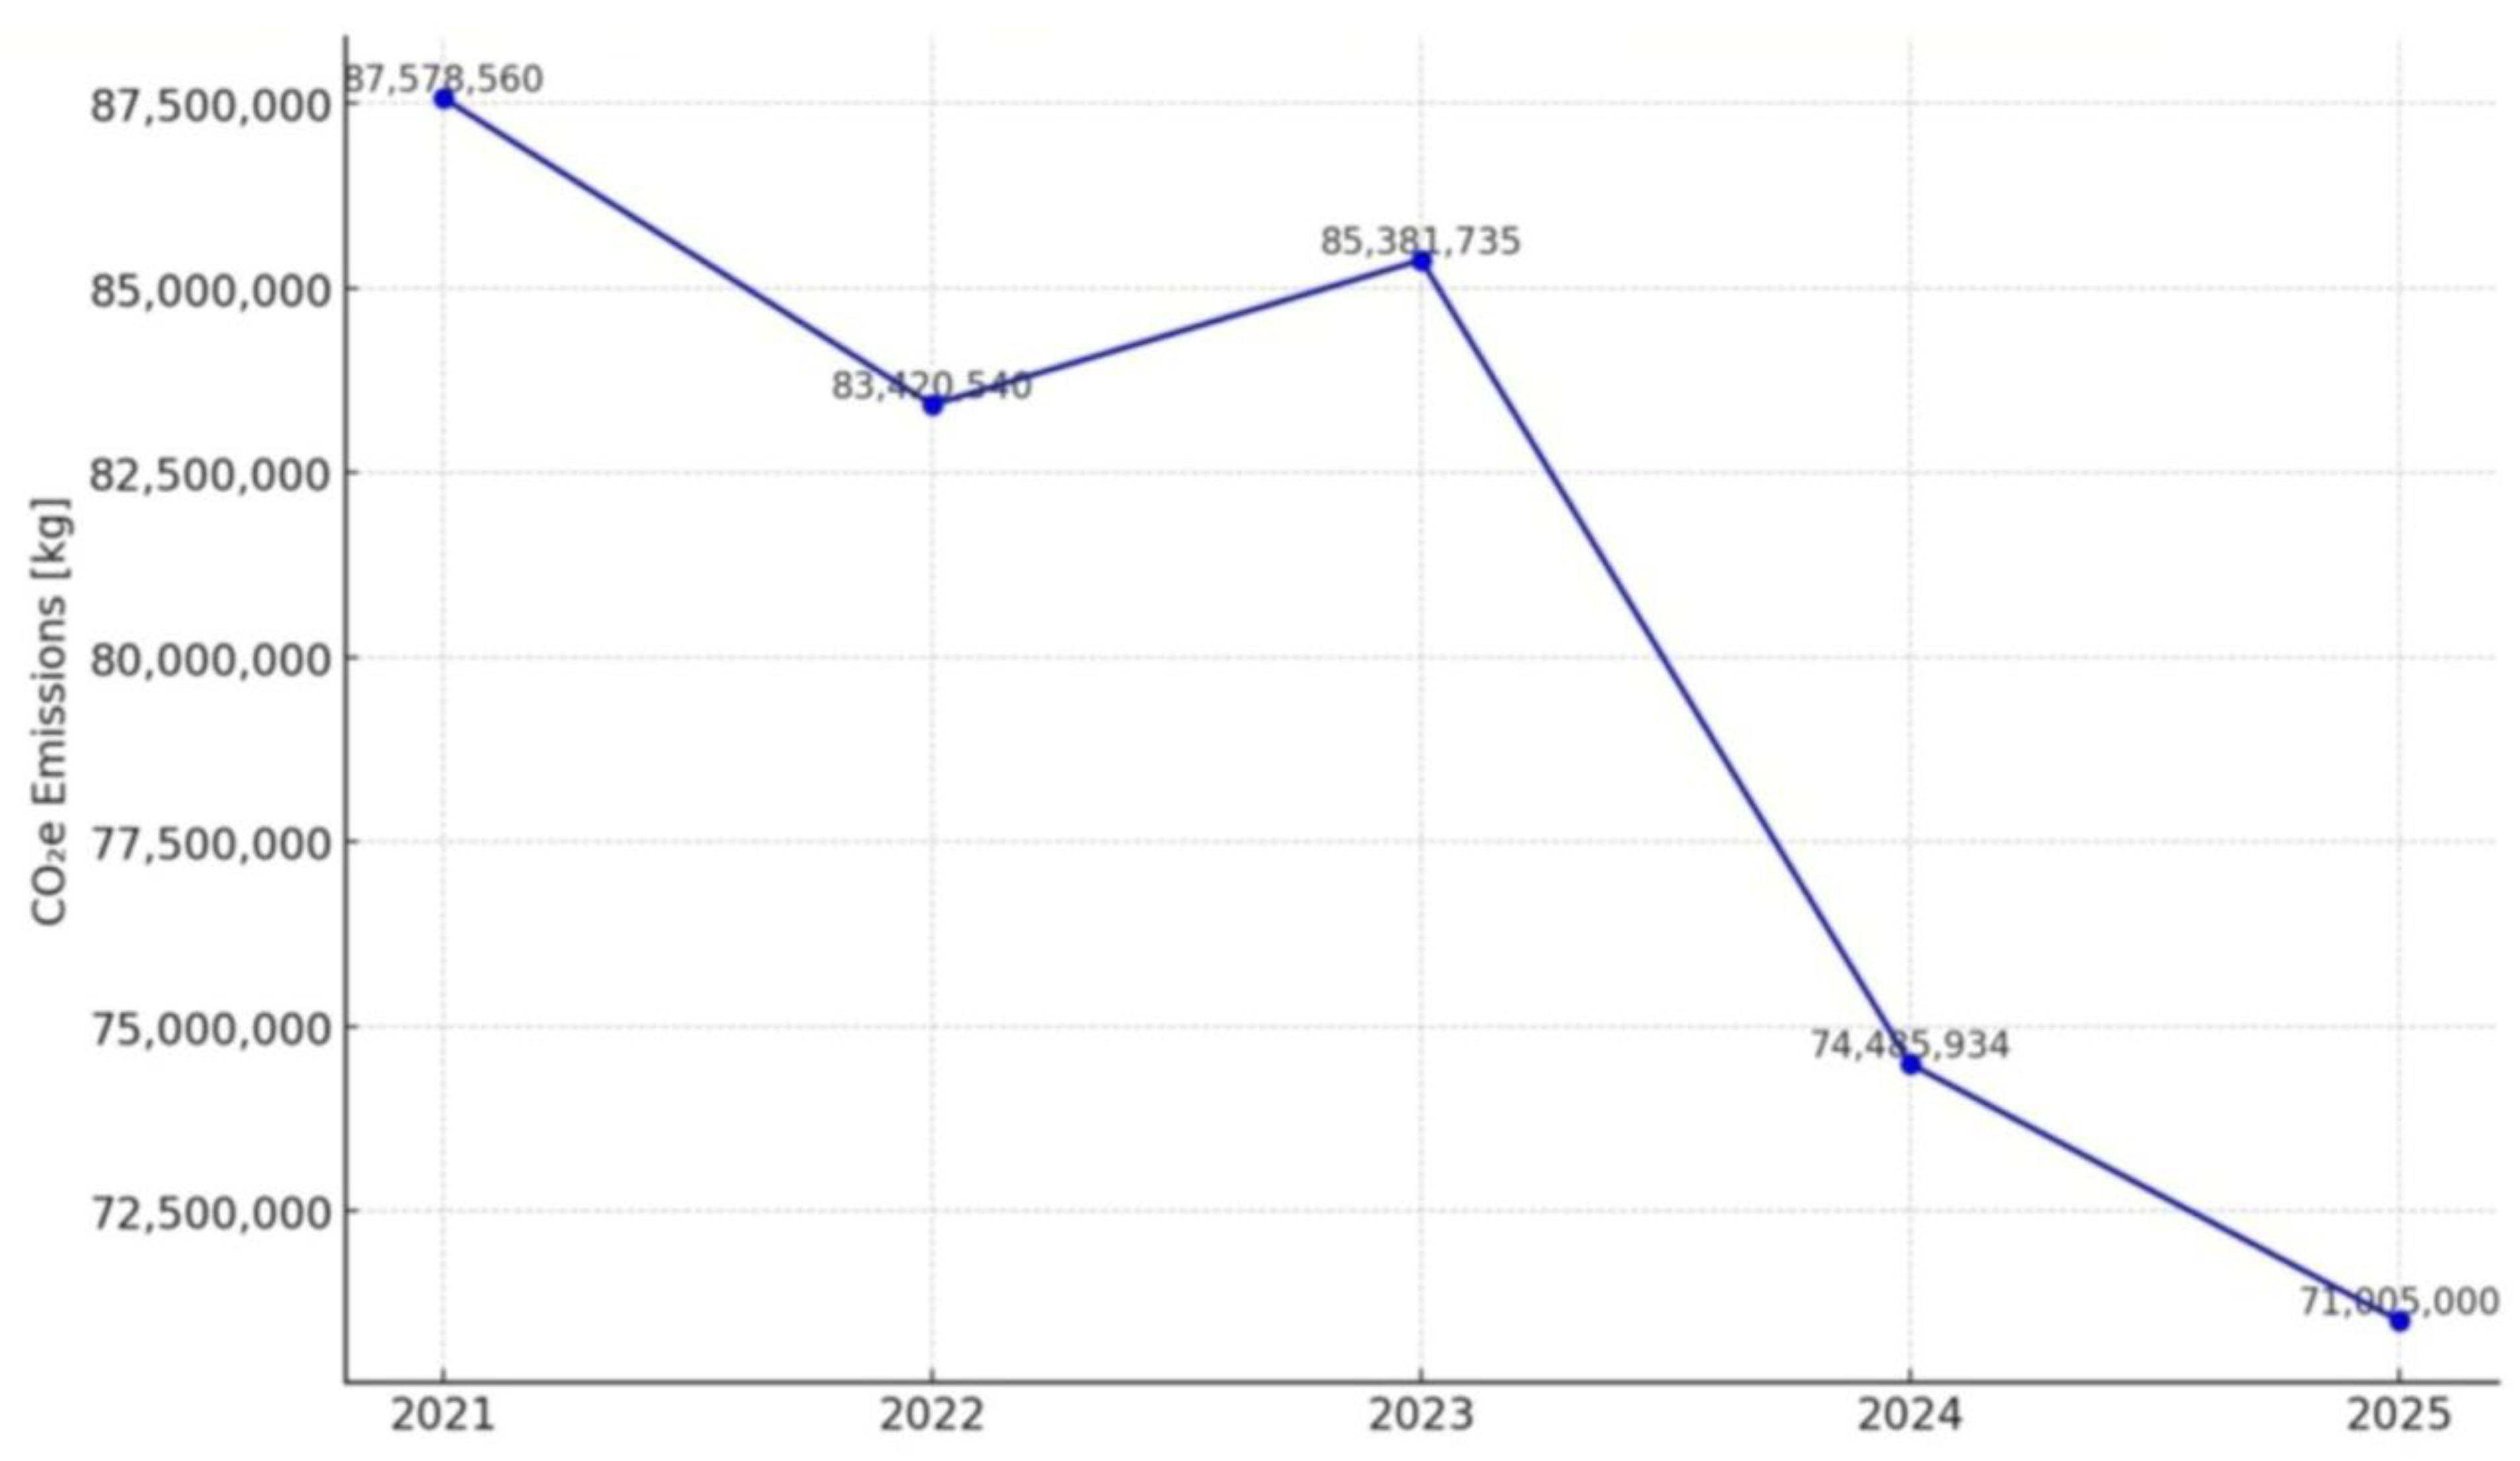
For 2025, based on the scenario where 50 Mercedes Euro III and IV buses are replaced with electric buses, the total estimated CO
2e emissions of the entire fleet are approximately 71 kilotons CO
2e, which represents a reduction of over 3 kilotons of CO
2e compared to 2024 (
Figure 5). For this study, a constant reference value for the diesel-only scenario, estimated at 74.5 kilotons CO
2e, similar for 2024 was used.
Until 2030, over 30% of the bus fleet would be electric. Estimated CO
2 and CO
2e for the period 2025–2023 are listed in
Figure 6.
During the projection period, the total mileage has remained relatively constant, with a slight upward trend, reflecting consistent operational demand for public transport services. In contrast, both CO
2 and CO
2e emissions have gradually and steadily declined. This evidence highlights the impact of vehicle fleet upgrading policies, such as replacing old diesel vehicles with hybrid and electric models. The reduction of CO
2e emissions is more pronounced than that of direct CO
2, reflecting the combined benefit of reductions not only in CO
2, but also in other gases with high global warming potential, such as N
2O and CH
4, outlining the effectiveness of the transition to low and zero-emission technologies in achieving the urban decarbonization goals as part of the climate neutrality strategies for 2050. A major plus of switching from fossil fuels to renewable energy sources is that it can cut down on air pollution and greenhouse gas emissions [
31].
This trend is consistent with the efforts of most municipalities in Romania, which are developing Sustainable Energy Action Plans (SEAPs) [
32] or Climate and Sustainable Energy Action Plans (CSEAPs) [
33] to implement inventories and reduce GHG emissions locally.
The main limitation of this study was the unsupported availability of an institutional database with indicators of air pollution caused by vehicle traffic and an accurate calculation method. Therefore, it is necessary to develop an approved system for analyzing and quantifying emissions from traffic vehicles in a quantitative and qualitative perspective. This will allow the identification and understanding of the health effects of the major air pollutants in urban areas.
Euro VI and hybrid buses generate direct CO2 emissions estimated at 2295.68 EUR and 1999.38 EUR per lifetime of light commercial vehicle (LCV), respectively. These values for CO2 EURO VI buses reflect the economic impact of greenhouse gas emissions on climate change, calculated based on standardized monetary coefficients that estimate the damage caused per tones of CO2 emitted. In contrast, electric buses do emit no CO2 during use (tank-to-wheel), so the cost is 0, highlighting the climate advantage of transport electrification. All three types of buses analyzed show equal or zero values for NOx, PM, and NMHC emissions, with the electric bus having zero emissions for all these pollutants. This highlights the technological suitability of modern fleets (Euro VI and hybrid) for strict air pollution standards, but only the electric bus completely eliminates local emissions, which is essential for air quality in congested urban areas. The data shows that switching to electric fleets could cut down the costs of greenhouse gas emissions and air pollution. Also, the cost difference between Euro VI and hybrid buses shows that technology is becoming better at reducing carbon footprints, but it is not yet completely fixed. To maximize the socio-economic and environmental benefits, public policies and measures to decarbonize electricity production from the transport sector in line with the EU’s 2030 and 2050 climate and energy policy framework should be prioritized.
Reducing local air pollution by eliminating emissions of PM, NOx, and VOCs has a direct impact on decreasing the incidence of respiratory and cardiovascular diseases and chronic health conditions. According to estimates by the European Environment Agency, air pollution is responsible for thousands of premature deaths in Europe every year. Switching to electric transport can significantly reduce this burden. Vulnerable populations (children, the elderly, and people with pre-existing conditions) benefit directly from improved air quality in densely trafficked urban areas.
Positive economic effects: decreased healthcare costs by reducing the number of hospitalization and treatment costs associated with pollution-related diseases, public healthcare systems can save valuable resources, operational efficiency (electric vehicles have lower long-term operating and maintenance costs compared to diesel or hybrid vehicles. Fuel and maintenance costs can be reduced by up to 30–50% in some cases): job creation because the transition to electric mobility stimulates local industries involved in the production, maintenance, and management of charging infrastructure, as well as in the field of renewable energy. Reduced energy dependence: the use of locally produced electricity reduces vulnerability to global fossil fuel market fluctuations.
The modernization of the bus fleet through the purchase of electric and hybrid vehicles must be analyzed in the context of the sustainable development of the public transport network and the urban mobility strategies of Bucharest and the Metropolitan Area. The fleet modernization is a big help in hitting the goals set out in the Sustainable Urban Mobility Plan [PMUD], which is all about using fewer personal cars, getting more people to use public transport, and making the air cleaner and achieving the 2030 target of procuring an additional 250 non-polluting buses. This also complies with Romania’s commitments under the European Green Deal and the European “Fit for 55” framework, which encourage the transition to low-emission transport [
34].
Electric buses are essential in those areas of the city where tram or metro infrastructure is not present or is unable to be expanded in the short term, and the new buses can be used to optimize feeder routes to metro, tram, or light rail networks, improving connectivity and reducing wait times. Operational flexibility in peri-urban and metropolitan networks: modern vehicles (especially hybrids and electric vehicles with extensive autonomy) allow operation on metropolitan routes without compromising environmental objectives, facilitating better integration. Thus, fleet modernization becomes a key tool in the efficient expansion of public transport services beyond the administrative boundaries of the city.
5. Influence of Other Pollutants on GHG Emission Results
The connection between air pollution and climate change is complex and linked, because the main human sources of air pollution—like industrial activities, transportation, and energy production from fossil fuels, both contribute to poor air quality and make global climate processes more intense [
17]. These processes lead to the release of reference air pollutants into the atmosphere, such as PM, SO
2, NO
x, and CO, which have a significant impact on air quality and public health [
35]. The growth of CO
2 levels in the atmosphere represents a major contributor to climate change, especially by increasing global warming. Higher temperatures and increased CO
2 concentrations can also promote the tropospheric ozone formation in urban and industrial areas, due to complex photochemical reactions between NO
x and volatile VOCs in the solar radiation [
36].
Transport constitutes a sector with a significant impact on air quality, in particular through the operation of vehicles equipped with internal combustion engines. These propulsion systems are responsible for significant emissions of controlled air pollutants, such as PM, NO
x, CO, and VOCs, contributing to urban environmental degradation and to global health risks [
37]. O
3 has no direct emission sources but is generated as a secondary pollutant following complex photochemical reactions catalyzed by solar radiation. The formation process involves the reaction of atmospheric precursors, in particular NO
x, CO, and VOCs, which, under conditions of intense solar radiation, accounts ozone to accumulate in the lower stratum of the atmosphere. This phenomenon has important consequences for urban air quality and human health and is associated with respiratory and cardiovascular side effects [
38].
In
Table 10, the additional lifetime pollutant emissions of a PHEV are presented in comparison with a BEV’s.
GHG emissions of Romania in comparison with other states from Europa and worldwide are presented in
Figure 7 [
40].
NOx emissions recorded a moderate decrease in Romania between 2019 and 2023, especially in urban areas. This trend is supported by the gradual retirement of Euro III–IV vehicles and the introduction of Euro VI hybrid, and electric buses, as well as stricter technical inspections and emission controls and lower traffic during the pandemic in 2020, with changes in mobility behavior.
PM is primarily generated during the combustion of fuel in internal combustion engines, as a result of incomplete oxidation processes and the presence of impurities in the fuel or lubricating oil [
41,
42]. Particulate matter poses a substantial risk given its well-documented adverse impacts on environmental systems and public health. Specifically, PM
10 is identified as a key pollutant linked to considerable external costs associated with air pollution [
43].
Exposure to PM
10, whether acute or chronic, has been linked to elevated incidences of disease and premature death, thereby contributing significantly to the escalation of health-related expenditures. Chronic exposure to particulate matter has been shown to aggravate cardiovascular morbidity and poses heightened health risks for susceptible groups, such as pediatric and geriatric populations, as well as individuals with underlying health disorders [
44]. Exposure to PM is connected to a higher risk of dying from respiratory pathologies, like chronic obstructive pulmonary disease (COPD) and acute lower respiratory tract infections, in addition to cardiovascular diseases because of the activation of systemic inflammatory and oxidative pathways triggered by airborne particles [
45,
46].
BC is a constituent of fine PM
2.5 consisting of aggregates of pure carbon generated by the incomplete combustion of fossil fuels, biomass, and other biofuels. Due in part to its high solar radiation absorption capacity, BC significantly influences the atmospheric radiation balance and air quality. In addition, BC has a specific global warming potential (GWP) approximately 3,200,000 times greater than that of CO
2 over a 20-year period, highlighting its major role in exacerbating climate change in the short term [
47].
Due to the importance of these pollutants, future studies will be focused on the health impact and contribution to the total carbon footprint.
6. Conclusions
The deployment of 124 hybrid and 58 electric buses within Bucharest’s public transport fleet operator has contributed to a measurable decarbonization impact, contributing to a 13% reduction in equivalent carbon dioxide emissions compared to 2023. Additionally, the specific carbon footprint associated with electric bus operation decreased by approximately 2.68%. This translated into an overall mitigation of around 11 kilotons of equivalent carbon dioxide, driven in part by the reduced usage of diesel-only buses. Forecasts for 2025 project an additional reduction of 3 kilotons of equivalent carbon dioxide, while strategic plans suggest that by 2030, electric buses could represent up to 30% of the fleet—marking a substantial shift toward sustainable urban mobility.
To achieve all these objectives, priority must be granted to completing construction of the three depots that will serve the electric bus charging stations, then attracting new European or government funds to cover 80–100% of the cost of vehicles. The introduction of congestion charges or low-emission zones restricting access for high-polluting vehicles in central areas is also essential. In parallel, the formulation of robust environmental policies must be guided by circular economic principles, support the metabolic transition of urban systems, and ensure compliance with the evolving European Union regulatory framework. Support for the purchase of mobile or hybrid stations (with photovoltaic panels), gradual, upgrading depots with energy management systems and security, supervision, and maintenance for electric buses, gradual withdrawal of Euro III–V vehicles with obligations or incentives for disposal/withdrawal, and reducing operating costs with subsidies for electric traction power and preferential energy rates for public operators. At the same time, it is essential to establish systematic monitoring and transparent reporting of carbon dioxide savings and associated costs, including the development of a public dashboard to communicate the positive impact of electric buses. Such tools should support data-driven reporting to authorities, providing evidence on energy consumption, operational costs, and emission reductions, thereby facilitating justified budget allocations and ensuring continued access to funding. Finally, the implementation of congestion charges or restricted access zones for high-emission vehicles in central urban areas is being considered, and dedicated bus lanes, alongside the development of ambitious environmental policies grounded in circular economy principles, the metabolic transition framework, and aligned with current European Union’s regulations.
The fleet modernization program, which involves the procurement of 224 vehicles (124 hybrid and 100 electric), pointed to approximately about 14% of buses in operation becoming electrified by 2024.
Also, there are policies options that made possible mechanisms to accelerate/enhance the transition to an electric fleet, such as the following:
- -
Attracting European or government funds to cover 80–100% of the cost of vehicles;
- -
Support for the purchase of mobile or hybrid stations (with photovoltaic panels);
- -
Gradual withdrawal of Euro III–V vehicles with obligations or incentives for disposal/withdrawal;
- -
Upgrading depots with energy management systems and security, supervision, and maintenance for EVs;
- -
Reducing operating costs with subsidies for electric traction power and preferential energy rates for public operators;
- -
Monitoring and publishing CO2 savings and costs, i.e., a public dashboard to show the positive impact of electric buses and reporting to authorities for justified budget allocations with data on consumption, costs, and emissions—helpful for ongoing funding.
Making public transport more attractive and efficient, especially by modernizing the vehicle fleet, will give Bucharest not only economic and social benefits, but also real improvements in life quality.


 ,
, 


