
Integrated Water Resources Management in Response to Rainfall Change: A Runoff-Based Approach for Mixed Land-Use Catchments


Abstract
1. Introduction
2. Methodology
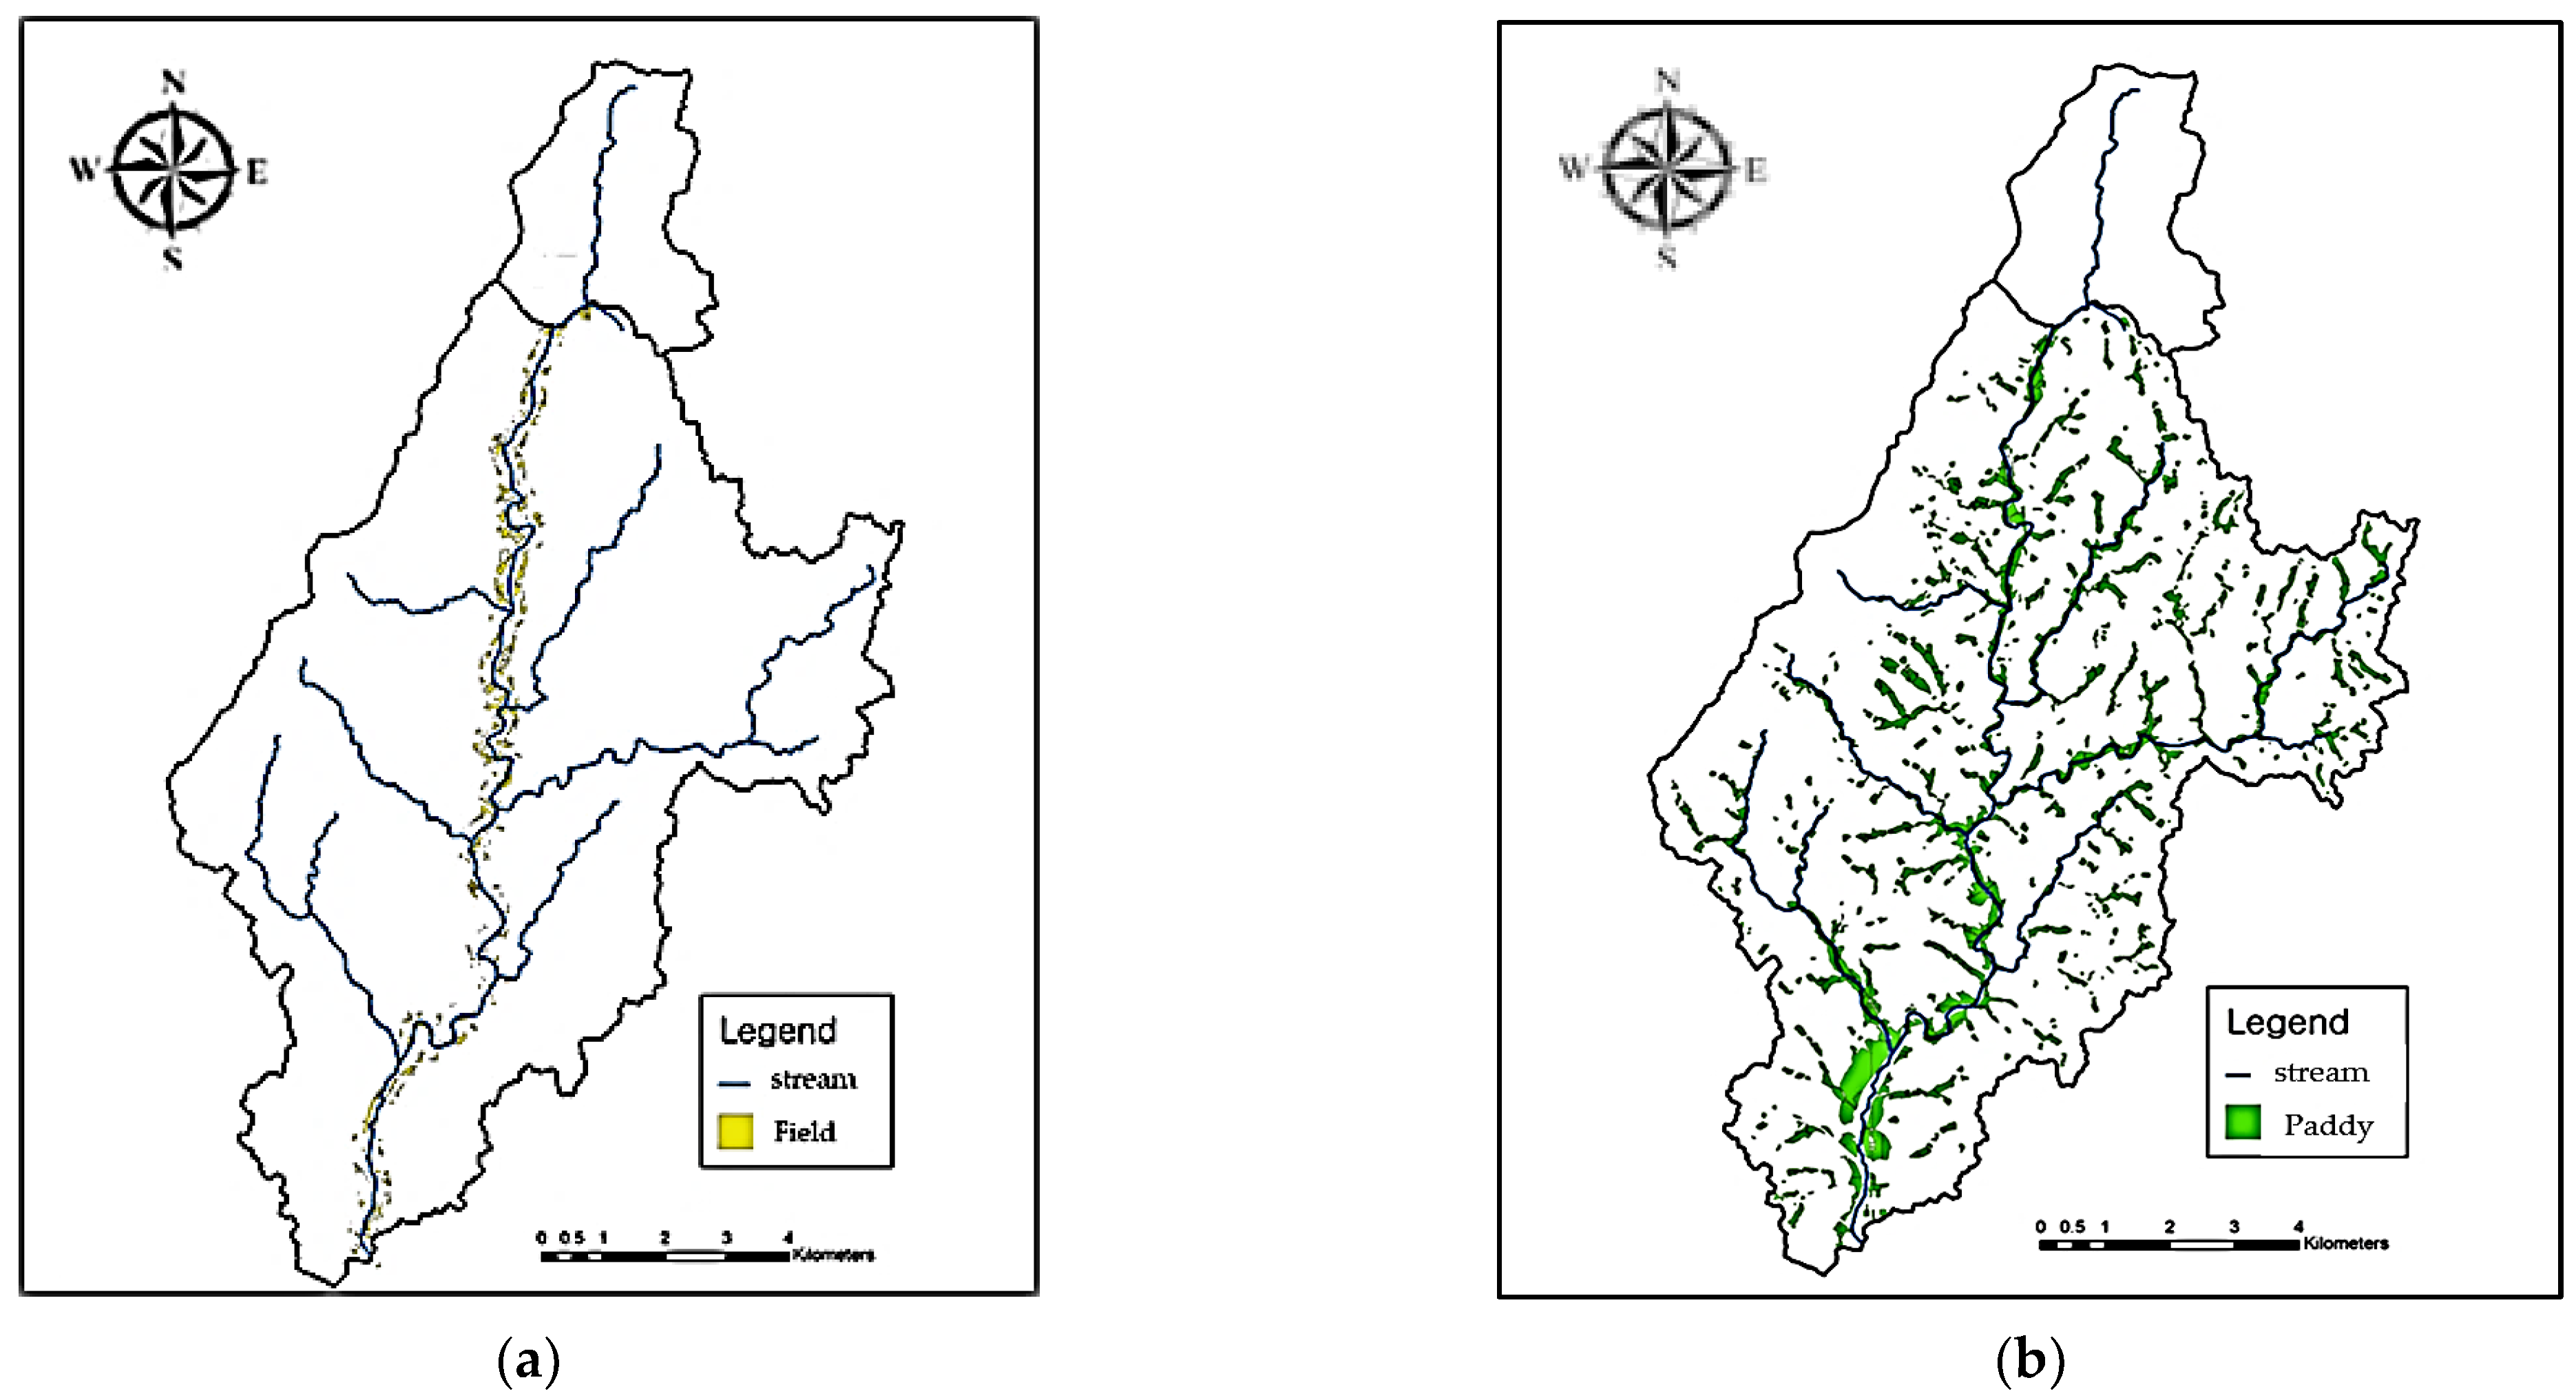
2.1. Study Area
2.2. Model Setup
2.3. Calibration and Validation
2.4. Calculation of Appropriate Cumulative Runoff Depth and Development of Suitable Scenarios in Rural Areas
2.5. Appropriate Evaluation Method
3. Results and Discussion
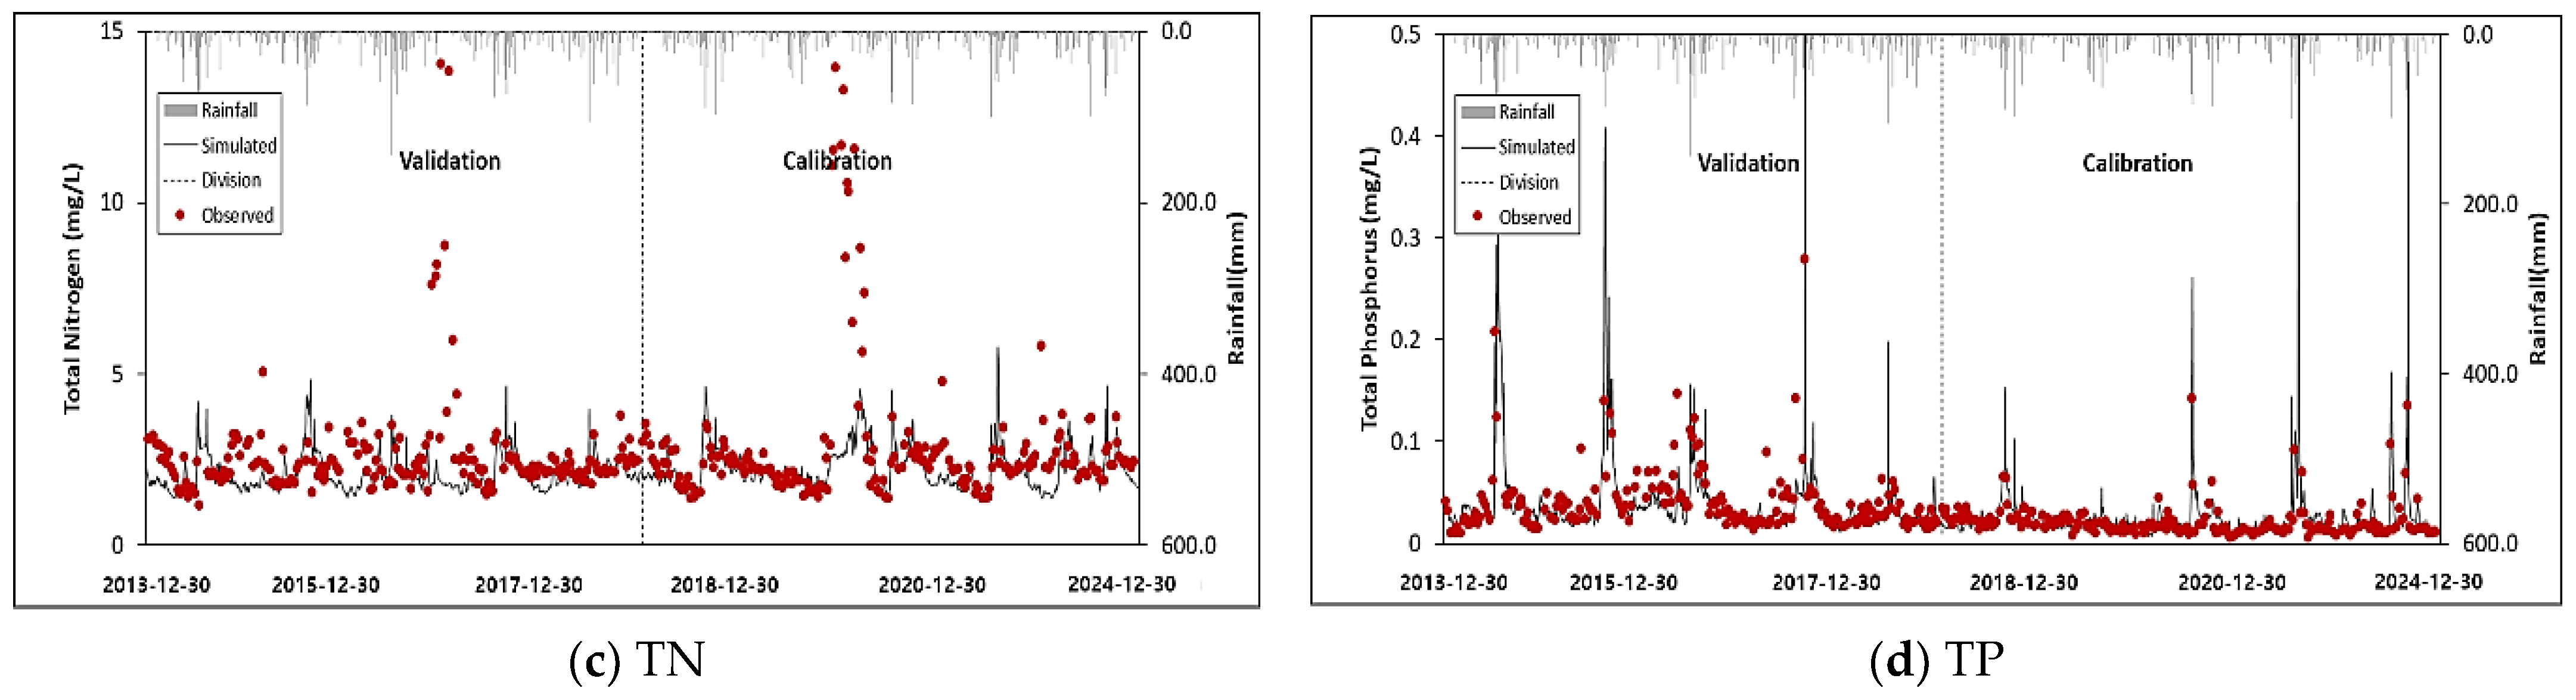
3.1. Model Validation and Calibration
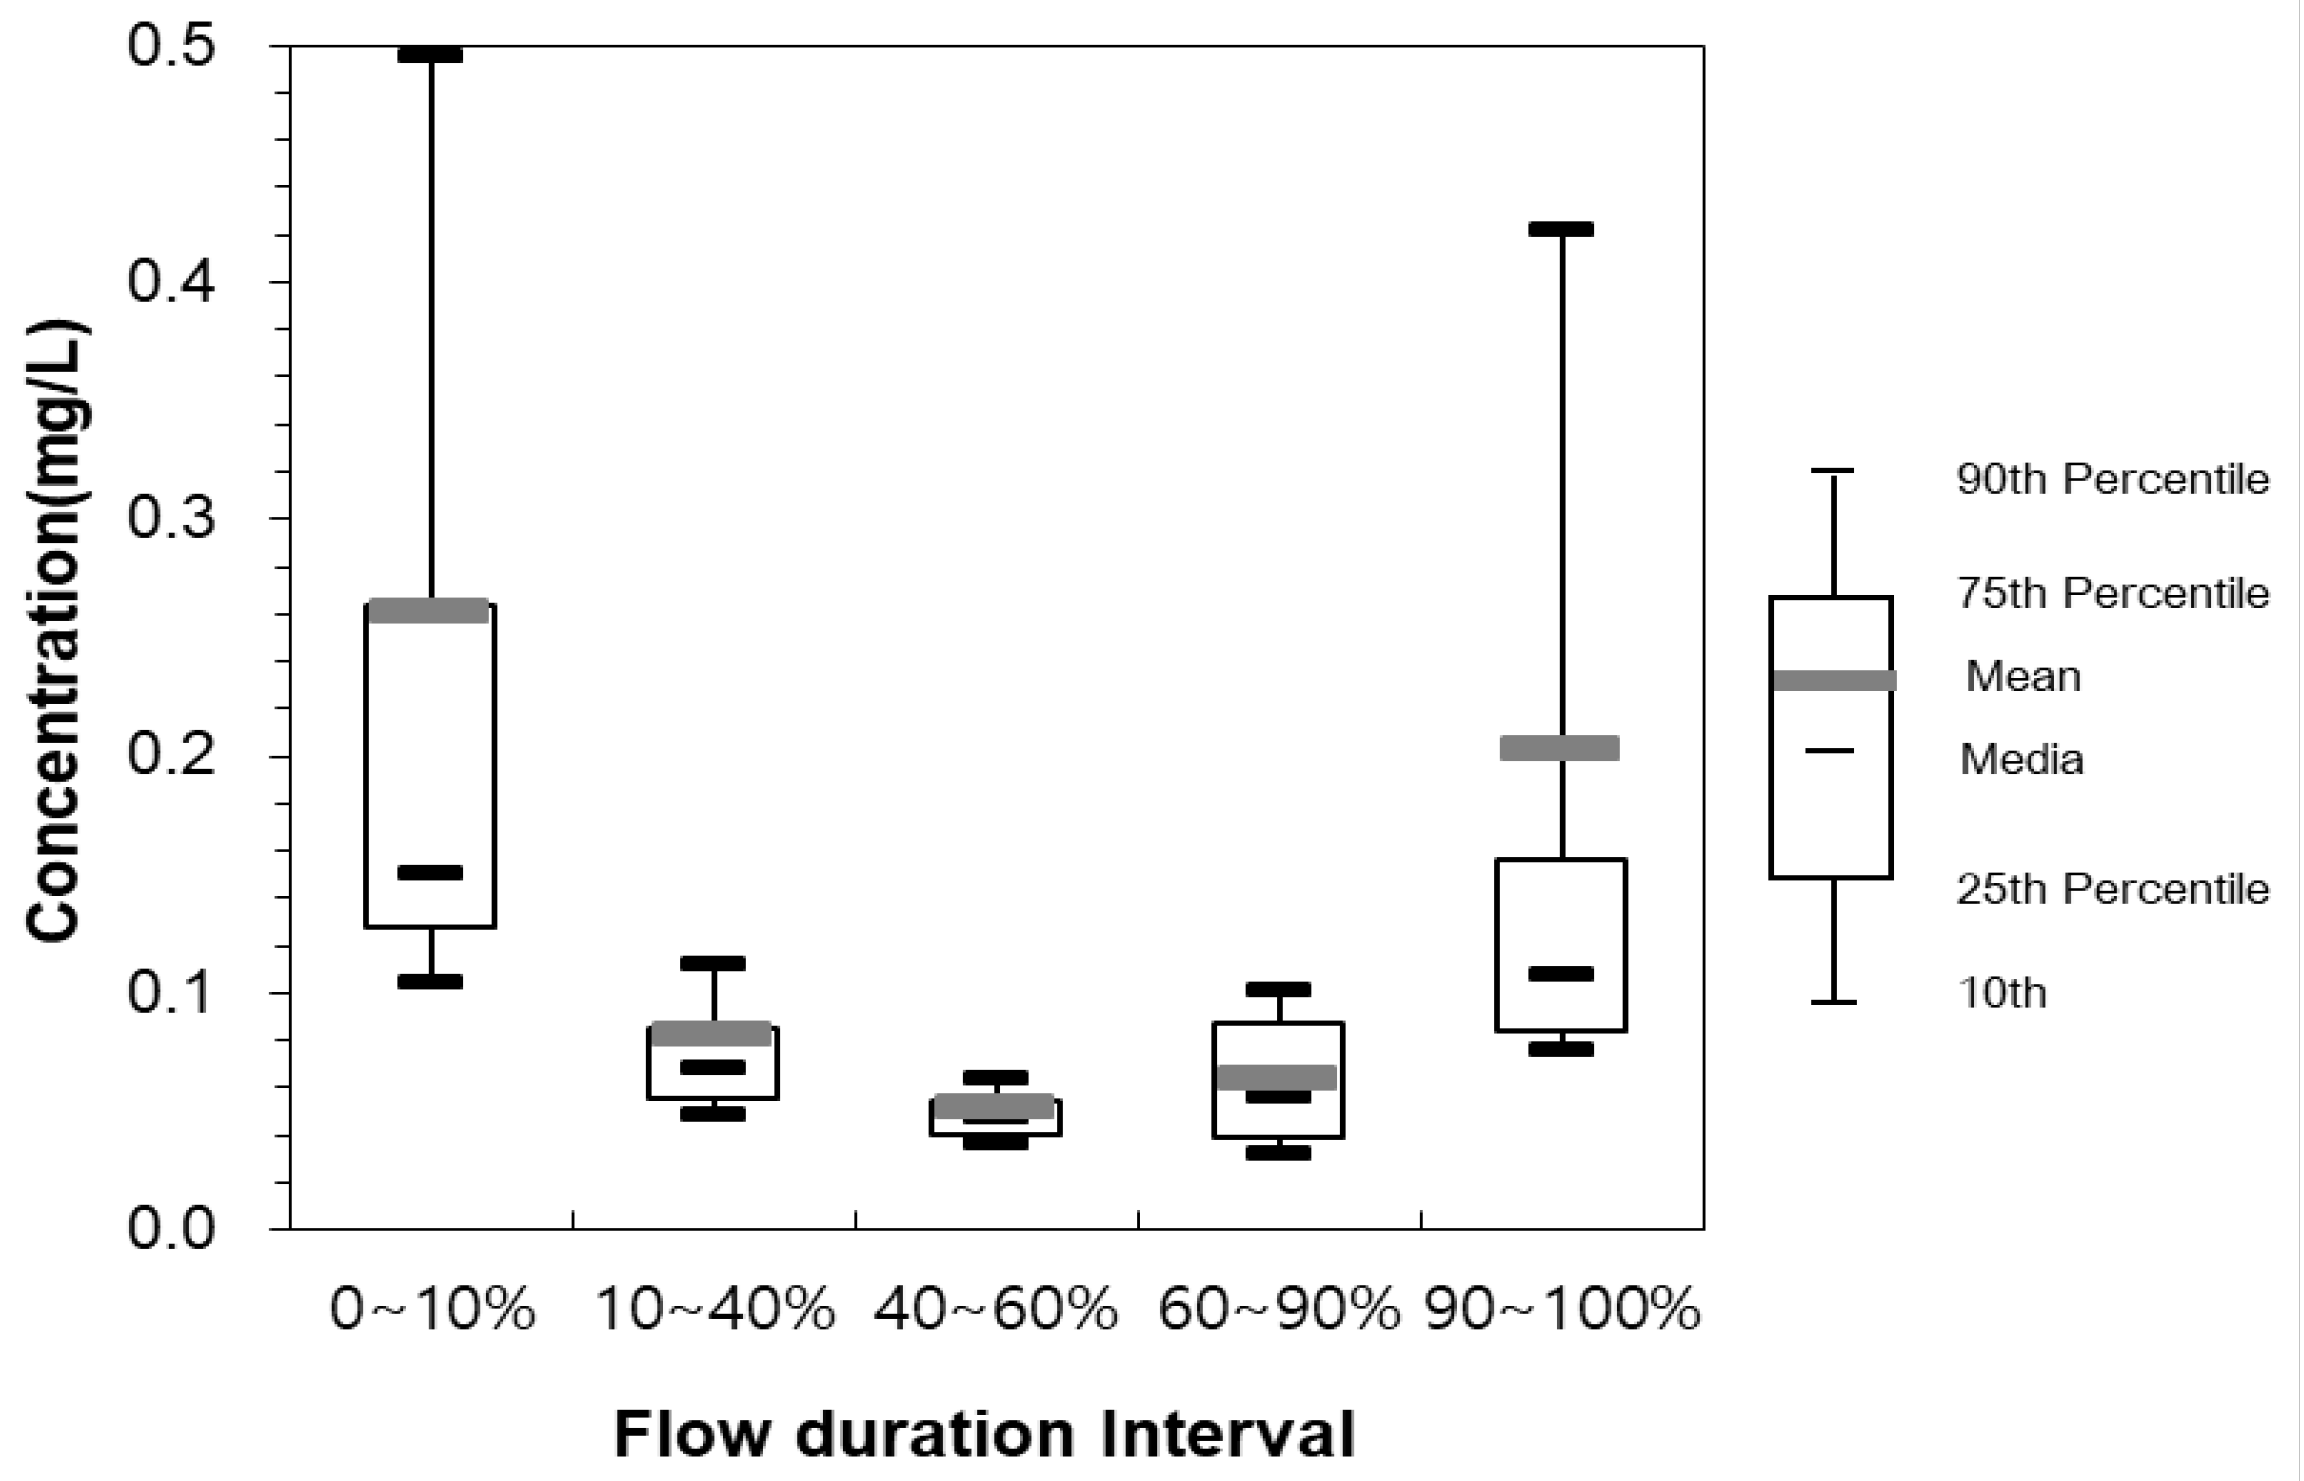
3.2. Determination of Appropriate Cumulative Runoff and Development of Suitable Scenarios in Rural Areas
3.3. Appropriate Evaluation
4. Conclusions
Author Contributions
Funding
Data Availability Statement
Conflicts of Interest
References
- U.S. EPA. National Menu of BMPs for Stormwater; U.S. EPA: Washington, DC, USA, 2023. Available online: https://www.epa.gov/npdes/national-menu-best-management-practices-bmps-stormwater (accessed on 24 April 2025).
- Shin, J.Y.; Lee, J.S.; Jeon, J.H.; Shin, M.H.; Choi, J.D. Problems and Improvement of Reduction Facility at the NPS Pollution Management Area. In Proceedings of the Korean Society of Agricultural Engineers Conference, Naju, Republic of Korea, 22–23 October 2015; p. 270. [Google Scholar]
- Jeon, M.; Kim, B.; Lee, E.; Song, J.; Kim, J. Long-Term Monitoring of an Urban Stormwater Infiltration Trench in South Korea with Assessment Using the Analytic Hierarchy Process. Water 2022, 14, 3529. [Google Scholar] [CrossRef]
- Lee, S.; Kim, J.H.; Kim, H.; Kim, J.Y. Recent Progress in Low-Impact Development in South Korea: Water-Management Policies, Challenges and Opportunities. Water 2018, 10, 435. [Google Scholar] [CrossRef]
- MOE, Republic of Korea. Guidelines for the Implementation of Nonpoint Pollution Reduction Projects with National Subsidies; MOE: Sejong, Republic of Korea, 2024; Available online: https://clik.nanet.go.kr/ (accessed on 24 April 2025).
- National Institute of Environmental Research (NIER). A Study on the Characteristics and Reduction Measures of NPS Pollution in Rural Areas; NIER: Incheon, Republic of Korea, 2022. [Google Scholar]
- MOE, Republic of Korea. Enforcement Rule of the Water Environment Conservation Act; MOE: Sejong, Republic of Korea, 2025; Available online: https://www.law.go.kr/LSW/eng/engLsSc.do?menuId=1&query=Water%20Environment%20Conservation%20Act (accessed on 24 April 2025).
- MOE, Republic of Korea. Guidelines for Promotion of Nonpoint Pollution Reduction State Subsidies; MOE: Sejong, Republic of Korea, 2024; Available online: http://me.go.kr (accessed on 24 April 2025).
- Ministry for Food, Agriculture, Forestry and Fisheries. Guidelines for Nonpoint Source Pollution Management in Rural Areas; Ministry for Food, Agriculture, Forestry and Fisheries: Seoul, Republic of Korea, 2007; Available online: https://www.opm.go.kr (accessed on 4 June 2025).
- Jeon, J.J.; Kim, Y.; Park, S.Y.; Choi, M.J. Trends in Nonpoint Source Pollution Research and Future Directions in Korea. J. Korea Soc. Environ. Technol. 2018, 19, 1–13. [Google Scholar]
- Zhang, Y.; Yu, M.; Li, Y.; Wang, Q.; Liu, Z. New conceptualization and quantification method of first-flush in urban runoff. Sci. Total Environ. 2023, 891, 162020. [Google Scholar] [CrossRef]
- Froehlich, D.C. A Modified Rational Method Approach for Calculating First Flush Design Flow Rates to Mitigate Nonpoint Source Pollution from Stormwater Runoff. Hydrology 2024, 11, 21. [Google Scholar] [CrossRef]
- Chen, L.; Wu, L.; Li, H.; Zhang, Q. Evaluation of BMPs in Reducing Agricultural Runoff Pollution Using HSPF in a Typical Watershed in China. J. Environ. Manag. 2021, 284, 112021. [Google Scholar]
- U.S. EPA. National Stormwater Calculator: Updated with Regionally Tailored BMP Design Parameters; EPA Office of Research and Development: Washington, DC, USA, 2023. Available online: https://www.epa.gov/water-research/national-stormwater-calculator (accessed on 1 June 2025).
- MOE, Republic of Korea. Water Environment Conservation Act, Article 54. Available online: https://www.law.go.kr (accessed on 12 May 2025).
- Korea Meteorological Administration. Automated Synoptic Observing System (ASOS) Data. Available online: https://data.kma.go.kr/data/grnd/selectAsosRltmList.do (accessed on 12 May 2025).
- MOE, Republic of Korea. WAMIS. Available online: https://www.wamis.go.kr (accessed on 12 May 2025).
- MOE, Republic of Korea. Water Environment Information System (WEIS). Available online: https://water.nier.go.kr (accessed on 12 May 2025).
- Lee, S.; Park, J.; Choi, H. Effects of Land Use and Soil Infiltration Characteristics on Runoff Response in Agricultural Watersheds. Environ. Eng. Res. 2017, 22, 324–331. [Google Scholar]
- Kim, S.; Park, Y.; Lee, J. Characterization of First Flush Effect and Estimation of Non-Point Source Pollutant Loads in Agricultural Watersheds. Water 2019, 11, 2003. [Google Scholar]
- Zhang, K.; Zhang, W.; Liu, D.; Han, D.; Liu, Y. A Comprehensive Evaluation of the First Flush Effect in Urban and Rural Runoff: Influencing Factors and Mitigation Strategies. Sci. Total Environ. 2020, 713, 136707. [Google Scholar]
- U.S. EPA. National Management Measures to Control NPS Pollution from Urban Areas; EPA 841-B-05-004; Office of Water: Washington, DC, USA, 2005. [Google Scholar]
- U.S. EPA. Exposure Factors Handbook: 2011 Edition; EPA/600/R-09/052F; National Center for Environmental Assessment, Office of Research and Development: Washington, DC, USA, 2011. [Google Scholar]
- Donigian, A.S., Jr. HSPF Training Workshop Handbook and CD, Lecture #19: Calibration and Verification Issues, Slide #L19-22; U.S. EPA, Office of Water, Office of Science and Technology: Washington, DC, USA, 2000. [Google Scholar]
- MOE. Stormwater BMPs Operation and Maintenance Manual; MOE: Sejong, Republic of Korea, 2024. [Google Scholar]
- NIER. A Study on the Demonstration of Agricultural NPS pollution Reduction for Total Maximum Daily Load (TMDL); NIER: Incheon, Republic of Korea, 2019. [Google Scholar]
- U.S. EPA. FDC.; U.S. EPA: Washington, DC, USA, 2007. [Google Scholar]
- MOE. Designation of Nonpoint Source Pollution Management Areas Pursuant to the Water Environment Conservation Act; MOE Notification No. 2023-45; Ministry of Environment: Sejong, Republic of Korea, 2023. (In Korean) [Google Scholar]
- MOE. Water Environment Monitoring Plan; MOE: Sejong, Republic of Korea, 2025. [Google Scholar]


| Type | Source | Scale | Information |
|---|---|---|---|
| Digital Elevation Models | National Geographic Information Institute | 1:5000 | DEM; 10 m × 10 m |
| Land-use map | MOE | 1:25,000 | Large classification land cover |
| Meteorological data | Korea Meteorological Administration | Daily, hourly | Precipitation, average temperature, relative humidity, solar radiation quantity, wind velocity, cloud amount, etc. |
| Flow rate | MOE/ WAMIS | 8-day/ month | Auto/manual monitoring network, Water Quality Monitoring Networks Data |
| Water quality | MOE/ Environmental Management Office | 8-day/ month | Water Quality Monitoring Networks Data (water temperature, DO, BOD, TN, TP, etc.) |
| Pollution source | MOE | - | National pollution source survey data |
| Quantity of water intake | local autonomous entity/ WAMIS | Monthly, Daily | Data collection of intake/pumping station in target reservoir |
| Watershed map | MOE | - | Unit watershed map, middle area map, large area map, and administrative district border map |
| Criteria | Poor | Fair | Good | Very Good |
|---|---|---|---|---|
| R2 | <0.6 | 0.6–0.7 | 0.7–0.8 | >0.8 |
| NSE | 0.5–0.6 | 0.6–0.7 | 0.7–0.8 | 0.8–0.9 |
| % difference | - | 25–35 | 15–25 | <15 |
| Accumulated Out Flows (mm) | Volume (m3) | Before Application | After Application | Efficiency (%) | |||||||||
|---|---|---|---|---|---|---|---|---|---|---|---|---|---|
| Con. (mg/L) | Load (kg/d) | Con. (mg/L) | Load (kg/d) | Con. (mg/L) | Load (kg/d) | ||||||||
| BOD | TP | BOD | TP | BOD | TP | BOD | TP | BOD | TP | BOD | TP | ||
| 1 | 105,760 | 0.8 | 0.069 | 64.2 | 5.908 | 0.4 | 0.025 | 34.9 | 2.5 | 50.6 | 63.8 | 45.7 | 58.1 |
| 2 | 211,521 | 0.3 | 0.016 | 27.4 | 1.4 | 58.3 | 77.1 | 57.4 | 77 | ||||
| 3 | 317,281 | 0.3 | 0.015 | 26.8 | 1.3 | 58.8 | 78.1 | 58.2 | 78.7 | ||||
| 4 | 423,040 | 0.3 | 0.015 | 26.7 | 1.2 | 59.0 | 78.5 | 58.5 | 79.2 | ||||
| 5 | 528,801 | 0.3 | 0.015 | 26.6 | 1.2 | 59.1 | 78.8 | 58.6 | 79.6 | ||||
| 6 | 634,561 | 0.3 | 0.015 | 26.5 | 1.2 | 59.2 | 78.9 | 58.8 | 79.8 | ||||
| 7 | 740,322 | 0.3 | 0.015 | 26.5 | 1.2 | 59.2 | 79.0 | 58.8 | 79.9 | ||||
| 8 | 846,081 | 0.3 | 0.015 | 26.4 | 1.2 | 59.3 | 79.1 | 58.9 | 80 | ||||
| 9 | 951,841 | 0.3 | 0.014 | 26.4 | 1.2 | 59.3 | 79.1 | 58.9 | 80.1 | ||||
| 10 | 1,057,602 | 0.3 | 0.014 | 26.4 | 1.2 | 59.3 | 79.2 | 58.9 | 80.1 | ||||
| Subbasins | Management Plan | ||
|---|---|---|---|
| Natural Pollution Control Facilities (m3) | Fertilizer Management (m3) | Community Participation (m3) | |
| Songya 1 | 4500 | 195.2 | 1112.4 |
| Songya 2 | 650 | ||
| Songya 3 | 60,245 | ||
| Songya 4 | 17,630 | ||
| Songya 5 | 37,367 | ||
| Songya 6 | 10,800 | ||
| Songya 7 | 16,057 | ||
| Songya 8 | 22,387 | ||
| Subbasins | Land-Use Ratio (%) | Land-Use Ranking | |||||||
|---|---|---|---|---|---|---|---|---|---|
| PA | DA | FA | IPA | ETC | Pervious Area (ha) | Impervious Area (ha) | Pervious Area (%) | Impervious Area (%) | |
| Songya 1 | 17.1 | 6.1 | 64.0 | 3.5 | 9.3 | 1620 | 65 | 0.87 | 0.035 |
| Songya 2 | 18.4 | 5.4 | 67.5 | 2.6 | 6.1 | 357 | 10 | 1.10 | 0.003 |
| Songya 3 | 20.2 | 12.8 | 56.3 | 2.4 | 8.3 | 719 | 19 | 0.89 | 0.001 |
| Songya 4 | 18.7 | 12.1 | 60.3 | 2.5 | 6.3 | 1727 | 48 | 2.15 | 0.001 |
| Songya 5 | 16.1 | 8.2 | 63.4 | 2.7 | 9.5 | 545 | 17 | 3.48 | 0.006 |
| Songya 6 | 17.2 | 9.2 | 60.1 | 4.5 | 8.9 | 668 | 35 | 0.87 | 0.001 |
| Songya 7 | 13.7 | 8.6 | 65.8 | 2.4 | 9.5 | 1129 | 31 | 1.46 | 0.001 |
Disclaimer/Publisher’s Note: The statements, opinions and data contained in all publications are solely those of the individual author(s) and contributor(s) and not of MDPI and/or the editor(s). MDPI and/or the editor(s) disclaim responsibility for any injury to people or property resulting from any ideas, methods, instructions or products referred to in the content. |
© 2025 by the authors. Licensee MDPI, Basel, Switzerland. This article is an open access article distributed under the terms and conditions of the Creative Commons Attribution (CC BY) license (https://creativecommons.org/licenses/by/4.0/).
Share and Cite
Kim, J.; Choi, O.Y. Integrated Water Resources Management in Response to Rainfall Change: A Runoff-Based Approach for Mixed Land-Use Catchments. Environments 2025, 12, 241. https://doi.org/10.3390/environments12070241
Kim J, Choi OY. Integrated Water Resources Management in Response to Rainfall Change: A Runoff-Based Approach for Mixed Land-Use Catchments. Environments. 2025; 12(7):241. https://doi.org/10.3390/environments12070241
Chicago/Turabian StyleKim, Jinsun, and Ok Yeon Choi. 2025. "Integrated Water Resources Management in Response to Rainfall Change: A Runoff-Based Approach for Mixed Land-Use Catchments" Environments 12, no. 7: 241. https://doi.org/10.3390/environments12070241
APA StyleKim, J., & Choi, O. Y. (2025). Integrated Water Resources Management in Response to Rainfall Change: A Runoff-Based Approach for Mixed Land-Use Catchments. Environments, 12(7), 241. https://doi.org/10.3390/environments12070241