
Integration of Earth Observation and Field-Based Monitoring for Morphodynamic Characterisation of Tropical Beach Ecosystems

 , , and
Abstract
1. Introduction
2. Materials and Methods
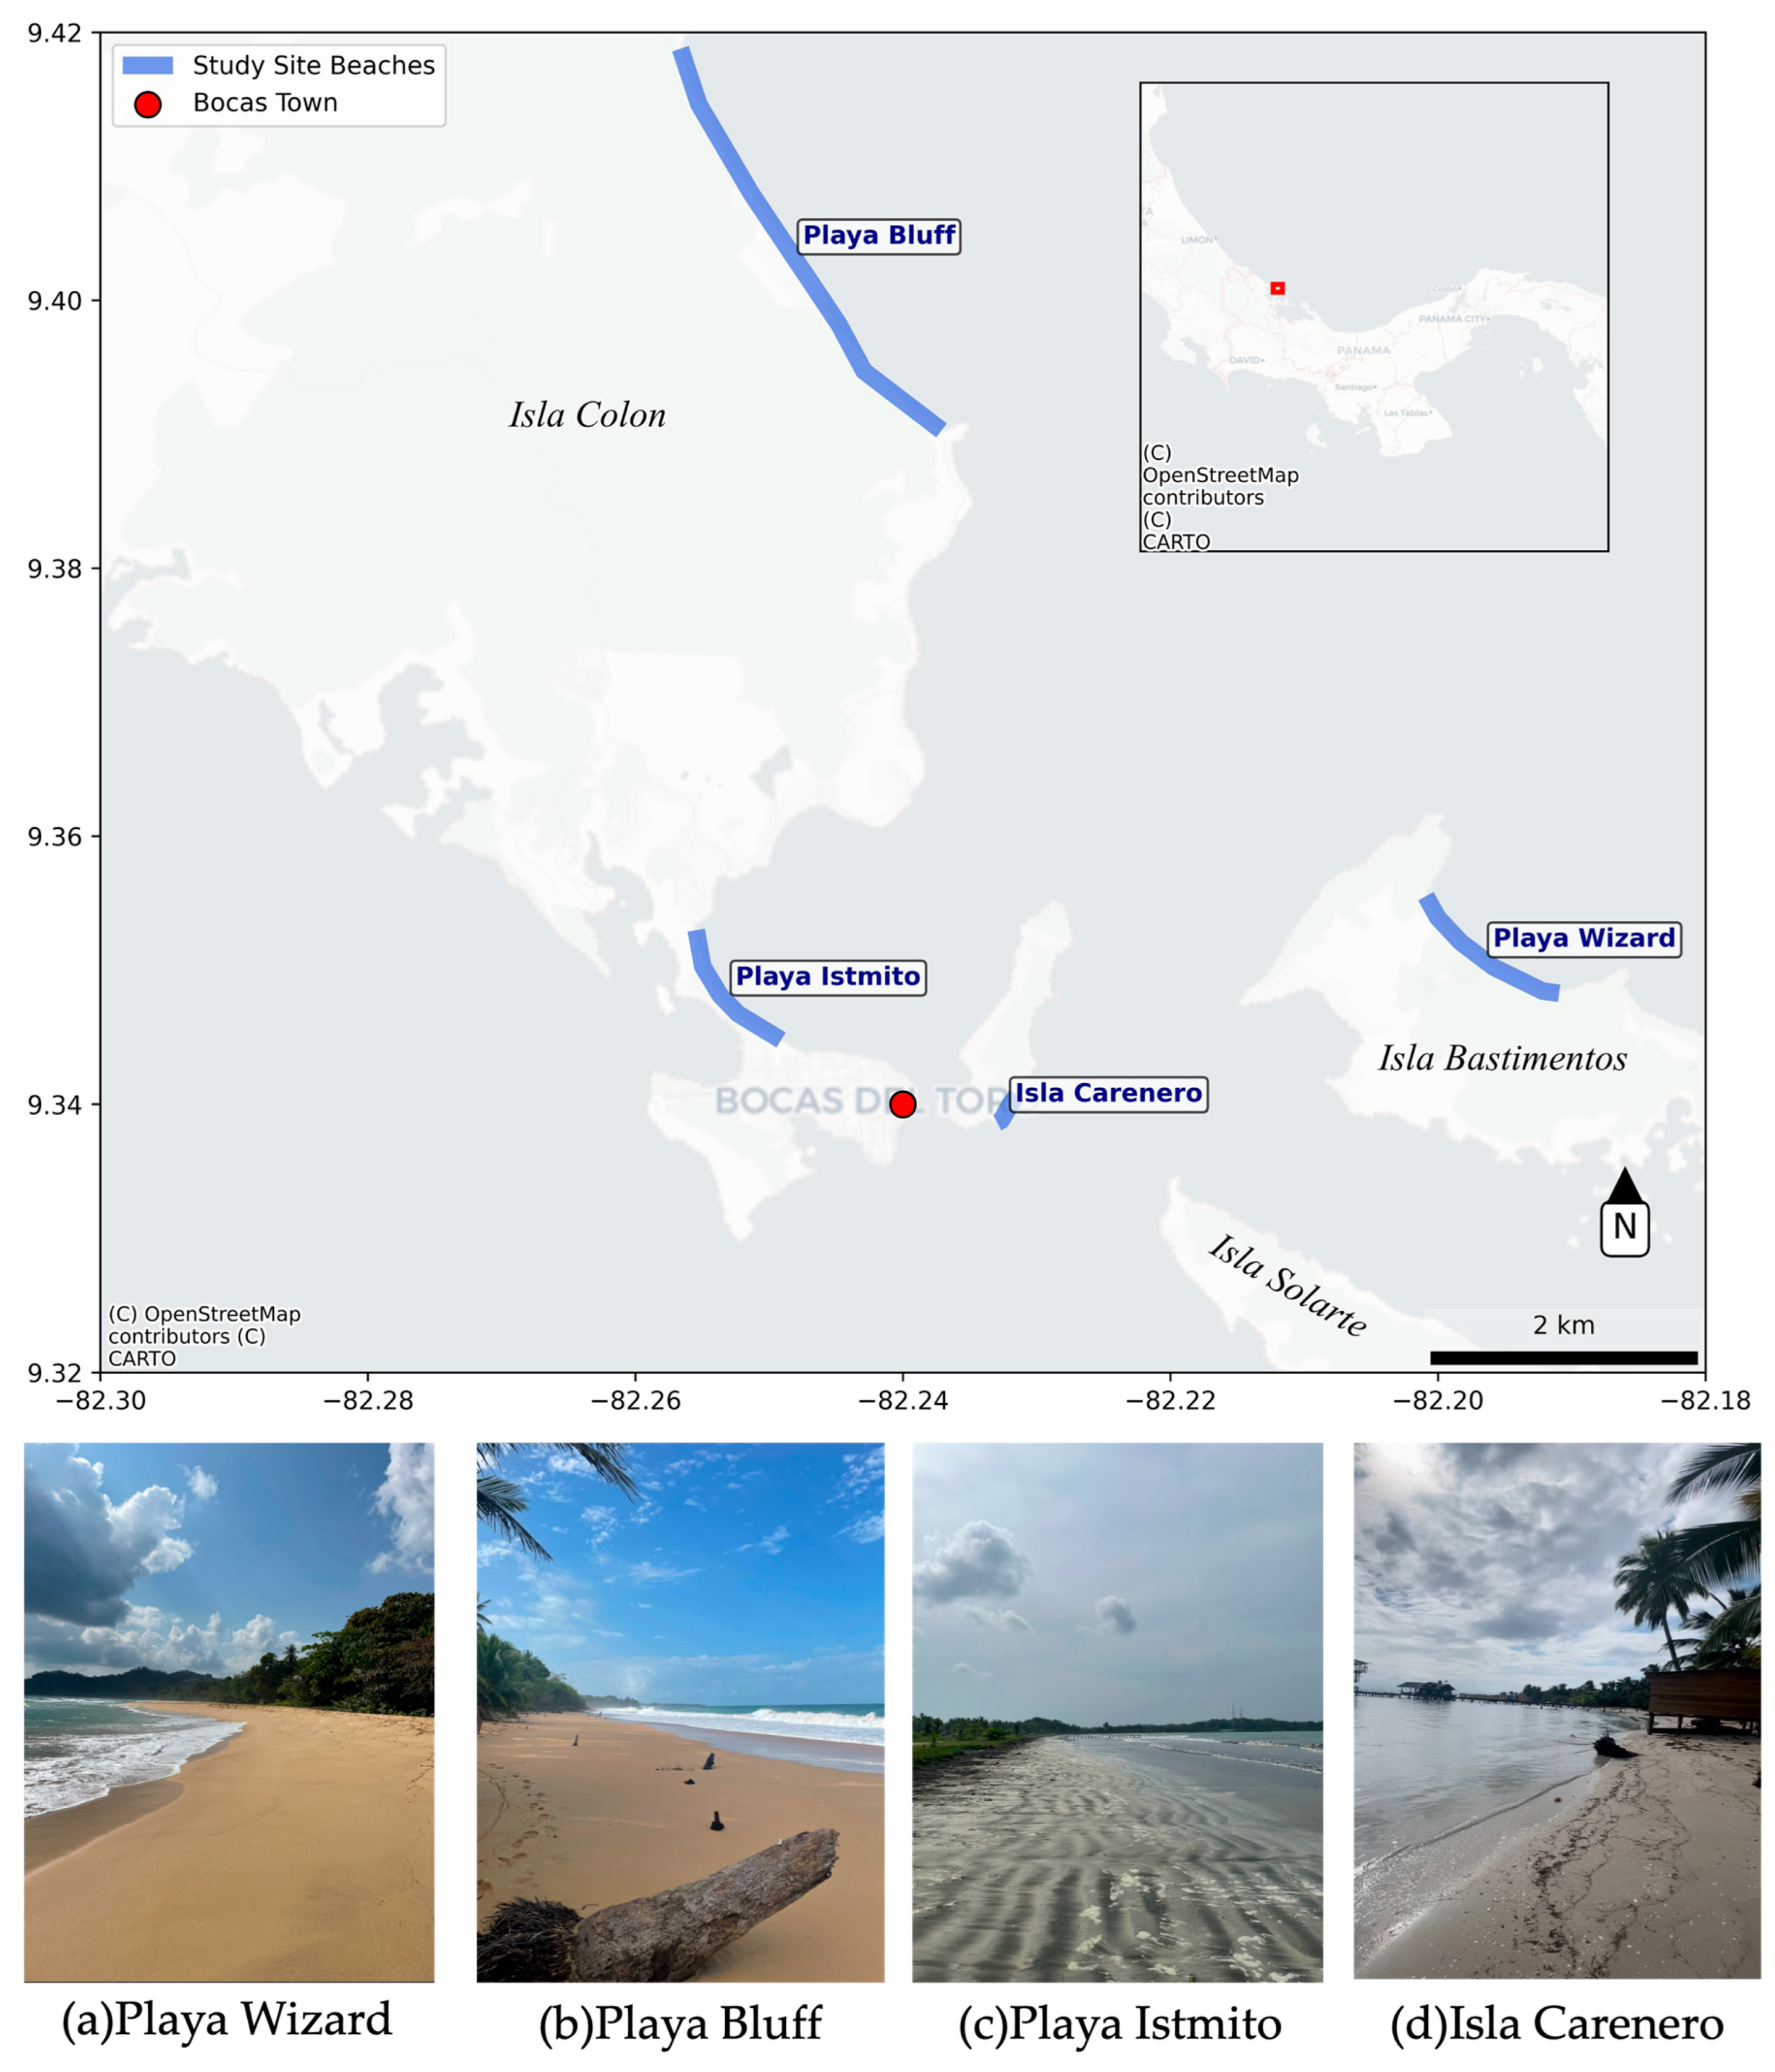
2.1. Data and Study Sites
2.2. Primary Data Collection
2.2.1. Optical Flow Tracking Velocimetry (OFTV)
2.2.2. Sediment Sampling and Beach Profile
2.3. Secondary Data Collection
CoastSat and Tidal Correction
3. Results
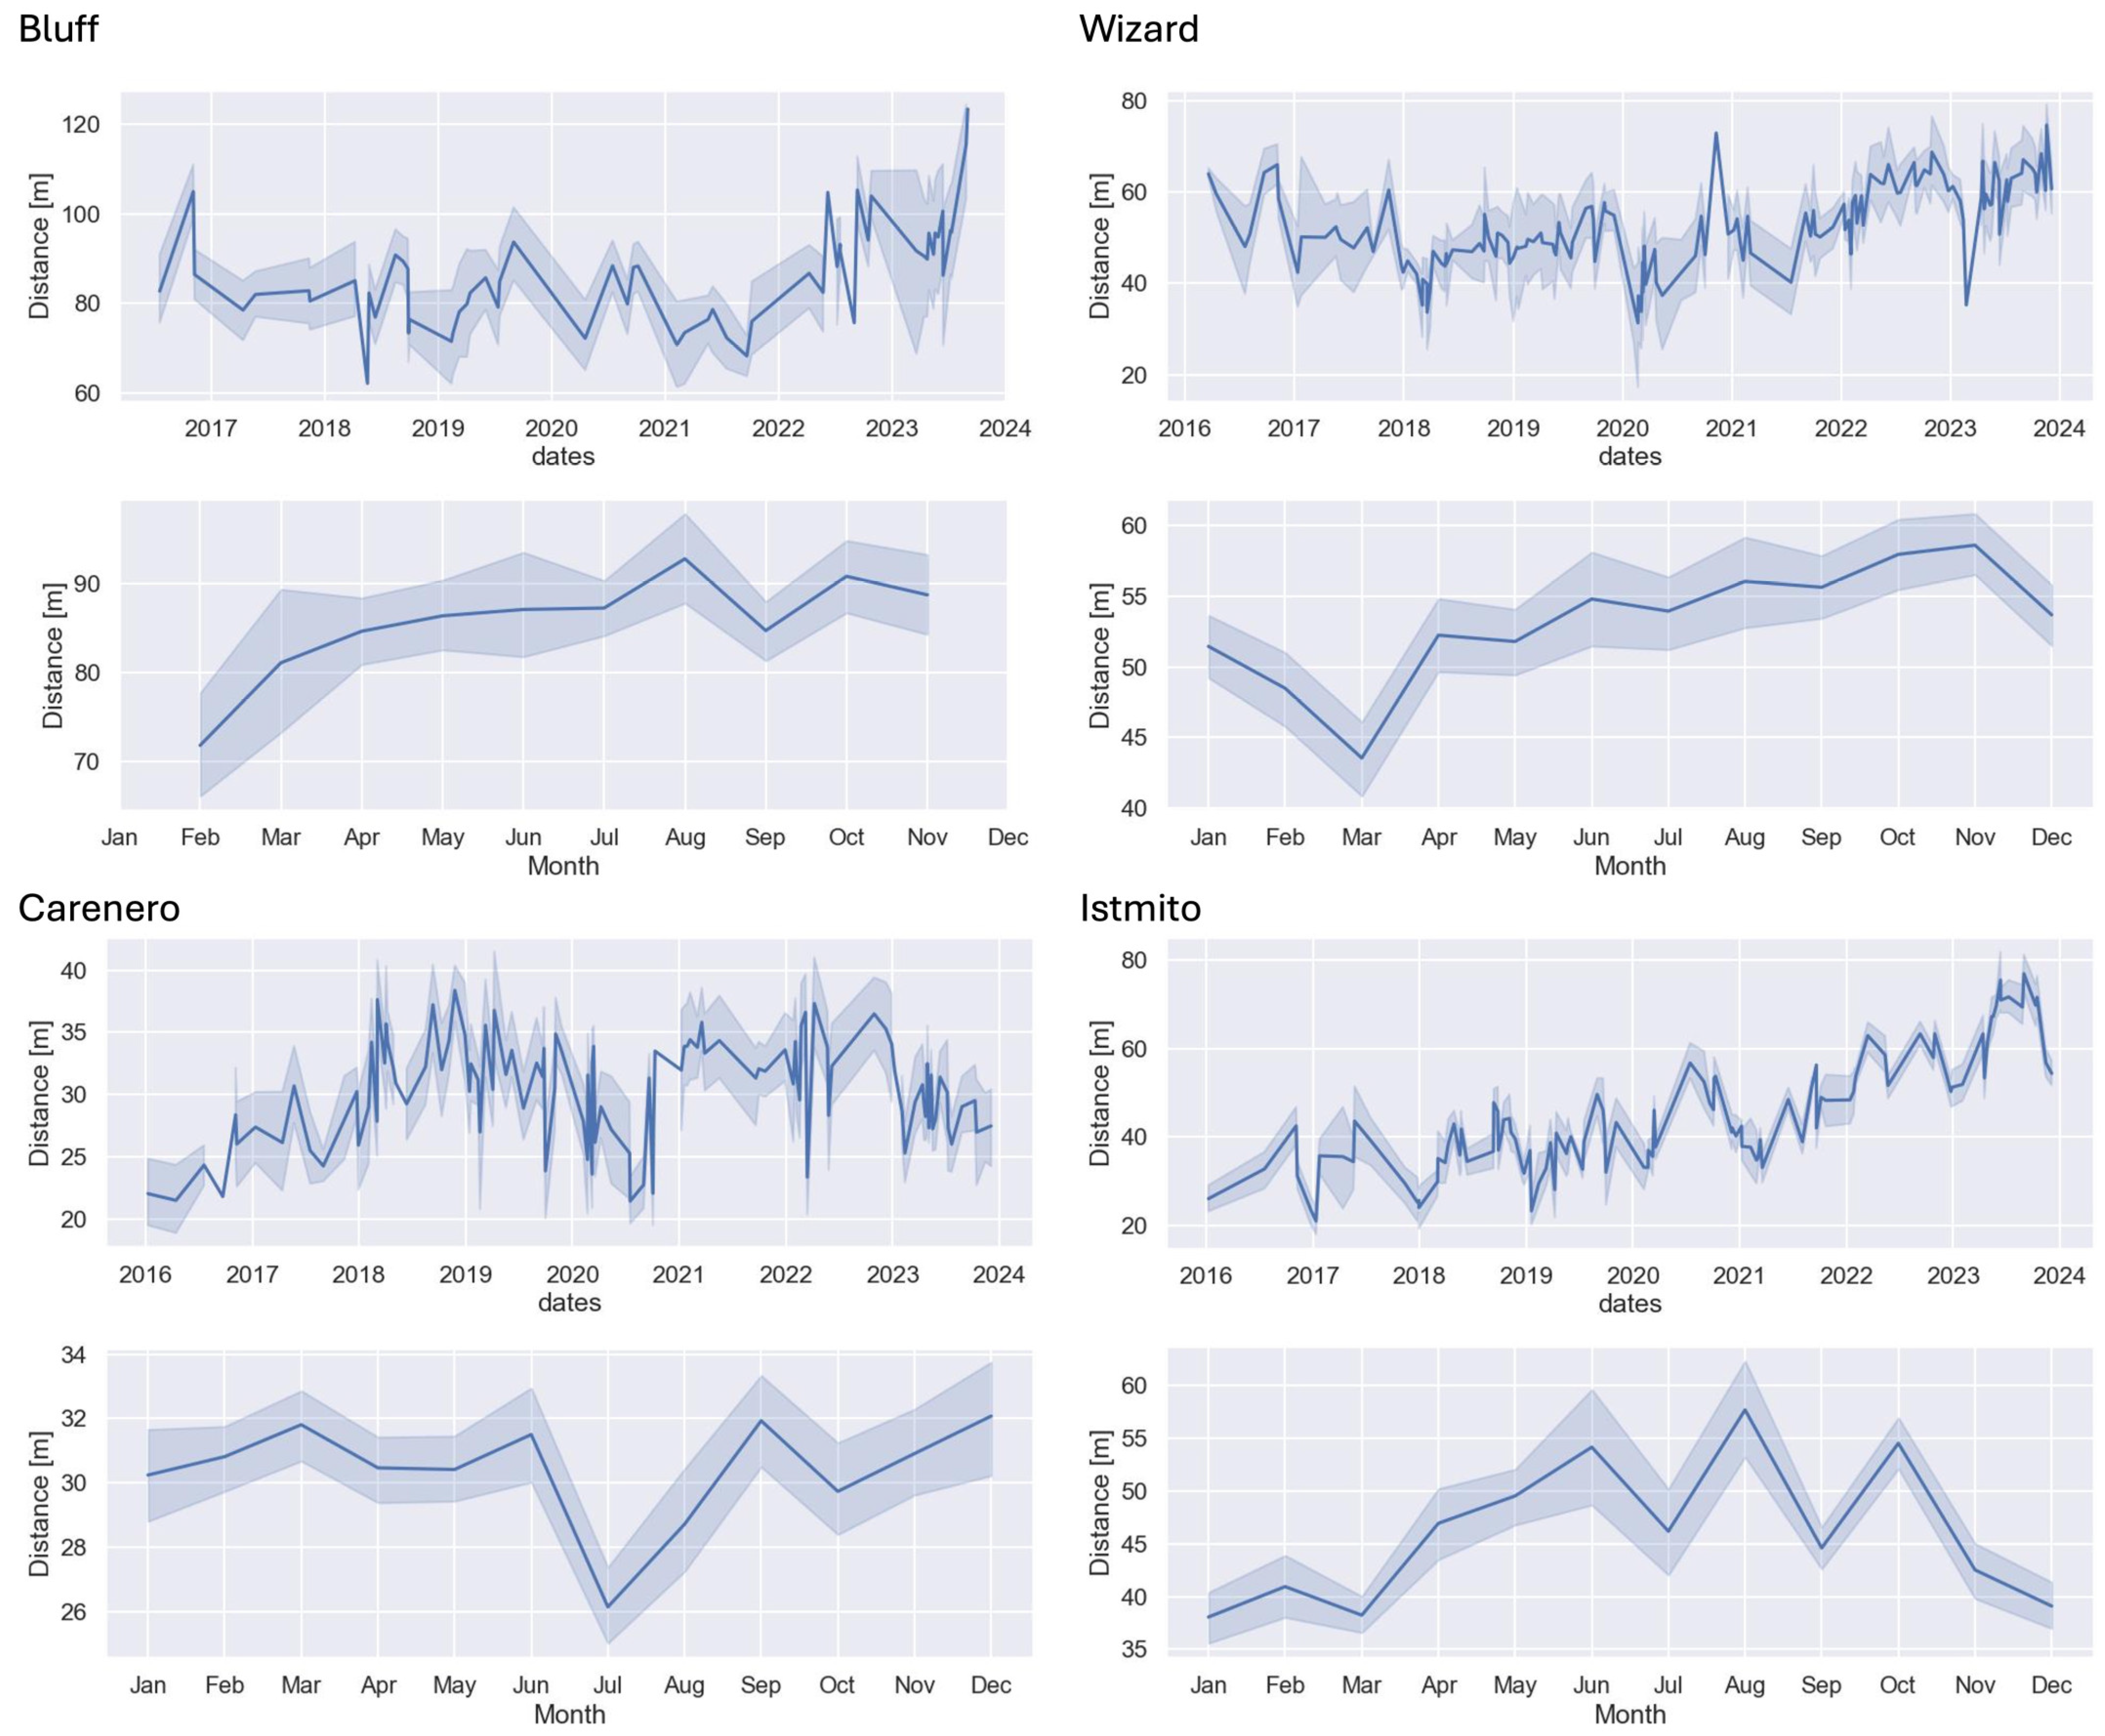
3.1. CoastSat Shoreline Analysis
3.2. Integrated Monitoring of Wave Dynamics and Beach Morphology
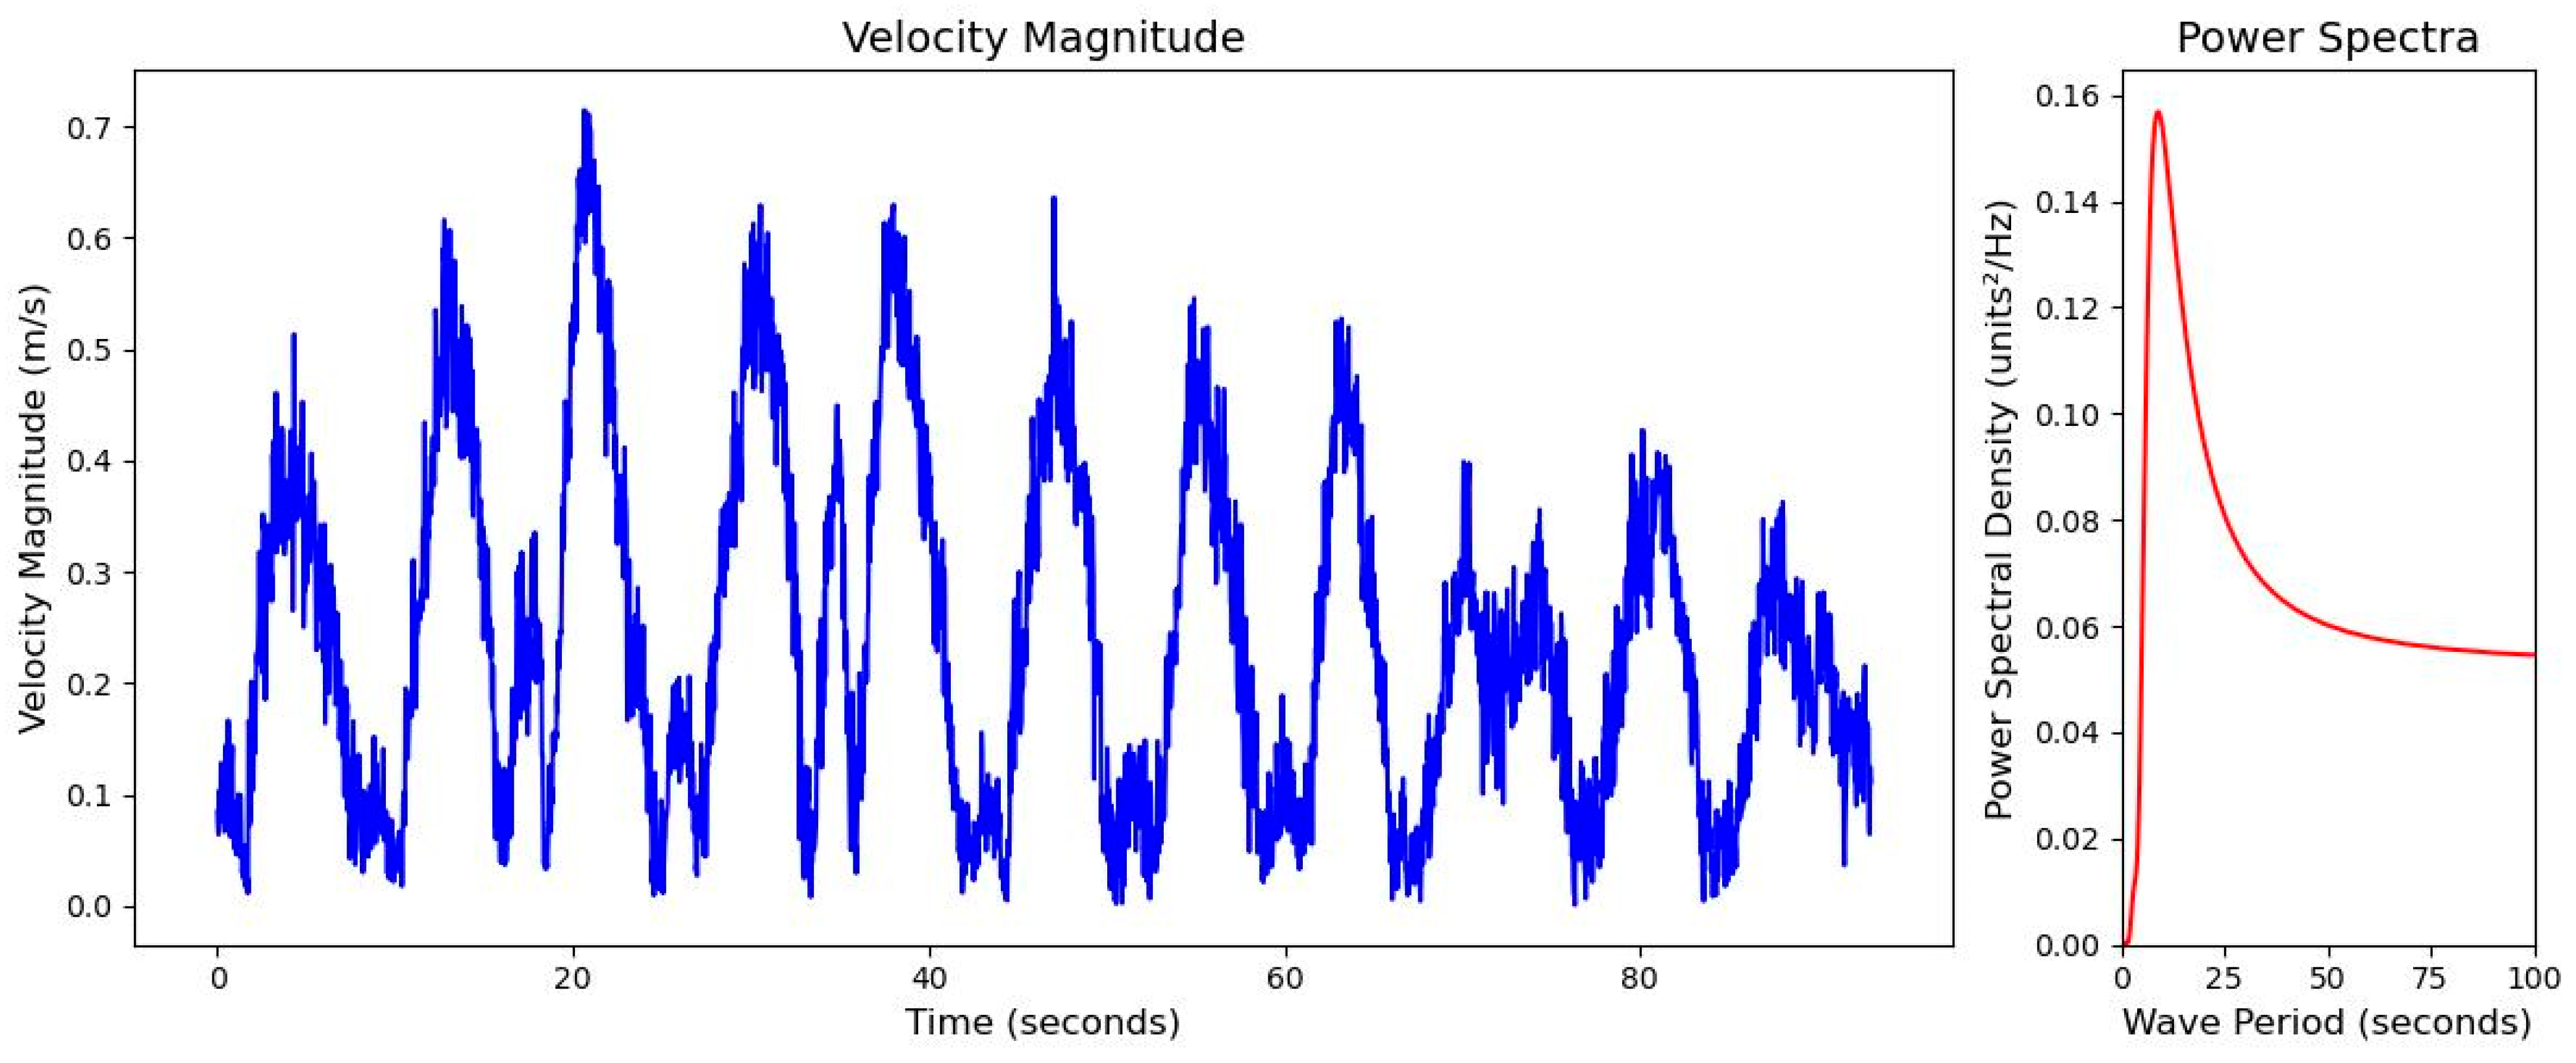
3.2.1. OFTV-Derived Wave Characteristics
3.2.2. Data Verification Against Wave Model Output
3.2.3. Summary of Beach Characteristics
4. Discussion
4.1. Efficacy of the Multi-Platform Toolkit for Beach Characterisation
4.2. Interpreting Patterns and Underlying Coastal Dynamics
5. Conclusions
Author Contributions
Funding
Data Availability Statement
Conflicts of Interest
Appendix A

| (a) | ||
| Playa Bluff | ||
| Date | Time | Duration (s) |
| 29 February 2024 | 10:04 | 126 |
| 29 February 2024 | 10:06 | 124 |
| 29 February 2024 | 10:17 | 103 |
| 29 February 2024 | 10:19 | 109 |
| 29 February 2024 | 09:55 | 100 |
| 29 February 2024 | 09:59 | 127 |
| 29 February 2024 | 10:32 | 121 |
| 29 February 2024 | 10:36 | 126 |
| 7 March 2024 | 09:50 | 119 |
| 7 March 2024 | 09:59 | 122 |
| 7 March 2024 | 10:25 | 110 |
| 7 March 2024 | 10:29 | 145 |
| 7 March 2024 | 11:04 | 104 |
| 7 March 2024 | 11:09 | 136 |
| 13 March 2024 | 10:04 | 100 |
| 13 March 2024 | 10:07 | 71 |
| 13 March 2024 | 10:27 | 92 |
| 13 March 2024 | 10:29 | 93 |
| 13 March 2024 | 10:48 | 92 |
| 13 March 2024 | 10:50 | 98 |
| 13 March 2024 | 11:05 | 91 |
| 13 March 2024 | 11:07 | 92 |
| 22 March 2024 | 08:38 | 92 |
| 22 March 2024 | 08:40 | 93 |
| 22 March 2024 | 09:17 | 92 |
| 22 March 2024 | 09:19 | 92 |
| 22 March 2024 | 09:54 | 93 |
| 22 March 2024 | 09:57 | 92 |
| 22 March 2024 | 10:17 | 92 |
| 22 March 2024 | 10:19 | 93 |
| 28 March 2024 | 08:13 | 97 |
| 28 March 2024 | 08:17 | 94 |
| 28 March 2024 | 08:36 | 93 |
| 28 March 2024 | 08:38 | 99 |
| 28 March 2024 | 08:59 | 95 |
| 28 March 2024 | 09:01 | 101 |
| 28 March 2024 | 09:15 | 95 |
| (b) | ||
| Playa Istmito | ||
| Date | Time | Duration (s) |
| 28 March 2024 | 09:21 | 93 |
| 1 March 2024 | 11:15 | 106 |
| 1 March 2024 | 11:24 | 77 |
| 1 March 2024 | 11:27 | 121 |
| 11 March 2024 | 16:15 | 93 |
| 11 March 2024 | 16:19 | 91 |
| 11 March 2024 | 16:21 | 93 |
| 11 March 2024 | 16:29 | 93 |
| 11 March 2024 | 16:31 | 96 |
| 11 March 2024 | 16:43 | 92 |
| 11 March 2024 | 16:45 | 93 |
| 18 March 2024 | 16:01 | 91 |
| 18 March 2024 | 16:06 | 91 |
| 18 March 2024 | 16:27 | 91 |
| 18 March 2024 | 16:30 | 94 |
| 18 March 2024 | 16:52 | 94 |
| 18 March 2024 | 16:54 | 91 |
| 29 March 2024 | 16:56 | 105 |
| 29 March 2024 | 16:59 | 94 |
| 29 March 2024 | 17:16 | 91 |
| (c) | ||
| Playa Wizard | ||
| Date | Time | Duration (s) |
| 29 March 2024 | 17:18 | 92 |
| 28 February 2024 | 13:49 | 100 |
| 28 February 2024 | 13:56 | 122 |
| 28 February 2024 | 14:09 | 91 |
| 28 February 2024 | 14:14 | 105 |
| 28 February 2024 | 14:23 | 82 |
| 28 February 2024 | 14:27 | 103 |
| 8 March 2024 | 09:30 | 93 |
| 8 March 2024 | 09:31 | 102 |
| 8 March 2024 | 09:42 | 101 |
| 8 March 2024 | 09:44 | 94 |
| 8 March 2024 | 09:53 | 120 |
| 8 March 2024 | 09:59 | 102 |
| 19 March 2024 | 09:57 | 92 |
| 19 March 2024 | 09:59 | 99 |
| 19 March 2024 | 10:09 | 93 |
| 19 March 2024 | 10:11 | 92 |
| 19 March 2024 | 10:26 | 92 |
| 19 March 2024 | 10:28 | 92 |
| 25 March 2024 | 09:26 | 92 |
| 25 March 2024 | 09:28 | 90 |
| 25 March 2024 | 09:59 | 91 |
| 25 March 2024 | 10:01 | 92 |
| 25 March 2024 | 10:34 | 93 |
| 25 March 2024 | 10:36 | 121 |
| 2 April 2024 | 12:44 | 106 |
| 2 April 2024 | 12:48 | 86 |
| 2 April 2024 | 13:14 | 91 |
| 2 April 2024 | 13:16 | 92 |
| 2 April 2024 | 13:29 | 91 |
| (d) | ||
| Isla Carenero | ||
| Date | Time | Duration (s) |
| 2 April 2024 | 13:31 | 91 |
| 30 January 2024 | 09:09 | 22 |
| 27 February 2024 | 15:46 | 88 |
| 27 February 2024 | 15:57 | 53 |
| 27 February 2024 | 16:05 | 31 |
| 12 March 2024 | 12:32 | 74 |
| 12 March 2024 | 12:41 | 94 |
| 12 March 2024 | 12:53 | 74 |
| 21 March 2024 | 10:30 | 92 |
| 21 March 2024 | 10:53 | 94 |
| 21 March 2024 | 11:06 | 92 |
| 27 March 2024 | 08:47 | 92 |
| 27 March 2024 | 09:00 | 93 |
| 27 March 2024 | 09:05 | 92 |
| Site | Date | Cloud Cover | Satellite | Resolution (m) |
|---|---|---|---|---|
| BLUFF | 2016-07-19 15:51:12+00:00 | 0.11052476 | L7 | 30 |
| BLUFF | 2016-09-21 15:50:58+00:00 | 0 | L7 | 30 |
| BLUFF | 2016-11-04 15:55:23+00:00 | 0 | S2 | 10 |
| BLUFF | 2016-11-08 15:51:14+00:00 | 0 | L7 | 30 |
| BLUFF | 2017-04-13 15:57:55+00:00 | 0 | S2 | 10 |
| BLUFF | 2017-05-19 15:50:44+00:00 | 0 | L7 | 30 |
| BLUFF | 2017-05-23 15:58:50+00:00 | 0 | S2 | 10 |
| BLUFF | 2017-09-08 15:51:14+00:00 | 0 | L7 | 30 |
| BLUFF | 2017-11-11 15:50:50+00:00 | 0 | L7 | 30 |
| BLUFF | 2017-11-14 15:58:56+00:00 | 0.05404932 | S2 | 10 |
| BLUFF | 2018-04-08 15:55:57+00:00 | 0 | S2 | 10 |
| BLUFF | 2018-05-06 15:48:59+00:00 | 0.15043509 | L7 | 30 |
| BLUFF | 2018-05-18 15:57:58+00:00 | 0.17213233 | S2 | 10 |
| BLUFF | 2018-05-23 15:56:34+00:00 | 0 | S2 | 10 |
| BLUFF | 2018-06-12 15:55:23+00:00 | 0 | S2 | 10 |
| BLUFF | 2018-08-16 15:55:24+00:00 | 0 | S2 | 10 |
| BLUFF | 2018-09-10 15:55:16+00:00 | 0.00083375 | S2 | 10 |
| BLUFF | 2018-09-11 15:46:37+00:00 | 0.01755119 | L7 | 30 |
| BLUFF | 2018-09-25 15:55:50+00:00 | 0.0130723 | S2 | 10 |
| BLUFF | 2018-09-27 15:46:15+00:00 | 0 | L7 | 30 |
| BLUFF | 2018-09-30 15:57:15+00:00 | 0 | S2 | 10 |
| BLUFF | 2018-10-15 15:55:22+00:00 | 0.0012043 | S2 | 10 |
| BLUFF | 2019-02-12 16:00:42+00:00 | 0 | S2 | 10 |
| BLUFF | 2019-02-17 16:00:45+00:00 | 0.19530221 | S2 | 10 |
| BLUFF | 2019-03-09 16:00:43+00:00 | 0.02988101 | S2 | 10 |
| BLUFF | 2019-04-03 16:00:46+00:00 | 0 | S2 | 10 |
| BLUFF | 2019-04-13 16:00:48+00:00 | 0.30771369 | S2 | 10 |
| BLUFF | 2019-05-23 16:00:49+00:00 | 0 | S2 | 10 |
| BLUFF | 2019-06-02 16:00:48+00:00 | 0.00605237 | S2 | 10 |
| BLUFF | 2019-07-12 16:00:51+00:00 | 0.00241889 | S2 | 10 |
| BLUFF | 2019-07-17 16:00:54+00:00 | 0 | S2 | 10 |
| BLUFF | 2019-08-31 16:00:46+00:00 | 0 | S2 | 10 |
| BLUFF | 2020-04-17 16:00:46+00:00 | 0.00205863 | S2 | 10 |
| BLUFF | 2020-07-14 15:18:32+00:00 | 0.01264976 | L7 | 30 |
| BLUFF | 2020-07-16 16:00:50+00:00 | 0 | S2 | 10 |
| BLUFF | 2020-08-20 16:00:49+00:00 | 0.25062788 | S2 | 10 |
| BLUFF | 2020-08-31 15:15:06+00:00 | 0 | L7 | 30 |
| BLUFF | 2020-09-19 16:00:47+00:00 | 0 | S2 | 10 |
| BLUFF | 2020-10-04 16:00:51+00:00 | 0.03706563 | S2 | 10 |
| BLUFF | 2020-10-09 16:00:49+00:00 | 0 | S2 | 10 |
| BLUFF | 2021-02-06 16:00:45+00:00 | 0 | S2 | 10 |
| BLUFF | 2021-03-03 16:00:45+00:00 | 0 | S2 | 10 |
| BLUFF | 2021-05-17 16:00:47+00:00 | 0.00169837 | S2 | 10 |
| BLUFF | 2021-06-01 16:00:46+00:00 | 0.48851285 | S2 | 10 |
| BLUFF | 2021-07-16 16:00:47+00:00 | 0.00313941 | S2 | 10 |
| BLUFF | 2021-09-03 14:46:42+00:00 | 0 | L7 | 30 |
| BLUFF | 2021-09-19 14:45:41+00:00 | 0 | L7 | 30 |
| BLUFF | 2021-10-05 14:43:52+00:00 | 0 | L7 | 30 |
| BLUFF | 2022-04-07 16:00:46+00:00 | 0.15902915 | S2 | 10 |
| BLUFF | 2022-05-22 16:00:46+00:00 | 0.18941453 | S2 | 10 |
| BLUFF | 2022-06-06 16:00:53+00:00 | 0 | S2 | 10 |
| BLUFF | 2022-07-06 16:00:58+00:00 | 0.10995142 | S2 | 10 |
| BLUFF | 2022-07-16 14:16:43+00:00 | 0.25490196 | L7 | 30 |
| BLUFF | 2022-07-16 16:00:58+00:00 | 0 | S2 | 10 |
| BLUFF | 2022-08-30 16:00:46+00:00 | 0.44499341 | S2 | 10 |
| BLUFF | 2022-09-09 16:00:47+00:00 | 0.0313941 | S2 | 10 |
| BLUFF | 2022-10-04 16:00:52+00:00 | 0.03369977 | S2 | 10 |
| BLUFF | 2022-10-14 16:00:50+00:00 | 0.1197402 | S2 | 10 |
| BLUFF | 2022-10-24 16:00:48+00:00 | 0 | S2 | 10 |
| BLUFF | 2023-03-18 16:00:49+00:00 | 0.00428195 | S2 | 10 |
| BLUFF | 2023-04-12 16:00:46+00:00 | 0 | S2 | 10 |
| BLUFF | 2023-04-22 16:00:44+00:00 | 0.0002985 | S2 | 10 |
| BLUFF | 2023-04-27 16:00:47+00:00 | 0 | S2 | 10 |
| BLUFF | 2023-05-12 16:00:45+00:00 | 0.01034461 | S2 | 10 |
| BLUFF | 2023-05-17 16:00:50+00:00 | 0.00062788 | S2 | 10 |
| BLUFF | 2023-05-27 16:00:50+00:00 | 0 | S2 | 10 |
| BLUFF | 2023-06-11 16:00:49+00:00 | 0 | S2 | 10 |
| BLUFF | 2023-06-12 13:37:30+00:00 | 0 | L7 | 30 |
| BLUFF | 2023-07-06 16:00:51+00:00 | 0 | S2 | 10 |
| BLUFF | 2023-07-09 13:37:32+00:00 | 0 | L7 | 30 |
| BLUFF | 2023-08-25 16:00:53+00:00 | 0 | S2 | 10 |
| BLUFF | 2023-08-30 16:00:51+00:00 | 0.08399209 | S2 | 10 |
| CARENERO | 2016-01-09 15:49:47+00:00 | 0 | L7 | 30 |
| CARENERO | 2016-04-14 15:50:29+00:00 | 0.05726634 | L7 | 30 |
| CARENERO | 2016-07-19 15:51:12+00:00 | 0 | L7 | 30 |
| CARENERO | 2016-09-21 15:51:22+00:00 | 0 | L7 | 30 |
| CARENERO | 2016-11-04 15:55:23+00:00 | 0 | S2 | 10 |
| CARENERO | 2016-11-08 15:50:50+00:00 | 0 | L7 | 30 |
| CARENERO | 2017-01-11 15:50:25+00:00 | 0.01381065 | L7 | 30 |
| CARENERO | 2017-04-13 15:57:55+00:00 | 0 | S2 | 10 |
| CARENERO | 2017-05-23 15:58:50+00:00 | 0 | S2 | 10 |
| CARENERO | 2017-07-17 15:55:25+00:00 | 0 | S2 | 10 |
| CARENERO | 2017-08-31 15:59:09+00:00 | 0.01699219 | S2 | 10 |
| CARENERO | 2017-11-11 15:51:14+00:00 | 0 | L7 | 30 |
| CARENERO | 2017-12-24 15:55:13+00:00 | 0 | S2 | 10 |
| CARENERO | 2017-12-29 16:00:33+00:00 | 0 | S2 | 10 |
| CARENERO | 2018-02-02 15:58:36+00:00 | 0 | S2 | 10 |
| CARENERO | 2018-02-12 15:57:10+00:00 | 0 | S2 | 10 |
| CARENERO | 2018-03-03 15:49:34+00:00 | 0 | L7 | 30 |
| CARENERO | 2018-03-04 15:56:09+00:00 | 0 | S2 | 10 |
| CARENERO | 2018-03-29 15:55:24+00:00 | 0 | S2 | 10 |
| CARENERO | 2018-04-03 16:00:35+00:00 | 0.01523438 | S2 | 10 |
| CARENERO | 2018-04-08 15:55:57+00:00 | 0 | S2 | 10 |
| CARENERO | 2018-04-28 15:55:27+00:00 | 0 | S2 | 10 |
| CARENERO | 2018-05-06 15:48:59+00:00 | 0 | L7 | 30 |
| CARENERO | 2018-06-12 15:55:23+00:00 | 0 | S2 | 10 |
| CARENERO | 2018-08-16 15:55:24+00:00 | 0 | S2 | 10 |
| CARENERO | 2018-09-10 15:55:16+00:00 | 0 | S2 | 10 |
| CARENERO | 2018-09-27 15:46:15+00:00 | 0 | L7 | 30 |
| CARENERO | 2018-10-10 15:56:19+00:00 | 0 | S2 | 10 |
| CARENERO | 2018-11-04 15:55:21+00:00 | 0 | S2 | 10 |
| CARENERO | 2018-11-24 16:00:38+00:00 | 0 | S2 | 10 |
| CARENERO | 2018-12-29 16:00:42+00:00 | 0 | S2 | 10 |
| CARENERO | 2019-01-13 16:00:41+00:00 | 0 | S2 | 10 |
| CARENERO | 2019-01-18 16:00:45+00:00 | 0 | S2 | 10 |
| CARENERO | 2019-02-12 16:00:42+00:00 | 0 | S2 | 10 |
| CARENERO | 2019-02-18 15:41:57+00:00 | 0.20694018 | L7 | 30 |
| CARENERO | 2019-03-09 16:00:43+00:00 | 0 | S2 | 10 |
| CARENERO | 2019-04-03 16:00:46+00:00 | 0 | S2 | 10 |
| CARENERO | 2019-04-08 16:00:49+00:00 | 0.0078125 | S2 | 10 |
| CARENERO | 2019-05-18 16:00:54+00:00 | 0 | S2 | 10 |
| CARENERO | 2019-05-23 16:00:49+00:00 | 0 | S2 | 10 |
| CARENERO | 2019-06-07 16:00:53+00:00 | 0 | S2 | 10 |
| CARENERO | 2019-07-17 16:00:54+00:00 | 0 | S2 | 10 |
| CARENERO | 2019-08-31 16:00:46+00:00 | 0 | S2 | 10 |
| CARENERO | 2019-09-20 16:00:45+00:00 | 0 | S2 | 10 |
| CARENERO | 2019-09-25 16:00:45+00:00 | 0 | S2 | 10 |
| CARENERO | 2019-09-30 15:33:26+00:00 | 0 | L7 | 30 |
| CARENERO | 2019-11-01 15:32:28+00:00 | 0.10612691 | L7 | 30 |
| CARENERO | 2019-11-04 16:00:46+00:00 | 0 | S2 | 10 |
| CARENERO | 2019-11-24 16:00:42+00:00 | 0 | S2 | 10 |
| CARENERO | 2020-02-07 16:00:37+00:00 | 0 | S2 | 10 |
| CARENERO | 2020-02-21 15:26:31+00:00 | 0 | L7 | 30 |
| CARENERO | 2020-02-22 16:00:42+00:00 | 0 | S2 | 10 |
| CARENERO | 2020-03-08 15:26:03+00:00 | 0 | L7 | 30 |
| CARENERO | 2020-03-08 16:00:41+00:00 | 0 | S2 | 10 |
| CARENERO | 2020-03-13 16:00:43+00:00 | 0 | S2 | 10 |
| CARENERO | 2020-03-18 16:00:42+00:00 | 0 | S2 | 10 |
| CARENERO | 2020-04-07 16:00:43+00:00 | 0 | S2 | 10 |
| CARENERO | 2020-05-12 16:00:44+00:00 | 0.0656901 | S2 | 10 |
| CARENERO | 2020-07-14 15:18:08+00:00 | 0 | L7 | 30 |
| CARENERO | 2020-07-16 16:00:50+00:00 | 0.02604167 | S2 | 10 |
| CARENERO | 2020-08-31 15:15:30+00:00 | 0 | L7 | 30 |
| CARENERO | 2020-09-19 16:00:47+00:00 | 0 | S2 | 10 |
| CARENERO | 2020-10-02 15:13:24+00:00 | 0 | L7 | 30 |
| CARENERO | 2020-10-04 16:00:51+00:00 | 0 | S2 | 10 |
| CARENERO | 2020-10-09 16:00:49+00:00 | 0 | S2 | 10 |
| CARENERO | 2021-01-07 16:00:45+00:00 | 0 | S2 | 10 |
| CARENERO | 2021-01-17 16:00:45+00:00 | 0 | S2 | 10 |
| CARENERO | 2021-01-27 16:00:45+00:00 | 0 | S2 | 10 |
| CARENERO | 2021-02-06 16:00:45+00:00 | 0 | S2 | 10 |
| CARENERO | 2021-03-03 16:00:45+00:00 | 0 | S2 | 10 |
| CARENERO | 2021-03-18 16:00:45+00:00 | 0 | S2 | 10 |
| CARENERO | 2021-03-28 16:00:44+00:00 | 0 | S2 | 10 |
| CARENERO | 2021-05-17 16:00:47+00:00 | 0.27552083 | S2 | 10 |
| CARENERO | 2021-09-19 14:45:41+00:00 | 0 | L7 | 30 |
| CARENERO | 2021-09-29 16:00:50+00:00 | 0 | S2 | 10 |
| CARENERO | 2021-10-21 14:42:51+00:00 | 0 | L7 | 30 |
| CARENERO | 2021-12-28 16:00:47+00:00 | 0 | S2 | 10 |
| CARENERO | 2022-01-25 14:33:14+00:00 | 0 | L7 | 30 |
| CARENERO | 2022-02-01 16:00:40+00:00 | 0 | S2 | 10 |
| CARENERO | 2022-02-06 16:00:45+00:00 | 0 | S2 | 10 |
| CARENERO | 2022-02-16 16:00:46+00:00 | 0.03990885 | S2 | 10 |
| CARENERO | 2022-02-21 16:00:40+00:00 | 0 | S2 | 10 |
| CARENERO | 2022-03-08 16:00:49+00:00 | 0 | S2 | 10 |
| CARENERO | 2022-03-14 14:28:28+00:00 | 0 | L7 | 30 |
| CARENERO | 2022-04-07 16:00:46+00:00 | 0 | S2 | 10 |
| CARENERO | 2022-05-22 16:00:46+00:00 | 0 | S2 | 10 |
| CARENERO | 2022-05-26 14:19:29+00:00 | 0 | L7 | 30 |
| CARENERO | 2022-06-06 16:00:53+00:00 | 0 | S2 | 10 |
| CARENERO | 2022-08-30 16:00:46+00:00 | 0.00214844 | S2 | 10 |
| CARENERO | 2022-10-29 16:00:44+00:00 | 0 | S2 | 10 |
| CARENERO | 2022-12-08 16:00:42+00:00 | 0 | S2 | 10 |
| CARENERO | 2022-12-28 16:00:45+00:00 | 0 | S2 | 10 |
| CARENERO | 2023-01-07 16:00:43+00:00 | 0 | S2 | 10 |
| CARENERO | 2023-02-01 16:00:44+00:00 | 0 | S2 | 10 |
| CARENERO | 2023-02-11 16:00:44+00:00 | 0 | S2 | 10 |
| CARENERO | 2023-03-18 16:00:49+00:00 | 0.43307292 | S2 | 10 |
| CARENERO | 2023-04-12 16:00:46+00:00 | 0 | S2 | 10 |
| CARENERO | 2023-04-17 16:00:47+00:00 | 0 | S2 | 10 |
| CARENERO | 2023-04-22 16:00:44+00:00 | 0 | S2 | 10 |
| CARENERO | 2023-04-27 16:00:47+00:00 | 0 | S2 | 10 |
| CARENERO | 2023-04-29 13:43:00+00:00 | 0 | L7 | 30 |
| CARENERO | 2023-05-04 13:46:58+00:00 | 0 | L7 | 30 |
| CARENERO | 2023-05-12 16:00:45+00:00 | 0 | S2 | 10 |
| CARENERO | 2023-05-17 16:00:50+00:00 | 0 | S2 | 10 |
| CARENERO | 2023-05-27 16:00:50+00:00 | 0 | S2 | 10 |
| CARENERO | 2023-06-11 16:00:49+00:00 | 0 | S2 | 10 |
| CARENERO | 2023-07-06 16:00:51+00:00 | 0.02415365 | S2 | 10 |
| CARENERO | 2023-07-09 13:37:32+00:00 | 0 | L7 | 30 |
| CARENERO | 2023-07-21 16:00:50+00:00 | 0 | S2 | 10 |
| CARENERO | 2023-08-25 16:00:53+00:00 | 0 | S2 | 10 |
| CARENERO | 2023-10-09 16:00:45+00:00 | 0 | S2 | 10 |
| CARENERO | 2023-10-14 16:00:48+00:00 | 0.1750651 | S2 | 10 |
| CARENERO | 2023-11-13 16:00:46+00:00 | 0 | S2 | 10 |
| CARENERO | 2023-12-03 16:00:42+00:00 | 0 | S2 | 10 |
| ISTMITO | 2016-01-09 15:50:11+00:00 | 0.03811944 | L7 | 30 |
| ISTMITO | 2016-07-19 15:50:48+00:00 | 0 | L7 | 30 |
| ISTMITO | 2016-11-04 15:55:23+00:00 | 0 | S2 | 10 |
| ISTMITO | 2016-11-08 15:50:50+00:00 | 0 | L7 | 30 |
| ISTMITO | 2016-12-24 15:59:57+00:00 | 0 | S2 | 10 |
| ISTMITO | 2017-01-11 15:50:49+00:00 | 0 | L7 | 30 |
| ISTMITO | 2017-01-23 15:55:18+00:00 | 0 | S2 | 10 |
| ISTMITO | 2017-04-13 15:57:55+00:00 | 0.05828841 | S2 | 10 |
| ISTMITO | 2017-05-19 15:51:07+00:00 | 0 | L7 | 30 |
| ISTMITO | 2017-05-23 15:58:50+00:00 | 0 | S2 | 10 |
| ISTMITO | 2017-07-17 15:55:25+00:00 | 0 | S2 | 10 |
| ISTMITO | 2017-08-31 15:59:09+00:00 | 0 | S2 | 10 |
| ISTMITO | 2017-11-11 15:50:50+00:00 | 0 | L7 | 30 |
| ISTMITO | 2017-12-24 15:55:13+00:00 | 0.00269542 | S2 | 10 |
| ISTMITO | 2017-12-29 15:50:49+00:00 | 0 | L7 | 30 |
| ISTMITO | 2017-12-29 16:00:33+00:00 | 0 | S2 | 10 |
| ISTMITO | 2018-02-02 15:58:36+00:00 | 0 | S2 | 10 |
| ISTMITO | 2018-02-12 15:57:10+00:00 | 0 | S2 | 10 |
| ISTMITO | 2018-03-03 15:49:34+00:00 | 0 | L7 | 30 |
| ISTMITO | 2018-03-04 15:56:09+00:00 | 0 | S2 | 10 |
| ISTMITO | 2018-03-29 15:55:24+00:00 | 0.00269542 | S2 | 10 |
| ISTMITO | 2018-04-08 15:55:57+00:00 | 0 | S2 | 10 |
| ISTMITO | 2018-04-28 15:55:27+00:00 | 0 | S2 | 10 |
| ISTMITO | 2018-05-18 15:57:58+00:00 | 0 | S2 | 10 |
| ISTMITO | 2018-05-22 15:48:20+00:00 | 0.25753769 | L7 | 30 |
| ISTMITO | 2018-05-23 15:56:34+00:00 | 0 | S2 | 10 |
| ISTMITO | 2018-06-12 15:55:23+00:00 | 0 | S2 | 10 |
| ISTMITO | 2018-08-16 15:55:24+00:00 | 0 | S2 | 10 |
| ISTMITO | 2018-09-10 15:55:16+00:00 | 0 | S2 | 10 |
| ISTMITO | 2018-09-11 15:46:14+00:00 | 0 | L7 | 30 |
| ISTMITO | 2018-09-25 15:55:50+00:00 | 0 | S2 | 10 |
| ISTMITO | 2018-09-27 15:45:51+00:00 | 0.281652 | L7 | 30 |
| ISTMITO | 2018-10-10 15:56:19+00:00 | 0 | S2 | 10 |
| ISTMITO | 2018-10-15 15:55:22+00:00 | 0.00516622 | S2 | 10 |
| ISTMITO | 2018-11-04 15:55:21+00:00 | 0.06738544 | S2 | 10 |
| ISTMITO | 2018-11-09 16:00:43+00:00 | 0.02021563 | S2 | 10 |
| ISTMITO | 2018-11-24 16:00:38+00:00 | 0 | S2 | 10 |
| ISTMITO | 2018-12-19 16:00:40+00:00 | 0 | S2 | 10 |
| ISTMITO | 2018-12-24 16:00:38+00:00 | 0 | S2 | 10 |
| ISTMITO | 2019-01-13 16:00:41+00:00 | 0 | S2 | 10 |
| ISTMITO | 2019-01-18 16:00:45+00:00 | 0 | S2 | 10 |
| ISTMITO | 2019-02-12 16:00:42+00:00 | 0 | S2 | 10 |
| ISTMITO | 2019-03-09 16:00:43+00:00 | 0 | S2 | 10 |
| ISTMITO | 2019-03-24 16:00:44+00:00 | 0 | S2 | 10 |
| ISTMITO | 2019-04-08 16:00:49+00:00 | 0 | S2 | 10 |
| ISTMITO | 2019-04-13 16:00:48+00:00 | 0 | S2 | 10 |
| ISTMITO | 2019-05-18 16:00:54+00:00 | 0 | S2 | 10 |
| ISTMITO | 2019-05-23 16:00:49+00:00 | 0 | S2 | 10 |
| ISTMITO | 2019-06-02 16:00:48+00:00 | 0 | S2 | 10 |
| ISTMITO | 2019-07-12 15:36:48+00:00 | 0.25826972 | L7 | 30 |
| ISTMITO | 2019-07-17 16:00:54+00:00 | 0 | S2 | 10 |
| ISTMITO | 2019-08-31 16:00:46+00:00 | 0 | S2 | 10 |
| ISTMITO | 2019-09-20 16:00:45+00:00 | 0 | S2 | 10 |
| ISTMITO | 2019-09-25 16:00:45+00:00 | 0 | S2 | 10 |
| ISTMITO | 2019-09-30 15:33:50+00:00 | 0.16372796 | L7 | 30 |
| ISTMITO | 2019-11-01 15:32:05+00:00 | 0 | L7 | 30 |
| ISTMITO | 2019-11-04 16:00:46+00:00 | 0 | S2 | 10 |
| ISTMITO | 2020-02-07 16:00:37+00:00 | 0 | S2 | 10 |
| ISTMITO | 2020-02-21 15:26:54+00:00 | 0 | L7 | 30 |
| ISTMITO | 2020-02-22 16:00:42+00:00 | 0 | S2 | 10 |
| ISTMITO | 2020-03-08 15:25:39+00:00 | 0 | L7 | 30 |
| ISTMITO | 2020-03-13 16:00:43+00:00 | 0 | S2 | 10 |
| ISTMITO | 2020-03-18 16:00:42+00:00 | 0.02493261 | S2 | 10 |
| ISTMITO | 2020-07-14 15:18:08+00:00 | 0 | L7 | 30 |
| ISTMITO | 2020-08-31 15:15:30+00:00 | 0 | L7 | 30 |
| ISTMITO | 2020-09-19 16:00:47+00:00 | 0 | S2 | 10 |
| ISTMITO | 2020-10-02 15:13:00+00:00 | 0 | L7 | 30 |
| ISTMITO | 2020-10-04 16:00:51+00:00 | 0 | S2 | 10 |
| ISTMITO | 2020-10-09 16:00:49+00:00 | 0 | S2 | 10 |
| ISTMITO | 2020-11-08 16:00:47+00:00 | 0 | S2 | 10 |
| ISTMITO | 2020-12-03 16:00:44+00:00 | 0 | S2 | 10 |
| ISTMITO | 2020-12-05 15:09:03+00:00 | 0 | L7 | 30 |
| ISTMITO | 2020-12-18 16:00:41+00:00 | 0 | S2 | 10 |
| ISTMITO | 2021-01-06 15:06:43+00:00 | 0 | L7 | 30 |
| ISTMITO | 2021-01-07 16:00:45+00:00 | 0 | S2 | 10 |
| ISTMITO | 2021-01-27 16:00:45+00:00 | 0 | S2 | 10 |
| ISTMITO | 2021-02-06 16:00:45+00:00 | 0 | S2 | 10 |
| ISTMITO | 2021-02-26 16:00:44+00:00 | 0 | S2 | 10 |
| ISTMITO | 2021-03-03 16:00:45+00:00 | 0 | S2 | 10 |
| ISTMITO | 2021-03-11 15:01:34+00:00 | 0 | L7 | 30 |
| ISTMITO | 2021-03-18 16:00:45+00:00 | 0 | S2 | 10 |
| ISTMITO | 2021-06-15 14:53:59+00:00 | 0 | L7 | 30 |
| ISTMITO | 2021-08-02 14:49:54+00:00 | 0 | L7 | 30 |
| ISTMITO | 2021-09-03 14:46:42+00:00 | 0 | L7 | 30 |
| ISTMITO | 2021-09-19 14:45:41+00:00 | 0 | L7 | 30 |
| ISTMITO | 2021-09-19 16:00:48+00:00 | 0 | S2 | 10 |
| ISTMITO | 2021-09-29 16:00:50+00:00 | 0 | S2 | 10 |
| ISTMITO | 2021-10-05 14:44:16+00:00 | 0 | L7 | 30 |
| ISTMITO | 2021-10-21 14:42:27+00:00 | 0 | L7 | 30 |
| ISTMITO | 2022-01-12 16:00:41+00:00 | 0 | S2 | 10 |
| ISTMITO | 2022-01-25 14:33:14+00:00 | 0 | L7 | 30 |
| ISTMITO | 2022-01-27 16:00:46+00:00 | 0 | S2 | 10 |
| ISTMITO | 2022-02-01 16:00:40+00:00 | 0 | S2 | 10 |
| ISTMITO | 2022-03-14 14:28:28+00:00 | 0 | L7 | 30 |
| ISTMITO | 2022-05-12 16:00:44+00:00 | 0.12297844 | S2 | 10 |
| ISTMITO | 2022-05-22 16:00:46+00:00 | 0 | S2 | 10 |
| ISTMITO | 2022-06-06 16:00:53+00:00 | 0 | S2 | 10 |
| ISTMITO | 2022-09-09 16:00:47+00:00 | 0 | S2 | 10 |
| ISTMITO | 2022-10-24 16:00:48+00:00 | 0.06738544 | S2 | 10 |
| ISTMITO | 2022-10-29 16:00:44+00:00 | 0 | S2 | 10 |
| ISTMITO | 2022-12-08 16:00:42+00:00 | 0 | S2 | 10 |
| ISTMITO | 2022-12-23 16:00:43+00:00 | 0 | S2 | 10 |
| ISTMITO | 2022-12-28 16:00:45+00:00 | 0 | S2 | 10 |
| ISTMITO | 2023-02-01 16:00:44+00:00 | 0 | S2 | 10 |
| ISTMITO | 2023-02-11 16:00:44+00:00 | 0 | S2 | 10 |
| ISTMITO | 2023-04-12 16:00:46+00:00 | 0 | S2 | 10 |
| ISTMITO | 2023-04-17 16:00:47+00:00 | 0.0791779 | S2 | 10 |
| ISTMITO | 2023-04-27 16:00:47+00:00 | 0.00516622 | S2 | 10 |
| ISTMITO | 2023-05-12 16:00:45+00:00 | 0 | S2 | 10 |
| ISTMITO | 2023-05-17 16:00:50+00:00 | 0 | S2 | 10 |
| ISTMITO | 2023-05-27 16:00:50+00:00 | 0 | S2 | 10 |
| ISTMITO | 2023-06-11 16:00:49+00:00 | 0 | S2 | 10 |
| ISTMITO | 2023-06-12 13:37:30+00:00 | 0 | L7 | 30 |
| ISTMITO | 2023-07-09 13:37:32+00:00 | 0 | L7 | 30 |
| ISTMITO | 2023-08-25 16:00:53+00:00 | 0 | S2 | 10 |
| ISTMITO | 2023-08-30 16:00:51+00:00 | 0 | S2 | 10 |
| ISTMITO | 2023-10-09 16:00:45+00:00 | 0 | S2 | 10 |
| ISTMITO | 2023-10-14 16:00:48+00:00 | 0 | S2 | 10 |
| ISTMITO | 2023-11-13 16:00:46+00:00 | 0 | S2 | 10 |
| ISTMITO | 2023-12-03 16:00:42+00:00 | 0 | S2 | 10 |
| WIZARD | 2016-03-19 15:57:10+00:00 | 0.2044108 | S2 | 10 |
| WIZARD | 2016-04-14 15:50:53+00:00 | 0 | L7 | 30 |
| WIZARD | 2016-07-19 15:50:48+00:00 | 0.27461904 | L7 | 30 |
| WIZARD | 2016-08-04 15:51:15+00:00 | 0 | L7 | 30 |
| WIZARD | 2016-09-21 15:51:22+00:00 | 0 | L7 | 30 |
| WIZARD | 2016-11-04 15:55:23+00:00 | 0 | S2 | 10 |
| WIZARD | 2016-11-08 15:50:50+00:00 | 0 | L7 | 30 |
| WIZARD | 2017-01-11 15:50:25+00:00 | 0 | L7 | 30 |
| WIZARD | 2017-01-23 15:55:18+00:00 | 0.0055135 | S2 | 10 |
| WIZARD | 2017-04-13 15:57:55+00:00 | 0 | S2 | 10 |
| WIZARD | 2017-05-19 15:50:44+00:00 | 0 | L7 | 30 |
| WIZARD | 2017-05-23 15:58:50+00:00 | 0 | S2 | 10 |
| WIZARD | 2017-06-04 15:50:48+00:00 | 0.28098897 | L7 | 30 |
| WIZARD | 2017-07-17 15:55:25+00:00 | 0.00038402 | S2 | 10 |
| WIZARD | 2017-08-31 15:59:09+00:00 | 0.06067588 | S2 | 10 |
| WIZARD | 2017-09-20 15:55:21+00:00 | 0.46938776 | S2 | 10 |
| WIZARD | 2017-11-11 15:50:50+00:00 | 0 | L7 | 30 |
| WIZARD | 2017-12-24 15:55:13+00:00 | 0 | S2 | 10 |
| WIZARD | 2017-12-29 15:50:26+00:00 | 0.0163688 | L7 | 30 |
| WIZARD | 2018-01-13 16:00:02+00:00 | 0.29731731 | S2 | 10 |
| WIZARD | 2018-02-12 15:57:10+00:00 | 0 | S2 | 10 |
| WIZARD | 2018-03-03 15:49:34+00:00 | 0 | L7 | 30 |
| WIZARD | 2018-03-04 15:56:09+00:00 | 0 | S2 | 10 |
| WIZARD | 2018-03-19 15:49:22+00:00 | 0 | L7 | 30 |
| WIZARD | 2018-03-19 15:55:22+00:00 | 0.00290761 | S2 | 10 |
| WIZARD | 2018-03-29 15:55:24+00:00 | 0 | S2 | 10 |
| WIZARD | 2018-04-08 15:55:57+00:00 | 0 | S2 | 10 |
| WIZARD | 2018-05-06 15:48:59+00:00 | 0.14407129 | L7 | 30 |
| WIZARD | 2018-05-18 15:57:58+00:00 | 0 | S2 | 10 |
| WIZARD | 2018-05-22 15:48:20+00:00 | 0.03667938 | L7 | 30 |
| WIZARD | 2018-05-23 15:56:34+00:00 | 0 | S2 | 10 |
| WIZARD | 2018-06-12 15:55:23+00:00 | 0 | S2 | 10 |
| WIZARD | 2018-08-16 15:55:24+00:00 | 0 | S2 | 10 |
| WIZARD | 2018-09-10 15:55:16+00:00 | 0 | S2 | 10 |
| WIZARD | 2018-09-25 15:55:50+00:00 | 0 | S2 | 10 |
| WIZARD | 2018-09-27 15:45:51+00:00 | 0 | L7 | 30 |
| WIZARD | 2018-10-10 15:56:19+00:00 | 0 | S2 | 10 |
| WIZARD | 2018-10-15 15:55:22+00:00 | 0.19541365 | S2 | 10 |
| WIZARD | 2018-11-04 15:55:21+00:00 | 0 | S2 | 10 |
| WIZARD | 2018-11-09 16:00:43+00:00 | 0.01280996 | S2 | 10 |
| WIZARD | 2018-11-24 16:00:38+00:00 | 0 | S2 | 10 |
| WIZARD | 2018-12-14 16:00:37+00:00 | 0.0696456 | S2 | 10 |
| WIZARD | 2018-12-19 16:00:40+00:00 | 0 | S2 | 10 |
| WIZARD | 2019-01-01 15:43:26+00:00 | 0 | L7 | 30 |
| WIZARD | 2019-01-13 16:00:41+00:00 | 0 | S2 | 10 |
| WIZARD | 2019-01-18 16:00:45+00:00 | 0 | S2 | 10 |
| WIZARD | 2019-02-12 16:00:42+00:00 | 0 | S2 | 10 |
| WIZARD | 2019-02-18 15:41:57+00:00 | 0.06611433 | L7 | 30 |
| WIZARD | 2019-03-09 16:00:43+00:00 | 0 | S2 | 10 |
| WIZARD | 2019-04-03 16:00:46+00:00 | 0 | S2 | 10 |
| WIZARD | 2019-04-08 16:00:49+00:00 | 0.03895106 | S2 | 10 |
| WIZARD | 2019-05-13 16:00:49+00:00 | 0.04495831 | S2 | 10 |
| WIZARD | 2019-05-18 16:00:54+00:00 | 0.24094799 | S2 | 10 |
| WIZARD | 2019-05-23 16:00:49+00:00 | 0 | S2 | 10 |
| WIZARD | 2019-06-02 16:00:48+00:00 | 0 | S2 | 10 |
| WIZARD | 2019-06-07 16:00:53+00:00 | 0 | S2 | 10 |
| WIZARD | 2019-07-12 15:37:12+00:00 | 0.08455608 | L7 | 30 |
| WIZARD | 2019-07-17 16:00:54+00:00 | 0 | S2 | 10 |
| WIZARD | 2019-08-31 16:00:46+00:00 | 0 | S2 | 10 |
| WIZARD | 2019-09-20 16:00:45+00:00 | 0.00175554 | S2 | 10 |
| WIZARD | 2019-09-25 16:00:45+00:00 | 0 | S2 | 10 |
| WIZARD | 2019-09-30 15:33:26+00:00 | 0 | L7 | 30 |
| WIZARD | 2019-11-01 15:32:28+00:00 | 0.35059159 | L7 | 30 |
| WIZARD | 2019-11-04 16:00:46+00:00 | 0 | S2 | 10 |
| WIZARD | 2019-12-03 15:30:34+00:00 | 0.27018176 | L7 | 30 |
| WIZARD | 2020-02-07 16:00:37+00:00 | 0 | S2 | 10 |
| WIZARD | 2020-02-21 15:26:54+00:00 | 0.16339211 | L7 | 30 |
| WIZARD | 2020-02-22 16:00:42+00:00 | 0 | S2 | 10 |
| WIZARD | 2020-03-03 16:00:43+00:00 | 0 | S2 | 10 |
| WIZARD | 2020-03-08 15:25:39+00:00 | 0 | L7 | 30 |
| WIZARD | 2020-03-08 16:00:41+00:00 | 0 | S2 | 10 |
| WIZARD | 2020-03-13 16:00:43+00:00 | 0 | S2 | 10 |
| WIZARD | 2020-03-18 16:00:42+00:00 | 0 | S2 | 10 |
| WIZARD | 2020-04-17 16:00:46+00:00 | 0 | S2 | 10 |
| WIZARD | 2020-04-22 16:00:40+00:00 | 0.03214834 | S2 | 10 |
| WIZARD | 2020-05-12 16:00:44+00:00 | 0.04641211 | S2 | 10 |
| WIZARD | 2020-07-14 15:18:08+00:00 | 0 | L7 | 30 |
| WIZARD | 2020-08-31 15:15:30+00:00 | 0 | L7 | 30 |
| WIZARD | 2020-09-19 16:00:47+00:00 | 0 | S2 | 10 |
| WIZARD | 2020-10-02 15:13:00+00:00 | 0.00433876 | L7 | 30 |
| WIZARD | 2020-10-09 16:00:49+00:00 | 0.0057878 | S2 | 10 |
| WIZARD | 2020-11-08 16:00:47+00:00 | 0 | S2 | 10 |
| WIZARD | 2020-11-23 16:00:47+00:00 | 0 | S2 | 10 |
| WIZARD | 2020-12-18 16:00:41+00:00 | 0.01837832 | S2 | 10 |
| WIZARD | 2021-01-06 15:06:20+00:00 | 0 | L7 | 30 |
| WIZARD | 2021-01-17 16:00:45+00:00 | 0 | S2 | 10 |
| WIZARD | 2021-01-27 16:00:45+00:00 | 0 | S2 | 10 |
| WIZARD | 2021-02-06 16:00:45+00:00 | 0.00131666 | S2 | 10 |
| WIZARD | 2021-02-21 16:00:45+00:00 | 0 | S2 | 10 |
| WIZARD | 2021-03-03 16:00:45+00:00 | 0 | S2 | 10 |
| WIZARD | 2021-07-16 16:00:47+00:00 | 0 | S2 | 10 |
| WIZARD | 2021-09-03 14:47:06+00:00 | 0 | L7 | 30 |
| WIZARD | 2021-09-19 14:45:41+00:00 | 0 | L7 | 30 |
| WIZARD | 2021-09-29 16:00:50+00:00 | 0.06152622 | S2 | 10 |
| WIZARD | 2021-10-05 14:43:52+00:00 | 0 | L7 | 30 |
| WIZARD | 2021-10-21 14:42:27+00:00 | 0 | L7 | 30 |
| WIZARD | 2021-12-03 16:00:41+00:00 | 0 | S2 | 10 |
| WIZARD | 2022-01-09 14:34:46+00:00 | 0.06424628 | L7 | 30 |
| WIZARD | 2022-01-12 16:00:41+00:00 | 0 | S2 | 10 |
| WIZARD | 2022-01-25 14:33:14+00:00 | 0 | L7 | 30 |
| WIZARD | 2022-02-01 16:00:40+00:00 | 0 | S2 | 10 |
| WIZARD | 2022-02-06 16:00:45+00:00 | 0 | S2 | 10 |
| WIZARD | 2022-02-16 16:00:46+00:00 | 0 | S2 | 10 |
| WIZARD | 2022-02-21 16:00:40+00:00 | 0 | S2 | 10 |
| WIZARD | 2022-03-08 16:00:49+00:00 | 0 | S2 | 10 |
| WIZARD | 2022-03-14 14:28:28+00:00 | 0 | L7 | 30 |
| WIZARD | 2022-04-07 16:00:46+00:00 | 0.0322032 | S2 | 10 |
| WIZARD | 2022-05-12 16:00:44+00:00 | 0 | S2 | 10 |
| WIZARD | 2022-05-22 16:00:46+00:00 | 0.03969168 | S2 | 10 |
| WIZARD | 2022-06-06 16:00:53+00:00 | 0.04682357 | S2 | 10 |
| WIZARD | 2022-07-06 16:00:58+00:00 | 0.00065833 | S2 | 10 |
| WIZARD | 2022-07-16 16:00:58+00:00 | 0 | S2 | 10 |
| WIZARD | 2022-08-31 14:06:57+00:00 | 0.01111729 | L7 | 30 |
| WIZARD | 2022-09-05 14:12:17+00:00 | 0.05200819 | L7 | 30 |
| WIZARD | 2022-09-09 16:00:47+00:00 | 0.04158438 | S2 | 10 |
| WIZARD | 2022-10-04 16:00:52+00:00 | 0 | S2 | 10 |
| WIZARD | 2022-10-24 16:00:48+00:00 | 0 | S2 | 10 |
| WIZARD | 2022-10-29 16:00:44+00:00 | 0 | S2 | 10 |
| WIZARD | 2022-12-08 16:00:42+00:00 | 0 | S2 | 10 |
| WIZARD | 2022-12-23 16:00:43+00:00 | 0 | S2 | 10 |
| WIZARD | 2022-12-28 16:00:45+00:00 | 0 | S2 | 10 |
| WIZARD | 2023-01-07 16:00:43+00:00 | 0.03280667 | S2 | 10 |
| WIZARD | 2023-02-01 16:00:44+00:00 | 0 | S2 | 10 |
| WIZARD | 2023-02-11 16:00:44+00:00 | 0 | S2 | 10 |
| WIZARD | 2023-02-21 16:00:43+00:00 | 0.14897411 | S2 | 10 |
| WIZARD | 2023-04-12 16:00:46+00:00 | 0 | S2 | 10 |
| WIZARD | 2023-04-17 16:00:47+00:00 | 0.17599298 | S2 | 10 |
| WIZARD | 2023-04-22 16:00:44+00:00 | 0 | S2 | 10 |
| WIZARD | 2023-04-27 16:00:47+00:00 | 0 | S2 | 10 |
| WIZARD | 2023-05-12 16:00:45+00:00 | 0 | S2 | 10 |
| WIZARD | 2023-05-17 16:00:50+00:00 | 0.00817424 | S2 | 10 |
| WIZARD | 2023-05-27 16:00:50+00:00 | 0 | S2 | 10 |
| WIZARD | 2023-06-11 16:00:49+00:00 | 0 | S2 | 10 |
| WIZARD | 2023-06-12 13:37:30+00:00 | 0 | L7 | 30 |
| WIZARD | 2023-07-06 16:00:51+00:00 | 0 | S2 | 10 |
| WIZARD | 2023-07-09 13:37:32+00:00 | 0 | L7 | 30 |
| WIZARD | 2023-07-21 16:00:50+00:00 | 0 | S2 | 10 |
| WIZARD | 2023-08-25 16:00:53+00:00 | 0.01017665 | S2 | 10 |
| WIZARD | 2023-08-30 16:00:51+00:00 | 0 | S2 | 10 |
| WIZARD | 2023-09-29 16:00:48+00:00 | 0.05392802 | S2 | 10 |
| WIZARD | 2023-10-09 16:00:45+00:00 | 0 | S2 | 10 |
| WIZARD | 2023-10-14 16:00:48+00:00 | 0 | S2 | 10 |
| WIZARD | 2023-10-29 16:00:45+00:00 | 0 | S2 | 10 |
| WIZARD | 2023-11-13 16:00:46+00:00 | 0 | S2 | 10 |
| WIZARD | 2023-11-16 13:21:29+00:00 | 0 | L7 | 30 |
| WIZARD | 2023-12-03 16:00:42+00:00 | 0 | S2 | 10 |
References
- Bigio, A.G. Cities and Climate Change. Building Safer Cities: The Future of Disaster Risk; World Bank: Washington DC, USA, 2003; pp. 91–99. [Google Scholar]
- Aerts, J.; Botzen, W.; Bowman, M.; Dircke, P.; Ward, P. Climate Adaptation and Flood Risk in Coastal Cities; Routledge: London, UK, 2013. [Google Scholar]
- Oppenheimer, M.; Glavovic, B.C.; Hinkel, J.; van de Wal, R.; Magnan, A.K.; Abd-Elgawad, A.; Cai, R.; Cifuentes-Jara, M.; DeConto, R.M.; Ghosh, T.; et al. Sea Level Rise and Implications for Low-Lying Islands, Coasts and Communities. In IPCC Special Report on the Ocean and Cryosphere in a Changing Climate; Pörtner, H.-O., Roberts, D.C., Masson-Delmotte, V., Zhai, P., Tignor, M., Poloczanska, E., Mintenbeck, K., Alegría, A., Nicolai, M., Okem, A., et al., Eds.; Intergovernmental Panel on Climate Change: Geneva, Switzerland, 2019. [Google Scholar]
- Pal, I.; Kumar, A.; Mukhopadhyay, A. Risks to coastal critical infrastructure from climate change. Annu. Rev. Environ. Resour. 2023, 48, 681–712. [Google Scholar] [CrossRef]
- Alder, J. Have tropical marine protected areas worked? An initial analysis of their success. Coast. Manag. 1996, 24, 97–114. [Google Scholar] [CrossRef]
- Griggs, G.; Reguero, B.G. Coastal Adaptation to Climate Change and Sea-Level Rise. Water 2021, 13, 2151. [Google Scholar] [CrossRef]
- Silva, R.; Martínez, M.L.; Hesp, P.A.; Catalan, P.; Osorio, A.F.; Martell, R.; Fossati, M.; Miot da Silva, G.; Mariño-Tapia, I.; Pereira, P.; et al. Present and Future Challenges of Coastal Erosion in Latin America. J. Coast. Res. 2014, 71, 1–16. [Google Scholar] [CrossRef]
- Reguero, B.G.; Méndez, F.J.; and Losada, I.J. Variability of multivariate wave climate in Latin America and the Caribbean. Glob. Planet. Change 2013, 100, 70–84. [Google Scholar] [CrossRef]
- Vallarino Castillo, R.; Negro Valdecantos, V.; del Campo, J.M. Understanding the impact of hydrodynamics on coastal erosion in Latin America: A systematic review. Front. Environ. Sci. 2023, 11, 1267402. [Google Scholar] [CrossRef]
- Lizano, O.G. Beach erosion of Costa Rica, including Coco island. Intersedes 2013, 14, 06–27. [Google Scholar]
- Barrantes-Castillo, G.; Arozarena-Llopis, I.; Sandoval-Murillo, L.F.; Valverde-Calderón, J.F. Critical beaches due to coastal erosion in the Caribbean south of Costa Rica during the period 2005–2016. Rev. Geogr. De Am. Cent. 2020, 64, 75–102. [Google Scholar] [CrossRef]
- Fernandez, G.B.; Bulhões, E.; da Rocha, T.B. Impacts of severe storm occurred in April 2010 along Rio de Janeiro coast, Brazil. J. Coast. Res. 2011, 64, 1850–1854. [Google Scholar]
- Speranski, N.; Calliari, L. Bathymetric lenses and localized coastal erosion in southern Brazil. J. Coast. Res. 2001, SI34, 209–215. [Google Scholar]
- Dolique, F.; Jeanson, M.; Besson, J. A monitoring network for assessing the impact of extreme marine meteorological events on tropical beaches. J. Coast. Res. 2007, 50, 77–81. [Google Scholar] [CrossRef]
- Harris, L.R.; Defeo, O. Sandy shore ecosystem services, ecological infrastructure, and bundles: New insights and perspectives. Ecosyst. Serv. 2022, 57, 101477. [Google Scholar] [CrossRef]
- Barbier, E.B.; Hacker, S.D.; Kennedy, C.; Koch, E.W.; Stier, A.C.; Silliman, B.R. The value of estuarine and coastal ecosystem services. Ecol. Monogr. 2011, 81, 169–193. [Google Scholar] [CrossRef]
- Gallop, S.L.; Bosserelle, C.; Eliot, I.; Pattiaratchi, C.B. The influence of coastal reefs on spatial variability in seasonal sand fluxes. Mar. Geol. 2013, 344, 132–143. [Google Scholar] [CrossRef]
- Quataert, E.; Storlazzi, C.; Van Rooijen, A.; Cheriton, O.; Van Dongeren, A. The influence of coral reefs and climate change on wave-driven flooding of tropical coastlines. Geophys. Res. Lett. 2015, 42, 6407–6415. [Google Scholar] [CrossRef]
- Guannel, G.; Arkema, K.; Ruggiero, P.; Verutes, G. The power of three: Coral reefs, seagrasses and mangroves protect coastal regions and increase their resilience. PLoS ONE 2016, 11, e0158094. [Google Scholar] [CrossRef]
- de Almeida, L.R.; Ávila-Mosqueda, S.V.; Mendoza, E.; van Tussenbroek, B.I.; Silva, R. Beyond the Beach: Multi-Parameter Interpretation of Shore Deterioration in a Caribbean Reef System. Diversity 2024, 16, 266. [Google Scholar] [CrossRef]
- Morales-Márquez, V.; Cáceres-Euse, A.; Hernández-Carrasco, I.; Molcard, A.; Orfila, A. Extreme waves in the Caribbean Sea: Spatial regionalization and long-term analysis. Front. Mar. Sci. 2023, 10, 1294189. [Google Scholar] [CrossRef]
- Morang, A.; Larson, R.; Gorman, L. Monitoring the coastal environment; part I: Waves and currents. J. Coast. Res. 1997, 13, 111–133. [Google Scholar]
- Tendero-Peiró, C.; Asensio-Montesinos, F.; Anfuso, G.; Corbí, H. The Coastal Scenery of São Miguel Island, Azores Archipelago: Implications for Coastal Management. J. Mar. Sci. Eng. 2024, 12, 707. [Google Scholar] [CrossRef]
- Lyman, T.P.; Elsmore, K.; Gaylord, B.; Byrnes, J.E.; Miller, L.P. Open Wave Height Logger: An open source pressure sensor data logger for wave measurement. Limnol. Oceanogr. Methods 2020, 18, 335–345. [Google Scholar] [CrossRef]
- Temple, N.A.; Webb, B.M.; Sparks, E.L.; Linhoss, A.C. Low-Cost Pressure Gauges for Measuring Water Waves. J. Coast. Res. 2020, 36, 661–667. [Google Scholar] [CrossRef]
- Godfrey, S.; Cooper, J.R.; Plater, A.J. Roving multiple camera array with Structure-from-Motion for coastal monitoring. J. Mar. Sci. Eng. 2023, 11, 591. [Google Scholar] [CrossRef]
- Knight, P.J.; Bird, C.O.; Sinclair, A.; Plater, A.J. A low-cost GNSS buoy platform for measuring coastal sea levels. Ocean. Eng. 2020, 203, 107198. [Google Scholar] [CrossRef]
- Knight, P.J.; Bird, C.O.; Sinclair, A.; Higham, J.; Plater, A.J. Beach deployment of a low-cost GNSS buoy for determining sea-level and wave characteristics. Geosciences 2021, 11, 494. [Google Scholar] [CrossRef]
- Raghukumar, K.; Chang, G.; Spada, F.; Jones, C.; Janssen, T.; Gans, A. Performance characteristics of “Spotter,” a newly developed real-time wave measurement buoy. J. Atmos. Ocean. Technol. 2019, 36, 1127–1141. [Google Scholar] [CrossRef]
- Lancaster, O.; Cossu, R.; Boulay, S.; Hunter, S.; Baldock, T.E. Comparative wave measurements at a wave energy site with a recently developed low-cost wave buoy (Spotter), ADCP, and pressure loggers. J. Atmos. Ocean. Technol. 2021, 38, 1019–1033. [Google Scholar] [CrossRef]
- Zopf, D.O.; Creech, H.C.; Quinn, W.H. The wavemeter: A land-based system for measuring nearshore ocean waves. MTS J. 1976, 10. Available online: https://ir.library.oregonstate.edu/concern/technical_reports/jm214w120 (accessed on 7 June 2025).
- Ravdas, M.; Zacharioudaki, A.; Korres, G. Implementation and validation of a new operational wave forecasting system of the Mediterranean Monitoring and Forecasting Centre in the framework of the Copernicus Marine Environment Monitoring Service. Nat. Hazards Earth Syst. Sci. 2018, 18, 2675–2695. [Google Scholar] [CrossRef]
- Brus, S.R.; Wolfram, P.J.; Van Roekel, L.P.; Meixner, J.D. Unstructured global to coastal wave modeling for the Energy Exascale Earth System Model using WAVEWATCH III version 6.07. Geosci. Model Dev. 2021, 14, 2917–2938. [Google Scholar] [CrossRef]
- Lippmann, T.C.; Holman, R.A. Phase speed and angle of breaking waves measured with video techniques. In Coastal Sediments; ASCE: Reston, VA, USA, 1991; pp. 542–556. [Google Scholar]
- Bos, C. Wave Characteristics Derived from Video. Master’s Thesis, Delft University of Technology, Delft, The Netherlands, 2006. [Google Scholar]
- Thomson, J.; Jessup, A.T. A Fourier-based method for the distribution of breaking crests from video observations. J. Atmos. Ocean. Technol. 2009, 26, 1663–1671. [Google Scholar] [CrossRef]
- Adrian, R.J.; Westerweel, J. Particle Image Velocimetry; Cambridge University Press: Cambridge, UK, 2011. [Google Scholar]
- Brevis, W.; Niño, Y.; Jirka, G.H. Integrating cross-correlation and relaxation algorithms for particle tracking velocimetry. Exp. Fluids 2011, 50, 135–147. [Google Scholar] [CrossRef]
- Umeyama, M. Theoretical considerations, flow visualization and pressure measurements for rear-end collisions of two unequal solitary waves. J. Math. Fluid Mech. 2019, 21, 1–23. [Google Scholar] [CrossRef]
- Abu Rowin, W.; Kevin, X.; Bhirawa, T.; Lee, W.J.; Philip, J.; Marusic, I.; Monty, J. High-resolution PIV measurement over wind-generated waves. Exp. Fluids 2024, 65, 77. [Google Scholar] [CrossRef]
- Dérian, P.; Almar, R. Wavelet-based optical flow estimation of instant surface currents from shore-based and UAV videos. IEEE Trans. Geosci. Remote Sens. 2017, 55, 5790–5797. [Google Scholar] [CrossRef]
- Oertel, M.; Suefke, F. Two-dimensional dam-break wave analysis: Particle image velocimetry versus optical flow. J. Hydraul. Res. 2020, 58, 326–334. [Google Scholar] [CrossRef]
- Li, J.; Kong, X.; Yang, Y.; Yang, Z.; Hu, J. Optical flow based measurement of flow field in wave-structure interaction. Ocean. Eng. 2022, 263, 112336. [Google Scholar] [CrossRef]
- Vos, K.; Splinter, K.D.; Harley, M.D.; Simmons, J.A.; Turner, I.L. CoastSat: A Google Earth Engine-Enabled Python Toolkit to Extract Shorelines from Publicly Available Satellite Imagery. Environ. Model. Softw. 2019, 122, 104528. [Google Scholar] [CrossRef]
- ATP. Plan Maestro de Turismo Sostenible; Autoridad de Tourismo de Panama: Panama City, Panama, 2020; Available online: https://www.atp.gob.pa/Plan_Maestro_de_Turismo_Sostenible_2020-2025.pdf (accessed on 8 May 2023).
- Klytchnikova, I.; Dorosh, P. Tourism sector in Panama: Regional economic impacts and the potential to benefit the poor. Nat. Resour. Forum. 2013, 37, 70–79. [Google Scholar] [CrossRef]
- Pleasant, T.; Spalding, A. Development and dependency in the periphery: From bananas to tourism in Bocas del Toro, Panama. World Dev. Perspect. 2021, 24, 10. [Google Scholar] [CrossRef]
- NBDC (National Data Buoy Center). Station 42057—Western Caribbean Buoy. 2025. Available online: https://www.ndbc.noaa.gov/station_page.php?station=42057 (accessed on 19 March 2025).
- Fullmer, W.D.; Higham, J.E.; LaMarche, C.Q.; Issangya, A.; Cocco, R.; Hrenya, C.M. Comparison of velocimetry methods for horizontal air jets in a semicircular fluidized bed of Geldart Group D particles. Powder Technol. 2020, 359, 323–330. [Google Scholar] [CrossRef]
- Higham, J.E.; Shahnam, M.; Vaidheeswaran, A. Anomalous diffusion in a bench-scale pulsed fluidized bed. Phys. Rev. E 2021, 103, 043103. [Google Scholar] [CrossRef]
- Lucas, B.D.; Kanade, T. An iterative image registration technique with an application to stereo vision. In Proceedings of the IJCAI’81: 7th International Joint Conference on Artificial Intelligence, Vancouver, BC, Canada, August 1981; Volume 2, pp. 674–679. [Google Scholar]
- Welch, P. The use of fast Fourier transform for the estimation of power spectra: A method based on time averaging over short, modified periodograms. IEEE Trans. Audio Electroacoust. 1967, 15, 70–73. [Google Scholar] [CrossRef]
- The WAVEWATCH III Development Group (WW3DG). User Manual and System Documentation of WAVEWATCH III; Version 6.07. Tech. Note 333; NOAA/NWS/NCEP/MMAB: College Park, MD, USA, 2019; 465p. [Google Scholar]
- Krumbein, W.C. Size frequency distributions of sediments and the normal phi curve. J. Sediment. Res. 1938, 8, 84–90. [Google Scholar] [CrossRef]
- Folk, R.L.; Ward, W.C. Brazos River bar [Texas]; a study in the significance of grain size parameters. J. Sediment. Res. 1957, 27, 3–26. [Google Scholar] [CrossRef]
- Whitcraft, A.K.; Vermote, E.F.; Becker-Reshef, I.; Justice, C.O. Cloud cover throughout the agricultural growing season: Impacts on passive optical earth observations. Remote Sens. Environ. 2015, 156, 438–447. [Google Scholar] [CrossRef]
- Permanent Service for Mean Sea Level (PSMSL). Tide Gauge Data. 2024. Available online: https://psmsl.org/data/obtaining/stations/2191.php (accessed on 14 November 2024).
- Barnett, V. Outliers in Statistical Data; John Wiley & Sons: Hoboken, NJ, USA, 1994; Volume 2, pp. 705–708. [Google Scholar]
- McAllister, E.; Payo, A.; Novellino, A.; Dolphin, T.; Medina-Lopez, E. Multispectral satellite imagery and machine learning for the extraction of shoreline indicators. Coast. Eng. 2022, 174, 104102. [Google Scholar] [CrossRef]
- Higham, J.E.; Shahnam, M.; Vaidheeswaran, A. Using a proper orthogonal decomposition to elucidate features in granular flows. Granul. Matter 2020, 22, 86. [Google Scholar] [CrossRef]
- Higham, J.E.; Isaac, O.S.; Rigby, S.E. Optical flow tracking velocimetry of near-field explosions. Meas. Sci. Technol. 2022, 33, 047001. [Google Scholar] [CrossRef]
- Weber, J.; Higham, J.E.; Musser, J.; Fullmer, W.D. Critical analysis of velocimetry methods for particulate flows from synthetic data. Chem. Eng. J. 2021, 415, 129032. [Google Scholar] [CrossRef]
- Luijendijk, A.; Hagenaars, G.; Ranasinghe, R.; Baart, F.; Donchyts, G.; Aarninkhof, S. The State of the World’s Beaches. Sci. Rep. 2018, 8, 6641. [Google Scholar] [CrossRef] [PubMed]
- Pardo-Pascual, J.E.; Sánchez-García, E.; Almonacid-Caballer, J.; Palomar-Vázquez, J.M.; Priego De Los Santos, E.; Fernández-Sarría, A.; Balaguer-Beser, Á. Assessing the accuracy of automatically extracted shorelines on microtidal beaches from Landsat 7, Landsat 8 and Sentinel-2 imagery. Remote Sens. 2018, 10, 326. [Google Scholar] [CrossRef]
- Preston, J.; Hurst, M.D.; Mudd, S.M.; Goodwin, G.C.; Newton, A.J.; Dugmore, A.J. Sediment accumulation in embayments controlled by bathymetric slope and wave energy: Implications for beach formation and persistence. Earth Surf. Process. Landf. 2018, 43, 2421–2434. [Google Scholar] [CrossRef]
- Masselink, G.; Hughes, M.; Knight, J. Introduction to Coastal Processes and Geomorphology; Routledge: London, UK, 2014. [Google Scholar]
- Komar, P.D. Beach processes and erosion—An introduction. In Handbook of Coastal Processes and Erosion; CRC Press: Boca Raton, FL, USA, 2018; pp. 1–20. [Google Scholar]
- Shimozono, T. Long wave propagation and run-up in converging bays. J. Fluid Mech. 2016, 798, 457–484. [Google Scholar] [CrossRef]
- Vila-Concejo, A.; Gallop, S.L.; Largier, J.L. Sandy beaches in estuaries and bays. In Sandy Beach Morphodynamics; Elsevier: Amsterdam, The Netherlands, 2020; pp. 343–362. [Google Scholar]
- Kemp, P.H. The relationship between wave action and beach profile characteristics. Coast. Eng. Proc. 1960, 7, 14. [Google Scholar] [CrossRef]
- Nielsen, P. Coastal Bottom Boundary Layers and Sediment Transport; World Scientific: River Edge, NJ, USA, 1992. [Google Scholar]
- Wright, L.D.; Short, A.D. Morphodynamic variability of surf zones and beaches: A synthesis. Mar. Geol. 1984, 56, 93–118. [Google Scholar] [CrossRef]
- Kohsiek, L.H.M.; Hulsbergen, C.H.; Terwindt, J.H.J. Beach erosion along the west coast of Aruba, Netherlands Antilles. J. Coast. Res. 1987, 3, 37–53. [Google Scholar]
- Ortega, A.Y.; Díaz, L.J.O.; Cueto, J.E. Assessment and management of coastal erosion in the marine protected area of the Rosario Island archipelago (Colombian Caribbean). Ocean. Coast. Manag. 2023, 239, 106605. [Google Scholar] [CrossRef]


| Site Name | OFTV Wave Characteristics | Sediment Characteristics | Satellite | ||||||
|---|---|---|---|---|---|---|---|---|---|
| Wave Velocity Gradient | Wave Period (s) | Mean (mm) | Median (mm) | Sorting (Φ) | Skewness (Φ) | Kurtosis (Φ) | Avg RoC (m/y) | ||
 | Istmito | 6.6 ± 3.5 | 6.67 | 0.16 | 0.15 | 1.058 | 0.274 | 0.859 | 5.2 ± 5.8 |
 | Wizard | 4.8 ± 2.2 | 10.00 | 0.40 | 0.38 | 0.433 | 0.047 | 0.941 | 0.2 ± 7.8 |
 | Bluff | 4.5 ± 2.4 | 4.76 | 0.41 | 0.40 | 0.476 | −0.282 | 0.657 | 0.2 ± 8.3 |
 | Carenero | 3.6 ± 2.4 | 4.00 | 0.53 | 0.41 | 0.304 | −0.677 | 0.402 | 0.8 ± 4.5 |
Disclaimer/Publisher’s Note: The statements, opinions and data contained in all publications are solely those of the individual author(s) and contributor(s) and not of MDPI and/or the editor(s). MDPI and/or the editor(s) disclaim responsibility for any injury to people or property resulting from any ideas, methods, instructions or products referred to in the content. |
© 2025 by the authors. Licensee MDPI, Basel, Switzerland. This article is an open access article distributed under the terms and conditions of the Creative Commons Attribution (CC BY) license (https://creativecommons.org/licenses/by/4.0/).
Share and Cite
Murphy, J.; Higham, J.E.; Plater, A.J.; Clark, K.E.; Collin, R. Integration of Earth Observation and Field-Based Monitoring for Morphodynamic Characterisation of Tropical Beach Ecosystems. Environments 2025, 12, 205. https://doi.org/10.3390/environments12060205
Murphy J, Higham JE, Plater AJ, Clark KE, Collin R. Integration of Earth Observation and Field-Based Monitoring for Morphodynamic Characterisation of Tropical Beach Ecosystems. Environments. 2025; 12(6):205. https://doi.org/10.3390/environments12060205
Chicago/Turabian StyleMurphy, James, Jonathan E. Higham, Andrew J. Plater, Kasey E. Clark, and Rachel Collin. 2025. "Integration of Earth Observation and Field-Based Monitoring for Morphodynamic Characterisation of Tropical Beach Ecosystems" Environments 12, no. 6: 205. https://doi.org/10.3390/environments12060205
APA StyleMurphy, J., Higham, J. E., Plater, A. J., Clark, K. E., & Collin, R. (2025). Integration of Earth Observation and Field-Based Monitoring for Morphodynamic Characterisation of Tropical Beach Ecosystems. Environments, 12(6), 205. https://doi.org/10.3390/environments12060205