Article

Unveiling Heavy Metal Distribution in Different Agricultural Soils and Associated Health Risks Among Farming Communities of Bangladesh

1
Graduate School of Science and Engineering, Saitama University, 255 Shimo-Okubo, Sakura-ku, Saitama 338-8570, Japan
2
Department of Agricultural Extension, Khamarbari, Dhaka 1215, Bangladesh
3
Center for Environmental Science in Saitama, 914 Kamitanadare, Kazo 347-0115, Japan
*
Authors to whom correspondence should be addressed.
Environments 2025, 12(6), 198; https://doi.org/10.3390/environments12060198
Submission received: 17 April 2025 / Revised: 30 May 2025 / Accepted: 8 June 2025 / Published: 11 June 2025

Abstract

:
Heavy metal pollution is a growing public health concern owing to rising environmental pollution throughout the world. The situation is more vulnerable in Bangladesh; therefore, this study assessed contamination levels in different land use categories such as rural, local market, industrial, research, and coastal areas, as well as the related health risks for farmers in Bangladesh. A total of 45 soil samples were considered from three depths (0–5 cm, 5–10 cm, and 10–15 cm) across five different areas, with three replications per depth, following the monsoon season. Samples were prepared using a diacid mixture, and heavy metals (Cu, Ni, Mn, Cr, Zn, Pb) were investigated using Inductively Coupled Plasma Mass Spectrometry (ICP-MS). Health risks were evaluated using standard assessment models. The results showed that coastal agricultural soils had the highest heavy metal concentrations (except Pb), while rural areas had the lowest (except Cu and Ni), with no clear depth-based pattern. Two contamination sources were identified: component 1 (Cu, Ni, Mn, Cr, Zn) and component 2 (Pb, Zn), indicating mixed and anthropogenic sources, respectively. The Pollution Load Index (PLI) was highest in coastal areas and lowest in rural areas. The average daily intake of metals followed the order of inhalation > dermal > ingestion, with inhalation being the primary exposure route. The highest cumulative cancer risk (CCR) was observed in coastal agricultural soils (5.82 × 10⁻⁹), while rural soils had the lowest CCR (8.24 × 10⁻¹⁰), highlighting significant regional differences in health risks.

1. Introduction

Ensuring safe food production remains a global challenge due to environmental and agricultural factors that compromise both food quality and security [1]. Among these factors, soil pollution has gained prominence as a global issue, primarily driven by rapid industrialization, urbanization, inadequate waste management, and inconsiderate agricultural practices [2]. Agricultural systems are particularly vulnerable to soil contamination, which disrupts plant growth, reduces crop yields, and introduces risks to food safety [3,4]. Key pollutants such as microplastics (MPs), polycyclic aromatic hydrocarbons (PAHs), and heavy metals have been recognized as significant threats to soil health and agricultural productivity [5,6]. These pollutants have long-lasting impacts on both soil ecosystems and human health, making their detection and management crucial for maintaining agricultural sustainability.
Heavy metals such as Pb, Cr, and Hg are some of the most toxic and persistent pollutants in the environment [7,8]. These metals enter agricultural soils through various anthropogenic activities, including the use of chemical fertilizers, pesticides, and industrial runoff, as well as through irrigation with contaminated water [9,10]. After entering the soil, heavy metals can be taken up by plants—especially through their roots—and may accumulate in the consumable portions of crops. This bioaccumulation poses substantial health risks, as the considered metals can enter the food chain and affect human health, causing organ toxicity, developmental disorders, and cancer [11].
In Bangladesh, the issue of heavy metal contamination is particularly severe because of the widespread use of contaminated groundwater irrigation, chemical fertilizers and pesticides, and industrial pollution [12]. The presence of heavy metals in agricultural soils, especially in rice-growing areas, is a significant concern, as it directly affects food safety and public health [13]. Moreover, heavy metals such as Pb and Cd, which are commonly found in contaminated water, pose additional risks to agricultural productivity and human health [14]. Heavy metal contamination has far-reaching implications for food security, particularly in rural agricultural communities where the majority of the population depends on agriculture for their livelihood and food supply [15]. Studying soil contamination across rural, market, industrial, coastal, and research areas is crucial, as each represents different land uses and pollution sources. Rural areas face risks from agrochemical use, markets from waste mismanagement, and industrial zones from heavy metal discharge. Coastal areas are vulnerable to both land-based and marine pollution, while research areas serve as reference points for comparison. Together, these sites provide a comprehensive understanding of contamination patterns and associated health risks in diverse environments. While much research has been conducted sporadically on the contamination, there is a lack of comprehensive studies on heavy metal contamination across different land-use types and soil depths in Bangladesh. Therefore, this study aims to identify these research gaps by assessing the contamination levels of heavy metals in agricultural soils across different land-use categories in Bangladesh. By evaluating these pollutants at varying soil depths (0–5 cm, 5–10 cm, and 10–15 cm), this study will provide a clear picture of their distribution patterns, potential sources, and health risks.

2. Materials and Methods
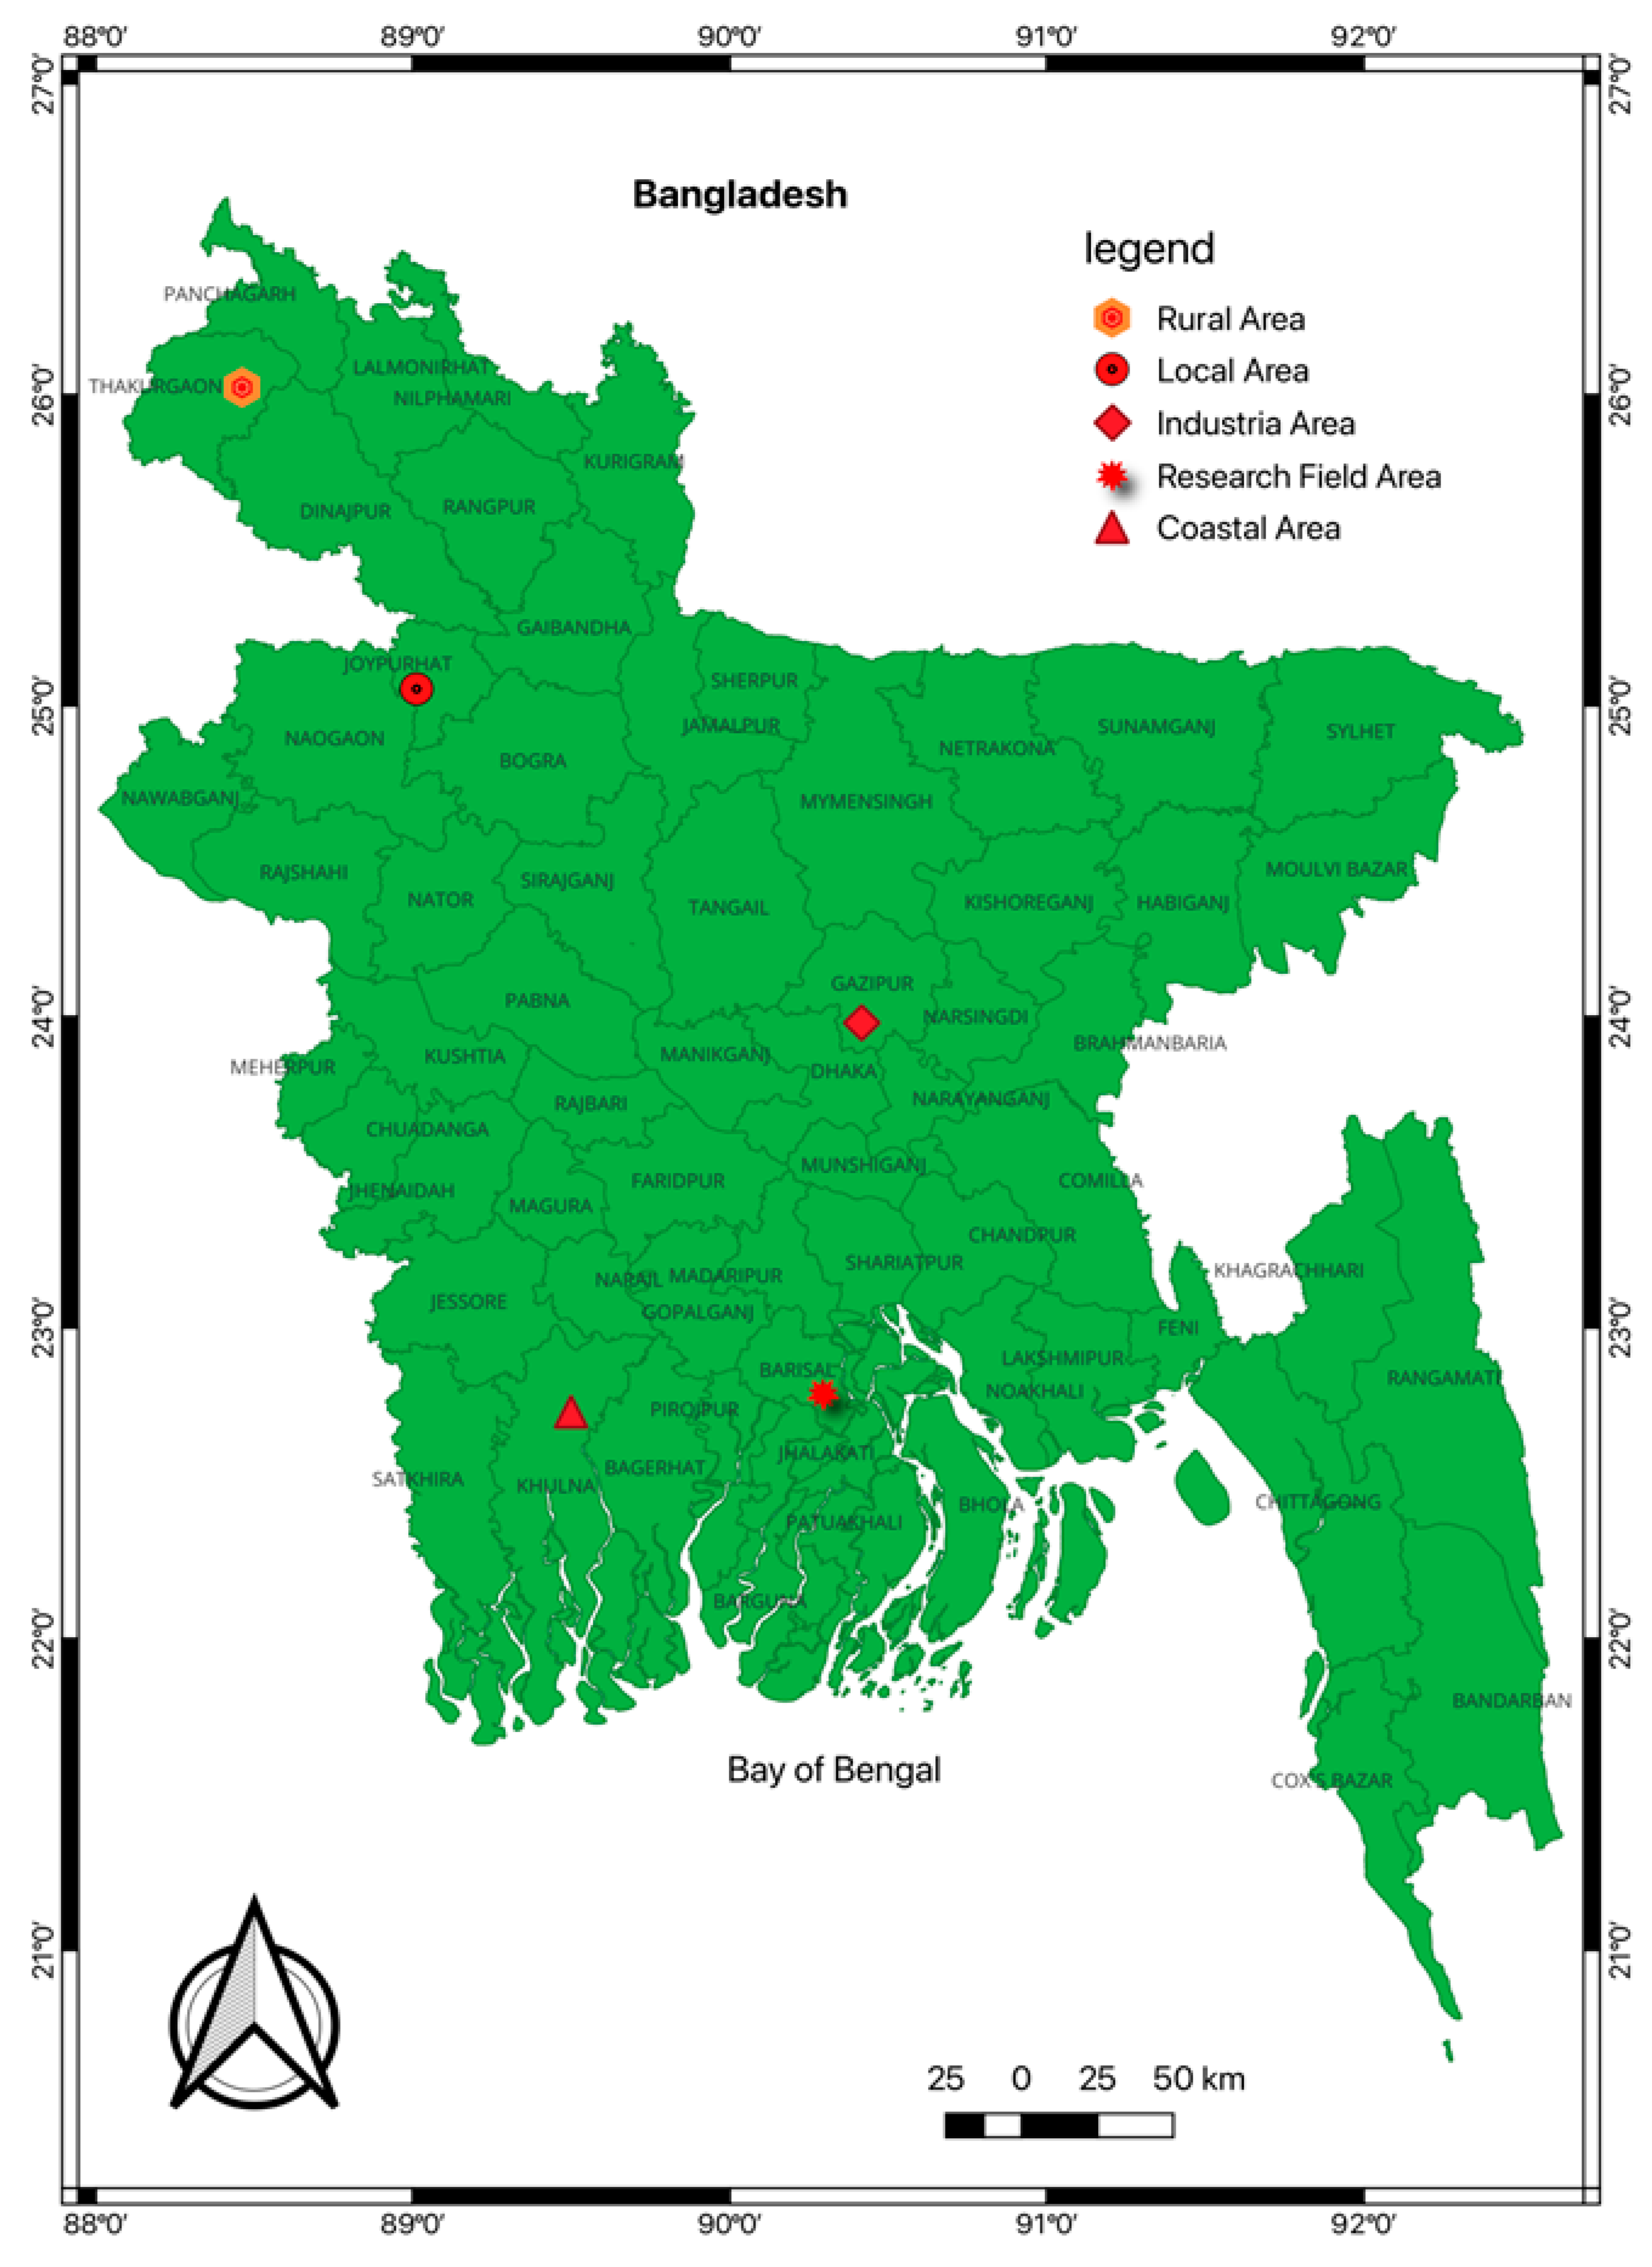
2.1. Sampling Sites

Soils were taken from five different types of agricultural fields (rural area, local market area, industrial area, coastal area, research area) in five different regions of Bangladesh, as mentioned in Figure 1. Vegetables were cultivated at the study sites, where farmers reported the use of NPK fertilizers in combination with organic manure and contact insecticides as part of standard agricultural practices. High-emission sources, such as industrial activities, were primarily confined to designated industrial zones. In contrast, the remaining sites were predominantly rural and the research field area, which was characterized by minimal point-source pollution. The five different agricultural fields were chosen based on the distinct agriculturally important characteristics mentioned in a previous article [16].

2.2. Preparation of Soil Sample

Soil samples were collected from five distinct sites using augar, with randomly selected five locations sampled within each site to create one representative composite sample per site. Each composite sample was further divided by soil depth (0–5 cm, 5–10 cm, and 10–15 cm), resulting in a total of fifteen samples for analysis. Sampling was conducted in the last week of August, following the monsoon season, to capture post-monsoon contamination levels. The soil sample was cleaned and dried. After drying, the soil sample was ground and sieved using a shaker (AS 200 digit Retsch AS200, Retsch GmbH, Haan, Germany). The sieved soil was preserved in aluminum foil and kept in a refrigerator for analysis.

2.3. Pretreatment of the Soil Sample

An amount of 50 mg of sieved soil with a particle size of less than 20 μm was placed in a beaker. Then, 20 mL of aqua regia solution (HCl: HNO3 having 3:1 ratio) was added to the soil. The mixture was heated on a hotplate (Zojirushi, EA-DD10-TA, Zojirushi Corporation, Osaka, Japan) at 150 °C for approximately 90 min or until brown fumes stopped emitting. After cooling, 20 mL of a 2% nitric acid solution was added to the cooled suspension. The resulting solution was then filtered using Whatman filter paper (5C, 110 mm dia, 11 μm pore size, Cytiva, Buckinghamshire, United Kingdom) to separate any solid particles. The extract was then stored in a sample holder for heavy metal analysis.

2.4. Determination of Heavy Metals

The heavy metal concentrations in the prepared solution were subsequently investigated using ICP-MS. Before determination of the heavy metal, the final solution was diluted tenfold with deionized water to ensure that the analyte concentrations fell within the optimal detection range of the instrument. The actual concentration of heavy metals (mg/kg) was measured using the following calculation.
H e a v y   m e t a l   ( m g / k g ) = F i n a l   v o l u m e   o f   t h e   s o l u t i o n   L × D i l u t i o n   f a c t o r × I C P M S   r e a d i n g   ( p p b ) W e i g h t   o f   t h e   s o i l   ( k g )

2.5. Pollution Load Index (PLI)

The Pollution Load Index (PLI) offers insight into the collective pollution load on a specific site by summarizing the levels of hazardous elements. The cumulative pollutant load for each sampling location was determined using the PLI method introduced by Tomlinson et al. [17]. The PLI values are interpreted as follows: a PLI < 1 indicates no pollution load from heavy metals, PLI = 1 reflects ground levels of heavy metals, and PLI > 1 signifies pollution [18]. This index is calculated as follows:
P L I = C F 1 × C F 2 × C F 3 . . × C F n n
where n represents the number of elements assessed and CF denotes the contamination factor, which is defined as the ratio of the concentration of a given metal in the soil sample to its background or reference concentration

2.6. Health Risk Evaluation

Health risk evaluation determines the potential adverse health influences resulting from exposure to non-carcinogenic and carcinogenic substances [19]. In this process, a hazard was identified by examining the chemical substances present at a specific location, their concentrations, and their spatial distribution. In the study area, toxic elements such as Cr, Mn, Ni, Zn, Pb, and Cu were analyzed to estimate the potential health risks to humans. Equations (3)–(12), used for assessing health risks from heavy metals, were adapted to evaluate health hazards allied with heavy metals in this study.

2.6.1. Estimated Daily Intake (EDI)

The risk of heavy metals to the farming community during agricultural activities was assessed through three exposure pathways: inhalation, ingestion, and dermal contact. Estimated Daily Intake (EDI) for heavy metals was calculated using three equations, as outlined by Enyoh et al. [20]. The parameters used in these calculations are presented in Table 1.
A v e r a g e   d a i l y   i n t a k e   I n g e s t i o n m g K g d a y : D I n g e s t i o n = H M × E D × E F × I n g R A T × B W × 10 6
A v e r a g e   d a i l y   i n t a k e   I n h a l a t i o n m g K g d a y : D I n h a l a t i o n = H M × E D × E F × I n h R A T × B W × P E F
A v e r a g e   d a i l y   i n t a k e   D e r m a l m g K g d a y : D D e r m a l = H M × E D × E F × S L × S A × A B S A T × B W × 10 6
Table 1. Metrics used to estimate human health risks from exposure to pollutants in agricultural soils.
ParametersValue for ChildrenValue for AdultsReferences
Heavy metal (mg/kg)HMHMThis study
Exposure Duration (y)630[21]
Exposure Frequency (d/y)180180
Average Time (Cancer) (d)27,74027,740
Average Time (Non-cancer) (d)219010,950
Average Body Weight (kg)16.261.8[22]
Average Lifetime (y)7676
Particle Emission Factor (m3/g)1.36 × 1061.36 × 106[19]
Ingestion Rate (g/d)0.20.1
Inhalation Rate (m3/d)7.620[23]

2.6.2. Cancer Risks Evaluation

Cancer risk assessment was conducted based on the Lifetime Average Daily Dose (LADD) and the Cancer Slope Factor (CSF) [20]. The LADD values were calculated using established equations [24,25]. The CSF quantifies the probability of developing cancer over a lifetime as a result of continuous exposure to a carcinogenic substance, thereby serving as a critical factor in estimating cancer risk. The CSF values for Cr, Zn, and Pb are 0.0085, 0.0085, and 6.1 for ingestion whereas, for inhalation, the CSF values of Cr and Ni are 420 and 0.84, respectively [24,26].
L A D D I n g e s t i o n = H M × E F A T × ( I n g R C h i l d × E D C H i l d B W C h i l d + I n g R A d u ; t × E D A d u l t B W A d u l t ) × 10 6
L A D D I n h a l a t i o n = H M × E F A T × P E F × I n h R C h i l d × E D C H i l d B W C h i l d + I n h R A d u l t × E D A d u l t B W A d u l t
L A D D D e r m a l   =   H M × E F × S A × S L × A B S A T × ( E D C H i l d B W C h i l d + E D A d u l t B W A d u l t ) × 10 6
C R I n g e s t i o n   =   L A D D I n g e s t i o n   ×   C S F I n g e s t i o n
C R I n h a l a t i o n   =   L A D D I n h a l a t i o n   ×   C S F I n h a l a t i o n
C R D e r m a l   =   L A D D D e r m a l   ×   C S F D e r m a l
C C R = C R = C R I n g e s t i o n   +   C R I n h a l a t i o n   +   C R D e r m a l

2.7. Quality Control

Comprehensive quality assurance and quality control (QA–QC) measures were implemented throughout the entire process, from soil sampling to data analysis to ensure the accuracy and reliability of the ICP-MS analysis. Samples were taken by means of a clean auger, air-dried in a contaminant-free environment, and stored in pre-cleaned, labeled aluminum zipper bags, which allows for secure sealing and easy reopening. Method blanks using ultrapure (Type 1) water were in each batch to monitor potential contamination during sample preparation and analysis. To enhance data reliability, the sampling procedure was conducted in triplicate. The ICP-MS instrument was calibrated using multi-element standard solutions at various concentration levels to establish accurate calibration curves. Recovery tests were performed by spiking known concentrations of heavy metals into selected samples, with acceptable recovery rates ranging from 85% to 115%. Where applicable, certified reference materials (CRMs) were also analyzed to validate the accuracy of the method. All laboratory equipment was thoroughly cleaned, sonicated, and rinsed with ultrapure water, and samples were stored in acid-washed, pre-cleaned containers to prevent contamination. These QA–QC protocols ensured the generation of high-quality and trustworthy analytical results.

2.8. Statistical Analysis

Statistical analyses were performed using IBM SPSS Statistics 20 and Microsoft Excel 2013. Mean differences were assessed using Duncan’s Multiple Range Test (DMRT). To identify potential sources of heavy metals in agricultural soils, multivariate statistical methods were applied, including Principal Component Analysis (PCA) based on Euclidean distance and hierarchical clustering using Ward’s method.

3. Results and Discussion

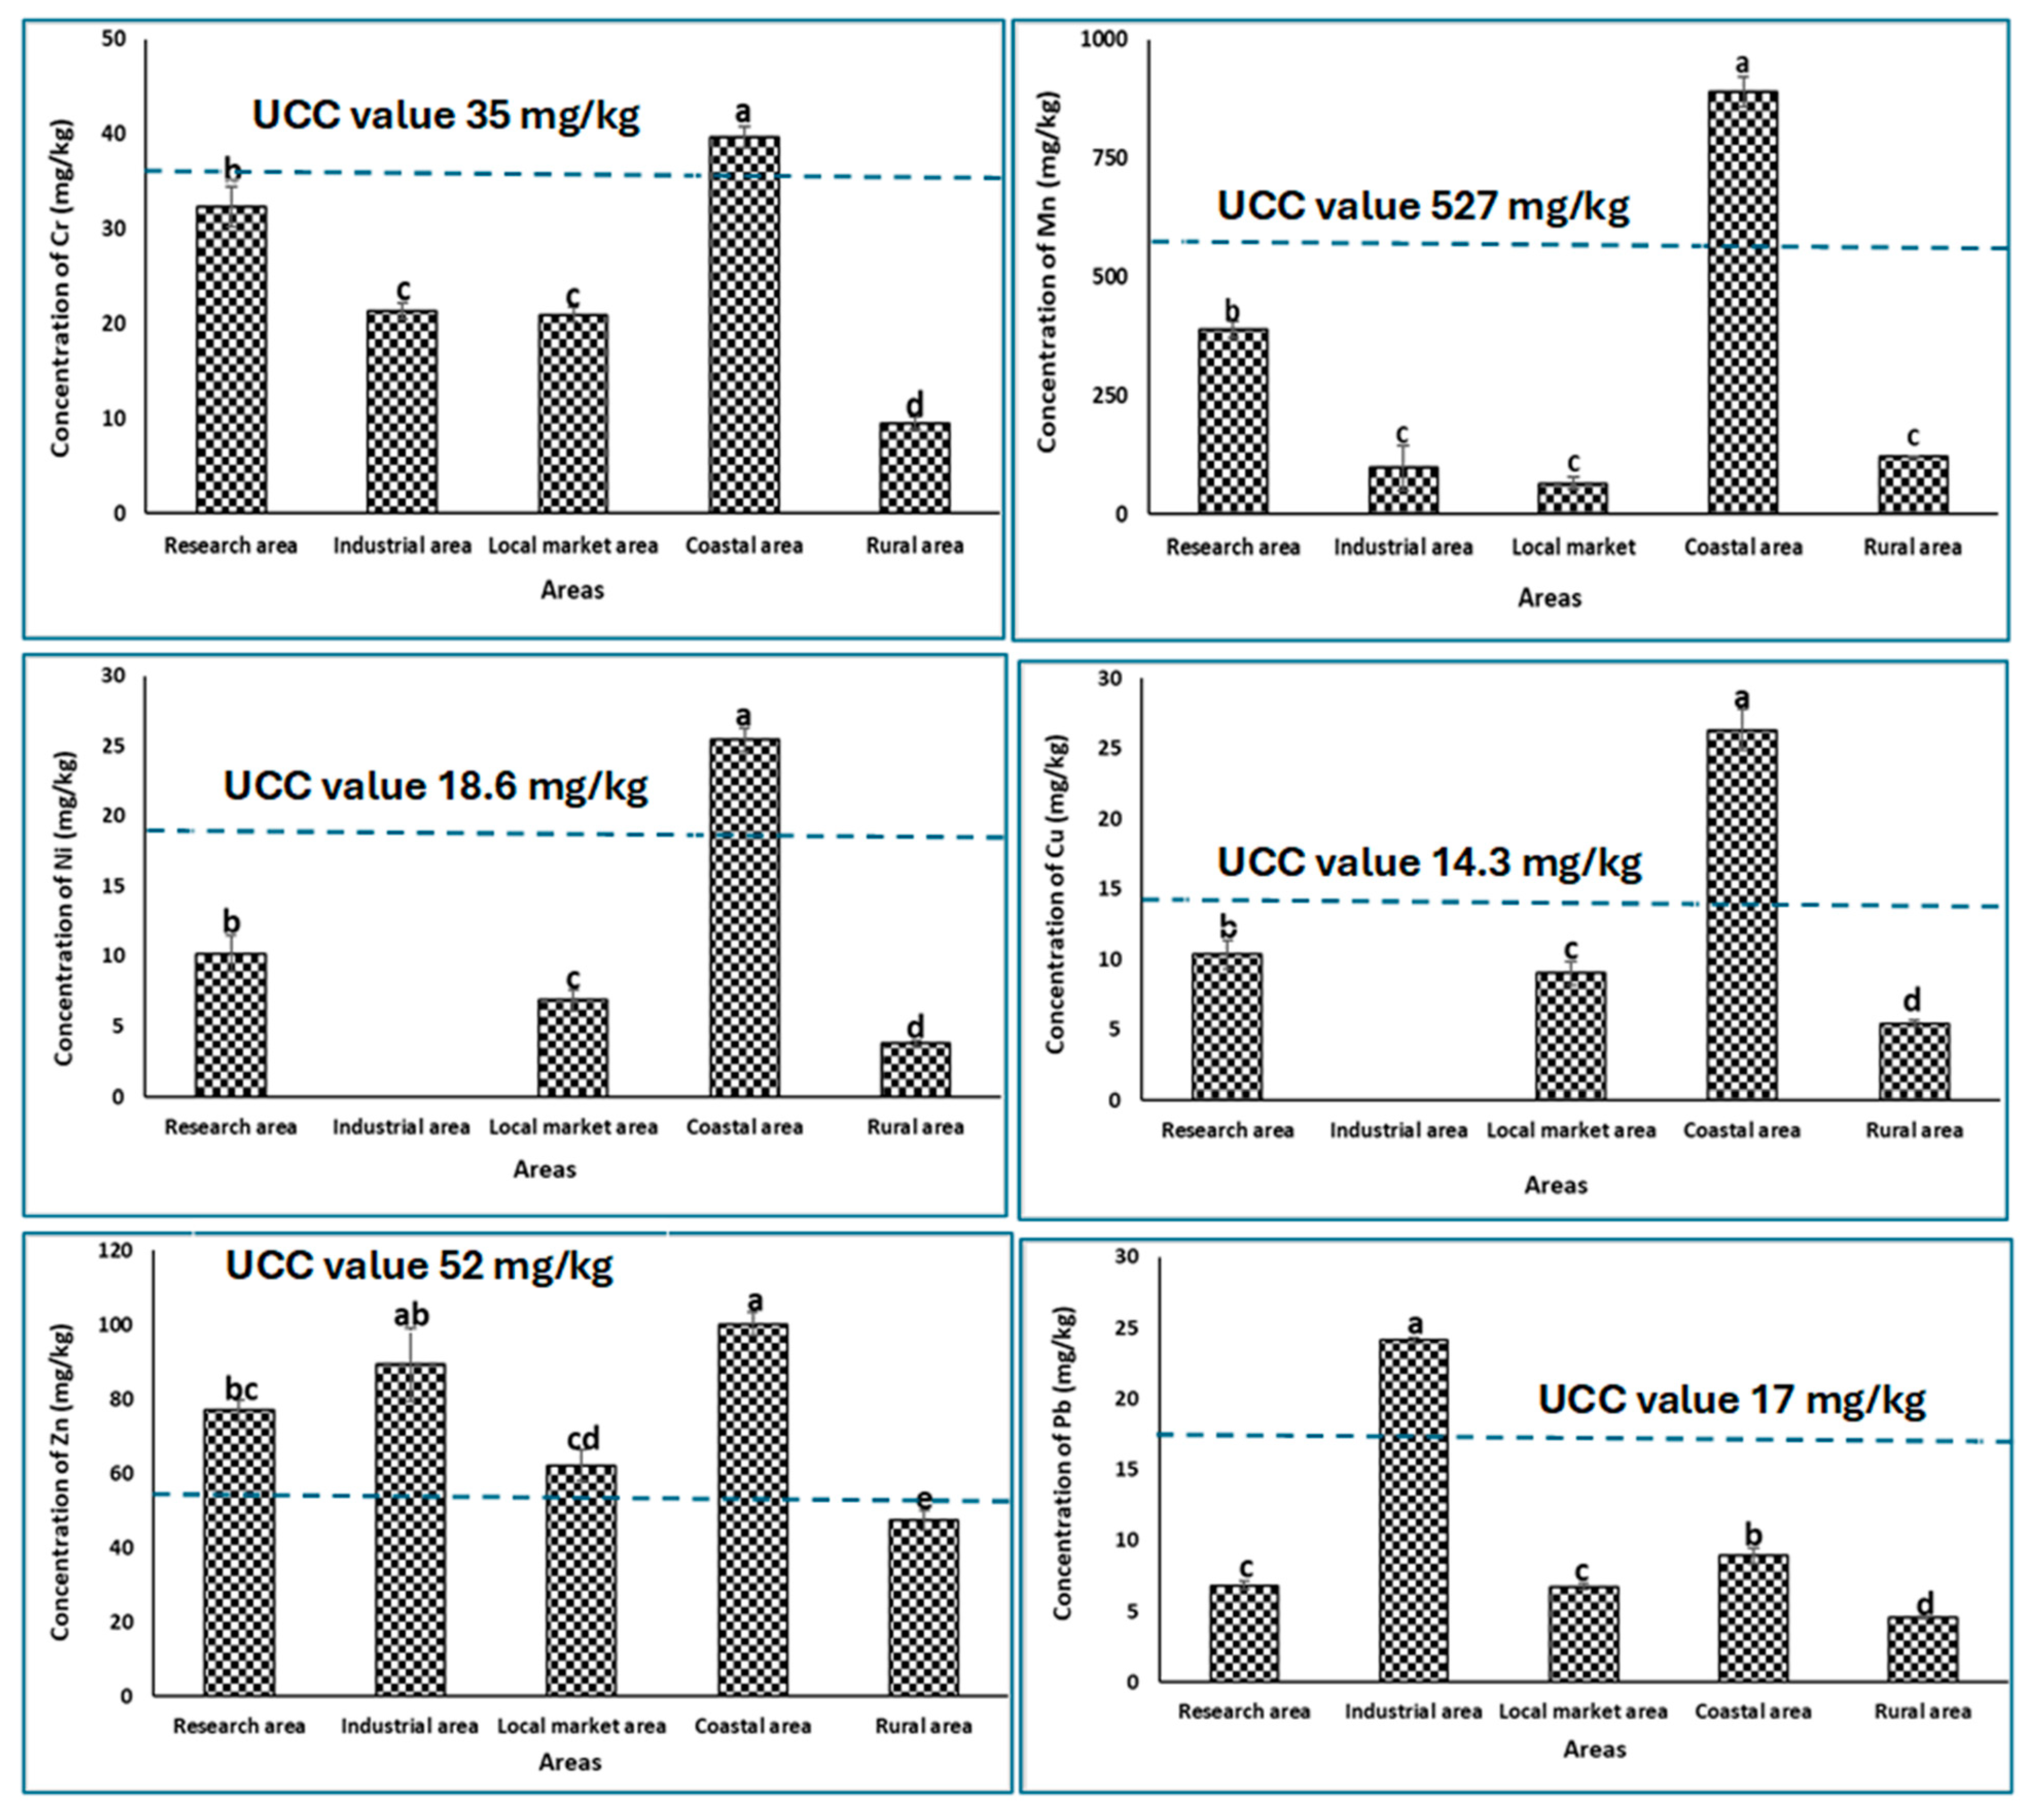
3.1. Heavy Metal Concentration in Different Agricultural Soils

The analysis of agricultural soils revealed the presence of different concentrations of six heavy metals: Cr, Mn, Ni, Cu, Zn, and Pb. Among the five types of agricultural zones studied—coastal, research, industrial, local market, and rural areas—the highest concentrations of Cr, Mn, Ni, Cu, and Zn were consistently observed in coastal soils, whereas Pb was most concentrated in industrial soils. Rural areas typically showed the lowest levels of heavy metals, with the exception of Cu and Ni, which were found in slightly higher amounts than in industrial soils. The concentrations of different heavy metals were compared with global data to contextualize the findings on a worldwide scale (Table 2).
Chromium (Cr) levels were highest in coastal soils and followed the descending order of coastal area > research area > industrial area > local market area > rural area (Figure 2). The Cr concentration in coastal soils exceeded the upper continental crust (UCC) value of 35 mg/kg, suggesting contamination from anthropogenic sources such as traffic from marine vehicles, coal burning, industrial activities, atmospheric deposition, and the use of Cr-containing mineral fertilizers and pesticides. These findings are consistent with studies on Ferraz soils [27] and comparable to Cr levels in Malaysian and Thai soils [28,29]. The Cr concentration was also comparable with the concentration of Cr from the other mentioned agricultural soils of Bangladesh (Table 2).
A similar distribution pattern was observed for manganese (Mn), with the highest concentrations found in coastal soils, followed by the research field area. Mn levels were statistically insignificant in rural, industrial, and local market soils. Coastal Mn concentrations exceeded the UCC benchmark of 527 mg/kg and were higher than those reported in the city agricultural soil of Khyber-Pakhtunkhwa, Pakistan [30], and the city area soil of Ahvas Metropolis, Iran [31], though were lower than in the agricultural soil of North Dakota, USA [32], and residential area soil of Peloponnese, Greece [33]. The measured concentration of Mn was more than double that of coastal soil [34]. Elevated Mn in coastal soils is primarily due to seawater intrusion, marine sediment deposition, and the transport of Mn-rich minerals, along with inputs from atmospheric deposition, sewage irrigation, sludge application, animal manure, mineral fertilizers, and pesticides [35].
Nickel (Ni) also followed the sequence of coastal > research > local market > rural soils, with no Ni detected in industrial soils. The absence of Ni in industrial zones may result from the lack of Ni in local industrial operations or from leaching, erosion, or strong adsorption onto soil particles. Coastal soil Ni enrichment is attributed to natural processes such as marine sedimentation and weathering, in addition to human-induced factors like atmospheric deposition, manure, fertilizers, pesticides, and vehicular emissions [5,36]. The recorded Ni concentrations aligned with those found in Ross Sea sediments [37].
Copper (Cu) distribution mirrored that of Ni, with the highest values in coastal areas and being absent in industrial soils. Coastal Cu levels are enhanced by salinity and anaerobic conditions that increase metal solubility and bioavailability. Additional Cu sources include atmospheric deposition, fertilizers, manure, pesticides (especially Bordeaux mixture), Cu-based fungicides, and waste lubricating oil [36].
Zinc (Zn) levels were greatest in coastal soils, followed by industrial zones, research areas, local markets, and rural lands. These differences were statistically significant and corroborated previous findings [38]. Zn contamination is linked to vehicular emissions, lubricating oil waste, the application of Zn-containing fertilizers like zinc sulfate, pesticides, and activities in non-ferrous metal industries.
In contrast to the other metals, lead (Pb) concentrations peaked in industrial soils, reflecting contamination from metal processing, manufacturing, and waste disposal. Other sources include atmospheric deposition, emissions from vehicles—particularly in congested traffic zones—galvanized automobile parts, tire wear and corrosion, and urban compost derived from contaminated waste materials [33]. The Pb concentrations found in industrial soils were consistent with reports from Greece, Iran, and the United States [31,32].
Table 2. Heavy metal concentration in different agricultural soils throughout the world.
City, CountryConcentration (mg/kg)Types of SoilsReferences
MnNiCuZnPbCr
North Dakota, USA119122.112.466.49.520.4Rural agricultural soil[32]
Khyber-Pakhtunkhwa, Pakistan39930.716.039.115.830.6City agricultural soil[30]
Ahvas Metropolis, Iran561.8109.323.856.68.367.3City area soil[31]
Sinú River Basin, Colombia-587100412180.1-Rural agricultural soil[39]
Peloponnese, Greece1020146.874.774.919.783.1Residential area[33]
Dhaka, Bangladesh106–57725–11228–21753–47717–99-Industrial soil[40]
Dhaka, Bangladesh-36.03–74.1631.35–45.16103.20–123.4944.31–52.2133.89–67.58Industrial soil[41]
Bagerhat, Bangladesh426.3626.9123.7548.5851.1127.63Coastal soil[34]
Tangail, Bangladesh-0.71–18.391.02–34.44,-2.01–28.860.96–14.04Industrial vicinity soil[42]
Kurigram, Bangladesh----26.734.7Rural agricultural soil[43]

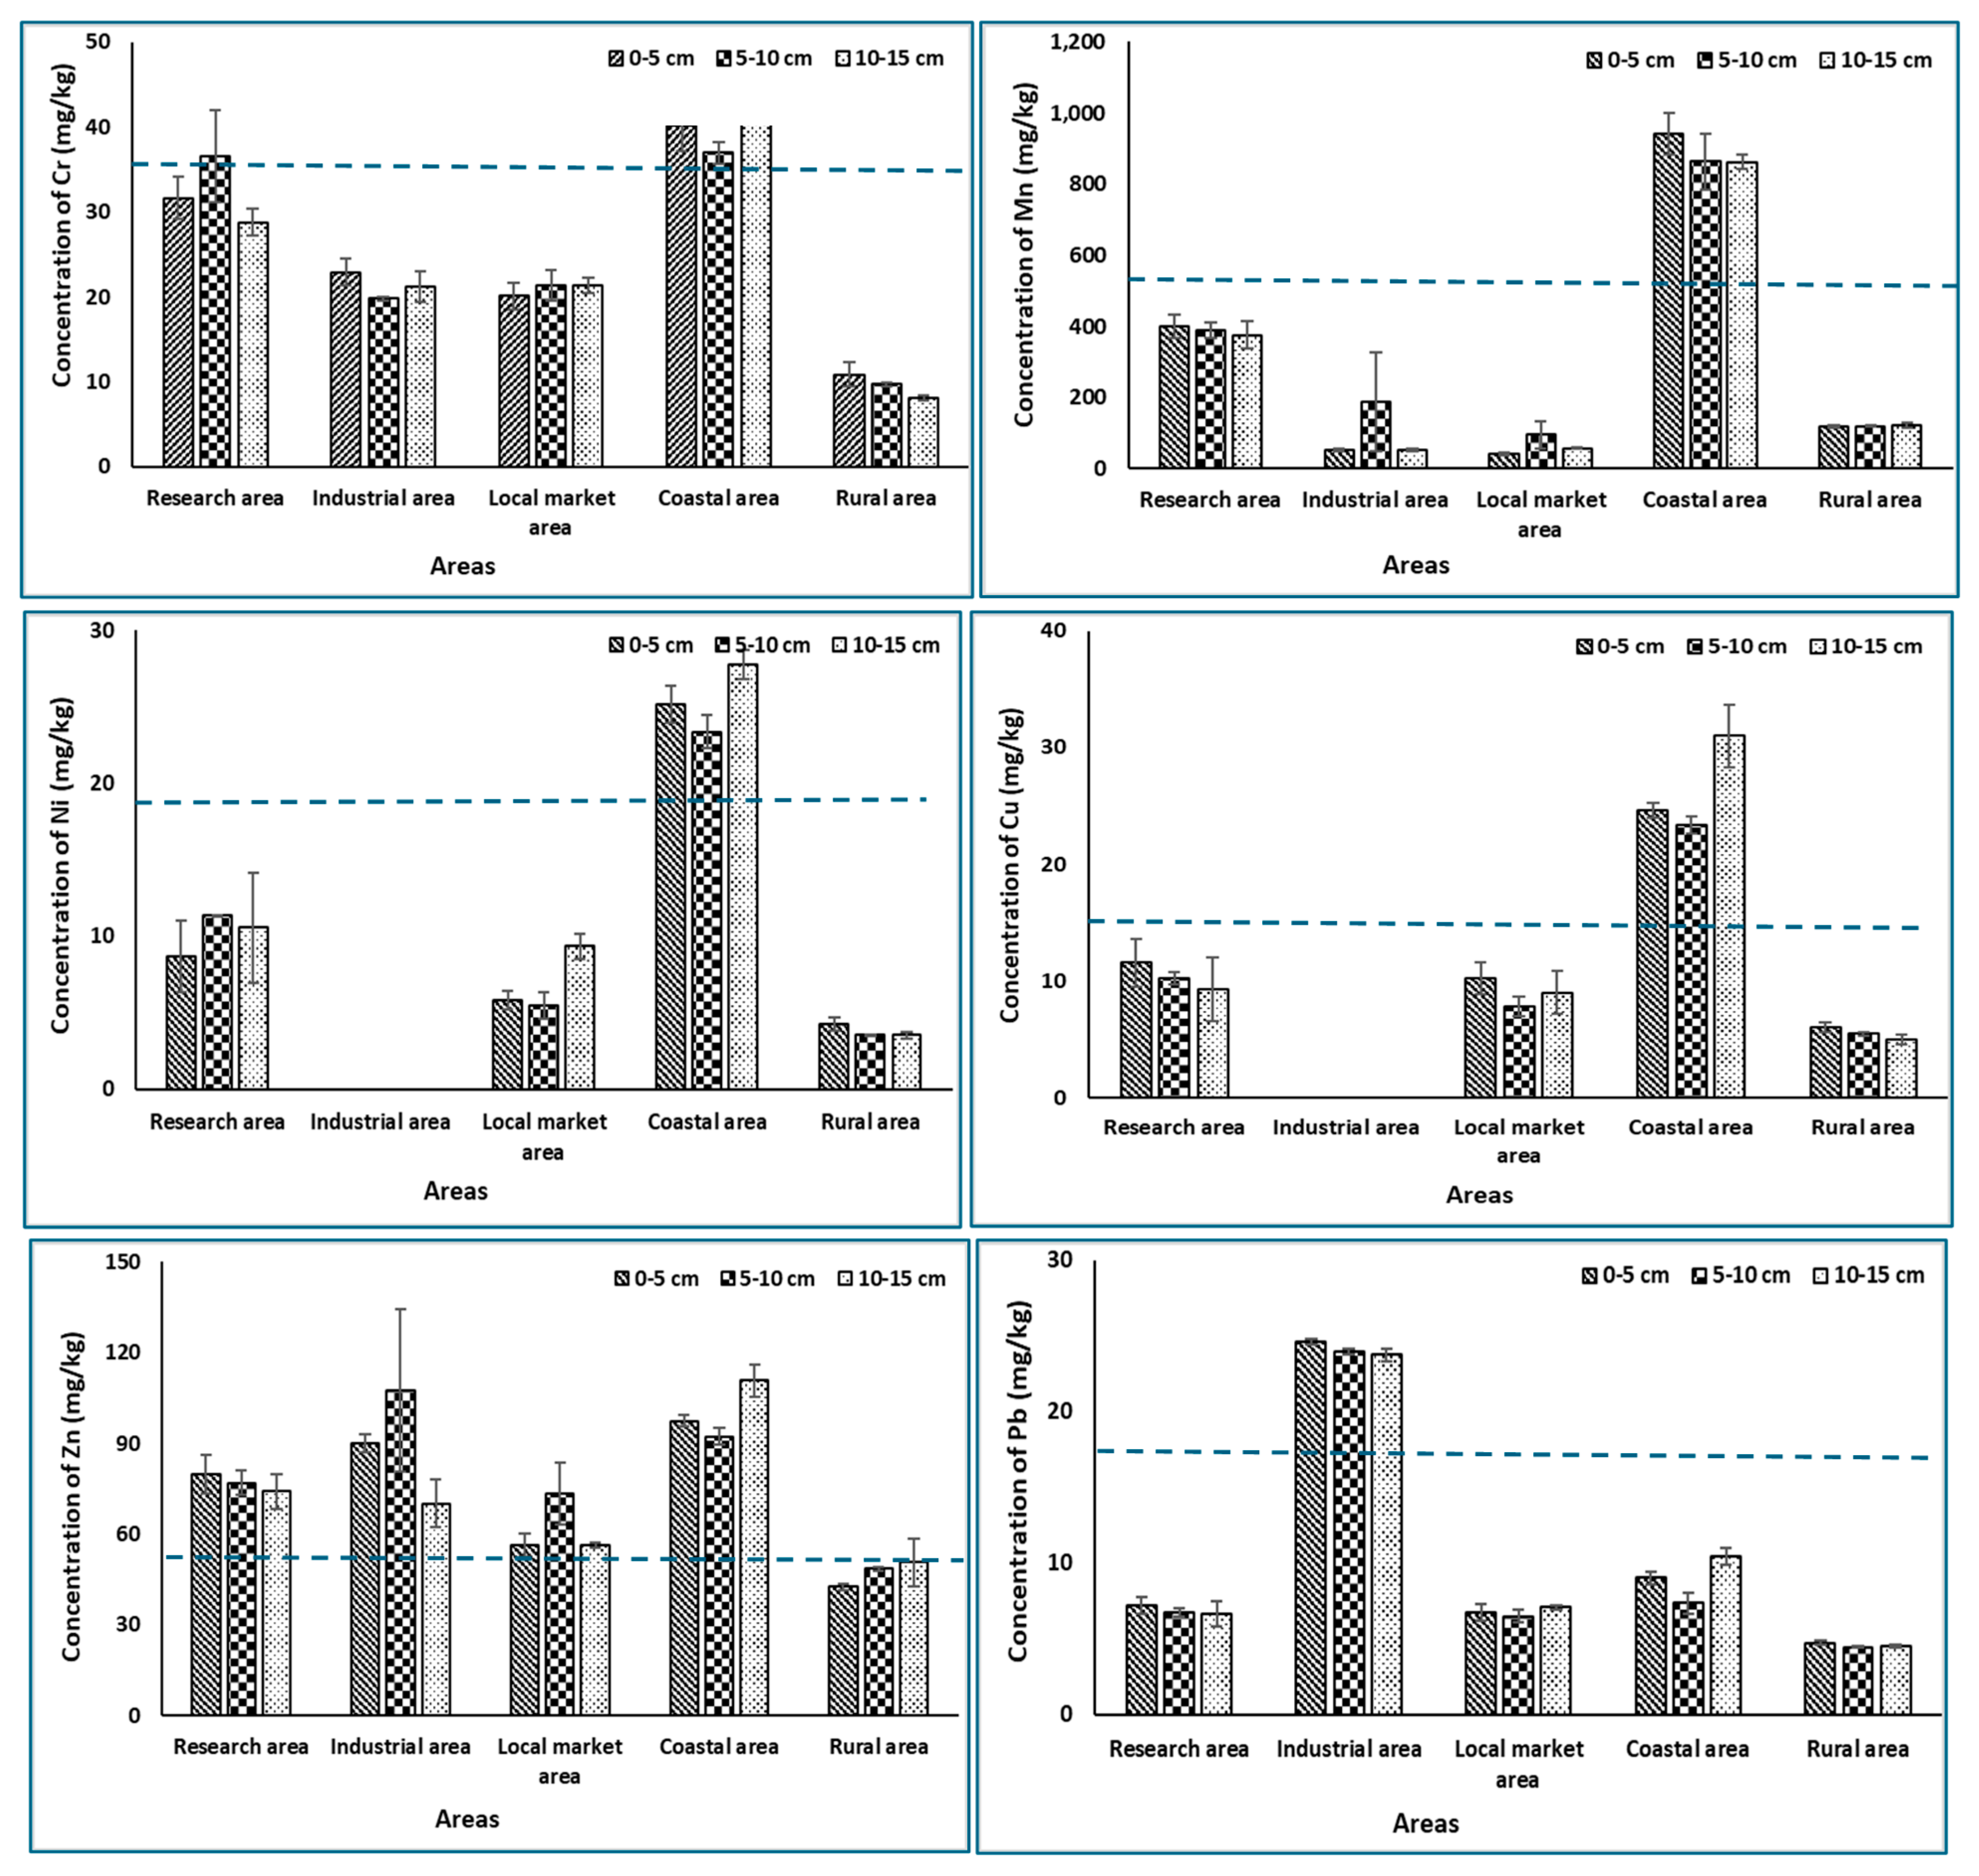
3.2. Measurement of Heavy Metal Concentration of Different Soil Depths in Different Agricultural Soils

Figure 3 shows the concentration of heavy metal concentrations across various soil depths in agricultural soils. The findings indicate that heavy metal levels were relatively consistent across the different depths. Notably, concentrations of Cr, Mn, Ni, Cu, and Zn were elevated across all sampling locations and soil layers compared to their respective upper continental crust (UCC) values [44]. The concentration of Pb at different depths was higher in the industrial area compared to the other areas considered. The data did not exhibit a clear or consistent trend with respect to soil depths, indicating that heavy metals were irregularly distributed. This haphazard pattern may be attributed to factors such as tillage operations, leaching, earthing up, and other intercultural activities. The lack of a specific pattern suggests that factors influencing the distribution of heavy metals may vary significantly or that other site-specific conditions mask depth-related trends.

3.3. Pearson Correlation Analysis Between Heavy Metal Concentrations

The provided correlation matrix indicates the relationships among the heavy metals Cr, Mn, Ni, Cu, Zn, and Pb (Table 3). The significant positive correlations (p < 0.01) observed between Mn and Zn (0.839 **), Mn and Pb (0.949 **), Cu and Zn (0.839 **), Cu and Pb (0.885 **), and Zn and Pb (0.883 **) suggest a common anthropogenic origin for these metals—likely from agricultural activities such as fertilizer and pesticide application, as well as atmospheric deposition. These strong associations may also reflect similar geochemical behavior and mobility in the soil matrix. Moderate correlations (p < 0.05) involving Ni with Mn (0.769 *), Cu (0.794 *), and Pb (0.795 *), as well as for Zn with Ni (0.672 *), indicate that Ni may partially share sources with these metals, though its behavior might also be influenced by site−specific soil characteristics such as organic matter content and pH. In contrast, Cr showed weaker correlations (e.g., Cr−Cu, r = 0.477), implying that Cr may originate from different inputs, such as localized industrial activities or the use of Cr-based agrochemicals, and may have different retention or mobility dynamics.
Spatial variation in correlation patterns further supports the influence of local conditions. For instance, strong correlations in coastal soils (e.g., Cu–Ni, Pb–Ni) suggest potential marine−based or port-related pollution sources. In rural and local market areas, moderate correlations (e.g., Mn–Zn, Pb–Cu) may be attributed to mixed inputs from agricultural runoff, domestic waste, and market-related activities. Conversely, in industrial areas, the absence of consistent inter-metal correlations may reflect more heterogeneous or site-specific contamination profiles.

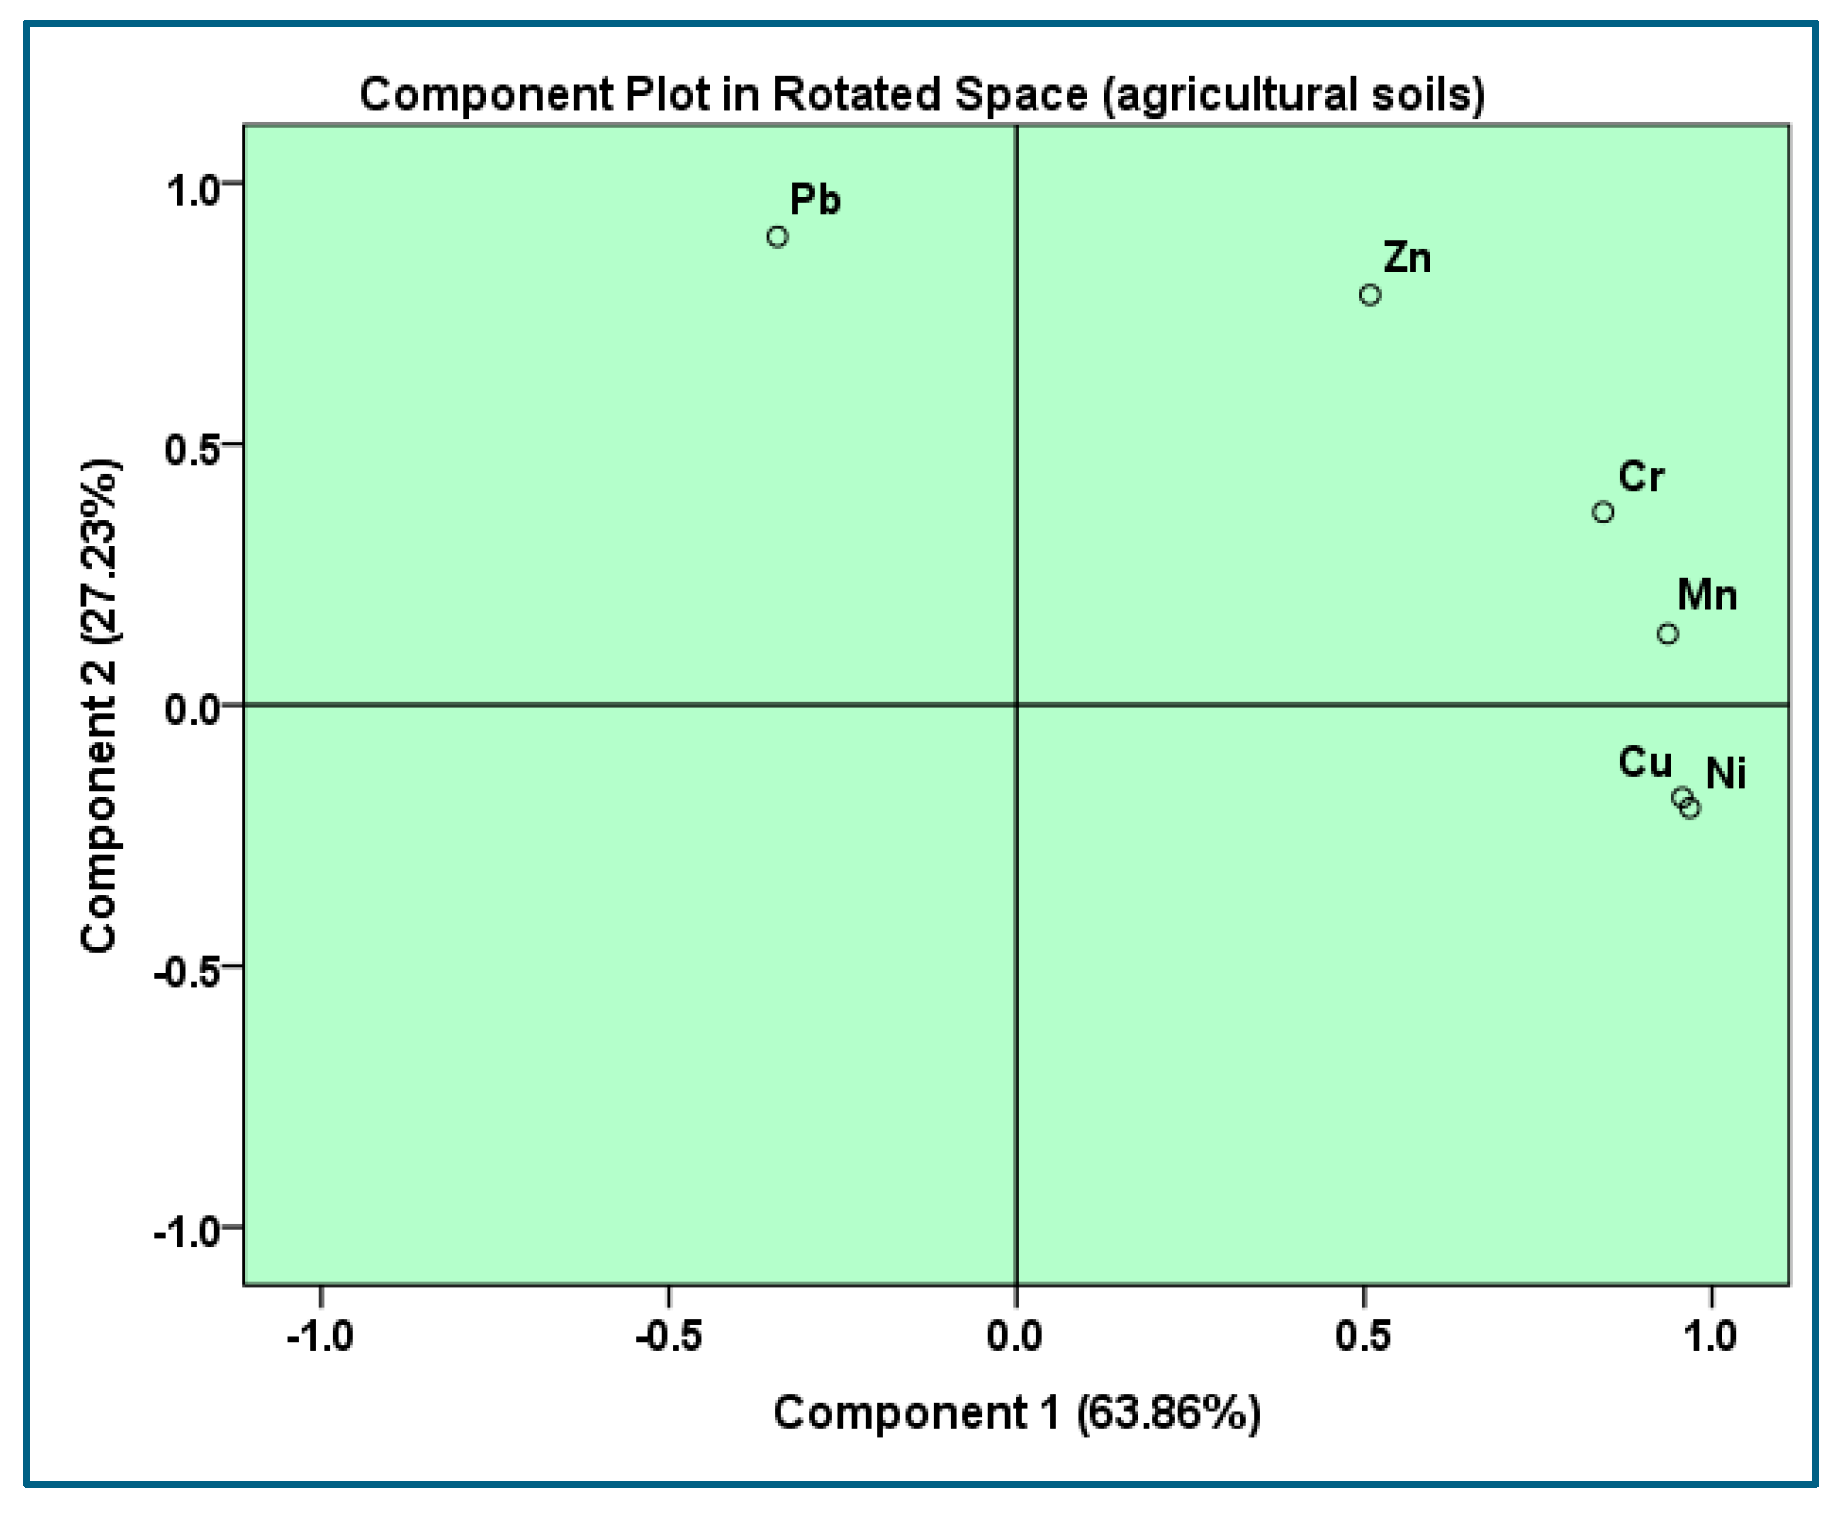
3.4. Principal Component Analysis (PCA)

Principal Component Analysis (PCA) is a technique for determining the potential sources of heavy metals in agricultural soils [45]. The PCA results identified two principal components: PC1 and PC2. PC1 accounts for 63.86% of the total variance and shows strong loadings for Cu, Ni, Mn, Cr, and Zn, suggesting a common source or similar geochemical behavior among these elements (Figure 4). This component likely represents a mixture of natural and anthropogenic sources, including the weathering of metal-bearing rocks, atmospheric deposition, and runoff from surrounding areas. The presence of Cr and Ni in PC1 may also point to inputs from industrial activities or the use of Cr- and Ni-containing agrochemicals. In addition, PC1, encompassing Mn, Ni, Zn, Cu, and Cr, suggests mixed sources such as the weathering of metal-rich rocks, atmospheric deposition, and surface runoff as contributors to these metals. On the other hand, PC2, which explains 27.23% of the variance, is dominated by Pb and Zn. The strong loading of Pb on this component suggests a distinct and possibly more localized source. One plausible explanation is the contribution of lead-based paints from road markings and wear and tear of agricultural machinery commonly used in the study areas. The co-loading of Zn on both PC1 and PC2 implies that Zn may have multiple sources, including both widespread environmental inputs and more specific anthropogenic activities. Saleem et al. [32] also noted two components during heavy metal source analysis from agricultural soils.

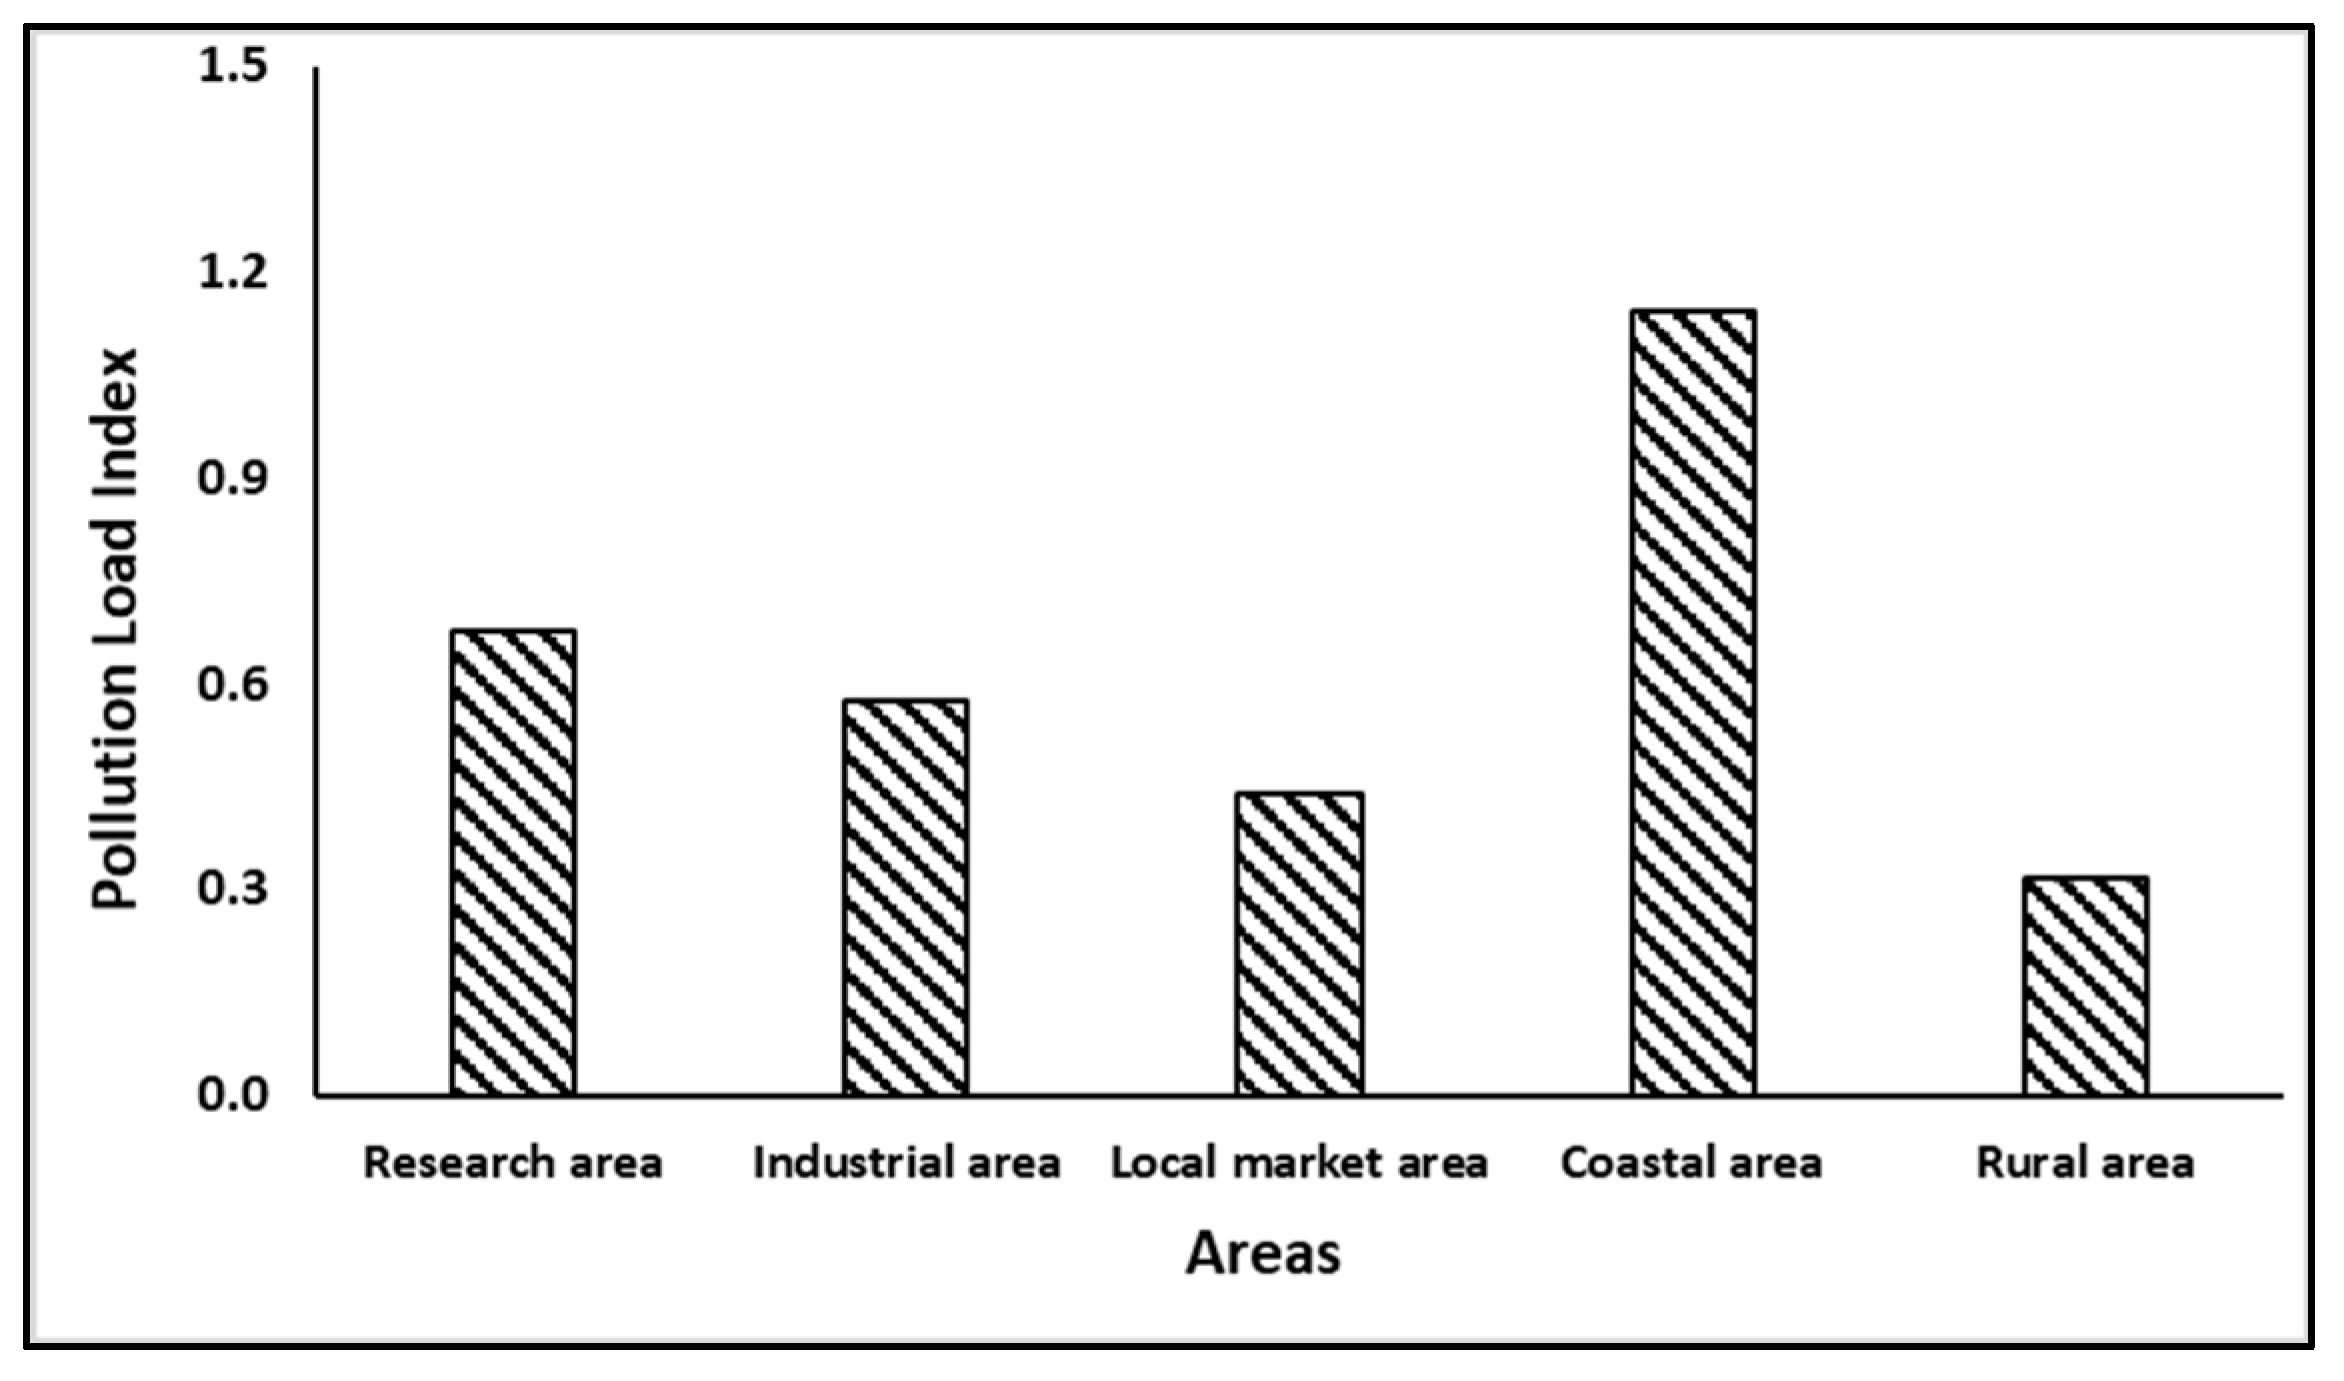
3.5. Pollution Loading Index

Figure 5 shows the variation in Pollution Load Index (PLI) across five areas—research, industrial, local market, coastal, and rural. The results revealed that coastal soil has the highest PLI, exceeding 1.0, suggesting a high pollution level, which could be attributed to salinity intrusion, chemical fertilizer use, pesticide use, etc. The order of the Pollution Load Index is as follows: coastal area > research area > industrial area > local market area > rural area. The research, industrial, local market, and rural areas show lower PLI values, indicating that the lowest PLI value is due to the lowest heavy metal concentration. Diganta et al. [46] also reported a low PLI value, which is comparable to our findings.

3.6. Average Daily Intake of Different Agricultural Soils

Table 4 illustrates the average daily intake of heavy metals (Cr, Mn, Ni, Cu, Zn, Pb) through ingestion, inhalation, and dermal contact across five distinct areas. Among the exposure pathways, inhalation consistently exhibits higher values compared to ingestion and dermal contact for most metals, suggesting that it poses a greater health risk. The coastal area emerges as the most affected region, exhibiting elevated ADI values for multiple metals across all pathways. This can be attributed to several environmental and anthropogenic factors, including the salinity-driven mobilization of metals in soils, industrial emissions, and intensive agricultural practices that enhance metal accumulation and transfer. In contrast, the rural area consistently showed the lowest exposure levels, reflecting limited industrial activity and relatively lower anthropogenic input, thus posing a comparatively lower health risk. The results also underscore that Mn, in particular, presents higher intake levels—especially in the coastal zone—raising potential concerns due to its neurotoxic effects at an elevated exposure. The variability in exposure across both regions and pathways emphasizes the importance of region-specific and pathway-targeted risk mitigation strategies, particularly for vulnerable populations living in high-exposure zones such as coastal and industrial areas.

3.7. LADD of Heavy Metals in Different Agricultural Soils

Table 5 displays the Lifetime Average Daily Dose (LADD) of heavy metals absorbed via ingestion, inhalation, and dermal exposure. Among the three pathways, inhalation consistently presents the highest LADD values, suggesting that it is the most significant route of chronic exposure. This may be due to the high bioavailability and deeper respiratory penetration of airborne particulates, which are particularly relevant in environments with dust, industrial emissions, and vehicular exhaust. Manganese (Mn) stands out with the highest exposure levels across all pathways, highlighting its environmental abundance—especially in coastal areas where salinity-induced mobilization enhances its availability. In contrast, chromium (Cr) and nickel (Ni) show the lowest LADD values, likely reflecting their comparatively lower concentrations in the sampled soils. Geographically, coastal areas exhibit the highest LADD values for most metals, which may result from a combination of salinity-enhanced metal solubility, industrial discharge, and intensive agricultural practices. These conditions increase the mobility and bioaccessibility of metals such as Mn, Cu, Zn, and Ni. Conversely, rural areas demonstrate the lowest exposure levels, consistent with lower anthropogenic inputs and minimal industrial activities, resulting in relatively cleaner soils and reduced long-term health risks.

3.8. Cumulative Cancer Risk

A cancer risk assessment based on chronic exposure to heavy metals through ingestion and inhalation pathways reveals notable spatial variation across the studied areas (Table 6). The coastal area and research area exhibited the highest cumulative cancer risks, with values of 2.52 × 10⁶ and 2.06 × 10⁶, respectively. These exceed the lower bound of the commonly accepted risk threshold range (106 to 104) [47], indicating potential health concerns for residents in these zones. The elevated risk in these areas is primarily driven by inhalation exposure to chromium (Cr), which significantly contributes to the total cancer risk due to its high Cancer Slope Factor [48]. In contrast, the rural area demonstrated the lowest cumulative cancer risk (6.10 × 10⁷), falling below the acceptable threshold and suggesting relatively low anthropogenic influence and exposure. Although lead (Pb) and zinc (Zn) contribute to lower individual cancer risks, their consistent presence across all areas underscores ongoing background contamination that warrants continued monitoring.

4. Conclusions

This study investigated the distribution of heavy metals across different soil depths and land use types, aiming to identify their possible sources and related health risks. Six heavy metals—Cr, Mn, Cu, Zn, Pb, and Ni—were detected, with average concentrations of 24.76, 311.66, 9.67, 15.17, 10.24, and 8.21 mg/kg, respectively. Coastal agricultural soils exhibited the highest concentrations for most metals (excluding Pb), likely influenced by human activities and environmental conditions, whereas rural soils generally showed the lowest levels, with the exception of Ni and Cu. The correlation analysis indicates that heavy metals in the study areas likely share common anthropogenic sources, with site-specific variations highlighting the influence of local activities on metal distribution. A comparable pattern was observed in the Pollution Load Index (PLI). Among the exposure routes, inhalation consistently posed a higher risk than ingestion or dermal contact, indicating a greater potential health threat. These results highlight the critical need for site-specific monitoring and focused mitigation efforts, including the promotion of integrated pest management (IPM), control of pollution sources, and increased awareness among farmers and local communities—especially in vulnerable coastal areas—to reduce environmental pollution and protect public health.

Author Contributions

S.S.: Conceptualization, Methodology, Investigation, Data Curation, Formal analysis, Writing—Original Draft Preparation. Q.W.: Supervision, Writing—Original Draft Preparation, Review and Editing. M.R.I.: Writing—Original Draft Preparation, Review and Editing. Y.I.: Formal analysis. C.E.E.: Review and Editing. W.S.: Review and Editing. All authors have read and agreed to the published version of the manuscript.

Funding

This study was partially supported by the Special Funds for Innovative Area Research (No. 20120015, FY2008–FY2012) and Basic Research (B) (No. 24310005, FY2012–FY2014; No. 18H03384, FY2017–FY2020; No. 22H03747, FY2022–FY2024) of Grant-in-Aid for Scientific Research of the Japanese Ministry of Education, Culture, Sports, Science, and Technology (MEXT).

Data Availability Statement

The data that support the findings of this study are available on request from the corresponding author.

Conflicts of Interest

The authors declare no conflicts of interest.

References

  1. Food and Agriculture Organization (FAO). The Status of Food Security and Nutrition in the World. Transforming Food Systems for Food Security, Improved Nutrition and Affordable Healthy Diets for All; FAO: Rome, Italy, 2021; Available online: https://openknowledge.fao.org/server/api/core/bitstreams/1c38676f-f5f7-47cf-81b3-f4c9794eba8a/content (accessed on 21 December 2024).
  2. Parvez, M.S.; Czédli, H.; Hoque, M.I.; Rahman, M.M.; Anwar, A.; Uddin, A.H.M.M.; Simon, E. Accumulation of microplastics and potentially toxic elements in plant leaves along an urbanization gradient in Bangladesh. Toxics 2024, 12, 848. [Google Scholar] [CrossRef] [PubMed]
  3. Rashid, A.; Schutte, B.J.; Ulery, A.; Deyholos, M.K.; Sanogo, S.; Lehnhoff, E.A.; Beck, L. Heavy metal contamination in agricultural soil: Environmental pollutants affecting crop health. Agronomy 2023, 13, 1521. [Google Scholar] [CrossRef]
  4. Shahid, M.; Khalid, S.; Abbas, G.; Shahid, N.; Nadeem, M.; Sabir, M.; Aslam, M.; Dumat, C. Heavy metal stress and crop productivity. In Crop Production and Global Environmental Issues; Springer: Cham, Switzerland, 2015; pp. 1–25. [Google Scholar]
  5. Zhang, Z.; Zhao, S.; Chen, L.; Duan, C.; Zhang, X.; Fang, L. A review of microplastics in soil: Occurrence, analytical methods, combined contamination and risks. Environ. Pollut. 2022, 306, 119374. [Google Scholar] [CrossRef] [PubMed]
  6. Zhao, S.; Zhang, Z.; Chen, L.; Cui, Q.; Cui, Y.; Song, D.; Fang, L. Review on migration, transformation and ecological impacts of microplastics in soil. Appl. Soil Ecol. 2022, 176, 104486. [Google Scholar] [CrossRef]
  7. Ali, H.; Khan, E.; Ilahi, I. Environmental chemistry and ecotoxicology of hazardous heavy metals: Environmental persistence, toxicity, and bioaccumulation. J. Chem. 2019, 2019, 6730305. [Google Scholar] [CrossRef]
  8. Edo, G.I.; Samuel, P.O.; Oloni, G.O.; Ezekiel, G.O.; Ikpekoro, V.O.; Obasohan, P.; Ongulu, J.; Otunuya, C.F.; Opiti, A.R.; Ajakaye, R.S.; et al. Environmental persistence, bioaccumulation, and ecotoxicology of heavy metals. Chem. Ecol. 2024, 40, 322–349. [Google Scholar] [CrossRef]
  9. Mishra, S.; Bharagava, R.N.; More, N.; Yadav, A.; Zainith, S.; Mani, S.; Chowdhary, P. Heavy metal contamination: An alarming threat to environment and human health. In Environmental Biotechnology: For Sustainable Future; Springer: Singapore, 2019; pp. 103–125. [Google Scholar]
  10. Orellana-Mendoza, E.; Camel, V.; Yallico, L.; Quispe-Coquil, V.; Cosme, R. Effect of fertilization on the accumulation and health risk for heavy metals in native Andean potatoes in the highlands of Perú. Toxicol. Rep. 2024, 12, 594–606. [Google Scholar] [CrossRef]
  11. Edelstein, M.; Ben-Hur, M. Heavy metals and metalloids: Sources, risks and strategies to reduce their accumulation in horticultural crops. Sci. Hortic. 2018, 234, 431–444. [Google Scholar] [CrossRef]
  12. Islam, M.M.; Karim, M.R.; Zheng, X.; Li, X. Heavy metal and metalloid pollution of soil, water and foods in Bangladesh: A critical review. Int. J. Environ. Res. Public Health 2018, 15, 2825. [Google Scholar] [CrossRef]
  13. Rahman, S.H.; Khanam, D.; Adyel, T.M.; Islam, M.S.; Ahsan, M.A.; Akbor, M.A. Assessment of heavy metal contamination of agricultural soil around Dhaka Export Processing Zone (DEPZ), Bangladesh: Implication of seasonal variation and indices. Appl. Sci. 2012, 2, 584–601. [Google Scholar] [CrossRef]
  14. Bouida, L.; Rafatullah, M.; Kerrouche, A.; Qutob, M.; Alosaimi, A.M.; Alorfi, H.S.; Hussein, M.A. A review on cadmium and lead contamination: Sources, fate, mechanism, health effects and remediation methods. Water 2022, 14, 3432. [Google Scholar] [CrossRef]
  15. Acharya, S. Heavy Metal Contamination in Food: Sources, Impact, and Remedy. In Food Safety and Quality in the Global South; Springer Nature: Singapore, 2024; pp. 233–261. [Google Scholar]
  16. Sharmin, S.; Wang, Q.; Islam, M.R.; Wang, W.; Enyoh, C.E. Microplastic Contamination of Non-Mulched Agricultural Soils in Bangladesh: Detection, Characterization, Source Apportionment and Probabilistic Health Risk Assessment. J. Xenobiotics 2024, 14, 812–826. [Google Scholar] [CrossRef] [PubMed]
  17. Tomlinson, D.L.; Wilson, J.G.; Harris, C.R.; Jeffrey, D.W. Problems in the assessment of heavy-metal levels in estuaries and the formation of a pollution index. Helgoländer Meeresuntersuchungen 1980, 33, 566–575. [Google Scholar] [CrossRef]
  18. Kumar, P.; Mishra, V.; Yadav, S.; Yadav, A.; Garg, S.; Poria, P.; Farooqi, F.; Dumée, L.F.; Sharma, R.S. Heavy metal pollution and risks in a highly polluted and populated Indian river–city pair using the systems approach. Environ. Sci. Pollut. Res. 2022, 29, 60212–60231. [Google Scholar] [CrossRef]
  19. USEPA. Methods for Collection, Storage and Manipulation of Sediment for Chemical and Toxicological Analyses: Technical Manual; US Environmental Protection Agency: Washington, DC, USA, 2001.
  20. Enyoh, C.E.; Qingyue, W.; Verla, A.W.; Chowdhury, T. Index models for ecological and health risks assessment of environmental micro-and nano-sized plastics. AIMS Environ. Sci. 2022, 9, 51–65. [Google Scholar] [CrossRef]
  21. Zheng, N.; Liu, J.; Wang, Q.; Liang, Z. Heavy metals exposure of children from stairway and sidewalk dust in the smelting district. Northeast of China. Atmos. Environ. 2010, 44, 3239–3245. [Google Scholar] [CrossRef]
  22. China Statistics Bureau. China Statistical Yearbook; National Bureau of Statistics of China: Beijing, China, 2012; p. 62791819.
  23. Van den Berg, R. Human Exposure to Soil Contamination: A Qualitative and Quantitative Analysis towards Proposals for Human Toxicology C-Standard Values; Report No. 7252010; National Institute of Public Health and Environmental Protection: Bilthoven, The Netherlands, 1995. [Google Scholar]
  24. Ferreira-Baptista, L.; De Miguel, E.J. Geochemistry and risk assessment of street dust in Luanda, Angola: A tropical urban environment. Atmos. Environ. 2005, 39, 4501–4512. [Google Scholar] [CrossRef]
  25. USEPA. Guidelines for Carcinogen Risk Assessment; US Environmental Protection Agency: Washington, DC, USA, 2005.
  26. Yang, S.; Zhao, J.; Chang, S.X.; Collins, C.; Xu, J.; Liu, X. Status assessment and probabilistic health risk modeling of metals accumulation in agriculture soils across China: A synthesis. Environ. Int. 2019, 128, 165–174. [Google Scholar] [CrossRef]
  27. Gomes, M.S. Determinação de Elementos Metálicos em Sedimentos Antárticos. Master Thesis, Universidade de São Paulo, São Paulo, Brazil, 1999. [Google Scholar]
  28. Zarcinas, B.A.; Ishak, C.F.; McLaughlin, M.J.; Cozens, G. Heavy metals in soils and crops in Southeast Asia: 1. Peninsular Malaysia. Environ. Geochem. Health 2004, 26, 343–357. [Google Scholar] [CrossRef]
  29. Zarcinas, B.A.; Pongsakul, P.; McLaughlin, M.J.; Cozens, G. Heavy metals in soils and crops in Southeast Asia: 2. Thailand. Environ. Geochem. Health 2004, 26, 359–371. [Google Scholar] [CrossRef]
  30. Shah, S.H.A.; Sajjad, R.U.; Javed, A.; Habib, U.; Ahmad, F.; Mohamed, A. Geotechnical investigation and stabilization of soils through limestone powder at Abbottabad, Khyber-Pakhtunkhwa, Pakistan: A cost effective and sustainable approach. Front. Earth Sci. 2023, 11, 1243975. [Google Scholar] [CrossRef]
  31. Bahrami, S.; Moore, F.; Keshavarzi, B. Evaluation, source apportionment and health risk assessment of heavy metal and polycyclic aromatic hydrocarbons in soil and vegetable of Ahvaz metropolis. Hum. Ecol. Risk Assess. 2019, 27, 71–100. [Google Scholar] [CrossRef]
  32. Saleem, M.; Pierce, D.; Wang, Y.; Sens, D.A.; Somji, S.; Garrett, S.H. Heavy Metal(oid)s Contamination and Potential Ecological Risk Assessment in Agricultural Soils. J. Xenobiotics 2024, 14, 634–650. [Google Scholar] [CrossRef]
  33. Kelepertzis, E. Accumulation of Heavy Metals in Agricultural Soils of Mediterranean: Insights from Argolida Basin, Peloponnese, Greece. Geoderma 2014, 221–222, 82–90. [Google Scholar] [CrossRef]
  34. Parvez, M.S.; Nawshin, S.; Sultana, S.; Hossain, M.S.; Rashid Khan, M.H.; Habib, M.A.; Nijhum, Z.T.; Khan, R. Evaluation of heavy metal contamination in soil samples around Rampal, Bangladesh. ACS Omega 2023, 8, 15990–15999. [Google Scholar] [CrossRef] [PubMed]
  35. Yan, X.; Chen, X.; Zheng, W.; Zhang, G.; Dong, A. Heavy Metals in the Sediments of Dongshan Bay, China: Sources, Distribution, and Controlling Factors. Water 2024, 16, 905. [Google Scholar] [CrossRef]
  36. Budai, P.; Clement, A. Spatial distribution patterns of four traffic-emitted heavy metals in urban road dust and the resuspension of brake-emitted particles: Findings of a field study. Transp. Res. Part D Transp. Environ. 2018, 62, 179–185. [Google Scholar] [CrossRef]
  37. Merlin, O.H.; Salvador, G.L.; Vitturi, L.M.; Pistolato, M.; Rampazzo, G. Geochemical characteristics of western Ross Sea (Antarctica) sediments. Mar. Geol. 1991, 99, 209–229. [Google Scholar] [CrossRef]
  38. Santos, I.R.; Silva-Filho, E.V.; Schaefer, C.E.; Albuquerque-Filho, M.R.; Campos, L.S. Heavy metal contamination in coastal sediments and soils near the Brazilian Antarctic Station, King George Island. Mar. Pollut. Bull. 2005, 50, 185–194. [Google Scholar] [CrossRef]
  39. Kashem, M.A.; Singh, B.R. Heavy metal contamination of soil and vegetation in the vicinity of industries in Bangladesh. Water Air Soil Pollut. 1999, 115, 347–361. [Google Scholar] [CrossRef]
  40. Ahmad, J.U.; Goni, M.A. Heavy metal contamination in water, soil, and vegetables of the industrial areas in Dhaka, Bangladesh. Environ. Monit. Assess. 2010, 166, 347–357. [Google Scholar] [CrossRef] [PubMed]
  41. Mallick, S.R.; Proshad, R.; Islam, M.S.; Sayeed, A.; Uddin, M.; Gao, J.; Zhang, D. Heavy metals toxicity of surface soils near industrial vicinity: A study on soil contamination in Bangladesh. Arch. Agric. Environ. Sci. 2019, 4, 356–368. [Google Scholar] [CrossRef]
  42. Rahman, M.T.; Ziku, A.L.M.E.; Choudhury, T.R.; Ahmed, J.U.; Mottaleb, M.A. Heavy metal contaminations in vegetables, soils and river water: A comprehensive study of Chilmari, Kurigram, Bangladesh. Int. J. Environ. Ecol. Fam. Urban Stud. 2015, 5, 29–42. [Google Scholar]
  43. Marrugo-Negrete, J.; Pinedo-Hernández, J.; Díez, S. Assessment of heavy metal pollution, spatial distribution and origin in agricultural soils along the Sinú River Basin, Colombia. Environ. Res. 2017, 154, 380–388. [Google Scholar] [CrossRef]
  44. Wedepohl, K.H. The composition of the continental crust. Geochim. Cosmochim. Acta 1995, 59, 1217–1232. [Google Scholar] [CrossRef]
  45. Islam, M.R.; Wang, Q.; Guo, Y.; Wang, W.; Sharmin, S.; Enyoh, C.E. Physico-chemical characterization of food wastes for potential soil application. Processes 2023, 11, 250. [Google Scholar] [CrossRef]
  46. Diganta, M.T.M.; Sharmi, T.T.; Saifullah, A.S.M.; Uddin, M.J.; Sajib, A.M. Appraisal of heavy metal contamination in road dust and human health risk in a Municipality of Bangladesh. Environ. Eng. Manag. J. 2020, 19, 2165–2177. [Google Scholar]
  47. Chen, H.; Teng, Y.; Lu, S.; Wang, Y.; Wang, J. Contamination features and health risk of soil heavy metals in China. Sci. Total Environ. 2015, 512–513, 143–153. [Google Scholar] [CrossRef]
  48. Rana, M.S.; Wang, Q.; Wang, W.; Enyoh, C.E.; Islam, M.R.; Isobe, Y.; Kabir, M.H. Sources, distribution, and health implications of heavy metals in street dust across industrial, capital city, and peri-urban areas of Bangladesh. Atmosphere 2024, 15, 1088. [Google Scholar] [CrossRef]
Figure 1. Sampling sites on Bangladesh map.
Environments 12 00198 g001
Figure 2. Heavy metal concentration in different agricultural soils (bars annotated with different letters differ significantly at the statistical level).
Environments 12 00198 g002
Figure 3. Heavy metal concentration of different soil depths in different agricultural soils.
Environments 12 00198 g003
Figure 4. PCA of heavy metal concentration in different agricultural soils.
Environments 12 00198 g004
Figure 5. Pollution Load Index in different agricultural soils.
Environments 12 00198 g005
Table 3. Pearson correlation of heavy metal concentration in different agricultural soils.
CrMnNiCuZnPb
Research area
Cr1
Mn0.3091
Ni0.4170.769 *1
Cu0.4770.768 *0.794 *1
Zn0.3990.839 **0.672 *0.839 **1
Pb0.3060.949 **0.795 *0.885 **0.883 **1
Industrial area
Cr1
Mn−0.1381
Ni0.6500.1371
Cu0.559−0.2760.0951
Zn−0.0520.024−0.2010.1061
Pb0.462−0.2120.4040.6140.4591
Local market area
Cr1
Mn0.678 *1
Ni0.216−0.1091
Cu0.029−0.0130.3171
Zn0.6350.944 **−0.186−0.0741
Pb0.6380.2460.545−0.0340.3171
Coastal area
Cr1
Mn−0.0711
Ni0.3870.4221
Cu0.4950.0700.849 **1
Zn0.5550.1310.787 *0.721 *1
Pb0.5830.4120.959 **0.847 **0.848 **1
Rural area
Cr1
Mn0.1771
Ni0.3680.0951
Cu0.216−0.5470.2711
Zn−0.2750.747 *−0.254−0.2521
Pb−0.074−0.0790.4110.694 *0.1691
[Correlation is significant at the 0.05 level * and at the 0.01 level **].
Table 4. Average daily intake of different heavy metals in agricultural soils.
AreasCrMnNiCuZnPb
Ingestion
Research area2.58 × 10−113.10 × 10−108.13 × 10−128.26 × 10−126.14 × 10−115.47 × 10⁻¹²
Industrial area1.70 × 10−117.72 × 10−114.16 × 10−122.22 × 10−127.12 × 10−111.92 × 10⁻¹¹
Local market area1.67 × 10−115.11 × 10−115.48 × 10−127.19 × 10−124.96 × 10−115.39 × 10⁻¹²
Coastal area3.16 × 10−117.10 × 10−102.03 × 10−112.10 × 10−118.00 × 10−117.13 × 10⁻¹²
Rural area7.62 × 10−129.59 × 10−113.01 × 10−124.36 × 10−123.77 × 10−113.64 × 10⁻¹²
Inhalation
Research area3.80 × 10−94.56 × 10−81.20 × 10−91.21 × 10−99.03 × 10−98.04 × 10⁻¹⁰
Industrial area2.50 × 10−91.14 × 10−86.11 × 10−103.26 × 10−101.05 × 10−82.83 × 10−9
Local market area2.46 × 10−97.51 × 10−98.06 × 10−101.06 × 10−97.29 × 10−97.93 × 10⁻¹⁰
Coastal area4.65 × 10−91.04 × 10−72.98 × 10−93.09 × 10−91.18 × 10−81.05 × 10⁻⁹
Rural area1.12 × 10−91.41 × 10−84.43 × 10−106.41 × 10−105.55 × 10−95.36 × 10−10
Dermal
Research area1.03 × 10−91.24 × 10−83.24 × 10−103.30 × 10−102.45 × 10−92.18 × 10−10
Industrial area6.79 × 10−103.08 × 10−91.66 × 10−108.84 × 10−112.84 × 10−97.68 × 10−10
Local market area6.66 × 10−102.04 × 10−92.19 × 10−102.87 × 10−101.98 × 10−92.15 × 10−10
Coastal area1.26 × 10−92.83 × 10−88.10 × 10−108.38 × 10−103.19 × 10−92.84 × 10−10
Rural area3.04 × 10−103.82 × 10−91.20 × 10−101.74 × 10−101.51 × 10−91.45 × 10−10
Table 5. LADD of heavy metals in different agricultural soils.
AreasCrMnNiCuZnPb
Ingestion
Research area6.52 × 10−117.82 × 10−102.05 × 10−112.09 × 10−111.55 × 10−101.38 × 10⁻¹¹
Industrial area4.3 × 10−111.95 × 10−101.1 × 10−115.6 × 10−121.8 × 10−104.86 × 10⁻¹¹
Local market area4.22 × 10−111.29 × 10−101.38 × 10−111.82 × 10−111.25 × 10−101.36 × 10⁻¹¹
Coastal area7.99 × 10−111.79 × 10−95.13 × 10−115.3 × 10−112.02 × 10−101.8 × 10⁻¹¹
Rural area1.92 × 10−112.42 × 10−107.6 × 10−121.1 × 10−119.53 × 10−119.2 × 10⁻¹²
Inhalation
Research area4.9 × 10−95.88 × 10−81.54 × 10−91.57 × 10−91.17 × 10−81.04 × 10⁻⁹
Industrial area3.23 × 10−91.46 × 10−87.9 × 10−104.2 × 10−101.35 × 10−83.65 × 10−9
Local market area3.17 × 10−99.69 × 10−91.04 × 10−91.36 × 10−99.4 × 10−91.02 × 10⁻⁹
Coastal area6 × 10−91.35 × 10−73.85 × 10−93.98 × 10−91.52 × 10−81.35 × 10⁻⁹
Rural area1.45 × 10−91.82 × 10−85.71 × 10−108.27 × 10−107.16 × 10−96.91 × 10−10
Dermal
Research area1.82 × 10−92.18 × 10−85.72 × 10−105.81 × 10−104.32 × 10−93.85 × 10−10
Industrial area1.2 × 10−95.43 × 10−92.9 × 10−101.6 × 10−105.01 × 10−91.35 × 10−9
Local market area1.17 × 10−93.59 × 10−93.86 × 10−105.06 × 10−103.49 × 10−93.79 × 10−10
Coastal area2.23 × 10−94.99 × 10−81.43 × 10−91.48 × 10−95.62 × 10−95.01 × 10⁻¹⁰
Rural area5.36 × 10−106.74 × 10−92.12 × 10−103.07 × 10−102.66 × 10−92.56 × 10−10
Table 6. Cumulative cancer risk (CCR) of different areas.
AreaCrZnPbNiCumulative CR
IngestionInhalationIngestionIngestionInhalation
Research area5.54 × 10−132.06 × 10−61.32 × 10−128.42 × 10−111.29 × 10−92.06 × 10−6
Industrial area3.66 × 10−131.36 × 10−61.53 × 10−122.96 × 10−106.64 × 10−101.36 × 10⁻⁶
Local market area3.59 × 10−131.33 × 10−61.06 × 10−128.30 × 10−118.74 × 10−101.33 × 10⁻⁶
Coastal area6.79 × 10−132.52 × 10−61.72 × 10−121.10 × 10−103.23 × 10−92.52 × 10−6
Rural area1.63 × 10−136.09 × 10−78.10 × 10−135.61 × 10−114.80 × 10−106.10 × 10⁻⁷
Disclaimer/Publisher’s Note: The statements, opinions and data contained in all publications are solely those of the individual author(s) and contributor(s) and not of MDPI and/or the editor(s). MDPI and/or the editor(s) disclaim responsibility for any injury to people or property resulting from any ideas, methods, instructions or products referred to in the content.

