Article

Reduced Graphene Oxide Modulates Physiological Responses of Lemna minor Under Environmental Heavy Metal Stress

by
Marco D’Eugenio
1,2,3,
Barbara Casentini
2 and
M. Adelaide Iannelli
3,*
1
Department of Environmental Biology, Sapienza Università di Roma, 00185 Rome, Italy
2
Water Research Institute, National Research Council (IRSA-CNR), Montelibretti, 00010 Rome, Italy
3
Institute of Agricultural Biology and Biotechnology, National Research Council (IBBA-CNR), Montelibretti, 00010 Rome, Italy
*
Author to whom correspondence should be addressed.
Environments 2025, 12(11), 407; https://doi.org/10.3390/environments12110407
Submission received: 1 August 2025 / Revised: 23 October 2025 / Accepted: 30 October 2025 / Published: 1 November 2025

Abstract

The expanding development of graphene-based materials (GBMs) requires immediate and balanced environmental assessment balancing two key areas: investigating the risk of graphene oxide toxicity to ecosystems and evaluating GBMs’ potential to act as solutions for challenges like heavy metal stress mitigation. This study analyzed the effects of reduced graphene oxide (rGO) on copper (Cu) and nickel (Ni) toxicity in Lemna minor. Our findings reveal that rGO’s protective effects are metal-specific. L. minor demonstrated significant sensitivity to nickel, but rGO offered no mitigation; growth parameters, pigment content, and nickel accumulation showed no significant improvements with rGO co-exposure compared to Ni-plants. This suggests that rGO does not enhance L. minor’s ability to tolerate or absorb nickel, especially after 14 days (T14). In contrast, rGO showed a partially protective effect against copper toxicity. At T14, the presence of rGO significantly improved plant performance under copper stress, resulting in a 17% increase in biomass, a 19% increase in relative growth rate, and enhanced pigment content, including a 40% increase in chlorophyll when compared to Cu-plants. The protective effect of rGO was directly tied to a 37% reduction in copper accumulation, providing strong evidence that rGO reduces copper’s bioavailability, thereby limiting plant uptake. The divergent effects on Cu and Ni uptake suggest differing affinities of these metals for rGO. Future research, including large-scale experiments with various GBMs and Lemna clones, is crucial to fully assessing their phytoremediation potential.

1. Introduction

Graphene-based materials (GBMs) have garnered significant attention due to their exceptional structural, physical, and chemical properties, making them increasingly prevalent in different industries such as biosensors, wearable devices, energy storage, robotics, electrochemical sensors, and the textile industry [1,2,3,4,5]. However, their widespread adoption is constrained by the high cost and complexity of production. Consequently, economic feasibility is highly segmented: viable only in high-value applications that justify the expense. The current landscape is characterized by a significant trade-off between quality and cost. Despite this hurdle, the market is expanding rapidly, with global production of GBMs projected to reach 3800 tons annually by 2026, pushing the total market valuation to an estimated USD 656.9 million by 2027 [6].
The growing use of graphene-based materials (GBMs) stems from their unique combination of properties, including large surface area, electrical conductivity, mechanical strength, and chemical reactivity [7]. One of the most significant emerging uses of GBMs is in the adsorption of metal ions for environmental remediation. Graphene materials, particularly those with functional surface groups like carboxyl, hydroxyl, and epoxy, are known to form stable dispersions that can facilitate the removal of toxic heavy metals from water sources. The surface functionality plays a pivotal role in metal ion recovery, as these groups can effectively bind to metal ions such as Pb2+, Cd2+, Cu2+, and Cr3+ [8].
However, once released into aquatic environments, graphene-based materials (GBMs) are likely to interact with various natural constituents, including natural organic matter, inorganic ions, colloidal particles, and biocolloids. A recent study by Wu et al. [9] emphasized the critical role of humic acid in influencing the stability of nanoparticle suspensions in water. Similarly, it was reported that the presence of divalent ions can promote the aggregation of graphene oxide, thereby significantly altering its behavior in natural systems [10].
The inherent complexity of GBMs’ behavior in aquatic systems, driven by dynamic aggregation and dispersion, directly influences their environmental fate and long-term ecological exposure. Consequently, current hazard analyses, based on estimated predicted no-effect concentrations (PNECs) in European freshwaters [11], suggest a negligible environmental risk, but the potential ecotoxicity of GBMs still necessitates rigorous environmental risk assessment (ERA) to mitigate the risks of water body pollution and ecosystem disruption. Therefore, the core objective is to determine the optimal concentration that rigorously balances the maximization of benefits for water quality and aquatic macrophytes against the requirement of maintaining demonstrably safe, established ecological limits.
Furthermore, heavy metals are frequently detected in aquatic environments, and due to their known interactions with graphene-based materials, investigating their behavior in the presence of GBMs is of significant interest for understanding potential environmental impacts.
Among graphene-based materials, reduced graphene oxide (rGO) is a chemically, thermally, or otherwise processed form of graphene oxide (GO), characterized by a significantly reduced oxygen content (Figure 1).
Functioning as an intermediate between GO and pristine graphene, rGO combines features of both materials. It retains some oxygen-containing functional groups and structural defects from GO, while regaining key properties of graphene—such as enhanced electrical conductivity, mechanical strength, and optical performance. These characteristics make rGO not only comparable to pristine graphene in performance but also advantageous due to its relative ease of synthesis at scale and its tunable surface chemistry [1].
Despite its increasing use, the capacity of rGO to interact with heavy metals and other environmental contaminants in aquatic systems remains relatively underexplored. The surface functional groups of rGO facilitate interactions with metal ions, influencing their mobility, bioavailability, and potential toxicity in the environment. Recent studies have demonstrated that rGO exhibits a notable affinity for metal adsorption. For instance, Sarmiento et al. [13] reported a maximum adsorption capacity (Qm) of 55.34 mg Cu g−1 rGO for copper. Additionally, the adsorption capacity of rGO at 25 °C was found to range from 173.41–396.63 mg g−1 for Pb (II), 41.11–115.25 mg g−1 for Cd (II), 38.94–54.17 mg g−1 for Cu (II), and 22.97–38.61 mg g−1 for Mn (II). Further advancements include the development of violuric-acid-functionalized rGO, which achieved near-complete removal (up to 99.9%) of Hg2+, Pb2+, and As3+ within just 10 min [14]. Similarly, a rGO–titanate hybrid composite demonstrated enhanced adsorption capacities of 530.5 mg g−1 for Pb2+, 201 mg g−1 for Cd2+, and 130.5 mg g−1 for Cu2+, showing both rapid kinetics and potential for reusability in water treatment systems [15]. These findings highlight the potential of rGO as an effective material for metal ion removal and water remediation.
Graphene-based materials (GBMs) have been reported to exhibit toxicity across a wide range of organisms, including bacteria [16], fungi [17], and animals [18]. In plants, the degree of toxicity is influenced by multiple factors such as exposure concentration, plant species, and the surface chemistry of the GBMs [19,20].
The impact of rGO on plants is complex and context-dependent. While high rGO concentrations and prolonged exposure generally lead to toxicity characterized by oxidative stress, impaired growth, and nutrient imbalance, certain applications, such as in drought conditions or under metal stress, may offer protective benefits. For example, in Brassica napus L., exposure to rGO at a concentration of 1000 mg L−1 led to a 26.8% reduction in shoot length and a 27.7% increase in root length, along with a 70% decline in reduced glutathione (GSH) content—an indicator of heightened oxidative stress [21]. Similarly, rGO has shown phytotoxic effects in aquatic photosynthetic organisms. In the green alga Scenedesmus obliquus (Turpin) Kützing, rGO exposure led to significant inhibition of chlorophyll a, structural damage, membrane disruption, and oxidative stress [22]. In Lemna minor L., exposure to rGO resulted in pronounced growth inhibition, highlighting the dose-dependent toxicity of rGO in aquatic plant systems, for example, rGO concentrations ranging from 100 to 200 mg L−1 resulted in pronounced growth inhibition, with a calculated LC10 of ~144 mg L−1—higher than that observed for graphene oxide (GO) [23]. Conversely, rGO demonstrated beneficial effects in alleviating lead (Pb) toxicity in wheat plants by enhancing chlorophyll content, reducing Pb uptake, and mitigating reactive oxygen species (ROS) accumulation, ultimately promoting plant growth and physiological performance [24].
Aquatic species of the genus Lemna (commonly called duckweeds) have demonstrated a high capacity to absorb various contaminants [25,26,27,28] and are suitable for the phytoremediation of wastewater polluted with heavy metals [29]. Furthermore, in environmental toxicology studies, these plants are considered as model organisms suitable for toxicity tests due to their small size, simple structure, asexual reproduction, short generation time, and high sensitivity to pollutants [30]. To date, there is a lack of comprehensive studies evaluating whether reduced graphene oxide (rGO) can mitigate the toxic effects of heavy metals in aquatic plants such as duckweed. This study aims to assess the effects of rGO on the aquatic macrophyte L. minor when co-exposed to heavy metals commonly found in aquatic ecosystems due to anthropogenic activities. Two 14-day co-exposure experiments were conducted to investigate the physiological and biochemical responses of L. minor to a fixed concentration of rGO when combined with fixed concentrations of nickel (Ni) or copper (Cu). The results were compared to determine how the type of metal influences the plant’s response to rGO–metal co-exposure. Therefore, elucidating the combined toxicity of rGO and other contaminants might contribute to our understanding of their environmental impact.

2. Materials and Methods

2.1. Reduced Graphene Oxide (rGO)

Reduced graphene oxide (rGO) powder (fully reduced, with a carbon content of approximately 98.5–99% by weight) was purchased from LayerOne (Norway). According to the manufacturer, this rGO material is suitable for applications such as anti-corrosion coatings, composites, thermal interface materials, flame-retardant additives, conductive elastomers, batteries, and supercapacitors. The rGO was used without further purification. The rGO (1 g L−1) stock solution, prepared in distilled water, underwent 30 min of sonication in an ultrasonic bath. Subsequently, the 1 mg L−1 rGO solutions for the co-exposure experiments were prepared by diluting this stock in mineral water (Table S1).

2.2. Plant Material and Experimental Design

Lemna minor 5500 (L. minor—County Cork, Blarney, Ireland), obtained from the CNR-IBBA-MIDW collection, was initially cultivated in Petri dishes (Ø 13.5 cm) containing 100 mL of Schenk–Hildebrandt (SH) medium (Duchefa-Micropolis, Cesano Boscone (MI), Italy) supplemented with 0.5% (w/v) sucrose. Cultivation occurred in a growth chamber at 23–25 °C with a 16/8 h light/dark photoperiod and a light intensity of 100 µmol m−2 s−1 (PPFD). Following initial cultivation, plants were acclimatized for 3 days in mineral water (Table S1) to simulate environmentally relevant conditions. Before the co-exposure experiments, we conducted preliminary phytotoxicity tests on rGO, nickel (Ni), and copper (Cu) individually. These tests followed optimized protocols based on OECD (2006) [31] guidelines, with further details available in the Supplementary Material (Preliminary Phytotoxicity Test) (Table S2).
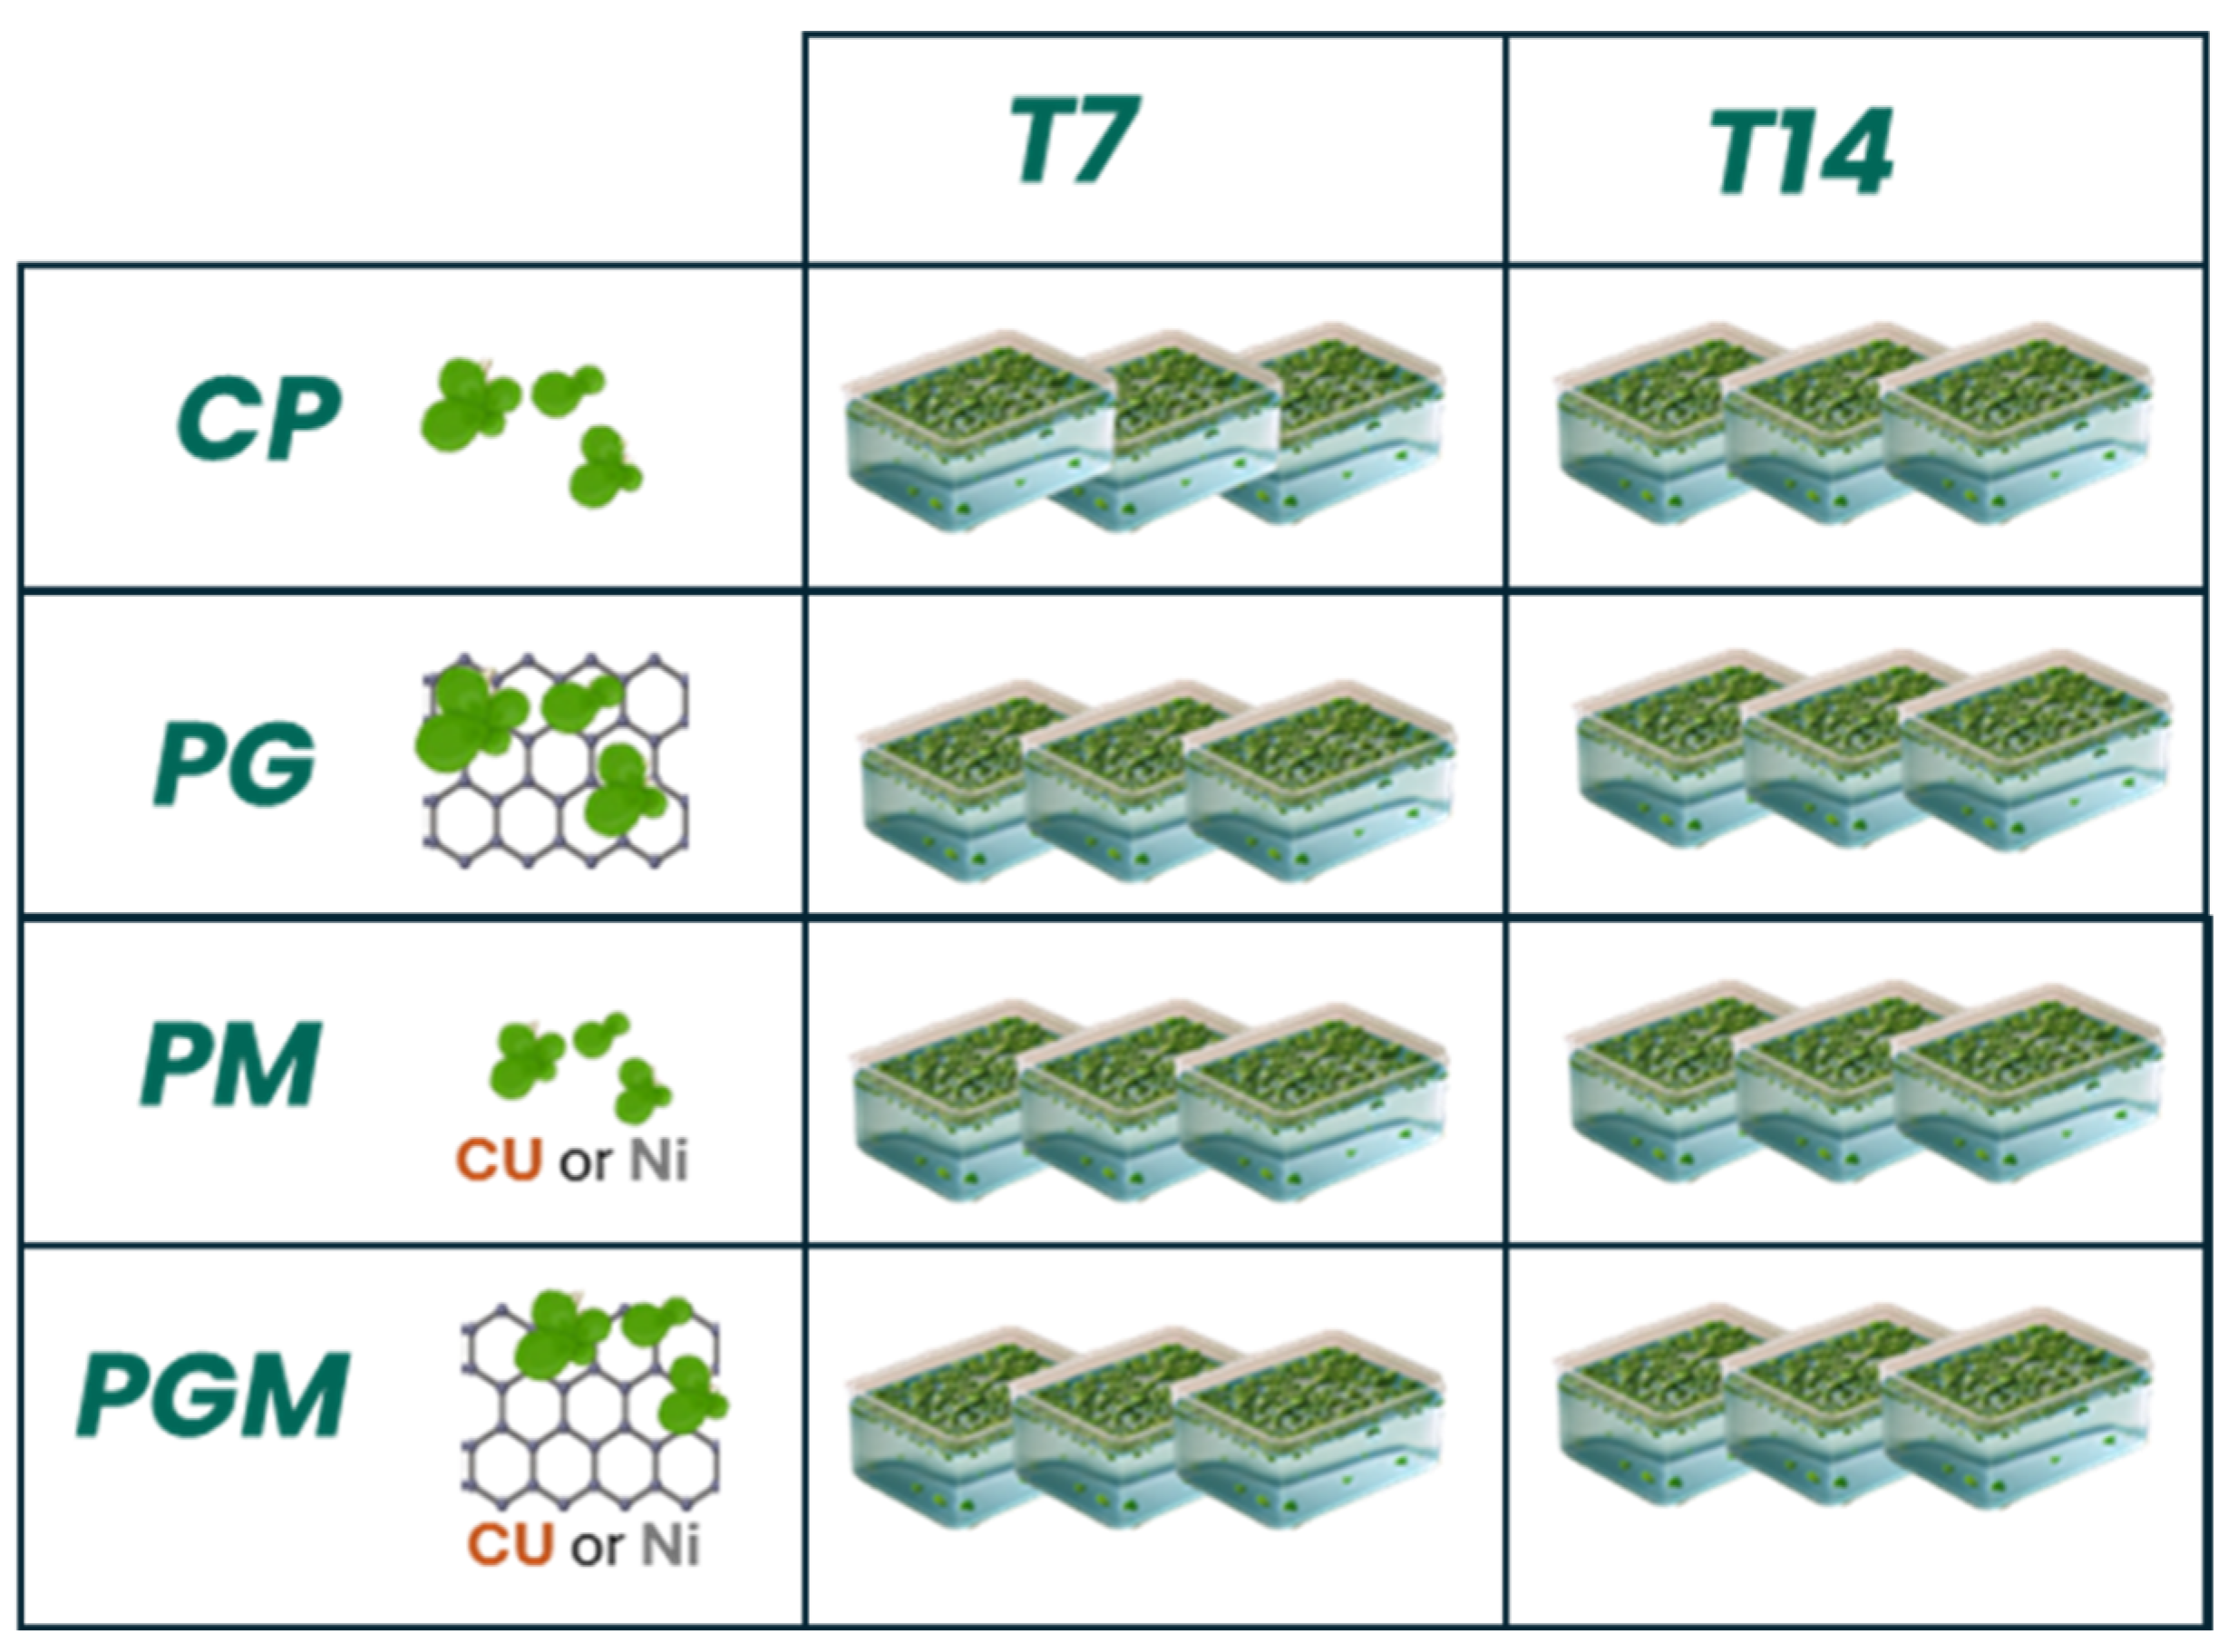
Co-exposure experiments were then carried out by exposing L. minor to 1 mg L−1 rGO in combination with either 1.33 mg L−1 Ni or 1 mg L−1 Cu. We utilized sub-lethal concentrations of copper (Cu) and nickel (Ni) that were close to the estimated 20% effective concentration (EC20) for chlorophyll reduction. This specific approach was chosen because it allows for the investigation of chronic and long-term effects on plant health, which higher, acutely toxic concentrations would obscure. This methodology directly reflects real-world scenarios, where heavy metals typically occur at low, yet persistent, environmental levels [32]. All experiments were performed in controlled growth chambers at the Institute of Agricultural Biology and Biotechnology (IBBA) of the National Research Council (CNR). The environmental conditions remained consistent with initial cultivation: 23–25 °C, a 16/8 h light/dark photoperiod, and 100 µmol m−2 s−1 PPFD. Approximately 2 g of fresh biomass of L. minor, each consisting of three fronds, was pre-acclimated in mineral water and then transferred to 200 mL glass containers (10 × 10 × 8 cm) for the experimental treatments. Each treatment was performed in triplicate and included the following groups: plants exposed to mineral water only (CP); plants exposed to 1 mg L−1 rGO (PG); plants exposed to metal only (PM) (either 1.33 mg L−1 Ni or 1 mg L−1 Cu); and plants co-exposed to rGO and metal (Ni or Cu; PGM) at the same respective concentrations. The complete experimental design is summarized in Figure 2.

2.3. Accumulation of Nickel (Ni) and Copper (Cu)

Stock solutions were prepared using copper (II) sulfate pentahydrate (CuSO4·5H2O, Acros Organics, Belgium, WI, USA) and nickel (II) chloride hexahydrate (NiCl2·6H2O, Sigma-Aldrich, Spruce St, St. Louis, Missouri, USA). The Ni and Cu concentrations were quantified in both the growth media and L. minor plants at two exposure time points: 7 days (T7) and 14 days (T14). For media analysis, approximately 10 mL of solution was collected, filtered using 20 µm mesh filter paper (VWR, Darmstadt, Germany), and acidified to a final concentration of 1% with nitric acid (HNO3). Samples were then stored at 4 °C until analysis. For plant analysis, fronds (1.0 g fresh weight) were prepared by gentle immersion and rinsing in distilled water to remove surface contaminants, then carefully blotted dry using clean, lint-free wipes. The washed fronds were then oven-dried at 60 °C for 72 h (or until constant weight was achieved) before further processing. Approximately 0.1 g dried plant material was digested in Teflon vessels using a microwave digestion system (EXCEL Microwave Chemistry Workstation, Preekem Scientific Instruments Co., Ltd., Shanghai, China). The digestion mixture consisted of 4 mL HNO3 (96%), 1 mL H2O2 (35%), and 4 mL distilled water using a microwave digestion system (EXCEL Microwave Chemistry Workstation, Preekem Scientific Instruments Co., Ltd., Shanghai, China).
Nickel and copper concentrations were determined using inductively coupled plasma optical emission spectrometry (ICP-OES, Agilent 5800, Santa Clara, CA, USA) with a limit of detection (LOD) of 0.02 mg L−1.

2.4. Bioconcentration Factor of Nickel and Copper

The bioconcentration factor (BCF) was used to quantify L. minor’s ability to accumulate Ni and Cu from the growth medium into its plant tissues [33]. This factor was calculated as:
BCF = Ni or Cu content in plant tissues (mg kg−1 DW)/Ni or Cu content in growth medium (mg L−1)
By determining metal concentrations in both compartments, the BCF allowed for the evaluation of Ni and Cu accumulation and removal by L. minor in the presence or absence of rGO.

2.5. Plant Growth Analyses

To evaluate L. minor biomass production and its change over time, we measured both fresh weight (FW) and dry weight (DW) of fronds at each time point. All fronds were harvested and immediately weighed for FW determination. For DW, three representative subsamples were oven-dried at 60 °C for 72 h to achieve constant weight. The relative growth rate (RGR) (g g−1 day−1) was calculated for each time interval (T7 and T14) according to the formula proposed by Radford [34]:
RGR = (ln DWf − ln DWi)/(Tf − Ti)
where: DWf = final dry weight (g), DWi = initial dry weight (g), Tf = overall incubation period (day), Ti = initial time (day) at each timepoint.

2.6. Determination of Pigment Content

Photosynthetic pigments of Lemna fronds (0.1 g) were extracted in 96% (v/v) ethanol for 72 h at room temperature in the dark. After centrifugation at 3000× g for 10 min at 4 °C, the absorbance of the supernatant was measured spectrophotometrically at 663 nm, 645 nm, and 470 nm (Lambda 35 UV/VIS, Perkin Elmer, Norwalk, CT, USA). The total chlorophyll and carotenoid contents were assessed according to the equations described by Lichtenthaler et al. [35] and the results are expressed in mg of the total chlorophyll or carotenoids per gram of fresh weight plant tissue (mg g−1 FW).

2.7. Measurement of Lipid Peroxidation Level

Oxidative damage in Lemna was determined by measuring malondialdehyde (MDA) content, a key biomarker of membrane lipid peroxidation and plant stress, according to the Heath and Packer protocol [36]. Frozen samples (0.2 g) were homogenized in a pre-cooled mixer mill (TissueLyser LT, Quiagen, Hielden, Germany) with 1 mL of 0.1% trichloroacetic acid (TCA) and centrifuged for 10 min at 13,000× g at 4 °C. An assay mixture containing 0.4 mL of supernatant, 1 mL of 0.5% (w/v) thiobarbituric acid (TBA) in 20% (w/v) TCA, and 1 mM ethylenediamine tetraacetic acid (EDTA) was incubated at 80 °C for 30 min and then quickly cooled in an ice bath. Then samples were centrifuged at 13,500× g for 10 min at 4 °C, and the absorbance of the supernatant was measured at 532 nm and 600 nm with a Thermo Multiskan FC Microplate Photometer (Thermo Fisher Scientific; Waltham, MA, USA). Values corresponding to non-specific absorption at 600 nm were subtracted. The MDA concentration was calculated using the extinction coefficient (ε = 155 mM−1 cm−1). The lipid peroxidation levels are expressed as nanomoles of MDA per gram of fresh weight plant tissue (mg g−1 FW).

2.8. Biochemical Assays of Antioxidant Enzyme Activities

To determine antioxidant enzyme activities, in L. minor grown with rGO and Cu, frozen samples (0.2–0.5 g fresh weight) were homogenized in a pre-cooled mixer mill (TissueLyser LT, Quiagen, Hielden, Germany) with 2 mL of the extraction buffer consisting of 50 mM cold phosphate (pH 7.0), 0.1% ascorbic acid, 0.1% Triton X-100, 1 mM EDTA, and 7.5% polyvinylpyrrolidone. After homogenization, samples were centrifuged at 15,000× g for 30 min at 4 °C, and the clear supernatant was collected for enzyme assays. Catalase (CAT, EC 1.11.1.6) activity was determined by monitoring the decomposition of hydrogen peroxide (H2O2) at 240 nm (ε = 39.4 mM−1 cm−1), following the method of Aebi [37]. The reaction mixture contained 50 mM potassium phosphate buffer (pH 7.0), 10 mM H2O2, and enzyme extract in a total volume of 1 mL. CAT activity was expressed as μmol H2O2 decomposed per gram of fresh weight (μmol H2O2 gF W−1 min−1). Glutathione-S-transferase (GST, EC 2.5.1.18) activity was measured according to Habig [38], using a reaction buffer containing 0.1M phosphate buffer (pH 6.5), 1 mM reduced glutathione (GSH), 1 mM 1-chloro-2,4-dinitrobenzene (CDNB), and the enzyme extract. The conjugation of CDNB with GSH was monitored at 340 nm (ε = 9.6 mM−1 cm−1) at 25 °C. GST activity was expressed as nmol CDNB g FW−1 min−1. All spectrophotometric measurements were carried out using a Thermo Multiskan FC Microplate Photometer (Thermo Fisher Scientific, Waltham, MA, USA).

2.9. Statistical Analysis

The results are presented with arithmetic means and relative standard deviations of 3 biological replicates for each treatment for the two sampling times (T7 and T14). All data were checked for normality through Shapiro–Wilk’s test before analyses of variance. Differences between treatments were tested for significance using two-way analysis of variance (ANOVA) with RStudio (version RStudio 2025.05.1+513) software, then a post hoc analysis was performed with Duncan’s test, specifically chosen to perform all pairwise comparisons between group means to pinpoint exactly where those significant differences lie. The data in each figure with the same letter are not significantly different at the p < 0.05 level. Asterisks indicate significant differences between time and treatments, as well as of their interaction (*** = 0.001; ** = 0.01; * = 0.05; ns = no significant). The p value and associated asterisks are described in the Supplementary Materials (Table S3A,B).

3. Results and Discussion

Our initial investigation confirms that reduced graphene oxide (rGO) does not induce toxic effects in L. minor when administered alone. More significantly, our findings indicate that rGO effectively mitigates copper toxicity in L. minor by reducing its accumulation, particularly during longer exposure periods. However, this beneficial effect was notably less pronounced in the nickel (Ni) co-exposure, suggesting a differential interaction. This distinction is likely attributable to the varying redox potentials and distinct cellular uptake mechanisms of the metals in plants combined with rGO’s differential affinity for copper versus nickel ions [39]. The following sections detail these co-exposure results. Based on the minimal variation observed in the preliminary data from the rGO–Ni treatments, the subsequent biochemical assays of antioxidant enzyme activity were conducted exclusively within the rGO–Cu context, thereby focusing our mechanistic investigation on the group where mitigation was evident.

3.1. Effects of Reduced Graphene Oxide and Nickel to L. minor

3.1.1. Growth Analysis

The total biomass content (FW) of L. minor directly indicates the plant’s response to stress, and it was significantly influenced by exposure time and the interaction between the treatments, in particular Ni exposure (p < 0.001; Table S3A, Figure 3). In the presence of reduced graphene oxide (rGO), no statistically significant differences in fresh weight biomass were observed between the rGO-treated group (PG) and the control plants (CP) at T7. However, by T14, a significant 10% reduction in FW was observed in the presence of rGO (Figure 3).
Our findings indicate that the interaction between L. minor and reduced graphene oxide (rGO) does not negatively impact biomass growth. This aligns with research by Malina et al. [40], who observed no negative effect on L. minor biomass production across all tested graphene oxide (GO) types and concentrations (0.25, 2.5, and 25 mg L−1). This suggests a consistent trend of L. minor’s tolerance to graphene-based materials at environmentally relevant concentrations.
Exposure to nickel (PM) significantly reduced L. minor plant biomass by 36% (T7) and 46% (T14) relative to control plants (CP), confirming its pronounced phytotoxicity. Similar findings were reported by Goswami et al. [41] where fresh biomass decreased with increasing Ni concentrations after 22 days of exposure. Co-exposure to rGO and nickel (PGM) resulted in comparable reductions in FW by 32% (T7) and 45% (T14) relative to CP. The relative growth rate (RGR) of L. minor plants followed the trend observed in biomass content (Figure 3B). Both PM and PGM treatments exhibited reduced RGR compared to the control (CP), with decreases of 43% and 36% at T7 and 44% and 42% at T14, respectively. In a study by Khellaf et al. [42], L. gibba showed a 50% reduction in growth at 0.75 mg L−1 Ni and complete growth inhibition at 1 mg L−1 Ni after 4 days [42]. In contrast, L. minuta exhibited only a slight reduction in growth, 22.5% at T7 and 20% at T14, at the highest tested Ni concentration (6 mg L−1 Ni) compared to control plants [28], suggesting a species-, concentration-, and time-dependent response to nickel exposure. Absences of statistically significant differences (p > 0.05) in biomass content or RGR were observed between PGM and PM treatments at any sampling time, indicating that rGO does not mitigate the toxic effects of nickel in L. minor.

3.1.2. Pigment Contents

Analysis of photosynthetic pigments revealed significant responses of L. minor to rGO and heavy metal exposure (Ni), influenced by exposure time and the interaction between the different treatments (p < 0.001; Table S3A, Figure 4).
At seven days (T7), L. minor treated with reduced graphene oxide (PG) exhibited non-statistically significant increases in total chlorophyll (7%) and carotenoid (8%) content when compared to control plants (CP) (Figure 4A,B). This observation indicates that rGO alone does not exert a detrimental effect on plant pigment content, a conclusion consistent with findings from other plant studies [24,43]. In contrast, at the same time point (T7), plants exposed to copper (PM) showed a more pronounced 24% reduction in chlorophyll content relative to controls, whereas the co-exposure group (PGM) experienced a 20% decrease. Moving to 14 days (T14), a significant difference in total chlorophyll content became apparent: both PM and PGM treatments resulted in substantial decreases of 70% and 68%, respectively, when compared specifically to the control plants (CP).
Our findings regarding the reduction in total chlorophyll content align with previous research. For instance, Mukhtari et al. [44] reported decreased chlorophyll in sunflowers exposed to Ni in a hydroponic environment. Similarly, a study on canola plants treated with 0.5 mM (29.3 mg L−1) Ni showed a significant 61% decrease in chlorophyll content compared to controls [45]. In our study this detrimental effect was even more pronounced in the PM and PGM groups, showing a marked decrease of 69% and 67% at 14 days compared to the PG group, respectively. The overall reduction in pigment content was observable after seven days (Figure 4A,B) and became more pronounced after fourteen days across all affected treatments. Conversely, the elevated chlorophyll content observed in the PG treatment suggests an improvement in the plant’s physiological performance, likely stimulated by the presence of graphene, which appears to enhance chlorophyll synthesis. This is consistent with a study on rice plants that demonstrated significant increases in chlorophyll content (ranging from 18.6% to 46.8%) after treatment with different GO concentrations (2, 5, 7, and 10 g mL−1) [46]. The PG treatment maintained significantly higher levels of carotenoids compared to the PM and PGM groups, which both showed a 47% reduction relative to PG (Figure 4B). It is notable that pigment content did not exhibit such a reduction at seven days (T7), showing comparable values with negligible differences. This suggests that, while rGO can enhance pigment content overall, it may not mitigate the nickel-induced reduction in pigment content in the longer term.
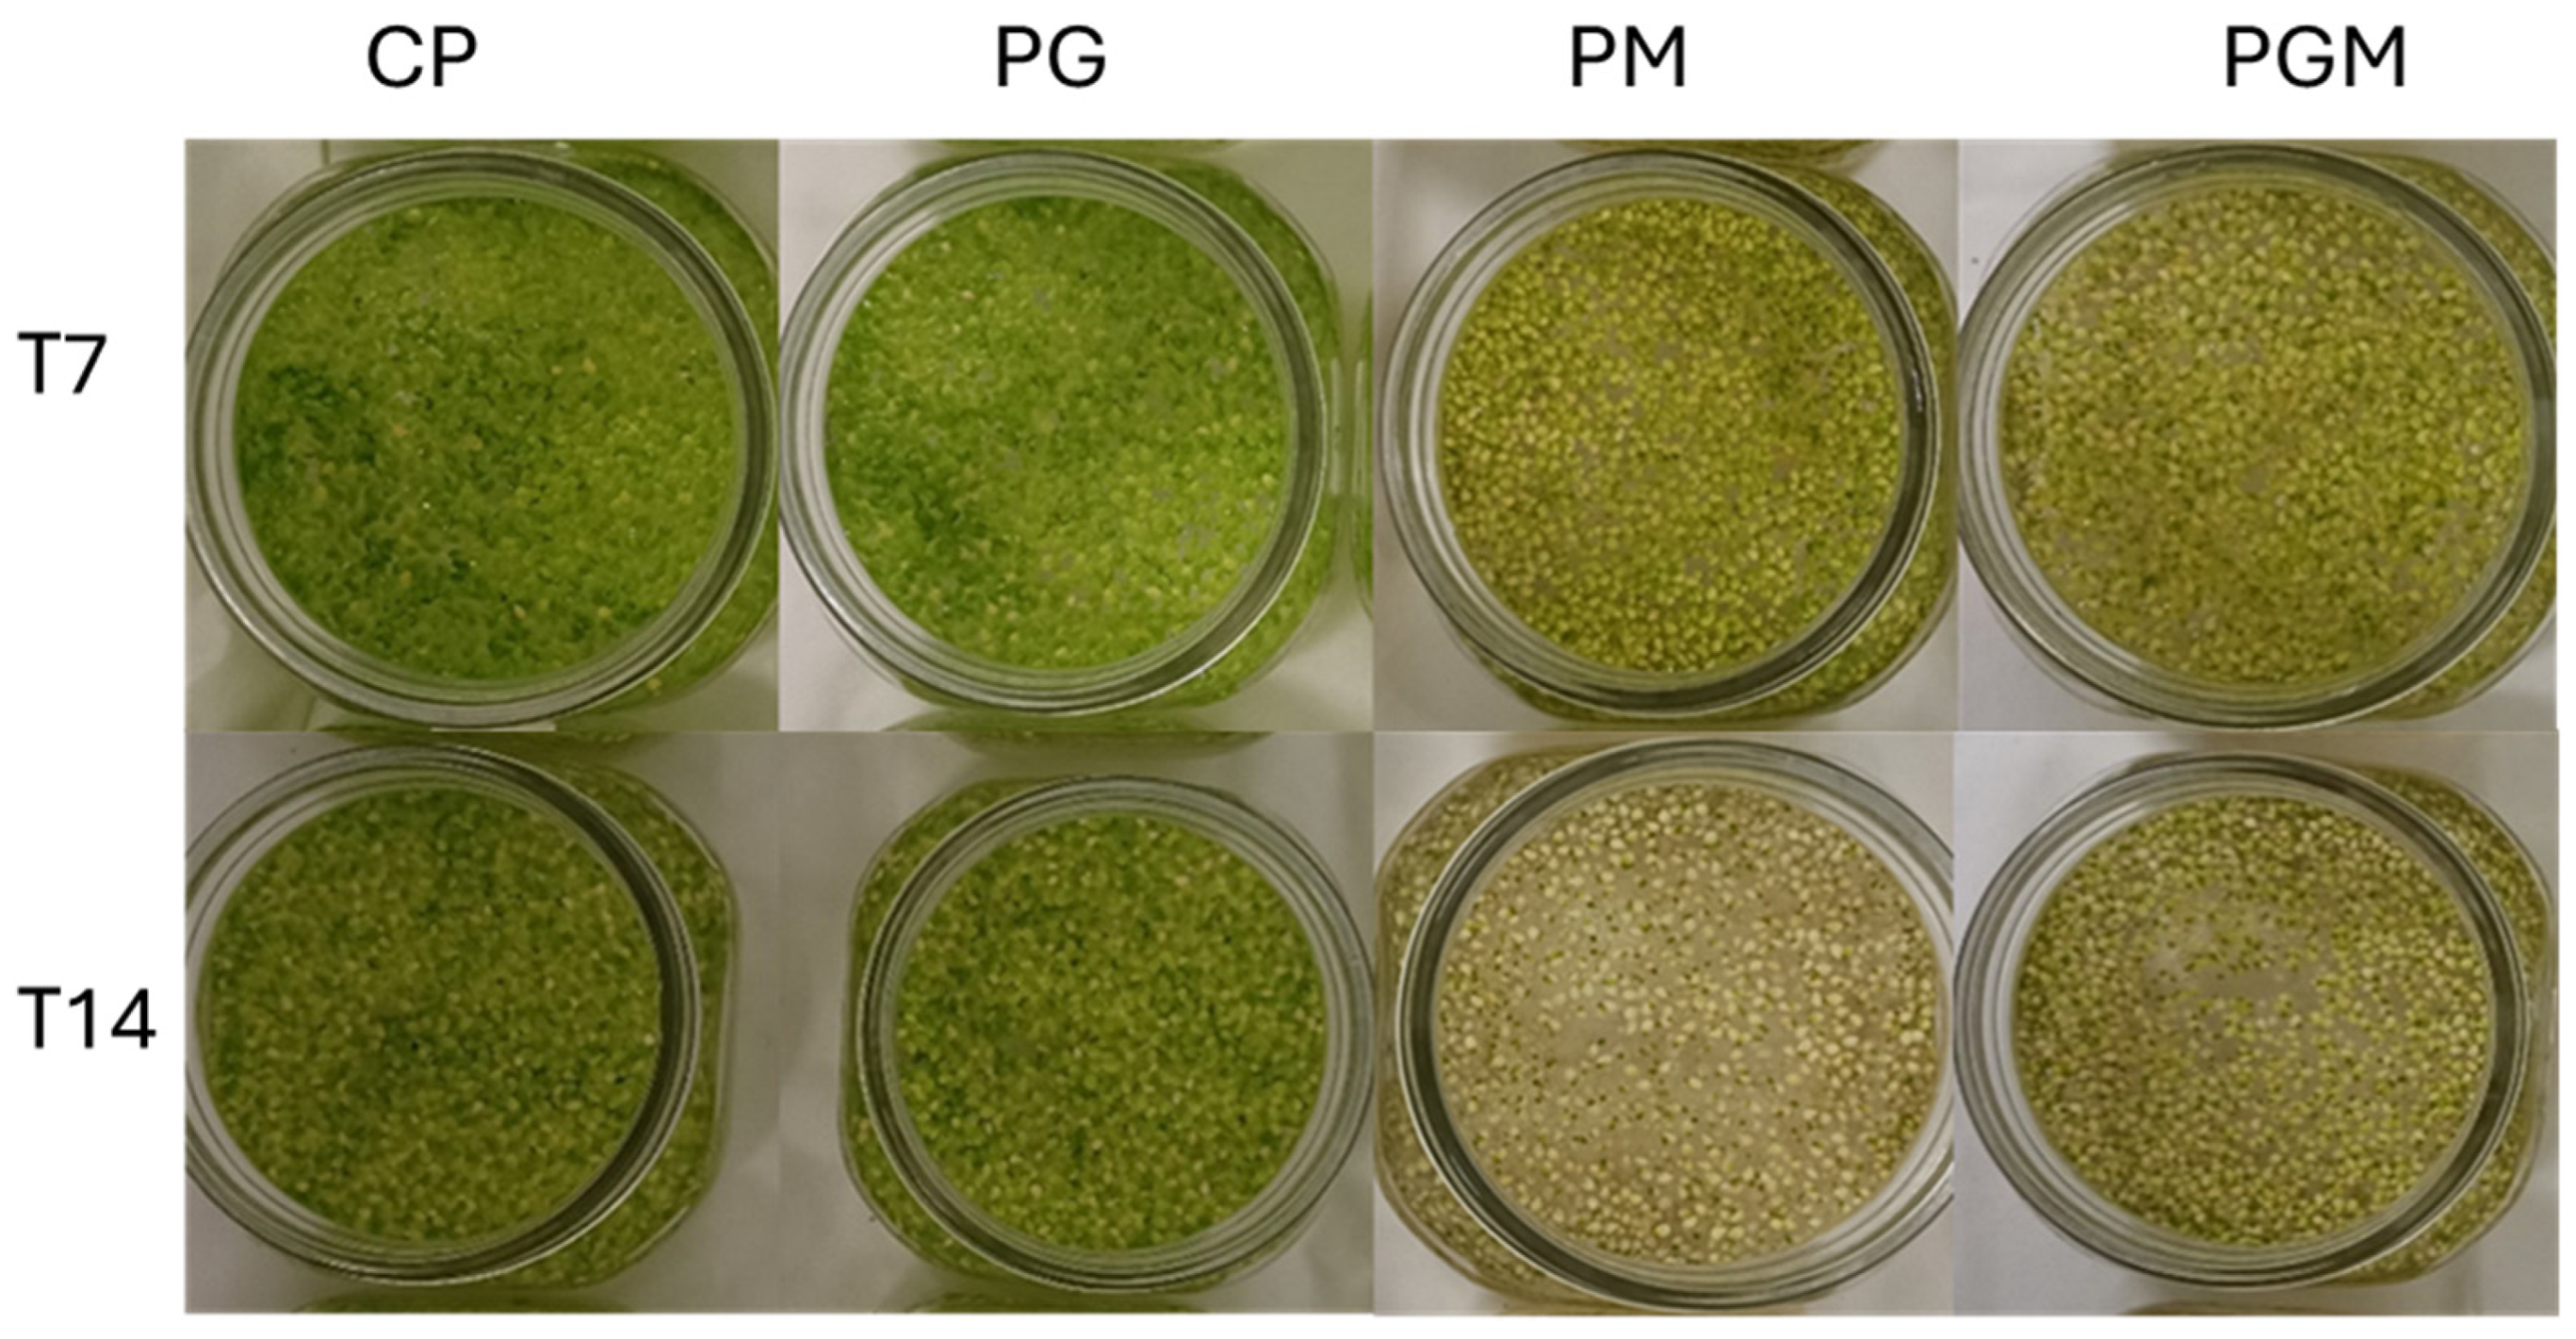
The reduction in pigment content was observable after seven days (Figure 5) and became more pronounced after fourteen days across all affected treatments.
The chlorotic effect was distinctly more severe in treatments containing heavy metals (PM and PGM) compared to metal-free treatments (CP and PG). While phytotoxicity symptoms, such as frond abscission and the appearance of new, smaller chlorotic fronds, were reported after 10 days of Ni exposure in L. minor by Goswami and Majumder [41], these symptoms appeared in our study as early as seven days. This earlier onset of phytotoxicity in our experiments may be attributed to a combination of the presence of nickel and the nutrient-deficient growth medium.

3.1.3. Lipid Peroxidation Measurements

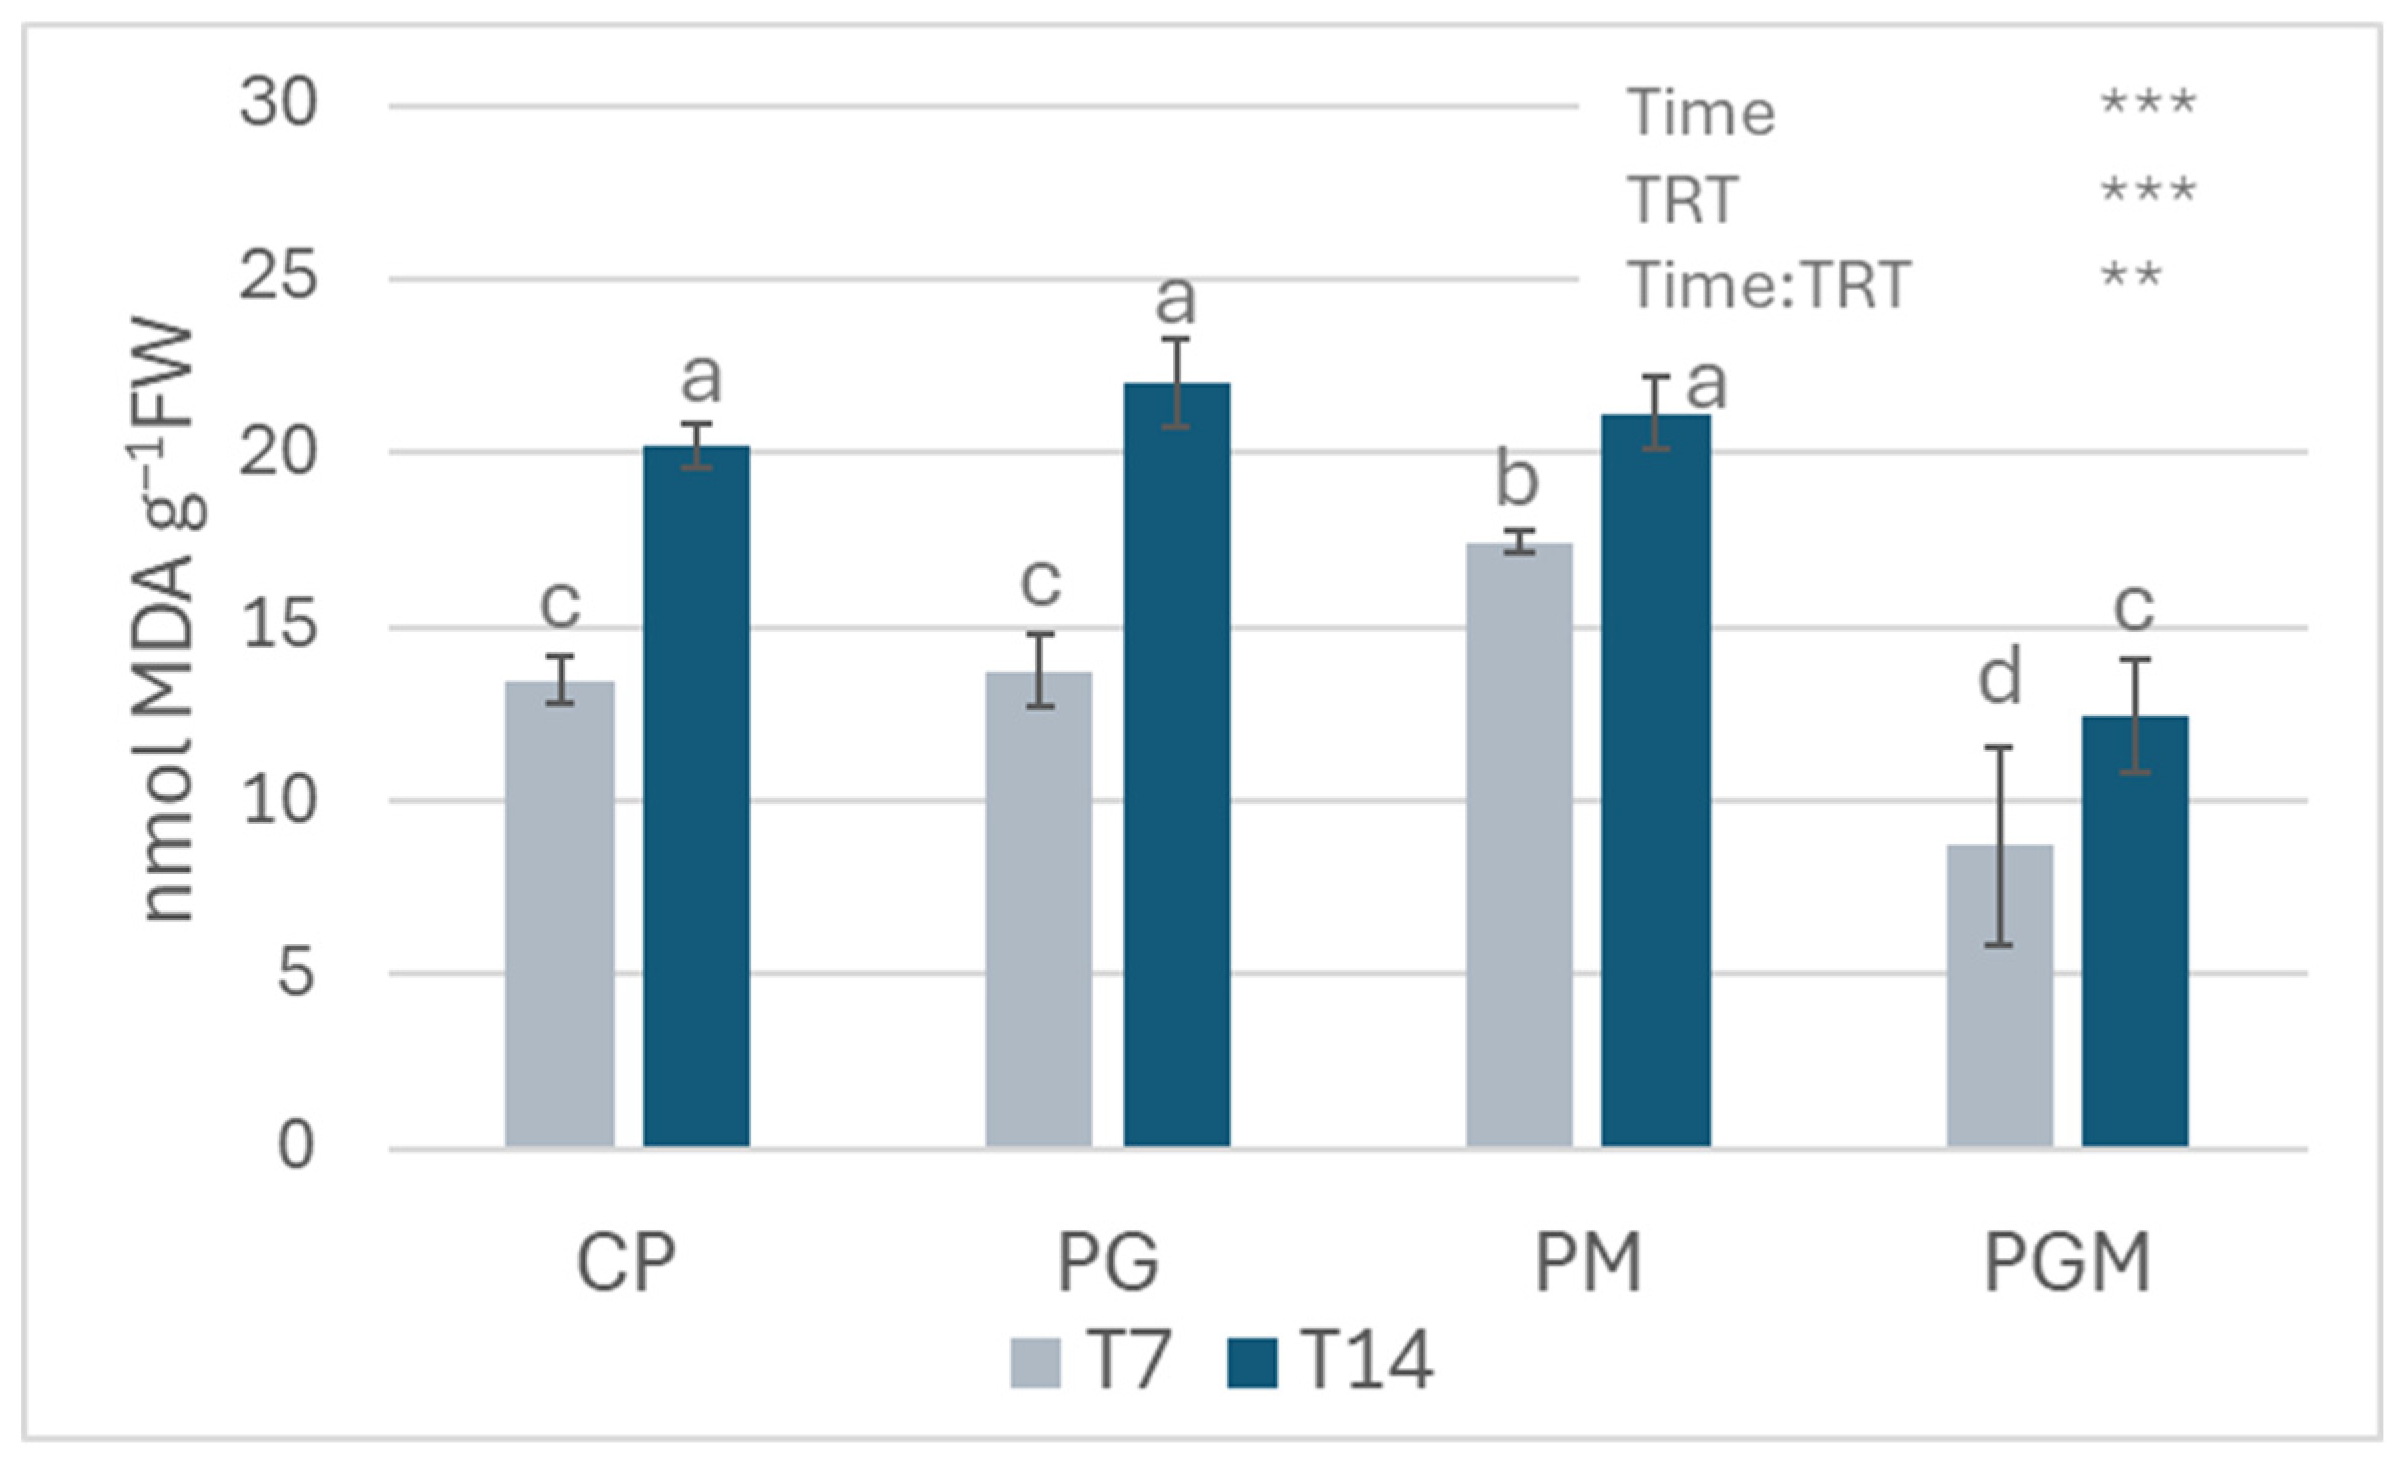
The MDA content of L. minor showed a significant and time-dependent increase upon Ni exposure (p < 0.001; Table S3A). Oxidative stress, assessed by measuring malondialdehyde (MDA) content, revealed that combined treatments (PGM) significantly attenuated metal-induced stress compared to metal-only treatments (PM) (Figure 6).
Specifically, at 7 days (T7), the co-exposure treatment (PGM) exhibited a significantly reduced MDA content of 7.3 nmol MDA g−1 FW compared to 17.4 nmol MDA g−1 FW in the nickel-only treatment (PM), representing a 58% reduction. This finding strongly suggests that the simultaneous presence of rGO can mitigate the oxidative stress induced by nickel. This protective effect of rGO was also evident at 14 days (T14), where MDA content in PGM was 41% lower than in PM. Interestingly, both control (CP) and rGO-treated (PG) plants displayed higher MDA values at T14 (Figure 6). This result correlates directly with the changes in pigment content previously discussed.

3.1.4. Nickel Uptake and Bioconcentration Factor (BCF)

Assessment of nickel (Ni) removal and toxicity mitigation by rGO involved measuring Ni content in L. minor plants and in the growth medium, followed by BCF calculation. Data for control (CP) and rGO-treated (PG) plants were omitted for clarity due to their low average Ni content (0.27 to 0.81 mg kg−1). A notable finding was the maximum average Ni content of approximately 631.7 mg kg−1 observed in L. minor from the co-exposure (PGM) treatment after seven days (Figure 7A). Nickel uptake capacity did not significantly vary with exposure time nor was it influenced by the presence of rGO (ns; Table S3A).
Despite the high nickel (Ni) accumulation observed, the Ni content in the co-exposure (PGM) treatment increased only slightly compared to the copper-only (PM) treatment at T7 and T14 (12% and 3% higher, respectively). The substantial Ni concentrations attained within L. minor suggest its potential as an effective accumulator for this metal. Despite the concomitant negative physiological responses, this bioaccumulation capacity, corroborated by high bioconcentration factor (BCF) values (Figure 7B), indicates the species’ suitability for phytoremediation applications. A reduction in BCF values was observed by 14 days compared to 7 days. This decline at T14 may be a consequence of increased plant mortality over time and deleterious effects of overexposure to metal, potentially leading to the remobilization of accumulated nickel back into the growth medium. Although L. minor effectively accumulates nickel, a comparison between the PM and PGM treatments revealed no significant enhancing effect of rGO on nickel accumulation. Specifically, PM showed BCF values 7% and 3% lower than PGM at T7 and T14, respectively (Figure 7B).
Our results for Ni accumulation in L. minor diverge from previous findings by Zayed et al. [47], who reported that L. minor accumulated low amounts of Ni (1.79 g kg−1) in a medium containing 10 mg L−1 Ni. This discrepancy may be attributed to the specific L. minor clone used in our study (L. minor 5500), which appears to possess a superior nickel accumulation capacity. This inter-clonal difference in accumulation capacity within L. minor has been previously highlighted in the literature [47]. A study on L. gibba reported a BCF value for Ni of ≤100 and plant Ni concentrations of 20 mg kg−1 after 4 days of exposure to 0.2 mg L−1 Ni [42]. In contrast, our L. minor clone demonstrated better accumulation capacity after 7 days. This strong accumulation is consistent with other findings on L. minor’s potential for metal removal; for instance, another study reported average nickel removal efficiencies of 80% at low concentrations and 87% at high concentrations (0, 2.5, 5 mg L−1) [48].

3.2. Effects of Reduced Graphene Oxide and Copper on L. minor

3.2.1. Growth Analysis

As observed in the nickel experiment under identical conditions, both control (CP) and rGO-exposed (PG) L. minor plants exhibited an increase in fresh weight (FW) biomass over time. However, the total FW biomass of L. minor was significantly affected by exposure time and by the interaction with treatments, particularly copper (Cu) exposure (p < 0.001; Table S3B, Figure 8). Specifically, exposure to copper alone (PM treatment) significantly reduced L. minor biomass compared to the control (CP), showing a 21% reduction at T7 and a more substantial 45% reduction at T14. When L. minor was co-exposed to both rGO and copper (PGM treatment), the biomass reduction relative to the control (CP) was mitigated, showing 20% at T7 and 33% at T14 (Figure 8A).
Interestingly, a direct comparison between the copper-only (PM) and co-exposure (PGM) treatments at T14 revealed a statistically significant 17% increase in biomass in the PGM. This beneficial effect was not observed at T7. The relative growth rate (RGR) of L. minor plants mirrors the observed trends in biomass content (Figure 8B). Treatments containing copper (PM and PGM) showed a decrease in RGR compared to the control (CP), with reductions of 22% (PM) and 21% (PGM) at T7 and 42% (PM) and 29% (PGM) at T14. Notably, the RGR values for the co-exposure group (PGM) increased compared to the copper-only group (PM) at both T7 (1%) and T14 (19%). This increase was statistically significant only at T14, further supporting the hypothesis that prolonged exposure to rGO can mitigate the toxic effects of copper. This finding is consistent with a comparable study using graphene oxide (GO) [43], where the presence of GO at 5 mg L−1, alongside copper at 1.2 mg L−1, resulted in dry weight values statistically similar to the control group. Furthermore, the number of fronds increased, and the inhibition rate (Ir) significantly decreased. These results collectively suggest that graphene-based materials have the potential to mitigate copper-induced growth inhibition, even at low concentrations. This beneficial effect is likely due to the formation of bonds between copper and rGO or GO, which reduces the amount of bioavailable copper.

3.2.2. Pigment Contents

As discussed in the previous experiment involving nickel under identical conditions, both control (CP) and rGO-exposed (PG) L. minor plants showed a decrease in pigment contents over time. The content of total chlorophyll and carotenoids increased by 38% and 33%, respectively, in the PGM treatment after 14 days compared to PM (Figure 9). This result indicates that the presence of rGO may serve as a compensatory mechanism for the deleterious effects of copper on pigment content.
Photosynthetic pigment analysis showed that L. minor responded significantly to rGO and copper exposure. These responses were significantly affected by exposure time (p < 0.01; Table S3B) and the applied treatments (p < 0.001; Table S3B), then significant interaction between time and treatments was observed (p < 0.01; Table S3B).
The reduction in pigment content is evident after 7 days and to a greater extent after 14 days in the treatments. The most noticeable chlorotic effect is due to the presence of metal in the treatments (PM and PGM) compared to the metal-free treatments (CP and PG), but a reduction in leaf chlorosis can be seen in PGM compared to PM at T14 as evidenced by the total chlorophyll data (Figure 10). A study on the green alga Scenedemus obliquus [22] revealed a decline in chlorophyll content with increasing concentrations of rGO. Notably, at 150 mg L−1 of rGO, a 90% decrease in chlorophyll a content was observed. The authors of the study hypothesize that this decline is attributable to the influence of rGO edges on the algal cell wall. However, this phenomenon was not observed in L. minor, suggesting that rGO’s physical interaction with the outer cell wall may be less significant in this species.

3.2.3. Lipid Peroxidation Measurements

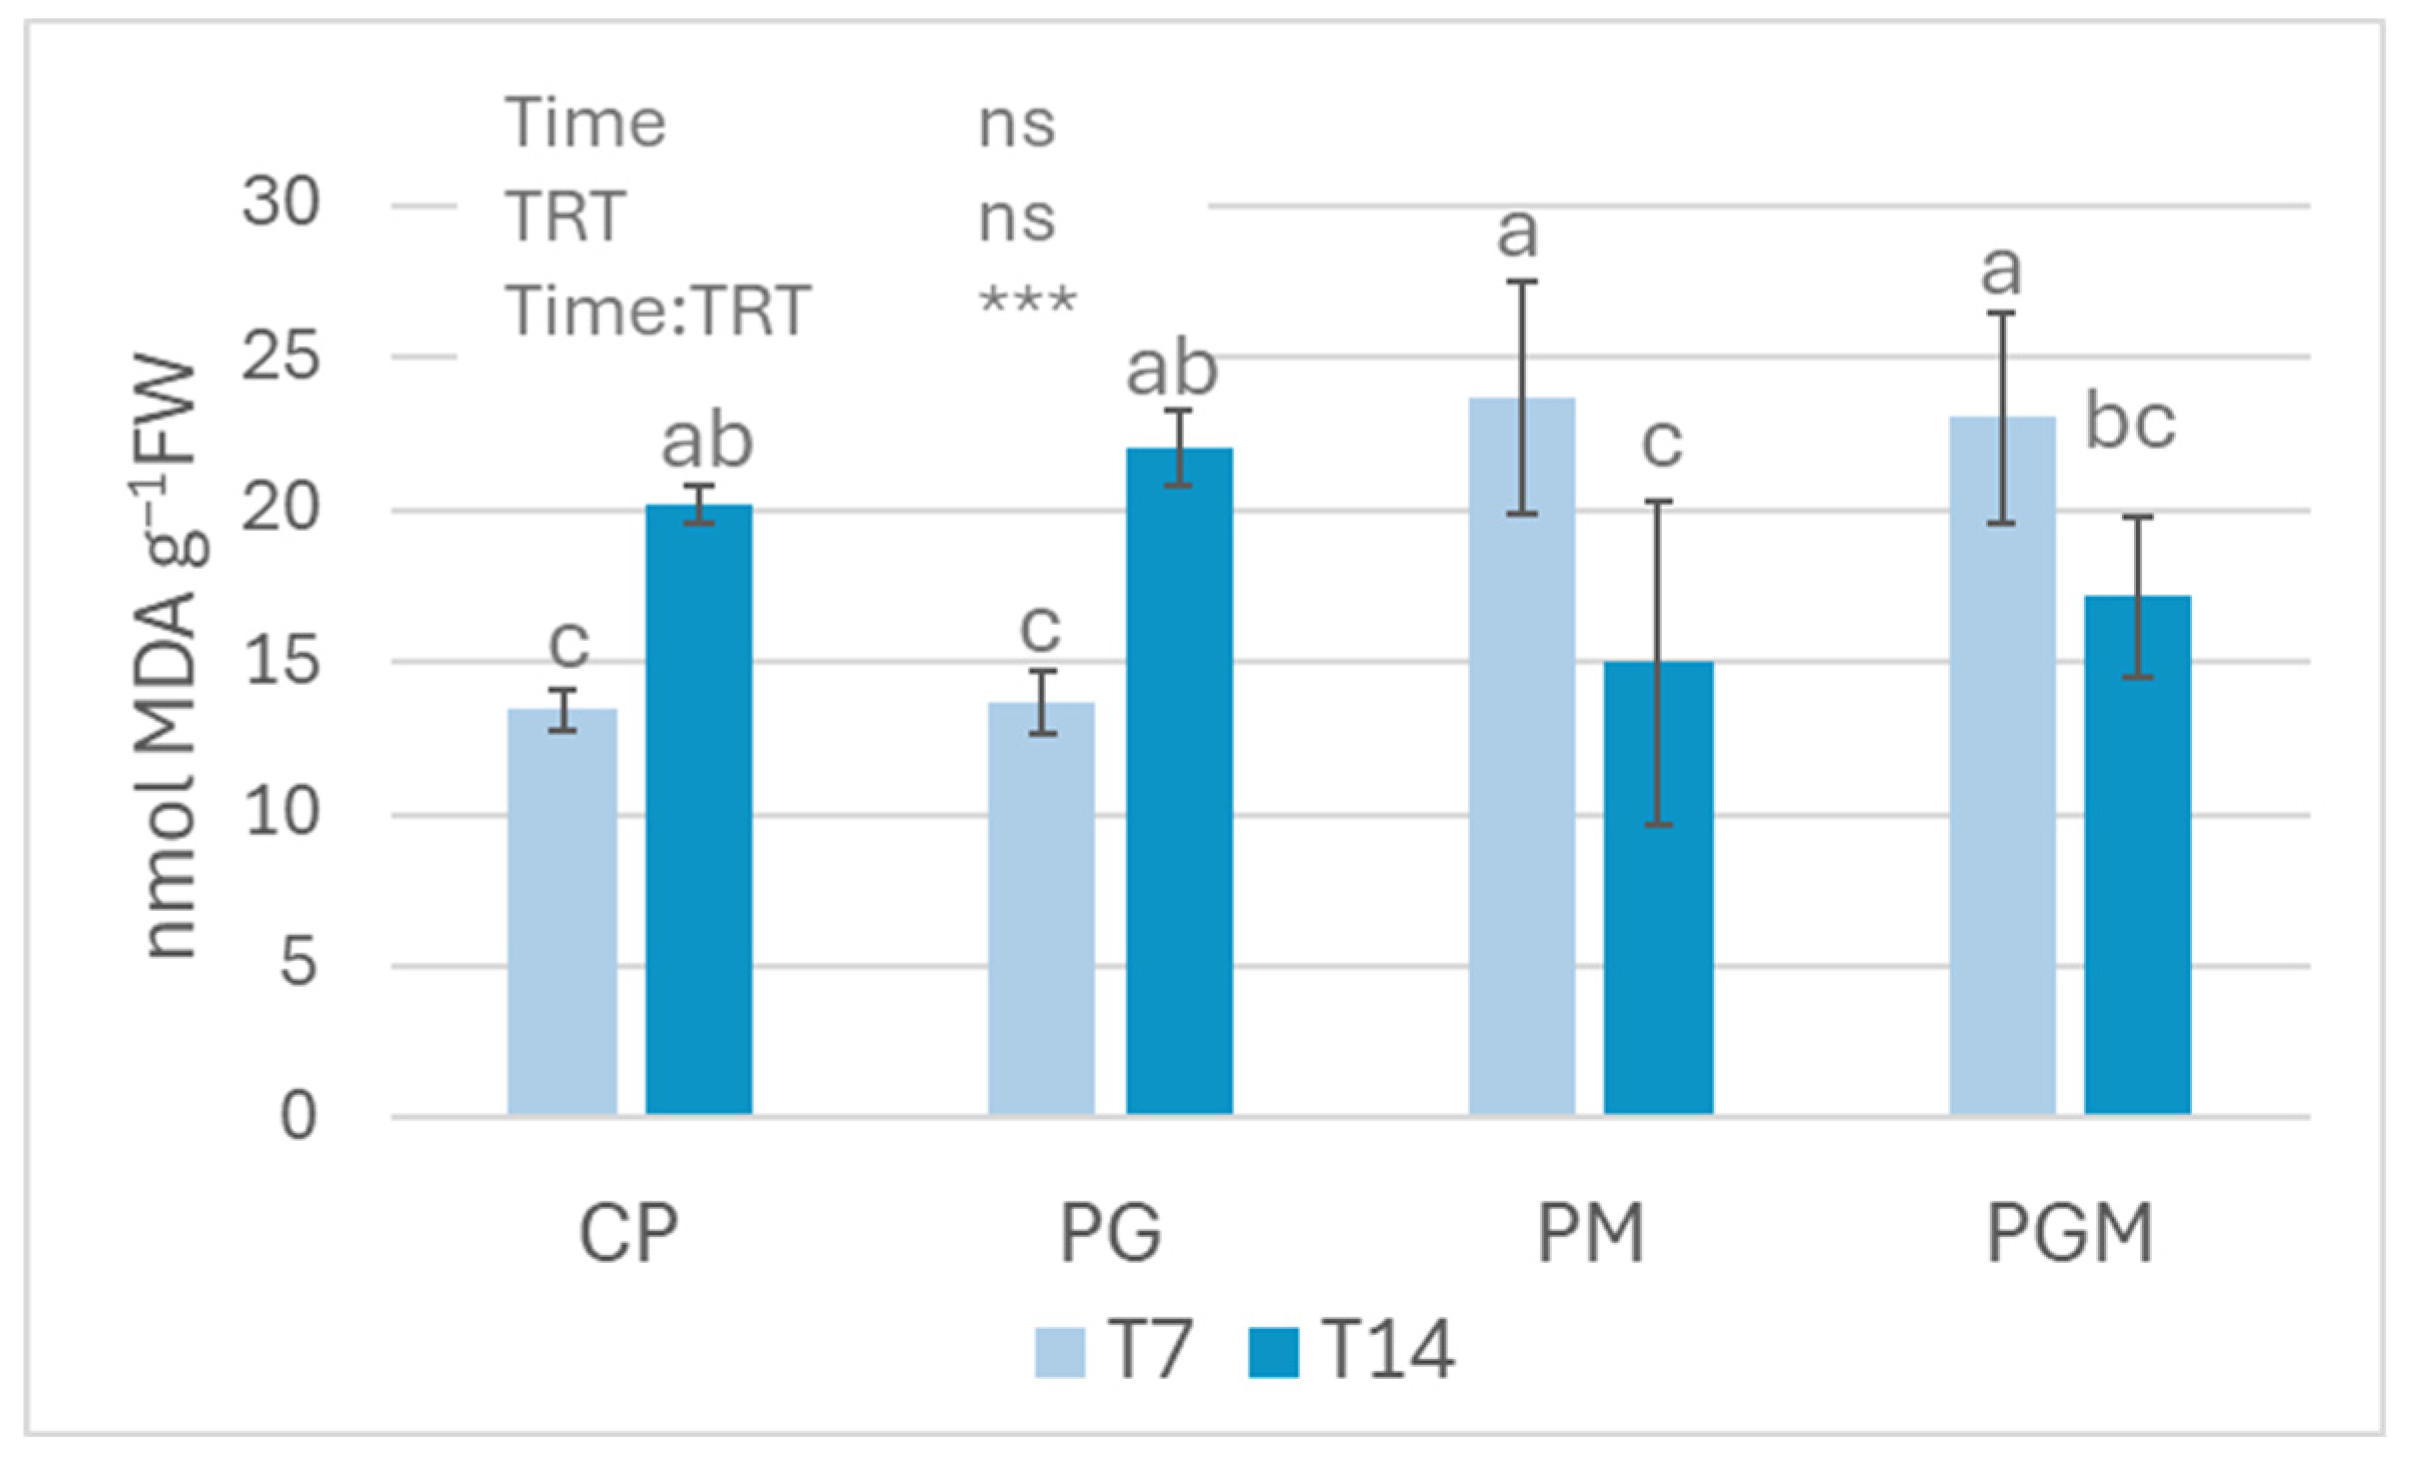
Oxidative stress, assessed via malondialdehyde (MDA) measurements (Figure 11), demonstrated a different response pattern in Lemna minor during co-exposure with copper and rGO compared to nickel. Notably, copper and rGO exposure led to significant MDA content, highlighting a strong interaction effect of time: treatments (p < 0.001; Table S3B).
In the combined PGM treatment, MDA content at T7 mirrored that of the metal-alone (PM) treatment. Notably, both treatments exhibited higher MDA levels compared to those observed in CP and PG. By T14, an intriguing inverse trend was evident for PG, where average MDA values surpassed those of the copper treatments. In contrast, our results do not align with established literature, where copper, a known pro-oxidant metal, is expected to induce lipid peroxidation and elevate MDA levels in aquatic macrophytes at environmentally relevant concentrations [49]. For example, a study on Elodea canadensis showed a dose-dependent increase in MDA after only 72 h of copper exposure [50].

3.2.4. Copper Uptake and Bioconcentration Factor (BCF)

The presence of rGO significantly mitigated copper accumulation in L. minor, a finding supported by significant effects from both copper exposure alone and co-exposure with rGO (p < 0.001; Table S3B). While CP and PG treatments exhibited low copper levels (1.5 to 4.9 mg Cu Kg−1), the PM treatment led to a substantial accumulation of 739.3 mg Kg−1 at T14. Conversely, the PGM treatment resulted in significantly lower copper content, averaging 463.5 mg Cu Kg−1 at T7 and 547.6 mg Kg−1 at T14 compared to PM (Figure 12A). This data definitively shows that rGO reduces copper uptake and accumulation in L. minor plants.
For example, other studies have also demonstrated the ability of carbon-based nanomaterials, including graphene oxide (GO) or reduced graphene oxide (rGO), to modulate heavy metal uptake in plants and reported a similar reduction in cadmium accumulation in rice seedlings when co-exposed with graphene oxide, attributing this to surface adsorption or complexation of the metal ions by the nanomaterial [51]. Complementing these plant studies, co-exposure research on the embryo-larval development of the oyster Crassostrea gigas revealed a contrasting behavior for GO and rGO in seawater. While GO is suggested to increase metal bioavailability following adsorption, rGO demonstrated a decreased copper bioavailability, thereby protecting marine organisms from copper toxicity. Graphene oxide worsens copper-mediated embryo-larval toxicity in the Pacific oyster while reduced graphene oxide mitigates the effects [52]. Furthermore, copper accumulation in L. minor in the range of hundreds of mg kg−1 is commonly indicative of high exposure and uptake. This is consistent with observations in similar aquatic plant systems, such as those reported by Kanoun-Boulé et al. [49]. The bioconcentration factor (BCF), calculated as the ratio of copper content in the plant to that in the growing medium, further underscores L. minor’s significant accumulation capacity for copper, reaching a maximum BCF value of 749.6 at T14. Notably, the presence of rGO in the PGM treatment significantly mitigated this accumulation: the BCF value was reduced by 31% at T7 compared to the PM treatment, with an 26% reduction evident at T14. This demonstrates that rGO partially limits copper accumulation in Lemna fronds, thereby contributing to improved physiological performance, as evidenced by the previously discussed increases in biomass and higher pigment content.

3.2.5. Oxidative Stress Response to Reduced Graphene Oxide and Copper

Oxidative stress responses were further investigated in the combined copper and rGO experiment, given rGO’s significant mitigating effect and reduced copper bioavailability by performing biochemical assays on catalase and glutathione-S-transferase. Plants utilize a variety of enzymatic antioxidants, such as CAT and GST, to scavenge excess reactive oxygen species (ROS) and maintain cellular homeostasis. Catalase, specifically, directly dismutates hydrogen peroxide and is vital for preventing harmful ROS accumulation under stress [53]. Increased plant CAT activity is generally associated with enhanced oxidative tolerance and reduced damage [54,55]. Catalase and glutathione-S-transferase enzyme activities in L. minor plants are presented as radar plots in Figure 13A (CAT) and Figure 13B (GST). All values were normalized to those obtained from the control plants (CP) (Table 1).
Catalase activity in the rGO-only (PG) treatment increased by 10% at T7 and 31% at T14 compared to CP (Figure 13A).
Copper exposure (PM) led to CAT increases of 55% at T7 and 11% at T14 compared to CP. The combined PGM treatment showed even greater increases: 75% at T7 and 18% at T14 compared to CP. Critically, PGM exhibited higher CAT activity than PM (44% at T7, 8% at T14), with a statistically significant difference between CP and PGM at T7. These results align with a study by Hu et al. [43] on L. minor, which also reported significantly increased catalase activity in the presence of copper and GO. A key enzymatic component of anti-oxidative defense response is glutathione S-transferase (GST). GST activity in plant cells generally increases with exposure to metals like cadmium, nickel, and copper, highlighting its role in metal tolerance [56]. These enzymes catalyze the conjugation of glutathione (GSH) to electrophilic substrates, including heavy metals, thereby detoxifying them and facilitating their transport (e.g., to the vacuole), mitigating metal-induced oxidative stress [57]. In line with these general observations, our study found that GST activity significantly increased at T7 across several treatments: by 31% in PG, 50% in PM, and 51% in PGM, all compared to the control (CP). While GST levels in CP, PG, and PGM converged by T14, the PM treatment notably maintained a 39% increase over CP.

4. Conclusions

This study investigated the differential effects of nickel and copper exposure on L. minor, both alone and in co-exposure with reduced graphene oxide (rGO). The aquatic plant L. minor showed significant reductions in biomass, relative growth rate, and photosynthetic pigments. Importantly, rGO did not mitigate nickel toxicity at the tested concentration, showing no substantial differences in accumulation or growth parameters between Ni-only and Ni-rGO co-exposed plants. This indicates that L. minor is a viable Ni hyperaccumulator and rGO does not enhance its tolerance or uptake. In stark contrast, co-exposure of L. minor to copper and rGO revealed a partially protective effect of rGO against copper toxicity. The mitigation of toxicity was supported by enhanced physiological performance, moderate accumulation, and favorable modulation of oxidative stress responses. This mitigation is attributed to rGO’s strong surface affinity for Cu ions, which likely limits their bioavailability through adsorption or complexation. Our results emphasize that the efficacy of rGO as a remediation agent is governed by the specific chemical properties of the contaminant. While rGO offered no measurable benefit against nickel toxicity, it demonstrated a clear partial alleviation of copper toxicity in L. minor by enhancing physiological performance, moderating copper accumulation, and modulating oxidative stress responses. Given the limitation of using a single rGO concentration and short-term exposure in a simplified system, future research must focus on multi-dose experiments, long-term environmental fate, and the colloidal stability of rGO–metal complexes before rGO-based materials can be deemed safe and effective for real-world aquatic environmental remediation.

Supplementary Materials

The following supporting information can be downloaded at: https://www.mdpi.com/article/10.3390/environments12110407/s1, Table S1: Chemical Composition Elements (mg L−1) of Mineral Water Used for Lemna minor Cultivation and Experiments.; Experimental Design S1: Preliminary phytotoxicity test design; Table S2. Metal and rGO concentration (mg L−1) used for Lemna minor preliminary phytotoxicity test. Table S3(A,B): Analysis of variance (two-way ANOVA) of the biochemical parameters on L. minor to assess the significance of the effects of interaction between Lemna plants respect to Time exposureand to the treatments as well as of their interaction.

Author Contributions

Conceptualization, M.A.I., M.D. and B.C.; validation, M.D., B.C. and M.A.I.; formal analysis, M.D., B.C. and M.A.I.; investigation, M.D., B.C. and M.A.I.; resources, B.C. and M.A.I.; data curation, M.D., B.C. and M.A.I.; writing—original draft preparation, M.D. and M.A.I.; writing—review and editing, M.D., B.C. and M.A.I.; visualization, M.D. and M.A.I.; supervision, M.A.I.; funding acquisition, M.A.I. and B.C. All authors have read and agreed to the published version of the manuscript.

Funding

This research was funded by FLAG-ERA III project GO-FOR-WATER, project no. 825207 and Gra-pheneCore3-H2020-SGA-FET-SH1 Graphil-GRAPHENE-FLAGSHIP, project no. 881603, and Italian National Research Council within the Agritech National Research Center and received funding from the European Union Next Generation EU (grant ID Piano Nazionale Di Ripresa e Resilienza (PNRR), Missione 4 Componente 2, Investimento 1.4— D.D. 1032 17/06/2022 Project CN00000022).

Data Availability Statement

The original contributions presented in this study are included in the article/supplementary material. Further inquiries can be directed to the corresponding author(s).

Acknowledgments

During the preparation of this manuscript, the author(s) used Gemini (Google AI, version accessed September 2025) for the purposes of linguistic support tool for editing, improving syntax and clarity. The authors have reviewed and edited the output and take full responsibility for the content of this publication.

Conflicts of Interest

The authors declare no conflicts of interest.

References

  1. Ahmed, A.; Singh, A.; Young, S.-J.; Gupta, V.; Singh, M.; Arya, S. Synthesis Techniques and Advances in Sensing Applications of Reduced Graphene Oxide (rGO) Composites: A Review. Compos. Part Appl. Sci. Manuf. 2023, 165, 107373. [Google Scholar] [CrossRef]
  2. Liu, F.; Choi, K.S.; Park, T.J.; Lee, S.Y.; Seo, T.S. Graphene-Based Electrochemical Biosensor for Pathogenic Virus Detection. BioChip J. 2011, 5, 123–128. [Google Scholar] [CrossRef]
  3. Yuan, Y.; Wang, X.; Liu, X.; Qian, J.; Zuo, P.; Zhuang, Q. Non-Covalently Modified Graphene@poly (Ionic Liquid) Nanocomposite with High-Temperature Resistance and Enhanced Dielectric Properties. Compos. Part Appl. Sci. Manuf. 2022, 154, 106800. [Google Scholar] [CrossRef]
  4. Sharma, V.; Mitlin, D.; Datta, D. Understanding the Strength of the Selenium–Graphene Interfaces for Energy Storage Systems. Langmuir 2021, 37, 2029–2039. [Google Scholar] [CrossRef]
  5. Zhang, Y.-L.; Li, J.-C.; Zhou, H.; Liu, Y.-Q.; Han, D.-D.; Sun, H.-B. Electro-Responsive Actuators Based on Graphene. Innovation 2021, 2, 100168. [Google Scholar] [CrossRef]
  6. Gao, Y.; Zeng, X.; Zhang, W.; Zhou, L.; Xue, W.; Tang, M.; Sun, S. The Aggregation Behaviour and Mechanism of Commercial Graphene Oxide in Surface Aquatic Environments. Sci. Total Environ. 2022, 806, 150942. [Google Scholar] [CrossRef] [PubMed]
  7. Jalili, R.; Aboutalebi, S.H.; Esrafilzadeh, D.; Shepherd, R.L.; Chen, J.; Aminorroaya-Yamini, S.; Konstantinov, K.; Minett, A.I.; Razal, J.M.; Wallace, G.G. Scalable One-Step Wet-Spinning of Graphene Fibers and Yarns from Liquid Crystalline Dispersions of Graphene Oxide: Towards Multifunctional Textiles. Adv. Funct. Mater. 2013, 23, 5345–5354. [Google Scholar] [CrossRef]
  8. Ahmad, S.Z.N.; Wan Salleh, W.N.; Ismail, A.F.; Yusof, N.; Mohd Yusop, M.Z.; Aziz, F. Adsorptive Removal of Heavy Metal Ions Using Graphene-Based Nanomaterials: Toxicity, Roles of Functional Groups and Mechanisms. Chemosphere 2020, 248, 126008. [Google Scholar] [CrossRef]
  9. Wu, H.; Wang, Y.; Sun, B.; Liu, X.; Zhang, T.; Ma, Y.; Zhao, S. Concentration-Dependent Effects of Humic Acid and Protein on the Stability of Hematite Nanoparticles in an Aqueous Environment. J. Nanoparticle Res. 2023, 25, 109. [Google Scholar] [CrossRef]
  10. Zhao, J.; Wang, Z.; White, J.C.; Xing, B. Graphene in the Aquatic Environment: Adsorption, Dispersion, Toxicity and Transformation. Environ. Sci. Technol. 2014, 48, 9995–10009. [Google Scholar] [CrossRef]
  11. Hong, H.; Nowack, B. Form-Specific Prospective Environmental Risk Assessment of Graphene-Based Materials in European Freshwater. Environ. Sci. Technol. 2024, 58, 21750–21759. [Google Scholar] [CrossRef]
  12. Graphene-Based Materials Functionalization with Natural Polymeric Biomolecules|IntechOpen. Available online: https://www.intechopen.com/chapters/51598 (accessed on 31 July 2025).
  13. Sarmiento, V.; Lockett, M.; Sumbarda-Ramos, E.G.; Vázquez-Mena, O. Effective Removal of Metal Ion and Organic Compounds by Non-Functionalized rGO. Molecules 2023, 28, 649. [Google Scholar] [CrossRef]
  14. Kumar, P.; Das, S. Efficient Adsorption of Toxic Heavy Metal Ions on the Surface Engineered Violuric Acid-Reduced Graphene Oxide Nanomaterial. ACS Appl. Eng. Mater. 2023, 1, 1343–1355. [Google Scholar] [CrossRef]
  15. Yang, X.; Liu, P.; Yu, H. Adsorption of Heavy Metals from Wastewater Using Reduced Graphene Oxide@titanate Hybrids in Batch and Fixed Bed Systems. BMC Chem. 2025, 19, 72. [Google Scholar] [CrossRef]
  16. Song, C.; Yang, C.-M.; Sun, X.-F.; Xia, P.-F.; Qin, J.; Guo, B.-B.; Wang, S.-G. Influences of Graphene Oxide on Biofilm Formation of Gram-Negative and Gram-Positive Bacteria. Environ. Sci. Pollut. Res. 2018, 25, 2853–2860. [Google Scholar] [CrossRef]
  17. Yang, H.; Feng, S.; Ma, Q.; Ming, Z.; Bai, Y.; Chen, L.; Yang, S.-T. Influence of Reduced Graphene Oxide on the Growth, Structure and Decomposition Activity of White-Rot Fungus Phanerochaete chrysosporium. RSC Adv. 2018, 8, 5026–5033. [Google Scholar] [CrossRef]
  18. Mao, L.; Hu, M.; Pan, B.; Xie, Y.; Petersen, E.J. Biodistribution and Toxicity of Radio-Labeled Few Layer Graphene in Mice after Intratracheal Instillation. Part. Fibre Toxicol. 2016, 13, 7. [Google Scholar] [CrossRef]
  19. Begum, P.; Ikhtiari, R.; Fugetsu, B. Graphene Phytotoxicity in the Seedling Stage of Cabbage, Tomato, Red Spinach, and Lettuce. Carbon 2011, 49, 3907–3919. [Google Scholar] [CrossRef]
  20. Christudoss, A.C.; Sah, K.K.; Vikram, R.; Giri, S.; Viswanathan, D.; Dimkpa, C.O.; Mukherjee, A. Tailoring the Synthesis Route of Reduced Graphene Oxide and Its Toxicological Effects on Allium cepa L. ACS Omega 2025, 10, 20771–20783. [Google Scholar] [CrossRef]
  21. Xiao, X.; Wang, X.; Liu, L.; Chen, C.; Sha, A.; Li, J. Effects of Three Graphene-Based Materials on the Growth and Photosynthesis of Brassica napus L. Ecotoxicol. Environ. Saf. 2022, 234, 113383. [Google Scholar] [CrossRef]
  22. Du, S.; Zhang, P.; Zhang, R.; Lu, Q.; Liu, L.; Bao, X.; Liu, H. Reduced Graphene Oxide Induces Cytotoxicity and Inhibits Photosynthetic Performance of the Green Alga Scenedesmus obliquus. Chemosphere 2016, 164, 499–507. [Google Scholar] [CrossRef]
  23. Gamoń, F.; Ziembińska-Buczyńska, A.; Łukowiec, D.; Tomaszewski, M. Ecotoxicity of Selected Carbon-Based Nanomaterials. Int. J. Environ. Sci. Technol. 2023, 20, 10153–10162. [Google Scholar] [CrossRef]
  24. Zhan, Q.; Ahmad, A.; Arshad, H.; Yang, B.; Chaudhari, S.K.; Batool, S.; Hasan, M.; Feng, G.; Mustafa, G.; Hatami, M. The Role of Reduced Graphene Oxide on Mitigation of Lead Phytotoxicity in Triticum aestivum L. Plants at Morphological and Physiological Levels. Plant Physiol. Biochem. 2024, 211, 108719. [Google Scholar] [CrossRef] [PubMed]
  25. Pietrini, F.; Bianconi, D.; Massacci, A.; Iannelli, M.A. Combined Effects of Elevated CO2 and Cd-Contaminated Water on Growth, Photosynthetic Response, Cd Accumulation and Thiolic Components Status in Lemna minor L. J. Hazard. Mater. 2016, 309, 77–86. [Google Scholar] [CrossRef] [PubMed]
  26. Khan, M.A.; Wani, G.A.; Majid, H.; Farooq, F.U.; Reshi, Z.A.; Husaini, A.M.; Shah, M.A. Differential Bioaccumulation of Select Heavy Metals from Wastewater by Lemna Minor. Bull. Environ. Contam. Toxicol. 2020, 105, 777–783. [Google Scholar] [CrossRef]
  27. Iannelli, M.A.; Bellini, A.; Venditti, I.; Casentini, B.; Battocchio, C.; Scalici, M.; Ceschin, S. Differential Phytotoxic Effect of Silver Nitrate (AgNO3) and Bifunctionalized Silver Nanoparticles (AgNPs-Cit-L-Cys) on Lemna Plants (Duckweeds). Aquat. Toxicol. 2022, 250, 106260. [Google Scholar] [CrossRef]
  28. Carioti, V.; Savio, S.; Fabriani, M.; Ellwood, N.T.W.; Gemin, L.; Congestri, R.; Iannelli, M.A.; Ceschin, S. Nickel Tolerance and Phytoremediation Potential of the Aquatic Plant Lemna Minuta and the Cyanobacterium Trichormus variabilis in Monoculture and Consortium. Aquat. Bot. 2025, 200, 103888. [Google Scholar] [CrossRef]
  29. Sasmaz, A.; Obek, E. The Accumulation of Silver and Gold in Lemna gibba L. Exposed to Secondary Effluents. Geochemistry 2012, 72, 149–152. [Google Scholar] [CrossRef]
  30. Domingo, G.; Bracale, M.; Vannini, C. Chapter 8—Phytotoxicity of Silver Nanoparticles to Aquatic Plants, Algae, and Microorganisms. In Nanomaterials in Plants, Algae and Microorganisms; Tripathi, D.K., Ahmad, P., Sharma, S., Chauhan, D.K., Dubey, N.K., Eds.; Academic Press: Cambridge, MA, USA, 2019; pp. 143–168. ISBN 978-0-12-811488-9. [Google Scholar]
  31. OECD 2006. Test No. 221: Lemna sp. Growth Inhibition Test. Available online: https://www.oecd.org/en/publications/test-no-221-lemna-sp-growth-inhabition-test_9789264016194-en.html (accessed on 10 October 2025).
  32. Li, X.; Gu, A.Z.; Zhang, Y.; Xie, B.; Li, D.; Chen, J. Sub-Lethal Concentrations of Heavy Metals Induce Antibiotic Resistance via Mutagenesis. J. Hazard. Mater. 2019, 369, 9–16. [Google Scholar] [CrossRef]
  33. Sharma, P.; Singh, S.P.; Tong, Y.W. Chapter 2—Phytoremediation of Metals: Bioconcentration and Translocation Factors. In Current Developments in Biotechnology and Bioengineering; Sharma, P., Pandey, A., Tong, Y.W., Ngo, H.H., Eds.; Elsevier: Amsterdam, The Netherlands, 2022; pp. 19–37. ISBN 978-0-323-99907-6. [Google Scholar]
  34. Radford, P.J. Growth Analysis Formulae—Their Use and Abuse. Crop Sci. 1967, 7, 171–175. [Google Scholar] [CrossRef]
  35. Lichtenthaler, H.K. [34] Chlorophylls and Carotenoids: Pigments of Photosynthetic Biomembranes. In Methods in Enzymology; Plant Cell Membranes; Academic Press: Cambridge, MA, USA, 1987; Volume 148, pp. 350–382. [Google Scholar]
  36. Heath, R.L.; Packer, L. Photoperoxidation in Isolated Chloroplasts: I. Kinetics and Stoichiometry of Fatty Acid Peroxidation. Arch. Biochem. Biophys. 1968, 125, 189–198. [Google Scholar] [CrossRef]
  37. Aebi, H. [13] Catalase in Vitro. In Methods in Enzymology; Oxygen Radicals in Biological Systems; Academic Press: Cambridge, MA, USA, 1984; Volume 105, pp. 121–126. [Google Scholar]
  38. Habig, W.H.; Jakoby, W.B. [51] Assays for Differentiation of Glutathione S-Transferases. In Methods in Enzymology; Detoxication and Drug Metabolism: Conjugation and Related Systems; Academic Press: Cambridge, MA, USA, 1981; Volume 77, pp. 398–405. [Google Scholar]
  39. Yruela, I. Copper in Plants: Acquisition, Transport and Interactions. Funct. Plant Biol. 2009, 36, 409–430. [Google Scholar] [CrossRef]
  40. Malina, T.; Lamaczová, A.; Maršálková, E.; Zbořil, R.; Maršálek, B. Graphene Oxide Interaction with Lemna Minor: Root Barrier Strong Enough to Prevent Nanoblade-Morphology-Induced Toxicity. Chemosphere 2022, 291, 132739. [Google Scholar] [CrossRef] [PubMed]
  41. Goswami, C.; Majumder, A. Potential of Lemna Minor in Ni and Cr Removal from Aqueous Solution. Pollution 2015, 1, 373–385. [Google Scholar] [CrossRef]
  42. Khellaf, N.; Zerdaoui, M. Growth Response of the Duckweed Lemna gibba L. to Copper and Nickel Phytoaccumulation. Ecotoxicology 2010, 19, 1363–1368. [Google Scholar] [CrossRef] [PubMed]
  43. Hu, C.; Liu, L.; Li, X.; Xu, Y.; Ge, Z.; Zhao, Y. Effect of Graphene Oxide on Copper Stress in Lemna minor L.: Evaluating Growth, Biochemical Responses, and Nutrient Uptake. J. Hazard. Mater. 2018, 341, 168–176. [Google Scholar] [CrossRef]
  44. Mukhtar, S.M.; HAQ Bhatti, H.N.; Khalid, M.; Haq, M.A.; Shahzad, S.M. Potential of Sunflower (Helianthus annuus L.) for Phytoremediation of Nickle (Ni) and Lead (Pb) Contaminated Water. Pak. J. Bot. 2010, 42, 4017–4026. [Google Scholar]
  45. Kazemi, N.; Khavari-Nejad, R.A.; Fahimi, H.; Saadatmand, S.; Nejad-Sattari, T. Effects of Exogenous Salicylic Acid and Nitric Oxide on Lipid Peroxidation and Antioxidant Enzyme Activities in Leaves of Brassica napus L. under Nickel Stress. Sci. Hortic. 2010, 126, 402–407. [Google Scholar] [CrossRef]
  46. Chen, J.; Mu, Q.; Tian, X. Phytotoxicity of Graphene Oxide on Rice Plants Is Concentration-Dependent. Mater. Express 2019, 9, 635–640. [Google Scholar] [CrossRef]
  47. Zayed, A.; Gowthaman, S.; Terry, N. Phytoaccumulation of Trace Elements by Wetland Plants: I. Duckweed. J. Environ. Qual. 1998, 27, 715–721. [Google Scholar] [CrossRef]
  48. Axtell, N.R.; Sternberg, S.P.K.; Claussen, K. Lead and Nickel Removal Using Microspora and Lemna minor. Bioresour. Technol. 2003, 89, 41–48. [Google Scholar] [CrossRef]
  49. Kanoun-Boulé, M.; Vicente, J.A.F.; Nabais, C.; Prasad, M.N.V.; Freitas, H. Ecophysiological Tolerance of Duckweeds Exposed to Copper. Aquat. Toxicol. 2009, 91, 1–9. [Google Scholar] [CrossRef]
  50. Malec, P.; Maleva, M.; Prasad, M.N.V.; Strzałka, K. Copper Toxicity in Leaves of Elodea Canadensis Michx. Bull. Environ. Contam. Toxicol. 2009, 82, 627–632. [Google Scholar] [CrossRef]
  51. You, Y.; Liu, L.; Wang, Y.; Li, J.; Ying, Z.; Hou, Z.; Liu, H.; Du, S. Graphene Oxide Decreases Cd Concentration in Rice Seedlings but Intensifies Growth Restriction. J. Hazard. Mater. 2021, 417, 125958. [Google Scholar] [CrossRef]
  52. Mottier, A.; Légnani, M.; Candaudap, F.; Flahaut, E.; Mouchet, F.; Gauthier, L.; Evariste, L. Graphene Oxide Worsens Copper-Mediated Embryo-Larval Toxicity in the Pacific Oyster While Reduced Graphene Oxide Mitigates the Effects. Chemosphere 2023, 335, 139140. [Google Scholar] [CrossRef]
  53. Ben Amor, N.; Ben Hamed, K.; Debez, A.; Grignon, C.; Abdelly, C. Physiological and Antioxidant Responses of the Perennial Halophyte Crithmum maritimum to Salinity. Plant Sci. 2005, 168, 889–899. [Google Scholar] [CrossRef]
  54. Mishra, N.; Jiang, C.; Chen, L.; Paul, A.; Chatterjee, A.; Shen, G. Achieving Abiotic Stress Tolerance in Plants through Antioxidative Defense Mechanisms. Front. Plant Sci. 2023, 14, 1110622. [Google Scholar] [CrossRef] [PubMed]
  55. Zhao, Z.; Shi, H.; Duan, D.; Li, H.; Lei, T.; Wang, M.; Zhao, H.; Zhao, Y. The Influence of Duckweed Species Diversity on Ecophysiological Tolerance to Copper Exposure. Aquat. Toxicol. 2015, 164, 92–98. [Google Scholar] [CrossRef] [PubMed]
  56. Mittler, R.; Vanderauwera, S.; Suzuki, N.; Miller, G.; Tognetti, V.B.; Vandepoele, K.; Gollery, M.; Shulaev, V.; Breusegem, F.V. ROS Signaling: The New Wave? Trends Plant Sci. 2011, 16, 300–309. [Google Scholar] [CrossRef]
  57. Dobritzsch, D.; Grancharov, K.; Hermsen, C.; Krauss, G.-J.; Schaumlöffel, D. Inhibitory Effect of Metals on Animal and Plant Glutathione Transferases. J. Trace Elem. Med. Biol. 2020, 57, 48–56. [Google Scholar] [CrossRef]
Figure 1. Comparative Lattice Structures of Graphene, Graphene Oxide (GO), and Reduced Graphene Oxide (rGO). This figure illustrates the distinct atomic arrangements and characteristic functional groups present in each material. (Adapted from Amieva et al., 2016 [12]).
Environments 12 00407 g001
Figure 2. Schematic Representation of the Experimental Design. This figure details the individual treatment groups: control plants (CP); plants with 1 mg L−1 rGO (PG); plants with metal only (PM) (either 1.33 mg L−1 Ni or 1 mg L−1 Cu); and plants co-exposed to rGO and metal (Ni or Cu; PGM); their respective triplicates and the specific time points (T7 and T14) at which samples were collected.
Environments 12 00407 g002
Figure 3. (A) Biomass (Fresh Weight, FW, g) and (B) Relative Growth Rate (RGR, g g−1 day−1). Mean values ± standard deviations (SD) with different letters indicate a significant difference with p < 0.05 (n = 3). L. minor plants grown under different treatments (TRT): control plant (CP), with rGO (PG), with Ni (PM), and co-exposure to rGO and Ni (PGM) at 7 and 14 days (T7 and T14). Asterisks indicate significant differences between time and treatments, as well as of their interaction (*** = 0.001; ** = 0.01; ns = no significant) as determined by two-way ANOVA, following Duncan’s test.
Environments 12 00407 g003
Figure 4. (A) Total Chlorophyll (mg Chl TOT g−1 FW) and (B) Carotenoids (mg Car g−1 FW). Mean values ± standard deviations (SD) with different letters indicate a significant difference with p < 0.05 (n = 3). L. minor plants grown under different treatments (TRT): control plant (CP), with rGO (PG), with Ni (PM), and co-exposure to rGO and Ni (PGM) at 7 and 14 days (T7 and T14). Asterisks indicate significant differences between time and treatments, as well as of their interaction (*** = 0.001; ** = 0.01) as determined by two-way ANOVA, following Duncan’s test.
Environments 12 00407 g004
Figure 5. Visual representation of chlorosis symptoms in L. minor plants grown under control conditions (CP), with rGO (PG), in the presence of Ni (PM), and with combined exposure to rGO and Ni (PGM) at 7 and 14 days (T7 and T14).
Environments 12 00407 g005
Figure 6. Malondialdehyde (MDA, nmol g−1 FW). Mean values ± standard deviations (SD) with different letters indicate a significant difference with p < 0.05 (n = 3). L. minor plants grown under different treatments (TRT): control plant (CP), with rGO (PG), with Ni (PM), and co-exposure to rGO and Ni (PGM) at 7 and 14 days (T7 and T14). Asterisks indicate significant differences between time and treatments, as well as of their interaction (*** = 0.001; ** = 0.01) as determined by two-way ANOVA, following Duncan’s test.
Environments 12 00407 g006
Figure 7. (A) Ni content in plant (mg Ni kg−1 DW) and (B) Ni Bioconcentration factor (BCF). Mean values ± standard deviations (SD) with different letters indicate a significant difference with p < 0.05 (n = 3). L. minor plants grown under different treatments (TRT): control plant (CP), with rGO (PG), with Ni (PM), and co-exposure to rGO and Ni (PGM) at 7 and 14 days (T7 and T14). Asterisks indicate significant differences between time and treatments, as well as of their interaction (ns = no significant) as determined by two-way ANOVA, following Duncan’s test.
Environments 12 00407 g007
Figure 8. (A) Biomass (Fresh Weight, FW, g) and (B) Relative Growth Rate (RGR, g g−1 day−1). Mean values ± standard deviations (SD) with different letters indicate a significant difference with p < 0.05 (n = 3). L. minor plants grown under different treatments (TRT): control plant (CP), with rGO (PG), with Cu (PM), and co-exposure to rGO and Cu (PGM) at 7 and 14 days (T7 and T14). Asterisks indicate significant differences between time and treatments, as well as of their interaction (*** = 0.001) as determined by two-way ANOVA, following Duncan’s test.
Environments 12 00407 g008
Figure 9. (A) Total Chlorophyll (mg Chl TOT g−1 FW) and (B) Carotenoids (mg Car g−1 FW). Mean values ± standard deviations (SD) with different letters indicate a significant difference with p < 0.05 (n = 3). L. minor plants grown under different treatments (TRT): control plant (CP), with rGO (PG), with Cu (PM), and co-exposure to rGO and Cu (PGM) at 7 and 14 days (T7 and T14). Asterisks indicate significant differences between time and treatments, as well as of their interaction (*** = 0.001; ** = 0.01) as determined by two-way ANOVA, following Duncan’s test.
Environments 12 00407 g009
Figure 10. Visual representation of chlorosis symptoms in L. minor plants grown under control conditions (CP), with rGO (PG), in the presence of Cu (PM), and with combined exposure to rGO and Cu (PGM) at 7 and 14 days (T7 and T14).
Environments 12 00407 g010
Figure 11. Malondialdehyde (MDA, nmol g−1 FW). Mean values ± standard deviations (SD) with different letters indicate a significant difference with p < 0.05 (n = 3). L. minor plants grown under different treatments (TRT): control plant (CP), with rGO (PG), with Cu (PM), and co-exposure to rGO and Cu (PGM) at 7 and 14 days (T7 and T14). Asterisks indicate significant differences between time and treatments, as well as of their interaction (*** = 0.001; ns = no significant) as determined by two-way ANOVA, following Duncan’s test.
Environments 12 00407 g011
Figure 12. (A) Cu content in plant (mg Cu kg−1 DW) and (B) Cu Bioconcentration factor (BCF). Mean values ± standard deviations (SD) with different letters indicate a significant difference with p < 0.05 (n =3). L. minor plants grown under different treatments (TRT): control plant (CP), with rGO (PG), with Cu (PM), and co-exposure to rGO and Cu (PGM) at 7 and 14 days (T7 and T14). Asterisks indicate significant differences between time and treatments, as well as of their interaction (*** = 0.001; * = 0.05; ns = no significant) as determined by two-way ANOVA, following Duncan’s test.
Environments 12 00407 g012
Figure 13. Radar-plot representation of (A) Catalase (CAT); and (B) Glutathione-S-Transferase (GST). Mean values ± standard deviations (SD) with different letters indicate a significant difference with p < 0.05 (n = 3). L. minor plants grown under different treatments (TRT): control plant (CP), with rGO (PG), with Cu (PM), and co-exposure to rGO and Cu (PGM) at 7 and 14 days (T7 and T14). Asterisks indicate significant differences between time and treatments, as well as of their interaction (*** = 0.001; ** = 0.01; ns = no significant) as determined by two-way ANOVA, following Duncan’s test.
Environments 12 00407 g013
Table 1. Catalase (CAT) and Glutathione-S-Transferase (GST) activities measured in L. minor plants grown in rGO-Cu co-exposure experiment. CP = control plants, PG = plants grown in presence of rGO; PM = plants grown in presence of copper; PGM = plants grown in presence of rGO and copper. Data represent the mean ± SD (n = 3). Different letters indicate statistically significant differences among treatments at the p < 0.05 level after Duncan’s test.
CATGST
nmol H2O2 min−1 g−1 FWnmol CDNB min−1 g−1 FW
T7T14T7T14
CP219.6 ± 47.7 d226.3 ± 22.5 d139.0 ± 13.9 d109.6 ± 14.6 d
PG180.1 ± 50.7 d510.2 ± 70.6 ab183.1 ± 35.6 bc64.8 ± 11.0 e
PM383.0 ± 83.1 c255.0 ± 33.6 d253.7 ± 80.3 a212.8 ± 63.1 ab
PGM553.7 ± 36.2 a423.3 ± 22.9 bc104.9 ± 17.4 de149.8 ± 34.5 cd
Disclaimer/Publisher’s Note: The statements, opinions and data contained in all publications are solely those of the individual author(s) and contributor(s) and not of MDPI and/or the editor(s). MDPI and/or the editor(s) disclaim responsibility for any injury to people or property resulting from any ideas, methods, instructions or products referred to in the content.