Abstract
Coal remains an important fuel for use in thermal power plants. However, coal-burning power plants produce large amounts of CFA, which contains TEs such as B, F, and Se, which are leached upon contact with water and act as potential polluters of aquifer systems and soil. To study the transformation of TEs, a thermodynamic calculation (FactSage 7.2) was used. Paper sludge ash was used as a calcium compound additive. The influence of blending a high-calcium additive on the environmental safety of TEs was investigated based on the effect of the mass addition ratio of PS ash. This study’s results confirmed that the leaching processes of TEs, namely (CaO)2(Al2O3), CaF2, Ca10(PO4)F2, and CaSeO4(H2O)2, were caused by the formation of B, F, and Se compounds during the leaching process. Thus, it is clear that calcium has the greatest influence on the transformation of TEs due to their reaction, which, in turn, minimizes the effects of the TEs’ release into the environment. The concentrations of TEs from the sample and addition of PS ash decreased slightly, indicating that the inhibition of TEs was enabled through the addition of PS ash. Although the PS ash YB had the highest calcium content, the PS ash YC gave the best results during the B and Se inhibition processes. The experimental observation was also evaluated for comparison. For the analysis of TEs’ leaching ratios using the thermodynamic calculation and experiment, the experimental results were lower than those initially predicted. These results will help us to choose the best available control technology to minimize the effects of TEs released into the environment.
1. Introduction
In 2040, coal is expected to be the single largest fuel source for energy generation, with a predicted share of almost 30%. Coal power plants generate millions of tons of coal combustion products (CCPs) each year, such as flue gas desulfurization materials, bottom ash, coal fly ash, boiler slag, and pollutant gases. Coal fly ash (CFA) is the most hazardous coal combustion product, as it contains hazardous leachable trace elements (TEs), such as As, Mo, and Se [1], in quantities sufficient to cause environmental damage. In coal fly ash, the concentration of trace elements is over 50 mg/kg, though the exact concentration depends on the composition of the original coal [2,3,4]. During the combustion process, the organic matter in coal is destroyed; resultantly, the concentrations of trace elements in coal fly ash are enhanced relative to those in the source coal [5]. Trace element release via combustion is one of the most environmentally damaging aspects of coal-based energy production due to its toxic and potentially carcinogenic propensities, as well as its high volatility. In recent years, coal fly ash has been utilized in different ways, including as a substitute material for Portland cement, structural fills (usually for road construction), soil stabilization, and mineral filler in asphaltic concrete, due to its physical properties. However, most coal fly ash derived from coal combustion is subjected to disposal. The disposal process involves interactions between fly ash particles and weathering and hydrological processes, through which rainfall leaches out trace elements, anions, and cations from the ash heaps, which pose environmental hazards by contaminating soil water, surface water, and groundwater. Recently, As, B, Cr, F, and Se species have attracted significant attention because of their high mobility and toxicity in the environment [4,6,7]. Given the increase in public awareness of the environmental impacts of coal combustion, it is vital to control TEs during coal combustion, as well as their leaching during fly ash treatment. To prevent TEs derived from coal fly ash from contaminating the environment, these elements can be removed through washing with water [8,9], acid, or other reagents [10], as well as by adding chemicals such as a Ca additive [11]. Ogawa et al. reported that upon treating fourteen different alkaline coal fly ashes via aging for 1–4 weeks at 10–30 °C, the concentration of As decreased both after being aged for a week and with an increase in the aging temperature of some coal fly ash samples. The fact that B and Cr were immobilized under colder conditions but underwent aging at the highest temperatures enhanced the leachability of Cr in some samples, and the fluorine content effectively decreased under warmer conditions. Fluoride (the anion of fluorine) is listed as a common contaminant of water by the World Health Organization (WHO) because it can cause many human health problems [12]. In plants, F can be absorbed by plants under natural conditions, and it is bound to insoluble compounds such as CaF2 [13].
Highly soluble particles such as CaO dissolve upon contact with water; only adding small amounts of water to coal fly ash for aging might lead to both the alkaline and strong super-saturation conditions required for the formation of several types of Ca-bearing minerals in coal fly ash paste, such as calcite and ettringite [14]. In another study, the higher leachability of As in acidic fly ash (HA) and alkaline fly ash (PD) was related to the detection of larger fractions of water-soluble and/or exchangeable trace elements via a serial leaching test [15]. In addition, the temperature during the leaching process also affects the leaching of trace elements from fly ash at temperatures above 30 °C, and the trace elements are stabilized completely, regardless of the pH [16]. For the development of additives that inhibit the leaching of trace elements into the environment, a previous study found that calcium helps to decrease the trace element leaching concentration; the application of mixture-based additives (PS ash + cements + Ca(OH)2) had a promising effect in terms of inhibiting the leaching of several trace elements, including by controlling the leaching of As, B, Cr, F, and Se [17,18,19].
The thermodynamic calculation of a chemical reaction in a closed system was performed based on the second law of thermodynamics, which was, in turn, used based on the principle of minimizing the free Gibbs energy. The factors affecting the free Gibbs energy included the chemical composition and structure as well as the condensed state (gas, liquid, or solid). A few past studies have used thermodynamic calculations to quantify trace element portioning behavior during the co-combustion and leaching processes, thus providing information about interactions based on a particular condition (e.g., temperature, pressure, and major elements in the sample) [19,20,21,22,23]. Liu et al. [20] reported that when developing a sewage sludge co-combustion system with multiple oxides of SiO2, Al2O3, and CaO, As reacted with CaO and Al2O3 to form AlAsO4(s) and Ca3(AsO4)2(s), which, in turn, inhibited As volatilization. In another study, the abundance of free CaO in fly ash generated an alkaline leachate during the leaching test and successively reduced As leaching as the precipitate preferentially occurred via the reaction of As with calcium and a high-pH leachate [23]. They also reported that the final pH of the leachate influenced the leaching process. An acidic leachate promoted the release of arsenic, indicating that adding CaO during the leaching process had no lasting consequences, meaning that trace elements may be mobilized due to environmental changes, such as by lowering the pH and increasing the temperature.
CaO is the major mineral oxide present in paper sludge ash; therefore, understanding the way that TEs interact with CaO could help us to determine the influence of a Ca additive on the environmental safety of TEs. This study outlines the influence of paper sludge ash as a Ca source when using different mass addition ratios as additives, possible TE formation, and its mechanism during the leaching process using FactSage 7.2 software analysis. The experimental analysis using the same parameters is also displayed for comparison. Applying an additive during the leaching process is a promising method for preventing trace element compounds from entering the environment and minimizing their leachability from coal fly ash.
2. Materials and Methods
2.1. Coal fly Ash Sample
The coal fly ash sample used in this research was obtained from a coal-fired power plants in Japan, namely FA AA. The chemical composition of the coal fly ash sample was determined via X-ray fluorescence analysis (WDXRF S8 TIGER, Bruker AXS, Yokohama, Japan). For the XRF analysis of the CFA and PS ash samples, small amounts of both (approximately 500 mg) were poured onto polypropylene thin film, which was attached previously onto a plastic O-ring sample cup with an outer diameter of 40 mm. The samples were added to the XRF instrument, and the chemical compositions of the samples were determined. Table 1 shows the chemical composition of the coal fly ash sample used in this study. Based on the XRF analysis, the calcium content of the CFA sample was 1.13%, and the calcium content of the PS ash ranged from 42.03% to 51.63%. The B, F, and Se contents in the CFA were 160.00 mg/kg, 10.00 mg/kg, and 3.87 mg/kg, respectively, while the PS ash also contained B, F, and Se.

Table 1.
Chemical composition of coal fly ash and paper sludge ash as additive by XRF analysis.
2.2. Paper Sludge Ash as Inhibitor
The papermaking industry generates paper sludge ash (PS ash) waste as a by-product of the de-inking and re-pulping of paper, while filter cake is sourced from the lime industry, as it is a waste product derived from the CaCO3 manufacturing process. Several previous studies performed in our laboratory showed that the presence of Ca in fly ash greatly influences the leaching behavior of As, B, Cr, F, and Se, as the leaching of these elements may involve trapping As, B, Cr, F, and Se species through the ettringite phase (3CaO·Al2O3·3CaSO4 ·32H2O), leading to decreases in leaching under alkaline conditions [17,18,19]. Therefore, the Ca content and the sorption process play important roles in the release of As, B, Cr, F, and Se from CFA. Regarding the Ca content of the CFA sample, adding and blending the Ca compound maximizes the Ca concentration in the CFA sample. One of the substances that contains a large amount of calcium is PS ash. Therefore, adding PS ash can increase the Ca content, allowing us to control the release of trace elements into the CFA sample.
The paper sludge ash used in this study was obtained from a supplier operating in the papermaking industry in Japan. In this study, we used six types of PS ash, namely PS ash XA, PS ash XB, PS ash XC, PS ash YA, PS ash YB, and PS ash YC. The chemical composition of the PS ash was determined via X-ray fluorescence analysis (WDXRF S8 TIGER, Bruker AXS, Yokohama, Japan). As shown in Table 1, the PS ash used contained different CaO contents, with some variation between the lowest (PS ash YA, 42.03%) and highest CaO contents (PS ash YB, 51.63%). We also noted that the PS ash contained trace elements, which may influence the leaching characteristics and distribution of trace-element-bearing compounds during the leaching process.
2.3. Leaching Test
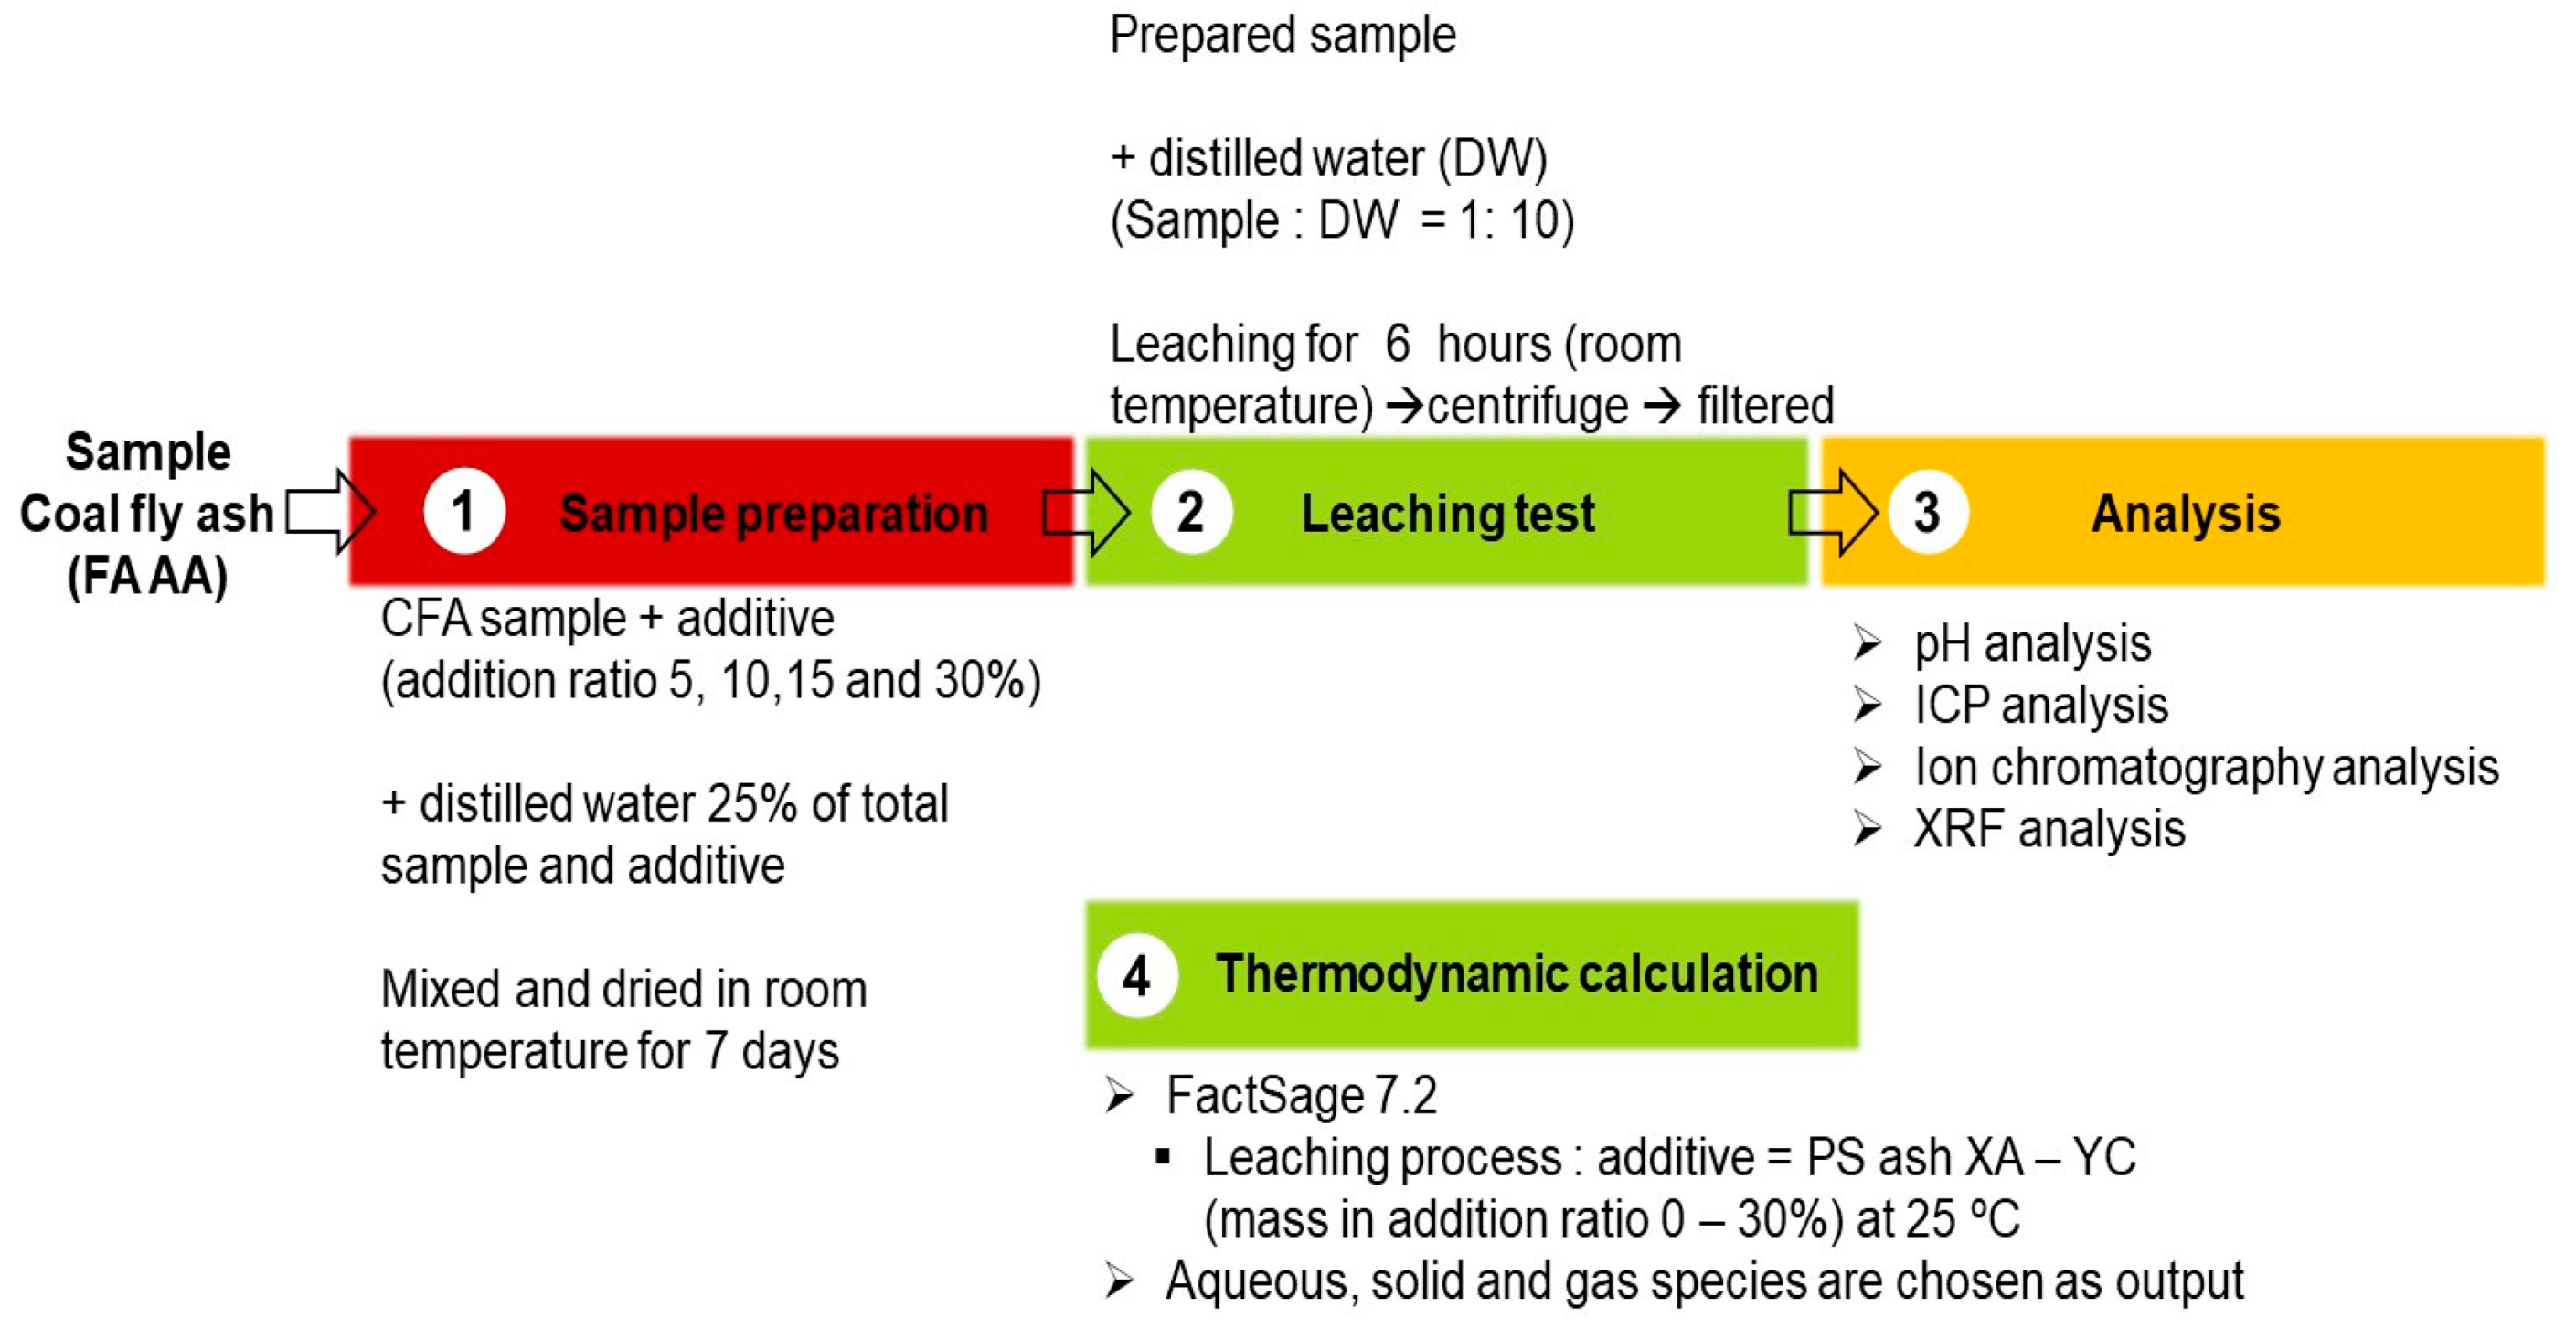
The leaching behavior of the trace elements derived from coal fly ash was quantified using the leaching test according to a procedure outlined by the Environment Agency of Japan’s Notification No. 13 [24]. Regarding the leaching procedure used in this work, as shown as Figure 1, in steps 1–3, the CFA sample was mixed with additives with variations of 5, 10, 15, and 30 wt.% before adding 25 wt.% of distillate water and air-drying the sample for 7 days at room temperature. A 5 g mixture of the prepared sample and 50 mL of distillate water in a polyethylene bottle were continuously shaken at a speed of 200 rpm for 6 h at room temperature. Then, the sample was placed into a centrifuge at 2000 rpm for 20 min and suction-filtered through a cellulose membrane filter of 0.45 µm (Mixed Cellulose Esters Membrane Filter, Toyo Roshi Kaisha, Ltd. Tokyo, Japan) to obtain the filtrate. Then, the filtrate was carefully analyzed using inductively coupled plasma atomic emission spectroscopy (ICP-AES, ULTIMA 2, HORIBA, Tokyo, Japan) to measure the B and Se. The limits of detection (LODs) for the method that used B and Se were 0.01 mg/L and 1 µg/L, respectively. The fluorine analysis was performed using ion chromatography (ION ANALYZER IA-300, DKK-TOA Corporation, Tokyo, Japan) with a limit of quantification (LOQ) of 0.025 mg/L. The B, F, and Se analyses were performed using several parallel samples until we possessed two datasets that differed only slightly, and the data were expressed as the average value.
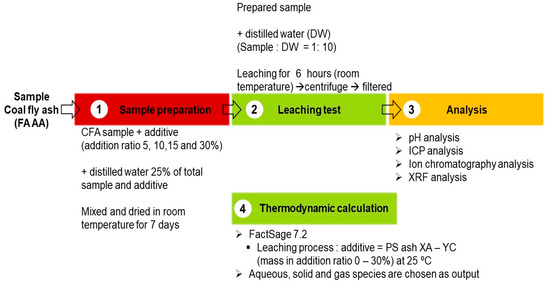
Figure 1.
Schematic diagram of the leaching test and thermodynamic calculation.
2.4. Thermodynamic Calculation Analysis
In this study, thermodynamic calculation software (FactSage 7.2, Environmental and Renewable Energy Laboratory, Gifu University, Gifu, Japan) was used to perform a thermodynamic calculation to minimize the free Gibbs energy to simulate the chemical reaction equilibrium and processes. FactSage includes a compound database of all coal fly ash components. This calculation was used to predict the possible TE-bearing compounds in the coal fly ash and their distribution within six types of paper sludge ash (PS ash XA, XB, XC, YA, YB, and YC) and their mass addition ratio (10 and 30 wt.%). The data search tools used in this analysis included FactPS and FToxid. The leaching process, the predicted TE compounds, and the PS ash with a mass addition ratio at room temperature and atmospheric pressure were used as the input data. During the simulation analysis, aqueous and solid species were chosen as the outputs.
3. Results and Discussion
3.1. Leaching Characteristics of Coal Fly Ash and Paper Sludge Ash
The coal fly ash (FA AA) without the additive had different trends for the leaching of B, F, and Se, as shown in Table 2. The FA AA sample had relatively higher leachate concentrations of B, F, and Se than the environmental limit. The analyzed concentrations of B, F, and Se were 5.42 mg/L, 1.31 mg/L, and 37.75 µg/L, respectively. On the other hand, the leachate concentrations of B and Se in the PS ash were already below the environmental limit. The boron concentration of the paper sludge ash was analyzed in the range of < LOD as being 0.16 mg/L. The selenium leaching concentration was analyzed in the range of < LOD as being 5.70 µg/L. Despite the results obtained for B and Se, the concentration of fluorine was higher than the environmental limits for the PS ash XA, PS ash XB, and PS ash XC, while those of the PS ash YA, PS ash YB, and PS ash YC were already below environmental limit. The fluorine leaching concentration was analyzed in the range of from 0.40 to 9.06 mg/L.
Table 2.
Trace element leachate concentrations in coal fly ash and paper sludge ash.
The Ca concentration of the host FA AA at 181 mg/L was lower than that of the PS ash. The high Ca content in the PS ash could influence the inhibition of trace elements in the environment. The Ca concentration in the host PS ash was in the range of from 677 to 1045 mg/L, and the XRF analysis also showed that the CaO compound of the original Ca in the PS ash was higher than that of the FA AA sample. Regarding pH characterization, the sample and additive are classified as alkaline ashes (variation in pH in the range 10.04–12.51). To support the analysis, statistical analysis was performed using a single-factor ANOVA, as shown in Table 3. In this analysis, we performed the analysis as functions of different types of PS ash and the blending ratio of PS ash to the sample. As a function of the different types of PS ash, the F statistic was lower than the F critical value, meaning that the test was not significant. Regarding the p value, the analysis showed that the p value, as a function of the different types of PS ash, was 1.00, 0.29, and 1.00 for B, F, and Se, respectively. Regarding our hypotheses (p = 0.05), a p value > 0.05 meant that a null hypothesis occurred, with no difference recorded in the variation between the different kinds of PS ashes. On the other hand, as a function of the blending ratio of PS ash to the sample, the F statistic was higher than the F critical value, meaning that the test was significant. Regarding the p value, the analysis showed that the p value as a function of the blending ratio of PS ash to the sample was 5.33 × 10⁻²⁰, 0.027, and 2.39 × 10⁻¹⁵ for B, F, and Se, respectively. Regarding our hypotheses (p = 0.05), a p value < 0.05 meant that a null hypothesis occurred, indicating a significant difference between the blending ratio of PS ash to the sample for all elements, except fluorine (p value > 0.05).
Table 3.
Analysis of variation (single-factor ANOVA: p = 0.05) function of PS ash and blending ratio.
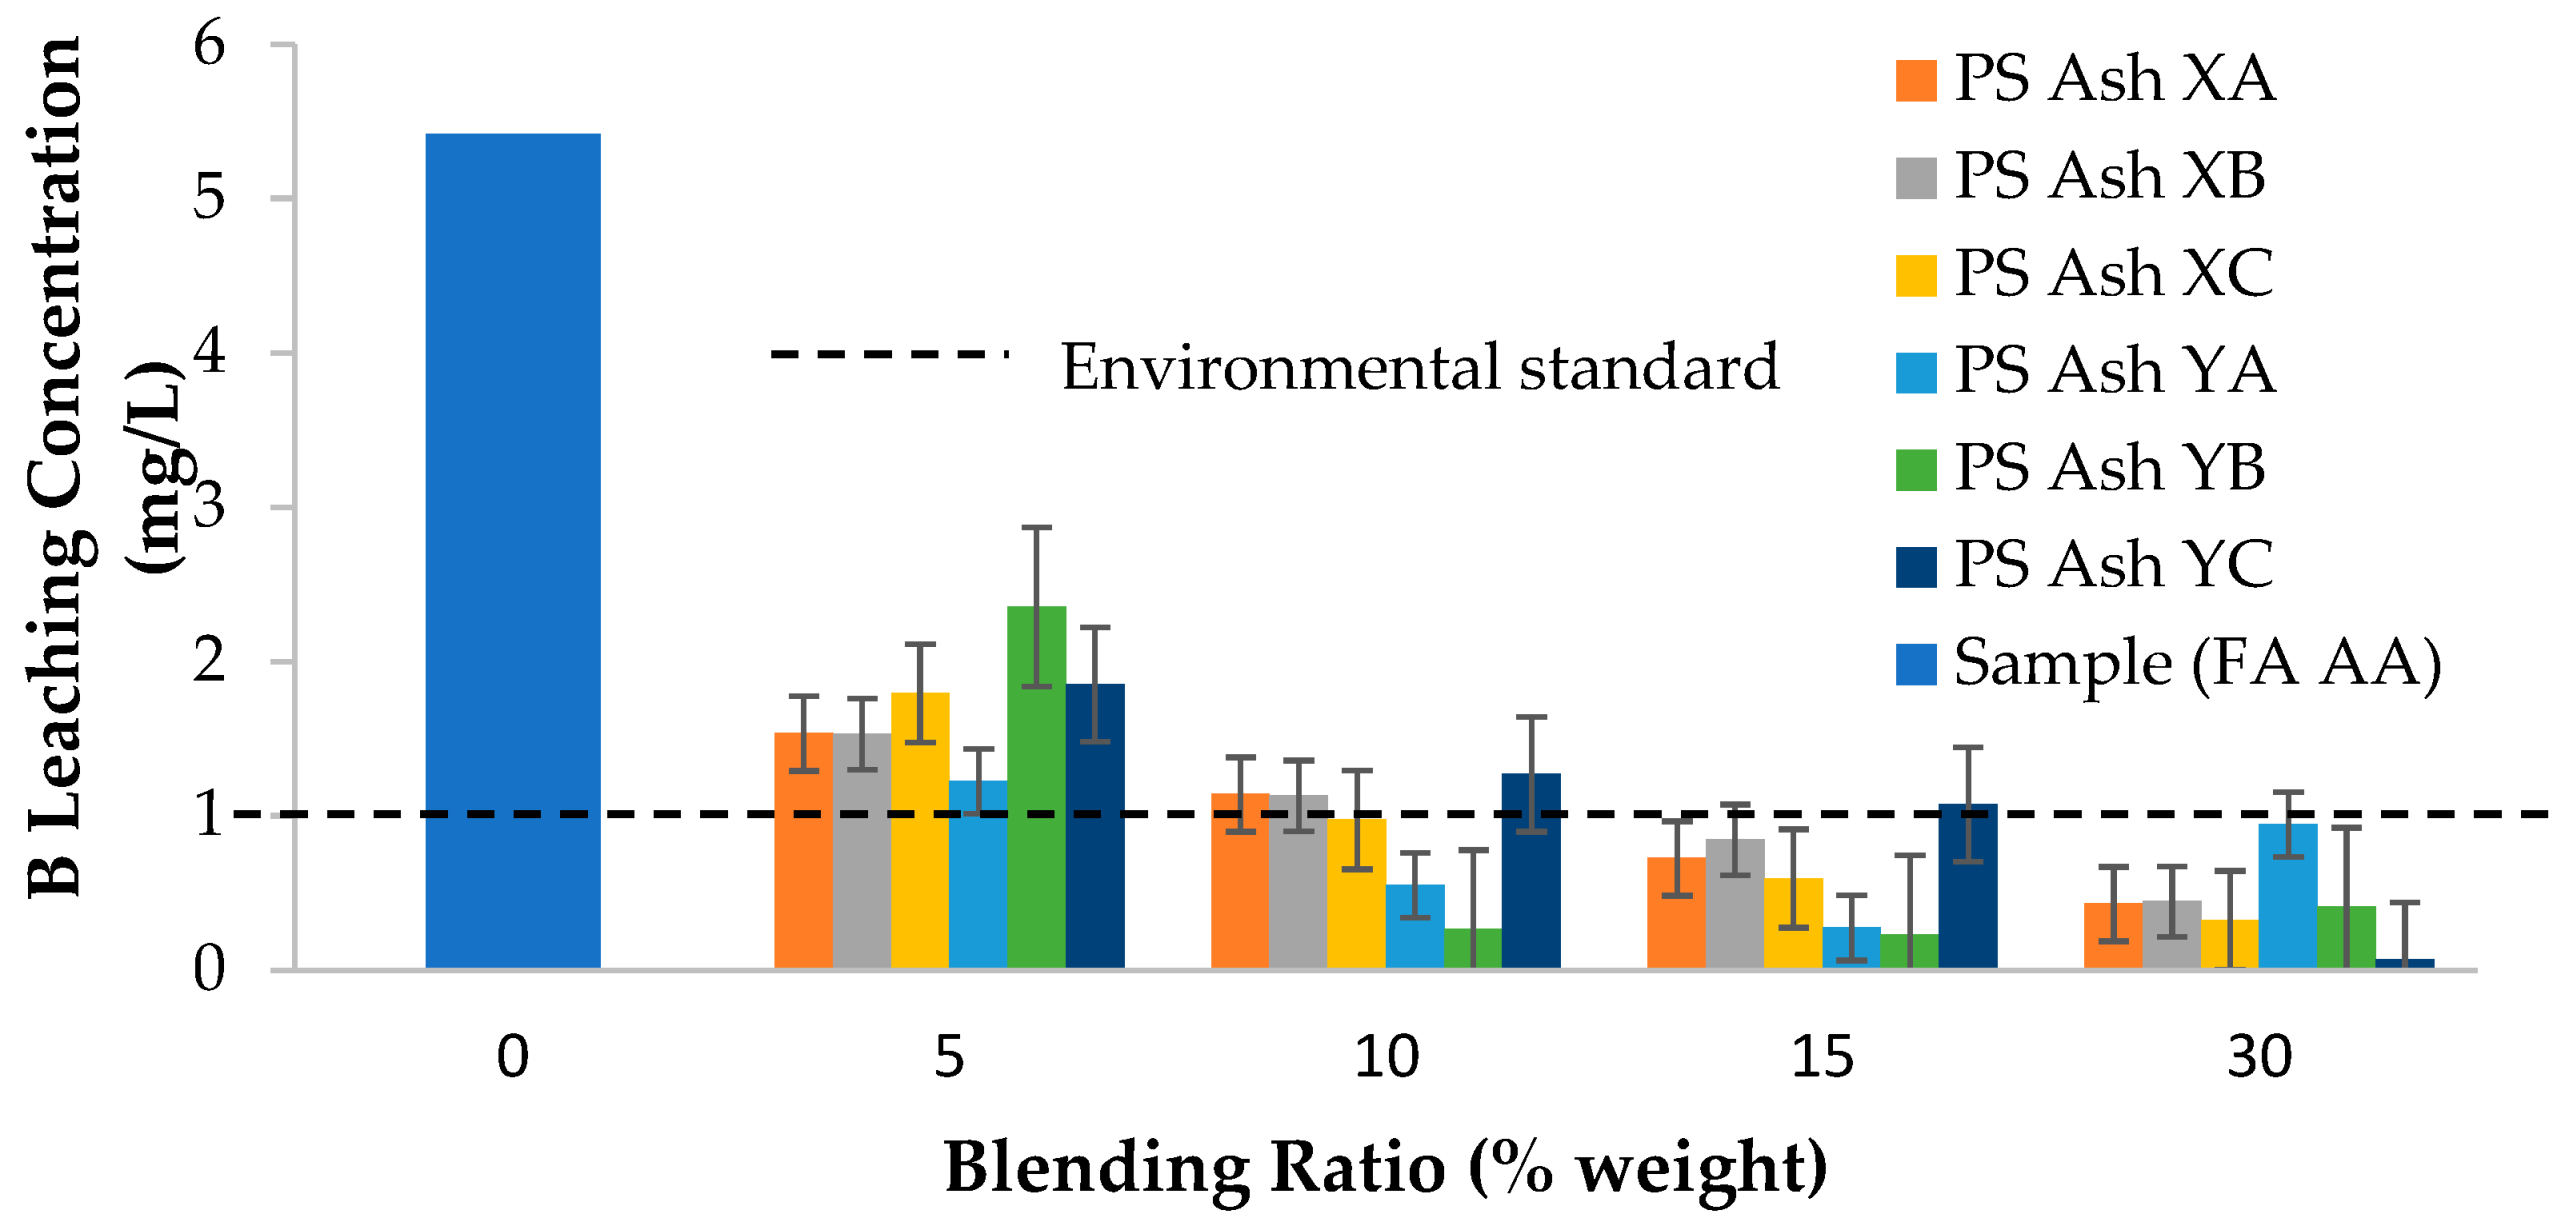
The impacts of blending a high-calcium additive on the environmental safety of B, F, and Se were investigated through the effect of the mass addition ratio of PS ash to FA AA, as shown in Figure 2, Figure 3 and Figure 4. The boron concentration of the extracts derived from the non-addition of additive samples was 5.42 mg/L. Adding PS ash contributed to B inhibition (see Figure 2), and the B concentrations decreased to 1.54 mg/L (PS ash XA), 0.53 mg/L (PS ash XB), 1.80 mg/L (PS ash XC), 1.23 mg/L (PS ash YA), 2.36 mg/L (PS ash YB), and 1.85 mg/L (PS ash YC) at a 5% addition ratio of the additive. The concentrations of B at an addition ratio of 15% decreased slightly due to the environmental limits, except for the PS ash YC (1.075 mg/L). In the last addition ratio studies of PS ash, for all the contributions of water-soluble B under the environmental limits, the B concentrations were 0.43 mg/L (PS ash XA), 0.445 mg/L (PS ash XB), 0.325 mg/L (PS ash XC), 0.945 mg/L (PS ash YA), 0.41 mg/L (PS ash YB), and 0.07 mg/L (PS ash YC). The concentrations of B from the sample and the PS ash additive slightly decreased, indicating that the inhibition of B was effective as a result of the addition of PS ash as an inhibitor. The best effect on the inhibition process at an addition ratio of 15% was recorded for the PS ash YB due to its the higher calcium content. Disparate results were recorded at an addition ratio of 30%; although the PS ash YB had the highest calcium content, the PS ash YC gave the best results for the inhibition process of B.

Figure 2.
The effect of the additive material on the B leaching concentration.
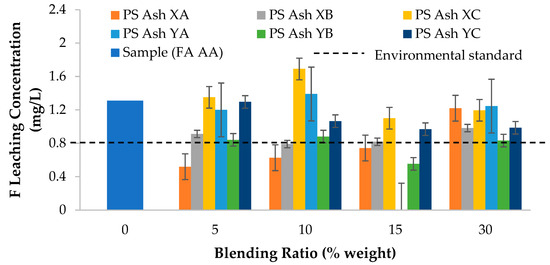
Figure 3.
The effect of the additive material on the F leaching concentration.
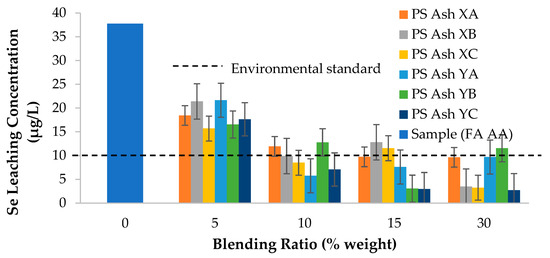
Figure 4.
The effect of the additive material on the Se leaching concentration.
The fluorine concentrations of the extracts derived from the non-addition of additive samples were all 1.31 mg/L. The addition of PS ash contributed to F inhibition (see Figure 3), and the F concentrations decreased slightly in some samples due to the addition, except for the PS ash XC, with increases of 0.52 mg/L (PS ash XA), 0.91 mg/L (PS ash XB), 1.35 mg/L (PS ash XC), 1.20 mg/L (PS ash YA), 0.84 mg/L (PS ash YB), and 1.30 mg/L (PS ash YC) recorded at a 5% addition ratio. In prior addition ratio studies of PS ash, all the contributions of water-soluble F remained above the environmental limit, and the F concentrations were 1.22 mg/L (PS ash XA), 0.98 mg/L (PS ash XB), 1.20 mg/L (PS ash XC), 1.25 mg/L (PS ash YA), 0.83 mg/L (PS ash YB), and 0.99 mg/L (PS ash YC). The concentration of F derived from the sample and addition of the PS ash did not reach the environmental limit, indicating that at a 30% addition ratio, the sample did not affect the inhibition of F. Thus, a higher addition ratio would be needed for more effective F inhibition.
The selenium concentrations of the extracts derived from the non-addition of additive samples were all 37.75 mg/L. The addition of PS ash contributed to Se inhibition (see Figure 4), and the Se concentrations decreased to 18.45 µg/L (PS ash XA), 21.4 µg/L (PS ash XB), 15.70 µg/L (PS ash XC), 21.65 µg/L (PS ash YA), 16.55 µg/L (PS ash YB), and 17.65 µg/L (PS ash YC) at a 5% addition ratio of the additive. The concentrations of Se at an addition ratio of 15% decreased slightly under the environmental limits, except for the PS ash XB and PS ash XC (12.8 µg/L and 11.55 µg/L, respectively). In prior addition ratio studies of the PS ash, for all the contributions of water-soluble Se under the environmental limits, except for the PS ash YB, the leaching concentration was increased by increasing the mass addition ratio from 15% (3.05 µg/L) to 30% (11.55 µg/L). The selenium concentrations were 9.65 µg/L (PS ash XA), 3.49 µg/L (PS ash XB), 3.25 µg/L (PS ash XC), 9.7 µg/L (PS ash YA), and 2.73 µg/L (PS ash YC). The concentrations of Se from the sample and the addition of the PS ash slightly decreased, indicating that the inhibition of Se was effective due to the addition of PS ash as an inhibitor. The best effect on the inhibition process of the different types of PS ashes at an addition ratio of 15% was given by the PS ash YB due to the higher calcium content. Disparate results were recorded at an addition ratio 30%; although the PS ash YB had the highest calcium content, the PS ash YC gave the best results for the inhibition process of Se.
3.2. Thermodynamic Calculation: The Transformation and Mechanism of Trace Elements during Leaching Process
Thermodynamic calculation was employed to theoretically predict the possible TE-bearing compounds in the fly ash and their distribution in the water solution. The possible TE distributions during the interactions between the TEs and paper sludge ash components during the leaching process are shown in Table 4. Based on the interaction, both the calcium compound and K, Mg, and Na compounds could inhibit the leaching of TEs. Based on our results, the speciation forms of B, F, and Se that occurred as a result of blending the CFA sample and the PS ash compound were (CaO)2(Al2O3)(B2O3), CaF2 and Ca10(PO4)6F2, and CaSeO4(H2O)2, respectively. It seems that B, F, and Se react and deal with Ca better than other mineral oxides.
Table 4.
Interactions between trace elements in coal fly ash and paper sludge ash during the leaching process.
3.2.1. Boron
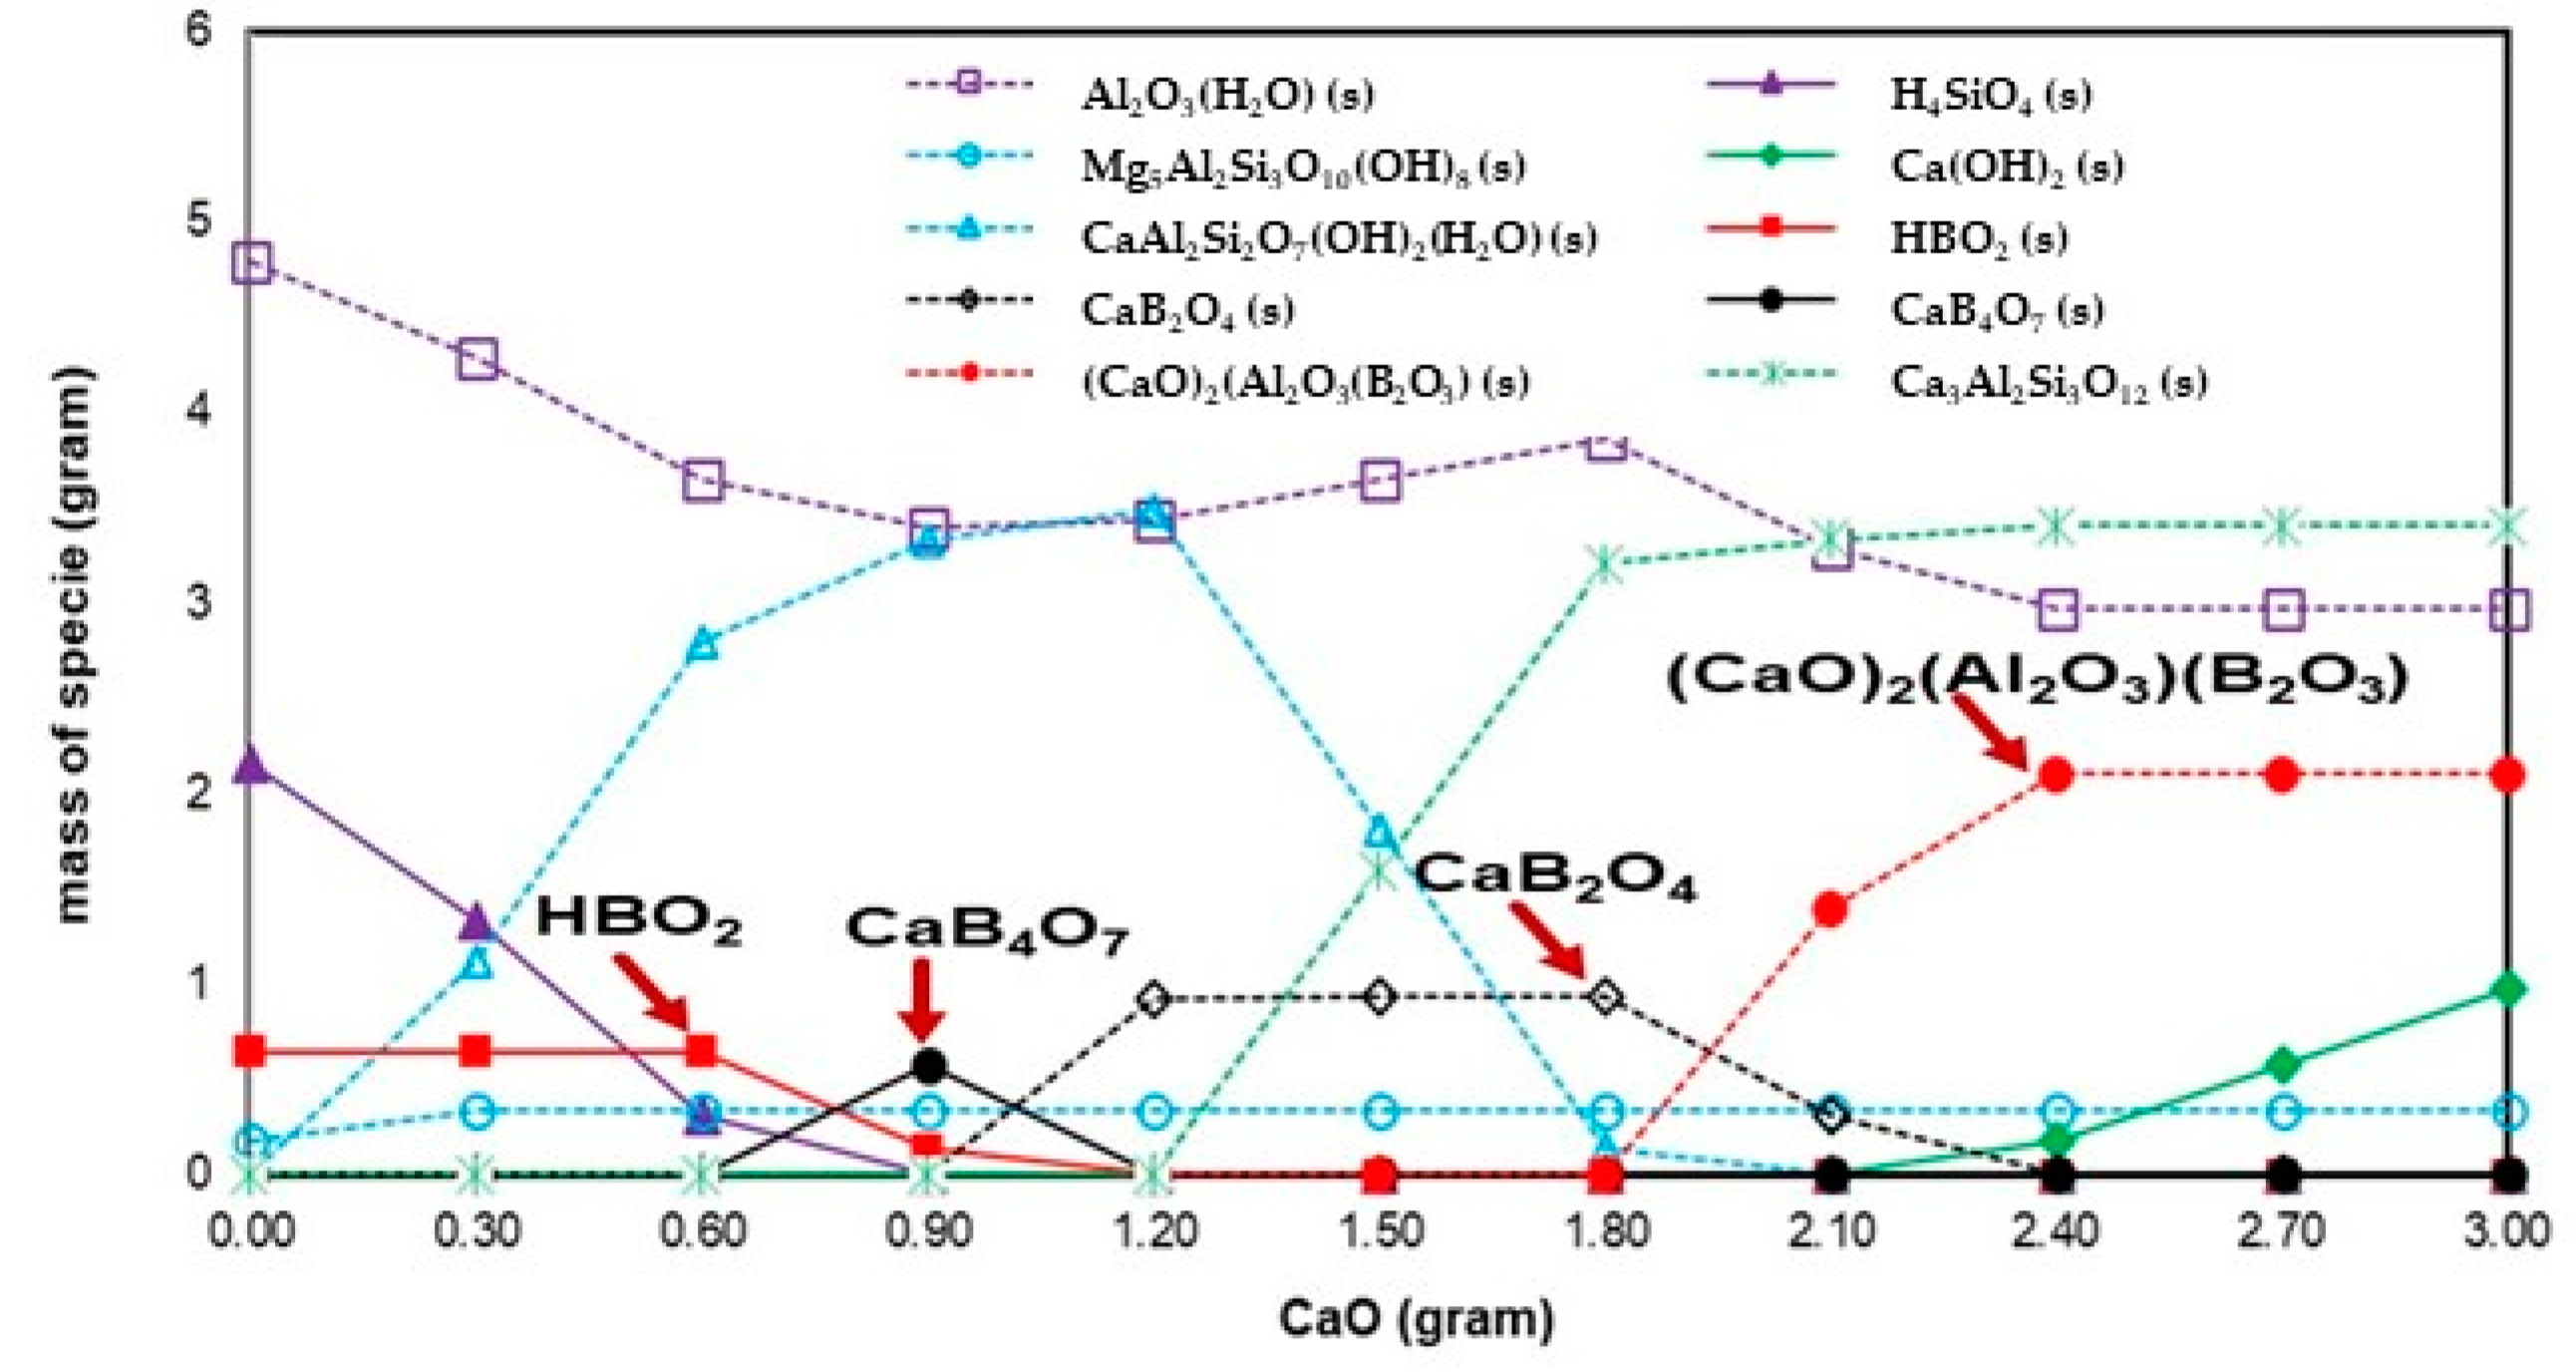
The leaching behavior of B derived from coal fly ash with PS ash clearly depends on the presence of CaO. Figure 5 shows the possible mechanism of boron distribution during the leaching process. Firstly, the predicted boron/(Al2O3)9(B2O3)2 reacts with water to form HBO2; with the addition of 0.6 g of CaO, HBO2 begins to decrease and CaB4O7 begins forming, and that compound reacts with CaO to form CaB2O4. With the addition of 1.8 g of CaO, CaB2O4 reacts with CaO to form (CaO)2(Al2O3)(B2O3), and that species remains stable by increasing the addition of CaO. The possible mechanism of the B distribution during the leaching process is explained by Equations (1)–(4):
(Al2O3)9(B2O3)2 + 11H2O → 9Al2O3(H2O) + 4HBO2
4HBO2 + CaO + H2O → CaB4O7 + 3H2O
CaB4O7 + CaO + H2O → 2CaB2O4 + H2O
CaB2O4 + CaO + H2O + Al2O3 → (CaO)2(Al2O3)(B2O3) + H2O

Figure 5.
Thermodynamic calculation results of the mechanism and distributions of B during the leaching process.
Based on these results, the speciation form of B resulting from the Ca compound was (CaO)2(Al2O3)(B2O3). The amount of calcium was the main factor involved in the controlling process, as B can react with calcium and form relatively insoluble compounds such as Ca2B2O5 and Ca3B2O6 [26].
3.2.2. Fluorine
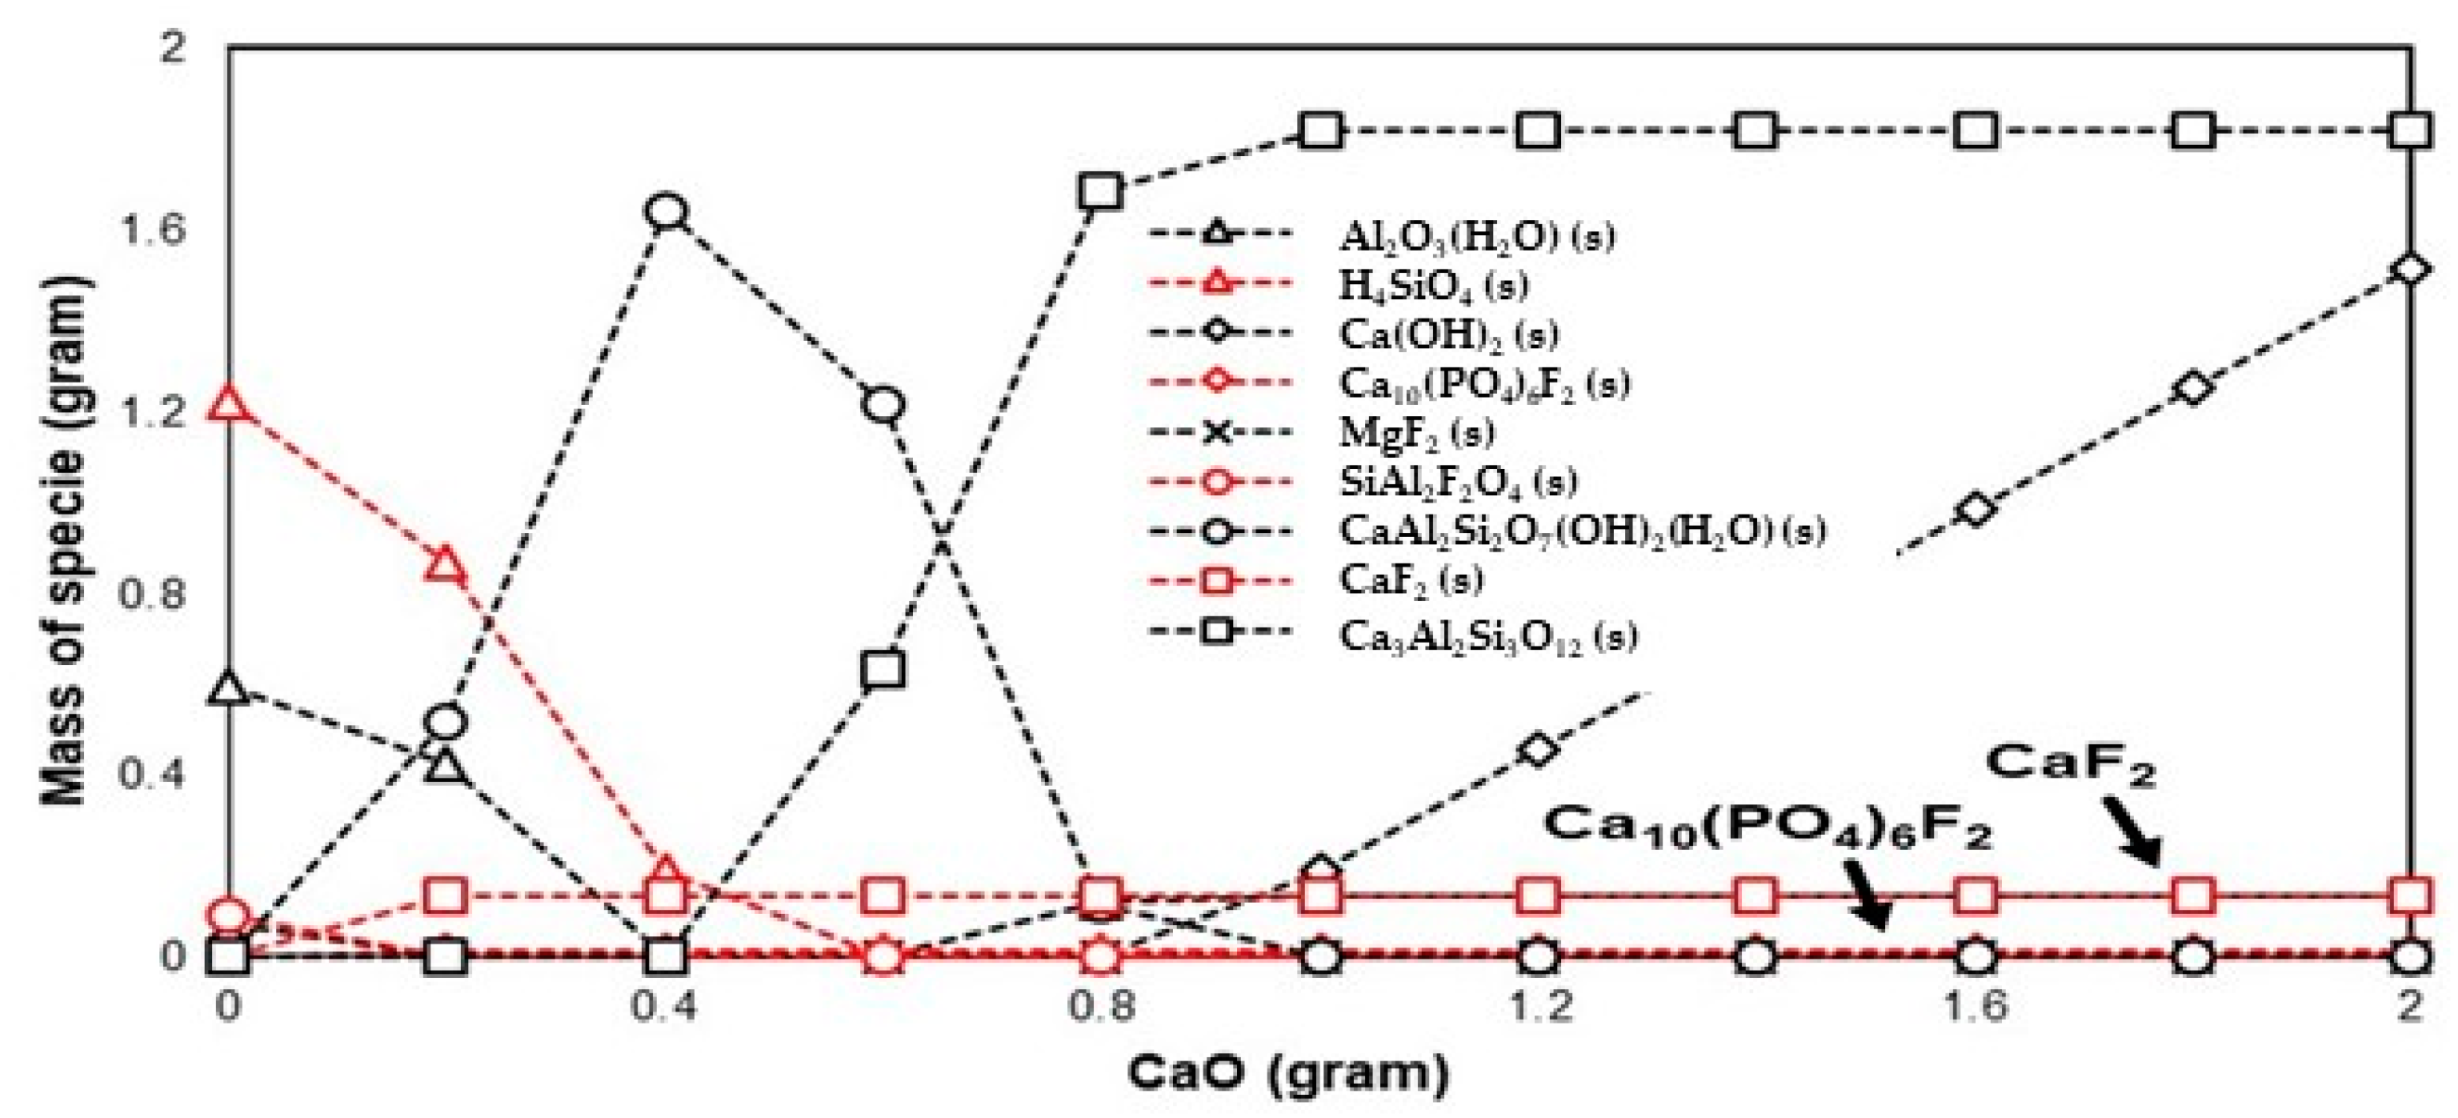
Figure 6 shows the possible mechanism of F distribution during the leaching process. Firstly, the masses of Al2O3 and H4SiO4 (as the results of the reaction of SiO2 and water) start to decrease and that of CaAl2Si2O7(OH)2 increases by increasing the mass of CaO in PS ash. Once again, at a mass of CaO of 0.4 g, CaAl2Si2O7(OH)2 starts to decrease to form Ca3Al2Si3O12, and that compound stabilizes by increasing the mass of CaO. Finally, the formation of CaF2 and Ca10(PO4)6F2 occurs due to the reaction of the predicted fluorine (SiAl2F2O4) with CaO, and that compound stabilizes during the leaching process. The stable species form during this process, indicating that this species is the final species to consist of coal fly ash after the leaching process. Based on our results, the speciation forms of F as a result of the Ca compound were CaF2 and Ca10(PO4)6F2. The possible mechanism of the F distribution during the leaching process can be better explained using Equations (5) and (6):
SiAl2F2O4 + CaO + 2H2O → CaF2 + Al2O3 + H4SiO4
SiAl2F2O4 + 10CaO + 3P2O5 + 2H2O → Ca10(PO4)6F2 + Al2O3 + H4SiO4

Figure 6.
Thermodynamic calculation results of the mechanism and distributions of F during the leaching process.
Several studies have analyzed the calcium- and F-bearing compounds that exist within coal fly ash that might be produced during the combustion process [27,28,29]. This study shows that it is mainly the fluorine compounds in coal that are insoluble, such as CaF2, MgF2, FeF3, and AlF3. These F compounds are the main occurrence states after the coal combustion process and are difficult to break down even at high temperatures. Wang et al. explained that several oxide compounds inside coal, including CaO in fly ash, take part in the formation of insoluble fluorides.
3.2.3. Selenium (Se)
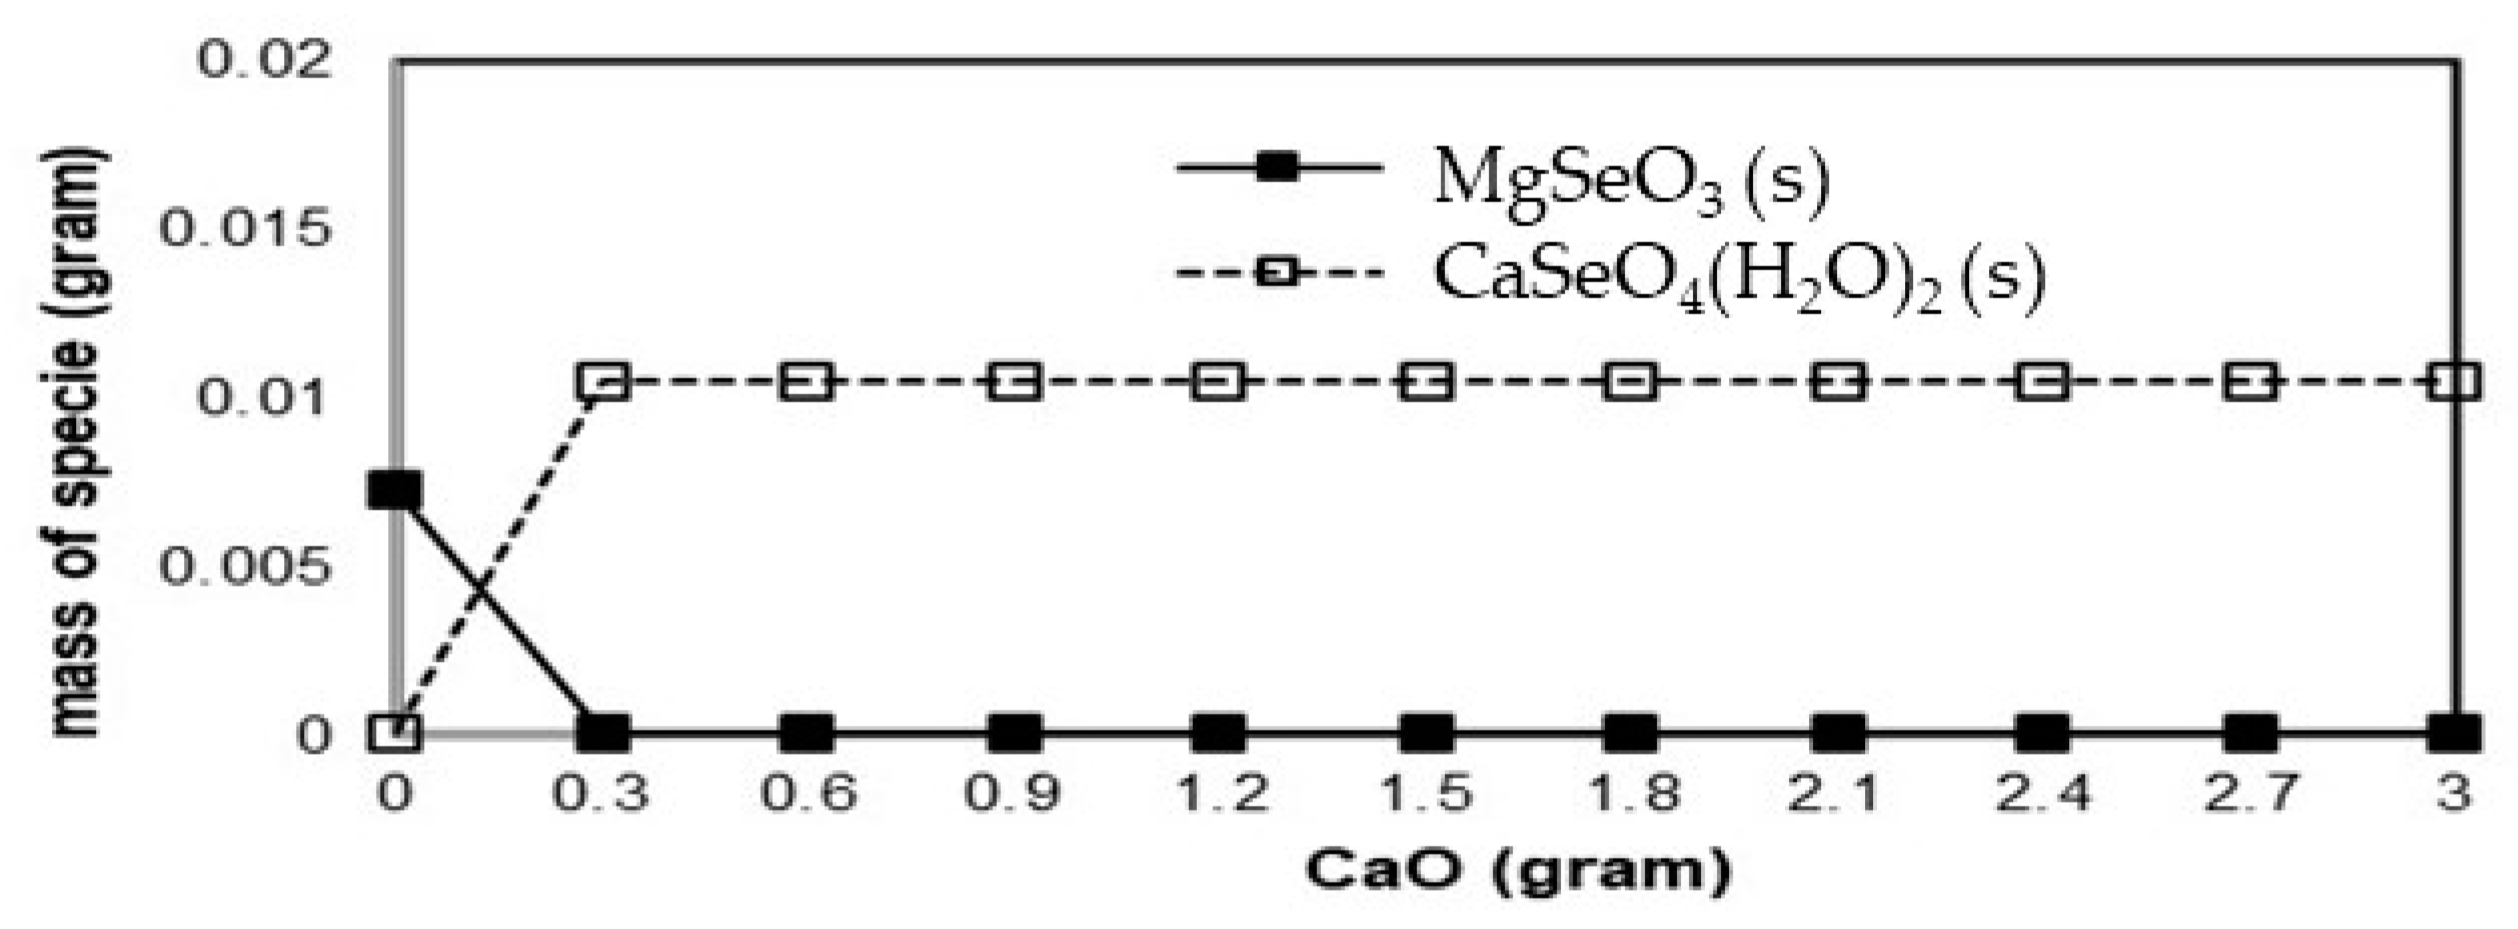
Figure 7 shows the possible mechanism of Se distribution during the leaching process. Firstly, the masses of Al2O3 and H4SiO4 (as the results of the reaction of SiO2 and water) start to decrease and that of CaAl2Si2O7(OH)2 increases by increasing the mass of CaO in PS ash. Once again, at a mass of CaO of 0.4 g, CaAl2Si2O7(OH)2 starts decrease to form Ca3Al2Si3O12, and that compound stabilizes by increasing the mass of CaO. Finally, the formation of CaSeO4(H2O)2 occurs due to the reaction of the predicted selenium/MgSeO3 with CaO, and that compound stabilizes during the leaching process. The stable species form during this process, indicating that this species is the final species to consist of coal fly ash after the leaching process. Based on our results, the speciation form of Se resulting from the Ca compound is CaSeO4(H2O)2. The possible mechanism of the Se distribution during the leaching process can be better explained using Equation (7):
MgSeO3 + CaO + 2H2O → CaSeO4(H2O)2 + Mg2+
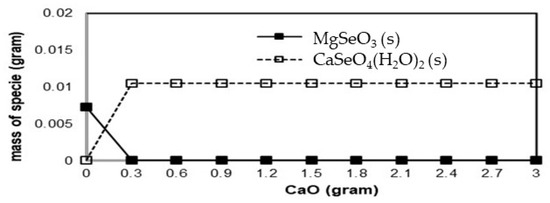
Figure 7.
Thermodynamic calculation results of the mechanism and distributions of Se during the leaching process.
3.3. Comparison of Leaching Ratio between Experimental and FactSage
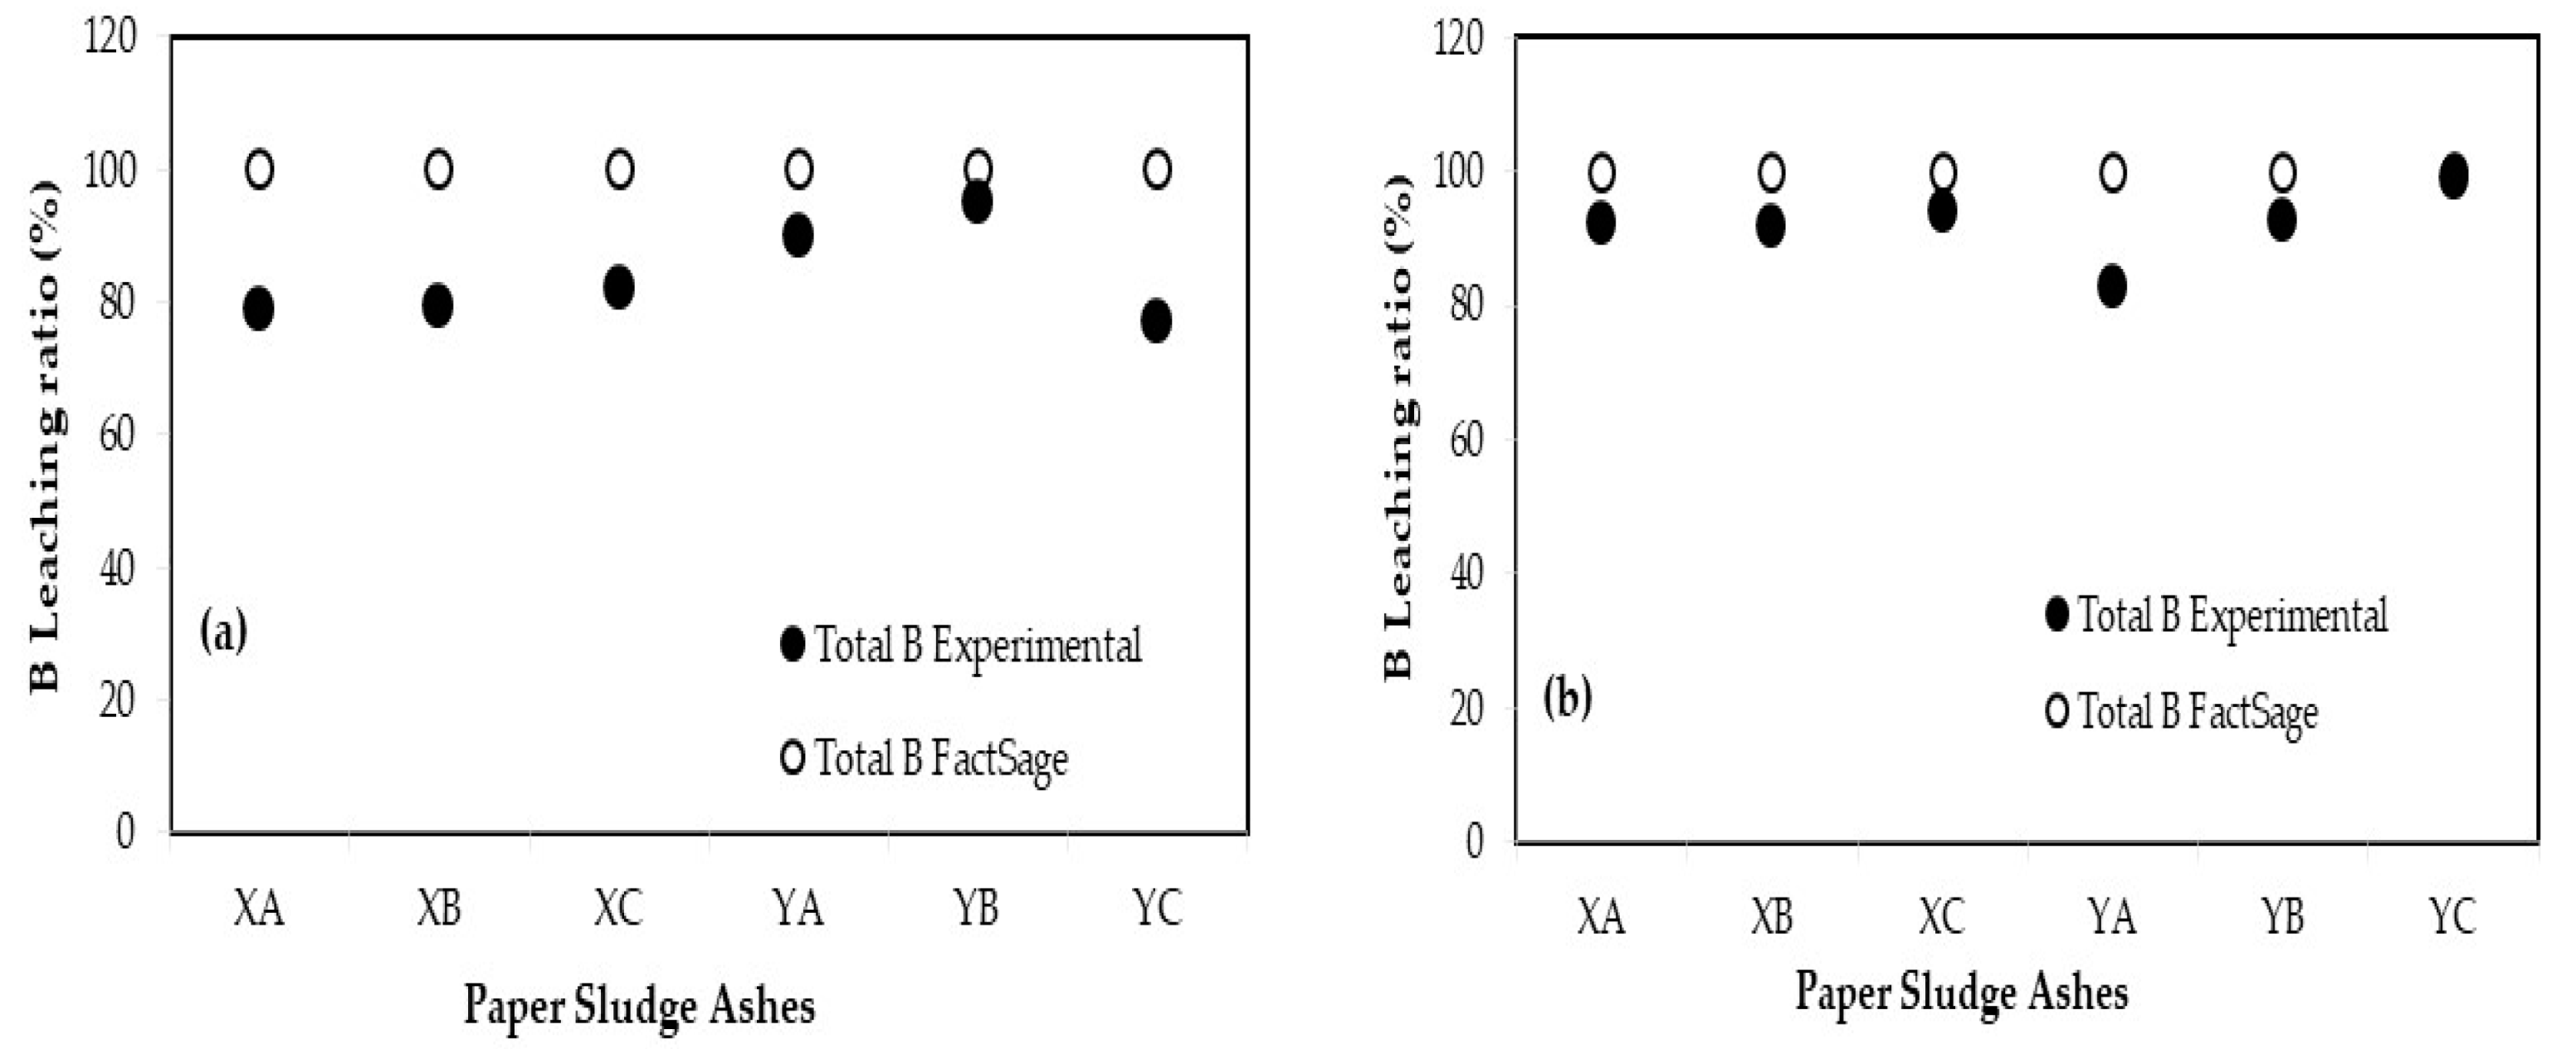
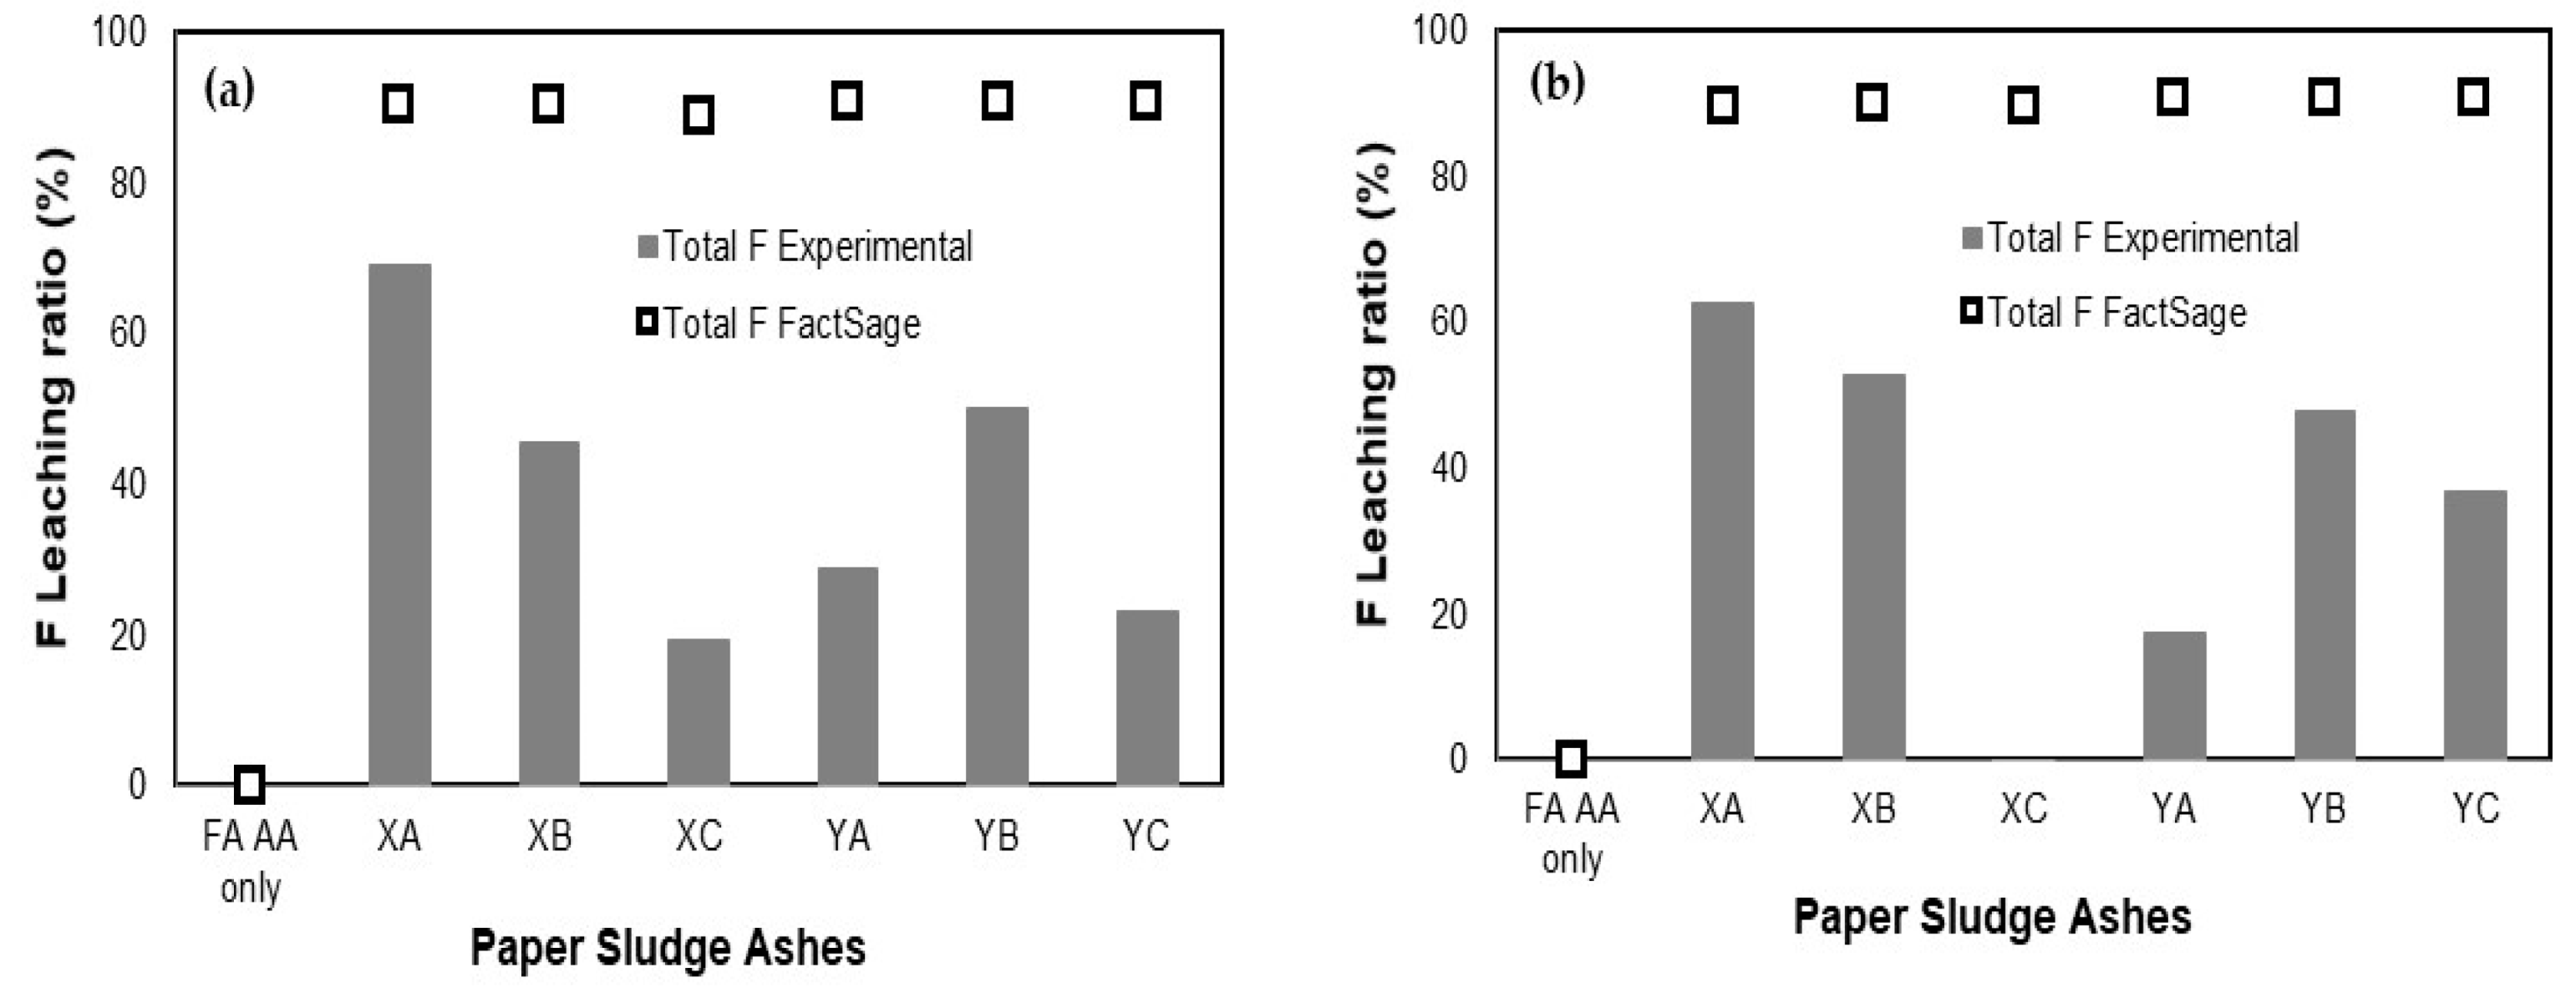
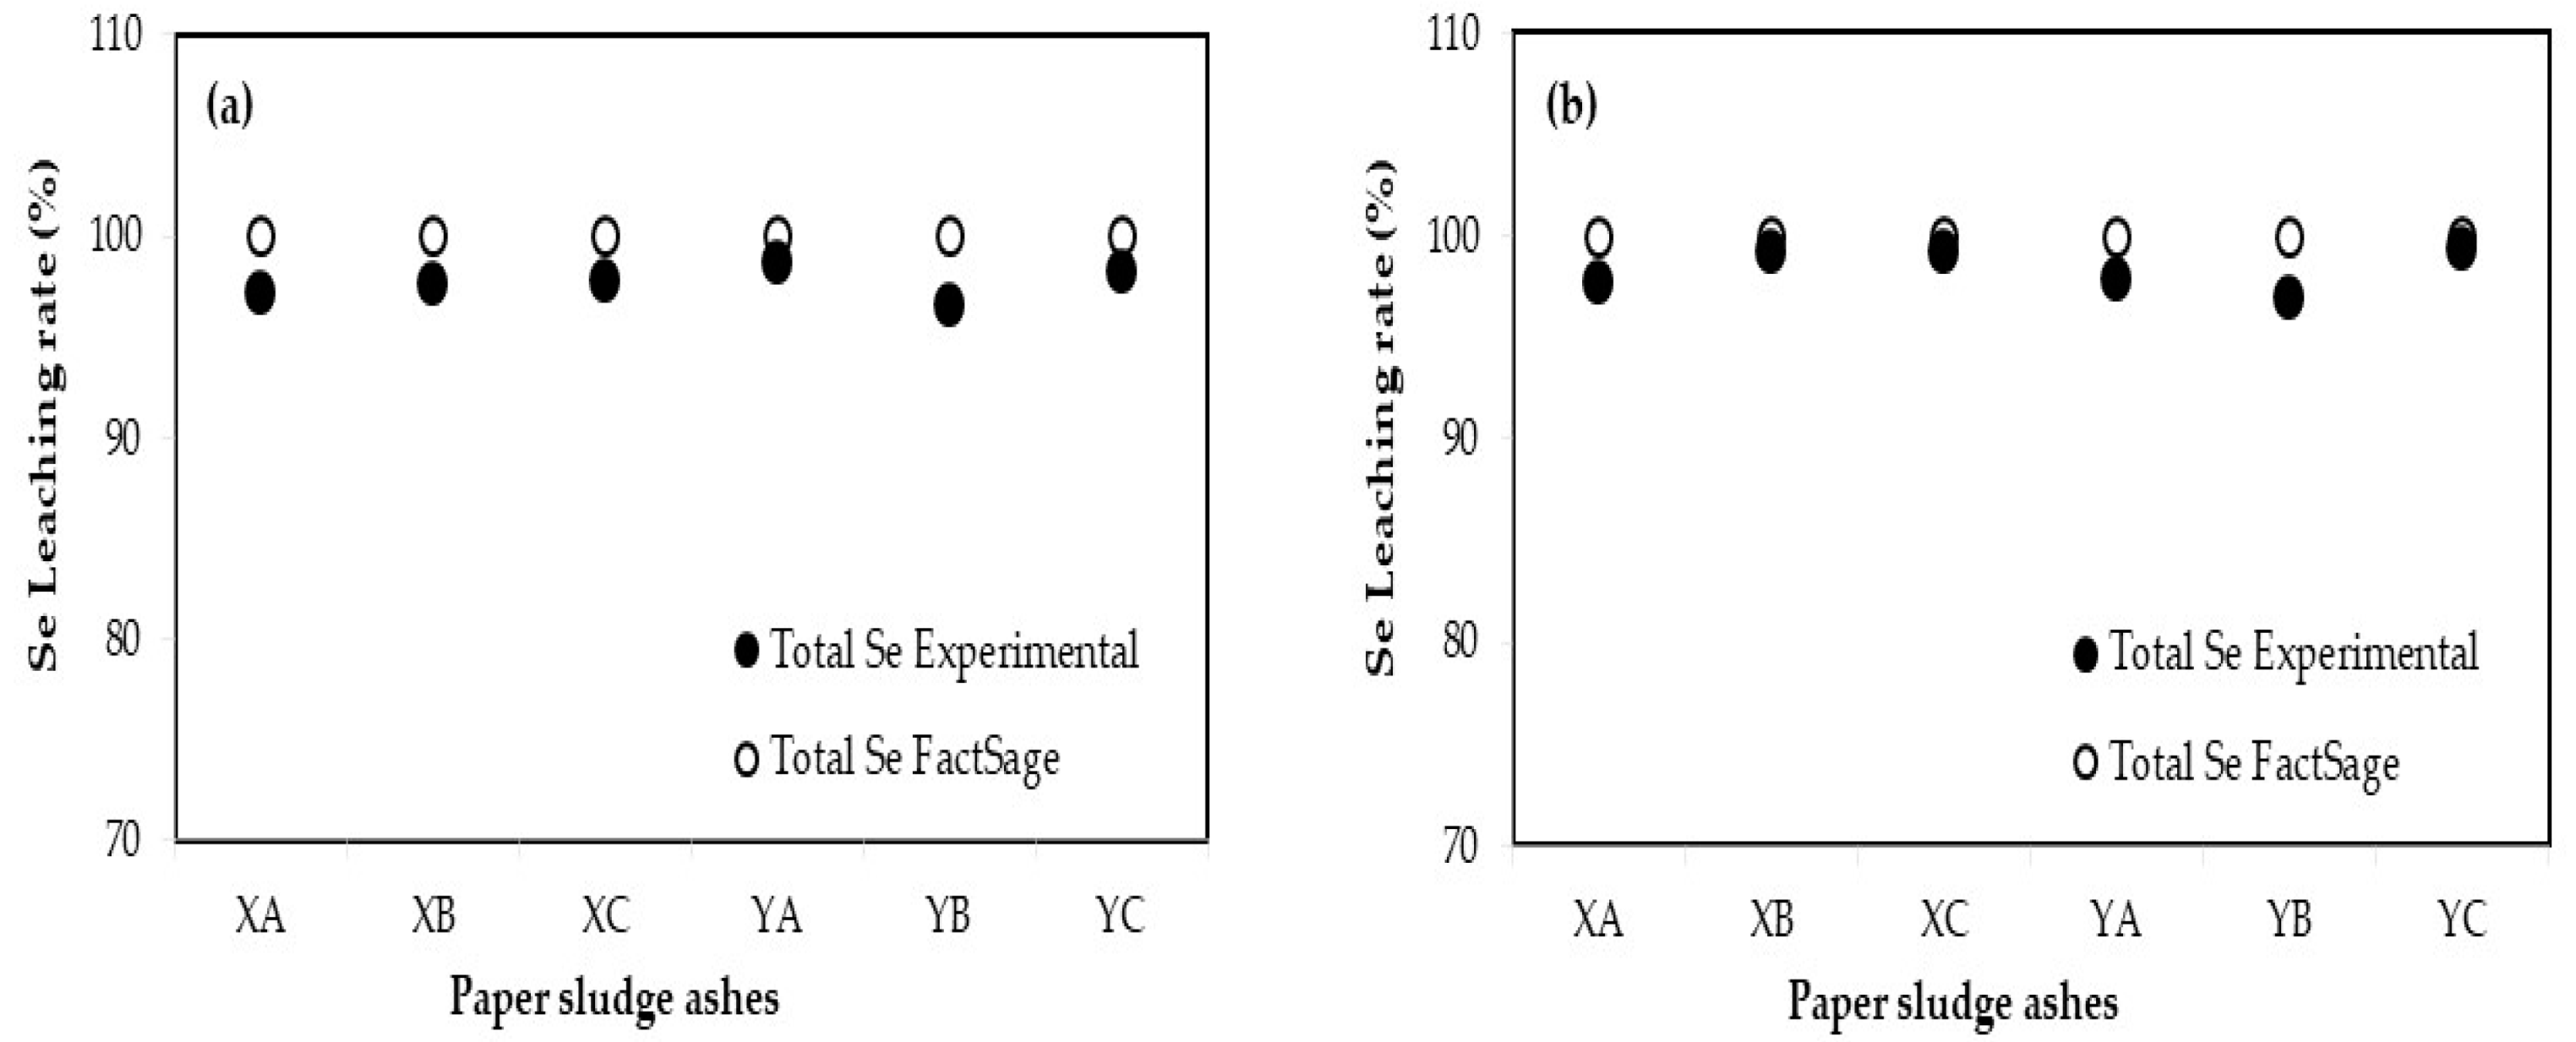
The validity of the leaching ratio of an experimental analysis is only confirmed once its results are contrasted with the FactSage it intends to represent. Regarding the experimental analysis, the variation in the B leaching ratio ranged from the lowest ratio of 77.27% given by the PS ash YC (addition ratio of 10%) to the highest ratio of 98.75% given by the PS ash YC (addition ratio of 30%). Compared to FactSage, a B leaching ratio of 100% was achieved at all addition ratios for PS ash, with relative errors of around 4.97–25.68% at an addition ratio of 10% for PS ash and 1.26–19.02% at an addition ratio of 30% for PS ash. For F, it seems that the relative error was achieved at more than 100% for the ratio (addition of 30% of the PS ash XA, 10% of the PS ash XC, and 10% and 30% of the PS ash YA), making it useless to compare the experimental analysis and FactSage simulation due to the highest gap between the F leaching ratios being between the experimental resutls and FactSage. Overall, for the F leaching ratio proposed in this study, the FactSage simulation was not good agreement with the experimental analysis. On the other hand, for the Se case, the Se leaching ratio determined via the experiment was around 96.61–99.18% compared to about a 100% ratio for the FactSage analysis, with a relative error under 3.5%. Overall, for the Se leaching ratio proposed in this study, the FactSage simulation was in good agreement with the experimental analysis. The complete set of all variations in the blending ratios of PS ash results is presented in Table 5. In addition, the results are shown in Figure 8, Figure 9 and Figure 10 for B, F, and Se, respectively.
Table 5.
Comparison of the leaching ratio between the experiment and FactSage.

Figure 8.
Thermodynamic calculation results of the formation and distribution of B during leaching effect of addition ratio of PS ash: (a) 10% and (b) 30%.

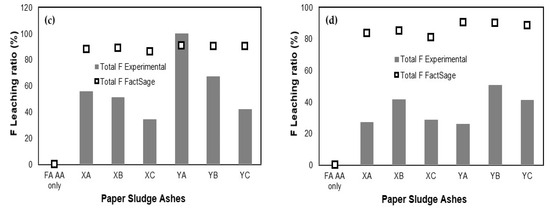
Figure 9.
Thermodynamic calculation results of the formation and distribution of F during leaching effect of addition ratio of PS ash: (a) 5%; (b) 10%; (c) 15% and (d) 30%.
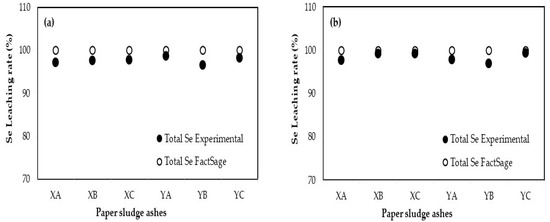
Figure 10.
Thermodynamic calculation results of the formation and distribution of Se during leaching effect of addition ratio of PS ash: (a) 10% and (b) 30%.
For B, the leaching ratio is shown in Figure 8, and it seems that the leaching ratio at an addition ratio of 10% had a good agreement between the PS ash YB and the relative error of 4.97%. Upon increasing the mass addition ratio to 30%, the B leaching ratio had a good agreement for the PS ash YC, with a relative error of 1.26% (see Table 5). Overall, PS ash, when used as an additive, can control the leaching concentrations of TEs, including B, F, and Se [17,18]. The same pattern was also found for Se, as shown in Figure 10. The Se leaching ratio at an addition ratio of 10% was achieved at around 96.61–98.68%, and increasing the addition ratio increased the Se leaching ratio to 96.94–99.28%, with a relative error of 0.73–3.45%. On the other hand, the F leaching ratio was much lower than the FactSage simulation, making the relative error achieved range from 35% to more than 100%. The possible reason is the kinetic control during the leaching test due to a lack of agitation and the short residence time [15]; therefore, the thermodynamic calculation (FactSage 7.2) did not consider the reaction time, which is necessary for the theoretical equilibrium state to be reached [30].
4. Conclusions
The impacts of blending a high-calcium additive on the environmental safety of B, F, and Se were determined via FactSage and experimental analysis through the effect of the mass addition ratio of PS ash. The experimental results confirmed that the concentrations of B, F, and Se from the sample and the additive decreased slightly, indicating that the inhibition processes realized through the addition of PS ash were effective. The FactSage results confirmed that the leaching processes of TEs, namely (CaO)2(Al2O3)(B2O3), CaF2, Ca10(PO4)F2, and CaSeO4(H2O)2, were predicted to be caused by B, F, and Se compounds forming in the leaching process of coal fly ash with paper sludge ash. Clearly, calcium is the most influential factor on the transformation of TEs. Calcium reacts strongly with TEs during the leaching process and, in turn, minimizes the effects of the release of TEs into the environment. The PS ash YB contained the highest calcium content and showed a strong ability to immobilize fluorine. On the other hand, the PS ash YC gave the best results for the inhibition processes of B and Se. Regarding the statistical analysis using single-factor ANOVA, there was no significant difference between the different types of PS ash. On the other hand, the influence of the blending ratio of PS ash to the sample showed a significant difference between the tests.
The analysis of the leaching ratio via thermodynamic calculation and experiments is also presented; again, the PS ash YB showed the best effect on the fluorine leaching concentration with an addition ratio of 15%, while the PS ash XC showed the best effects on the B and Se leaching concentrations at an addition ratio of 30%. Studying the possible interactions between TEs and mineral oxide in PS ash, based on the interaction, shows that not only can calcium compounds inhibit the leaching of B and F, but they can also do so for K, Mg, and Na, while Se only has a good correlation with calcium. Overall, the results of the FactSage simulation were in good agreement with the experimental analysis, where the relative error of B was 1.26–25.68% and that of Se was 0.73–3.45%
Author Contributions
Conceptualization, S.K.; methodology, S.K.; software, U.M.S.; validation, U.M.S.; formal analysis, U.M.S., E.R.D. and Y.H.; investigation, U.M.S., E.R.D. and Y.H.; resources, S.K.; data curation, U.M.S., E.R.D., Y.H. and S.K.; writing—original draft preparation, U.M.S.; writing—review and editing, U.M.S., E.R.D., Y.H. and S.K.; visualization, U.M.S. and S.K.; supervision, S.K.; project administration, S.K.; funding acquisition, S.K. All authors have read and agreed to the published version of the manuscript.
Funding
This research was funded by Tohoku Electric Company, grant number 501001849.
Data Availability Statement
The data are contained within this article.
Acknowledgments
We would like to thank all the Kambara laboratory members for their kind help in our experiments.
Conflicts of Interest
The authors declare no conflicts of interest.
References
- Neupane, G.; Donahoe, R.J.; Bhattacharyya, S.; Dhakal, P. Leaching kinetics of As, Mo, and Se from Acidic Coal Fly Ash Samples. J. Water Resour. Prot. 2017, 9, 890–907. [Google Scholar] [CrossRef]
- Oncioiu, I.; Grecu, E.; Mâşu, S.; Morariu, F.; Popa, M. The effect of fly ash on sunflower growth and human health. Environ. Sci. Pollut. Res. 2018, 25, 35548–35554. [Google Scholar] [CrossRef]
- Phung, H.T.; Lund, L.J.; Page, A.L.; Bradford, G.R. Trace elements in fly ash and their release in water and treated soils 1. J. Environ. Qual. 1979, 8, 171–175. [Google Scholar] [CrossRef]
- Izquierdo, M.; Querol, X. Leaching behaviour of elements from coal combustion fly ash: An overview. Int. J. Coal Geol. 2012, 94, 54–66. [Google Scholar] [CrossRef]
- Fernandez-Turiel, J.L.; de Carvalho, W.; Cabanas, M.; Querol, X.; and Lopez-Soler, A. Mobility of heavy metals from Coal Fly Ash. Environ. Geol. 1994, 44, 264–270. [Google Scholar] [CrossRef]
- Choi, S.K.; Lee, S.; Song, Y.K.; Moon, H.S. Leaching characteristics of selected Korean fly ashes and its implications for the groundwater composition near the ash disposal mound. Fuel 2002, 81, 1083–1090. [Google Scholar] [CrossRef]
- van der Hoek, E.E.; Bonouvrie, P.A.; Comans, R.N. Sorption of As and Se on mineral components of fly ash: Relevance for leaching processes. Appl. Geochem. 1994, 9, 403–412. [Google Scholar] [CrossRef]
- Ogawa, Y.; Sakakibara, K.; Wang, L.; Suto, K.; Inoue, C. Immobilization of B, F, Cr, and As in alkaline coal fly ash through an aging process with water. Env. Monit Assess 2014, 186, 6757–6770. [Google Scholar] [CrossRef] [PubMed]
- Seki, T.; Nakamura, K.; Ogawa, Y.; Inoue, C. Leaching of As and Se from coal fly ash: Fundamental study for coal ash recycling. Environ. Monit. Assess. 2021, 193, 225. [Google Scholar] [CrossRef] [PubMed]
- Zhang, S.; Dai, S.; Finkelman, R.B.; Graham, I.T.; French, D.; Hower, J.C.; Li, X. Leaching characteristic of alkaline coal combustion by products: A case study from a coal-fired power plant, Hebei Province, China. Fuel 2019, 255, 115710. [Google Scholar] [CrossRef]
- Guo, B.; Nakama, S.; Tian, Q.; Pahlevi, N.D.; Hu, Z.; Sasaki, K. Suppression processes of anionic pollutants released from fly ash by various Ca additives. J. Hazard. Mater. 2019, 371, 474–483. [Google Scholar] [CrossRef] [PubMed]
- He, J.; Li, Y.; Xue, X.; Ru, H.; Huang, X.; Yang, H. Leaching of fluorine and rare earths from bastnaesite calcined with alumium hydroxide and the recovery of fluorine as cryolite. RSC Adv. 2017, 7, 14043. [Google Scholar]
- Szostek, R.; Ciecko, Z. Effect of soil contamination with fluorine on the yield and content of nitrogen froms in the biomass crops. Environ. Sci Pollut Res 2017, 24, 8588–8601. [Google Scholar] [CrossRef] [PubMed]
- Ogawa, Y.; Sakakibara, K.; Seki, T.; Inoue, C. Immobilization of boron and arsenic in alkaline coal fly ash through an aging process with water and elucidation of the immobilization mechanism. Water Air Soil Pollut. 2018, 229, 229–359. [Google Scholar] [CrossRef]
- Neupane, G.; Donahoe, R.J. Leachability of elements in alkaline and acidic coal fly ash samples during batch and column leaching tests. Fuel 2013, 104, 758–770. [Google Scholar] [CrossRef]
- Baba, A.; Guldal, G.; Sengunalp, F. Leaching characteristics of fly ash from fluidized bed combustion thermal power plant: Case study: Can (Canakkale-Turkey). Fuel Process. Technol. 2010, 91, 1073–1080. [Google Scholar] [CrossRef]
- Hanum, F.F.; Desfitri, E.R.; Hayakawa, Y.; Kambara, S. Preliminary Study on Additives for Controlling As, Se, B, and F Leaching from Coal Fly Ash. Minerals 2018, 8, 493. [Google Scholar] [CrossRef]
- Hartuti, S.; Hanum, F.F.; Takeyama, A.; Kambara, S. Effect of additives on Arsenic, Boron and Selenium leaching from coal fly ash. Minerals 2017, 7, 99. [Google Scholar] [CrossRef]
- Desfitri, E.R.; Sutopo, U.M.; Hayakawa, Y.; Kambara, S. Effect of additive material on controlling chromium (Cr) leaching from coal fly ash. Minerals 2020, 10, 563. [Google Scholar] [CrossRef]
- Liu, J.; Xie, C.; Xie, W.; Zhang, X.; Chang, K.; Sun, J.; Kuo, J.; Xie, W.; Liu, C.; Sun, J.; et al. Arsenic Partitioning Behavior during Sludge Co-combustion: Thermodynamic Equilibrium Simulation. Waste Biomass Valorization 2019, 10, 2297–2307. [Google Scholar] [CrossRef]
- Sutopo, U.M.; Desfitri, E.R.; Hayakawa, Y.; Kambara, S. A role of mineral oxides on trace elements behavior during pulverized coal combustion. Minerals 2021, 11, 1270. [Google Scholar] [CrossRef]
- Sutopo, U.M.; Desfitri, E.R.; Hanum, F.F.; Hayakawa, Y.; Kambara, S. An experimental and thermodynamic analysis on the leaching process of arsenic (As) from coal fly ash. J. Jpn. Inst. Energy 2021, 100, 102–109. [Google Scholar] [CrossRef]
- Jiao, F.; Ninomiya, Y.; Zhang, L.; Yamada, N.; Sato, A.; Dong, Z. Effect of coal blending on the leaching characteristics of arsenic in fly ash fluidized bed coal combustion. Fuel Process. Technol. 2013, 106, 769–775. [Google Scholar] [CrossRef]
- Ministry of the Environment. Test Method of Metals Contained in Industrial Waste. 1973. Available online: https://www.env.go.jp/hourei/add/k048.pdf (accessed on 11 January 2024).
- Ministry of the Environment. Japan Regulation and Environmental Law: Environmental Quality Standards for Water Pollution. 1994. Available online: https://www.env.go.jp/content/900454947.pdf (accessed on 11 January 2024).
- Hayashi, S.; Takahashi, T. Chemical state of boron in coal fly ash investigated by focused-ion-beam time-of-flight secondary ion mass spectrometry (FIB-TOF-SIMS) and satellite-transition magic angle spinning Nuclear magnetic resonance (STMAS NMR). Chemosphere 2010, 80, 881–887. [Google Scholar] [CrossRef] [PubMed]
- Wang, G.; Luo, Z.; Zhang, J.; Zhao, Y. Modes of occurence of fluorine by extraction and SEM method in a coal-fired power plant from Inner Mongolia China. Minerals 2015, 5, 863–869. [Google Scholar] [CrossRef]
- Xie, P.; Guo, W.; Yan, X.; Zheng, X. Fluorine in Lopingian superhigh-organic-sulfur coals from the Lalang Coal Mine, Guangxie, Southern China. Fuel 2017, 208, 483–490. [Google Scholar] [CrossRef]
- Wang, T.; Wang, J.; Tang, Y.; Tang, Y.; Shi, H.; Ladwig, K. Leaching characteristics of arsenic and selenium from coal fly ash: Role of calcium. Energy Fuel 2009, 23, 2959–2966. [Google Scholar] [CrossRef]
- Roy, B.; Choo, L.W.; Battacharya, S. Prediction of distribution of trace elements under Oxy-fuel combustion condition using Victorian brown coals. Fuel 2013, 114, 135–142. [Google Scholar] [CrossRef]


Disclaimer/Publisher’s Note: The statements, opinions and data contained in all publications are solely those of the individual author(s) and contributor(s) and not of MDPI and/or the editor(s). MDPI and/or the editor(s) disclaim responsibility for any injury to people or property resulting from any ideas, methods, instructions or products referred to in the content. |
© 2024 by the authors. Licensee MDPI, Basel, Switzerland. This article is an open access article distributed under the terms and conditions of the Creative Commons Attribution (CC BY) license (https://creativecommons.org/licenses/by/4.0/).