


Spatiotemporal Assessment of Soil and Vegetation Pollution with Toxic Metals from Road Traffic along the First Romanian Highway


Abstract
1. Introduction
2. Materials and Methods
2.1. Location of Sampling Points
2.2. Preparation of Soil and Vegetation Samples
2.3. Assessment of Soil and Vegetation Pollution and Ecological Risk
3. Results
4. Discussion
5. Conclusions
Author Contributions
Funding
Data Availability Statement
Conflicts of Interest
References
- Werkenthin, M.; Kluge, B.; Wessolek, G. Metals in European roadside soils and soil solution—A review. Environ. Pollut. 2014, 189, 98–110. [Google Scholar] [CrossRef] [PubMed]
- An, S.; Liu, N.; Li, X.; Zeng, S.; Wang, X.; Wang, D. Understanding heavy metal accumulation in roadside soils along major roads in the Tibet Plateau. Sci. Total Environ. 2022, 802, 149865. [Google Scholar] [CrossRef] [PubMed]
- Suvetha, M.; Charles, P.E.; Vinothkannan, A.; Rajaram, R.; Paray, B.A.; Ali, S. Are we at risk because of road dust? An ecological and health risk assessment of heavy metals in a rapid growing city in South India. Environ. Adv. 2022, 7, 100165. [Google Scholar] [CrossRef]
- Mmolawa, K.B.; Likuku, A.S.; Gaboutloeloe, G.K. Assessment of heavy metal pollution in soils along major roadside areas in Botswana. Afr. J. Environ. Sci. Technol. 2011, 5, 186–196. Available online: https://www.ajol.info/index.php/ajest/article/view/71926 (accessed on 16 January 2024).
- Binner, H.; Sullivan, T.; Jansen, M.; McNamara, M. Metals in urban soils of Europe: A systematic review. Sci. Total Environ. 2023, 854, 158734. [Google Scholar] [CrossRef]
- Shi, D.; Lu, X. Accumulation degree and source apportionment of trace metals in smaller than 63 μm road dust from the areas with different land uses: A case study of Xi’an, China. Sci. Total Environ. 2018, 636, 1211–1218. [Google Scholar] [CrossRef]
- Choi, J.Y.; Jeong, H.; Choi, K.-Y.; Hong, G.H.; Yang, D.B.; Kim, K.; Ra, K. Source identification and implications of heavy metals in urban roads for the coastal pollution in a beach town, Busan, Korea. Mar. Pollut. Bull. 2020, 161, 111724. [Google Scholar] [CrossRef]
- Huang, C.; Zhang, L.; Meng, J.; Yu, Y.; Qi, J.; Shen, P.; Li, X.; Ding, P.; Chen, M.; Hu, G. Characteristics, source apportionment and health risk assessment of heavy metals in urban road dust of the Pearl River Delta, South China. Ecotoxicol. Environ. Saf. 2022, 236, 113490. [Google Scholar] [CrossRef]
- De Miguel, E.; Llamas, J.F.; Chacón, E.; Berg, T.; Larssen, S.; Røyset, O.; Vadset, M. Origin and patterns of distribution of trace elements in street dust: Unleaded petrol and urban lead. Atmos. Environ. 1997, 31, 2733–2740. [Google Scholar] [CrossRef]
- Nakayama, S.M.; Ikenaka, Y.; Hamada, K.; Muzandu, K.; Choongo, K.; Teraoka, H.; Mizuno, N.; Ishizuka, M. Metal and metalloid contamination in roadside soil and wild rats around a Pb–Zn mine in Kabwe, Zambia. Environ. Pollut. 2011, 159, 175–181. [Google Scholar] [CrossRef]
- Heidari, M.; Darijani, T.; Alipour, V. Heavy metal pollution of road dust in a city and its highly polluted suburb; quantitative source apportionment and source-specific ecological and health risk assessment. Chemosphere 2021, 273, 129656. [Google Scholar] [CrossRef] [PubMed]
- Li, R.; Yuan, Y.; Li, C.; Sun, W.; Yang, M.; Wang, X. Environmental health and ecological risk assessment of soil heavy metal pollution in the coastal cities of Estuarine Bay—A case study of Hangzhou Bay, China. Toxics 2020, 8, 75. [Google Scholar] [CrossRef]
- Vasile, G.; Dinu, C.; Kim, L.; Tenea, A.G.; Simion, M.; Ene, C.; Spinu, C.; Ungureanu, E.-M.; Manolache, D. Platinum group elements in road dust and vegetation from some European and national roads with intensive car traffic in Romania. Rev. Chim. 2019, 70, 286–292. [Google Scholar] [CrossRef]
- Kim, L.; Vasile, G.; Stanescu, B.; Calinescu, S.; Batrinescu, G. Distribution and bioavailability of mobile arsenic in sediments from a mining catchment area. J. Environ. Prot. Ecol. 2015, 16, 1227–1236. Available online: http://dspace.incdecoind.ro/bitstream/123456789/528/1/Distribution%20and%20bioavailability%20of%20mobile%20arsenic_JEPE_2015.pdf (accessed on 16 January 2024).
- Chojnacka, K.; Chojnacki, A.; Górecka, H.; Górecki, H. Bioavailability of heavy metals from polluted soils to plants. Sci. Total Environ. 2005, 337, 175–182. [Google Scholar] [CrossRef]
- Stanescu, B.; Cuciureanu, A.; Cernica, G.; Catrina, G.A. The current state of the quality of urban soils in Bucharest. Rom. J. Ecol. Environ. Chem. 2020, 2, 202–209. [Google Scholar] [CrossRef]
- Long, Z.; Zhu, H.; Bing, H.; Tian, X.; Wang, Z.; Wang, X.; Wu, Y. Contamination, sources and health risk of heavy metals in soil and dust from different functional areas in an industrial city of Panzhihua City, Southwest China. J. Hazard. Mater. 2021, 420, 126638. [Google Scholar] [CrossRef]
- Nduka, J.K.; Umeh, T.C.; Kelle, H.I.; Mgbemena, M.N.; Nnamani, R.A.; Okafor, P.C. Ecological and health risk assessment of heavy metals in roadside soil, dust and water of three economic zone in Enugu, Nigeria. Urban Clim. 2023, 51, 101627. [Google Scholar] [CrossRef]
- Enyoh, C.E.; Wang, Q.; Eze, V.C.; Rabin, M.H.; Rakib, M.R.J.; Verla, A.W.; Ibe, F.C.; Duru, C.E.; Verla, E.N. Assessment of potentially toxic metals adsorbed on small macroplastics in urban roadside soils in southeastern Nigeria. J. Hazard. Mater. 2022, 7, 100122. [Google Scholar] [CrossRef]
- Yesilkanat, C.M.; Kobya, Y. Spatial characteristics of ecological and health risks of toxic heavy metal pollution from road dust in the Black Sea coast of Turkey. Geoderma Reg. 2021, 25, e00388. [Google Scholar] [CrossRef]
- Xu, C.; Pu, J.; Wen, B.; Xia, M. Potential ecological risks of heavy metals in agricultural soil alongside highways and their relationship with landscape. Agriculture 2021, 11, 800. [Google Scholar] [CrossRef]
- Hakanson, L. An ecological risk index for aquatic pollution control: A sedimentological approach. Water Res. 1980, 14, 975–1001. [Google Scholar] [CrossRef]
- Dinu, C.; Gheorghe, S.; Tenea, A.G.; Stoica, C.; Vasile, G.-G.; Popescu, R.L.; Serban, E.A.; Pascu, L.F. Toxic Metals (As, Cd, Ni, Pb) impact in the most common medicinal plant (Mentha piperita). Int. J. Environ. Res. Public Health 2021, 18, 3904. [Google Scholar] [CrossRef] [PubMed]
- Dinu, C.; Vasile, G.; Tenea, A.G.; Stoica, C.; Gheorghe, S.; Serban, E.A. The influence of toxic metals As, Cd, Ni and Pb on nutrients accumulation in Mentha piperita. Rom. J. Ecol. Environ. Chem. 2021, 3, 141–152. [Google Scholar] [CrossRef]
- Li, C.; Du, D.; Gan, Y.; Ji, S.; Wang, L.; Chang, M.; Liu, J. Foliar dust as a reliable environmental monitor of heavy metal pollution in comparison to plant leaves and soil in urban areas. Chemosphere 2022, 287, 132341. [Google Scholar] [CrossRef] [PubMed]
- Khan, S.; Khan, M.; Rehman, S. Lead and cadmium contamination of different roadside soils and plants in Peshawar City, Pakistan. Pedosphere 2011, 21, 351–357. [Google Scholar] [CrossRef]
- Commision Regulation 2011/574/EU Amending Annex I to Directive 2002/32/EC of the European Parliament and of the Council as Regards Maximum Levels for Nitrite, Melamine, Ambrosia spp. and Carry-Over of Certain Coccidiostats and Histomonostats and Consolidating Annexes I and II Thereto. Available online: https://eur-lex.europa.eu/legal-content/EN/TXT/PDF/?uri=CELEX:32011R0574 (accessed on 21 November 2023).
- Tome, F.V.; Rodríguez, M.B.; Lozano, J. Soil-to-plant transfer factors for natural radionuclides and stable elements in a Mediterranean area. J. Environ. Radioact. 2003, 65, 161–175. [Google Scholar] [CrossRef]
- A1 Motorway. Available online: https://en.wikipedia.org/wiki/A1_motorway_(Romania) (accessed on 26 November 2023).
- Car Census 2015. Available online: https://www.cestrin.ro/assets/pdf/recensamant%202015.pdf (accessed on 7 January 2024).
- Car Census 2022. Available online: https://www.cestrin.ro/assets/pdf/recensamant%202022.pdf (accessed on 7 January 2024).
- Li, H.; Shi, A.; Zhang, X. Particle size distribution and characteristics of heavy metals in road-deposited sediments from Beijing Olympic Park. J. Environ. Sci. 2015, 32, 228–237. [Google Scholar] [CrossRef]
- SIST ISO 11466:1996. Soil Quality–Extraction of Trace Elements Soluble in Aqua Regia. Available online: https://standards.iteh.ai/catalog/standards/sist/81e301a6-0954-4959-805b-6488f9a94126/sist-iso-11466-1996 (accessed on 16 January 2024).
- Order No. 756 of 3 November 1997 for the Approval of the Regulation on Environmental Pollution Assessment. Eminent: Ministry of Waters, Forests and Environmental Protection. (Published in: Official Gazette No 303 bis of 6 November 1997). Available online: http://legislatie.just.ro/Public/DetaliiDocumentAfis/151788 (accessed on 26 November 2023). (In Romanian).
- Taylor, S.R.; McLennan, S.M. The Continental Crust: Its Composition and Evolution; Blackwell Scientific Publications: Hoboken, NJ, USA, 1985. Available online: https://www.osti.gov/biblio/6582885 (accessed on 16 January 2024).
- Müller, G. Index of geoaccumulation in sediments of the Rhine River. Geojournal 1969, 2, 108–118. [Google Scholar]
- Tomlinson, D.; Wilson, J.; Harris, C.; Jeffrey, D. Problems in the assessment of heavy-metal levels in estuaries and the formation of a pollution index. Helgoländer Meeresunters 1980, 33, 566–575. Available online: https://link.springer.com/article/10.1007/BF02414780 (accessed on 16 January 2024). [CrossRef]
- Dinelli, E.; Lombini, A. Metal distributions in plants growing on copper mine spoils in Northern Apennines, Italy: The evaluation of seasonal variations. Appl. Geochem. 1996, 11, 375–385. [Google Scholar] [CrossRef]
- Reimann, C.; Filzmoser, P.; Garrett, R.G. Background and threshold: Critical comparison of methods of determination. Sci. Total Environ. 2005, 346, 1–16. [Google Scholar] [CrossRef] [PubMed]


| Observation Points (OP) | GPS Coordinates with Garmin, Model Montana 610 Lat/Long WGS’84 | Details of Sampling Locations | Photos (Source of Images: Google Street View) |
|---|---|---|---|
| A1 Highway, Bucharest–Pitesti Direction | |||
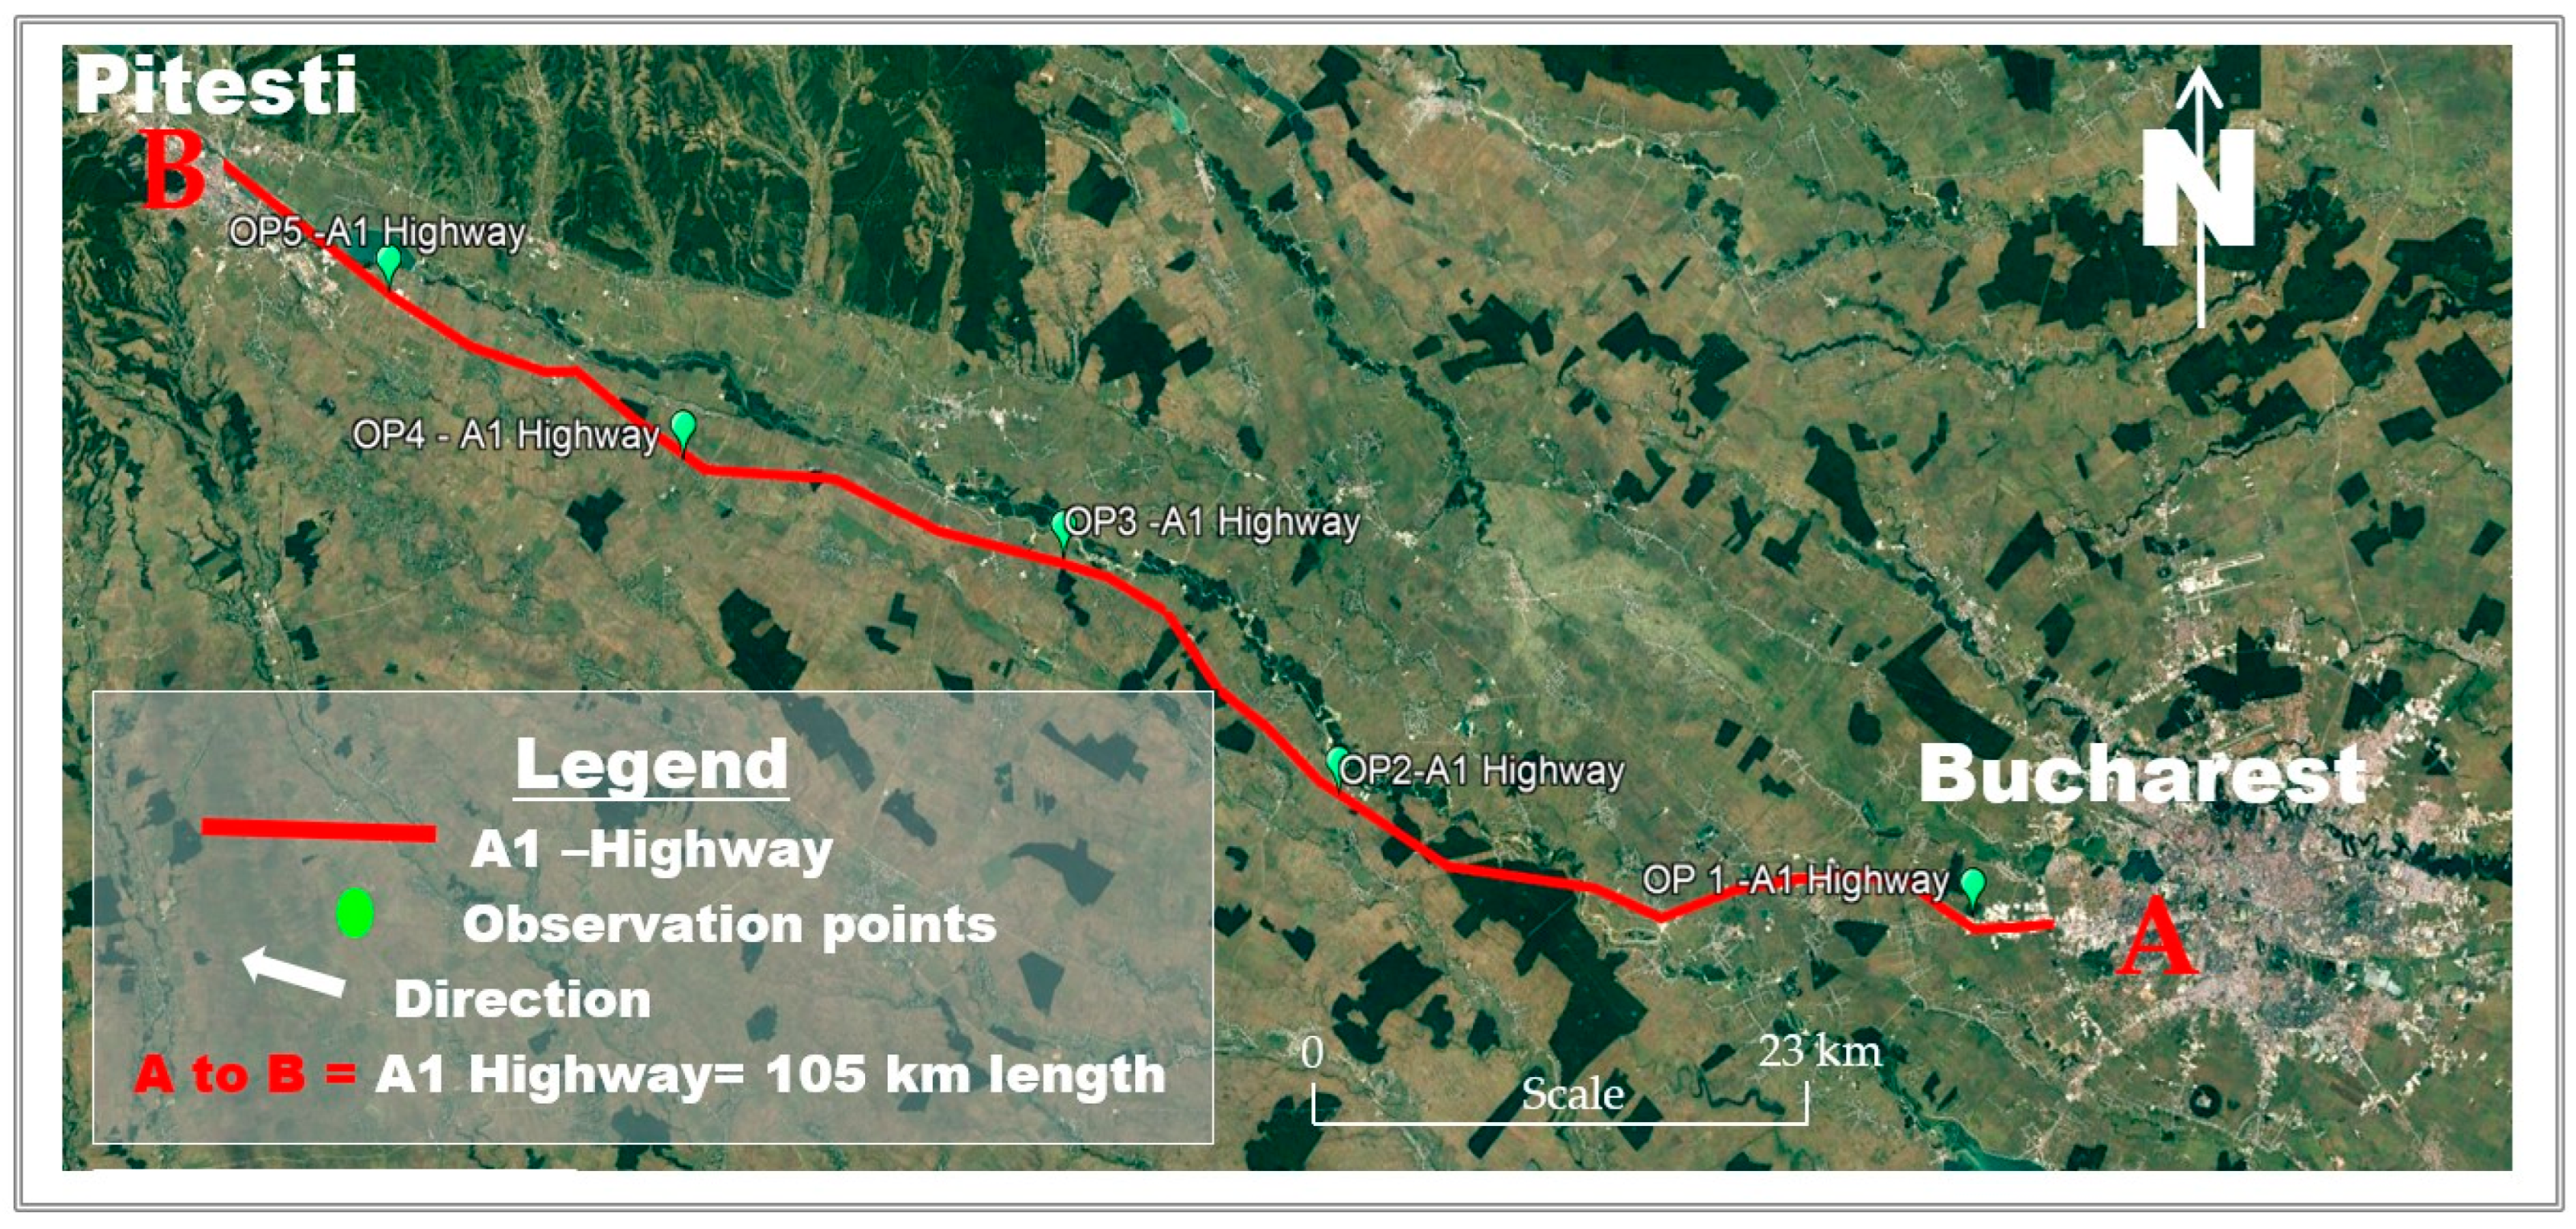
| OP 1 | 44°26.595′ N 25°55.109′ E | Sampling point located at km 15 on the highway (after A1 entrance area) | 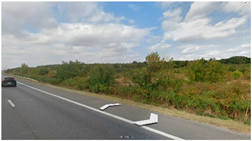 |
| OP 2 | 44°31.932′ N 25°31.984′ E | Sampling point located at km 49 on the highway (in the vicinity of the fuel distribution station) | 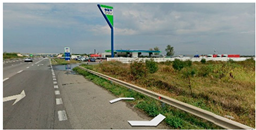 |
| OP 3 | 44°38.869′ N 25°22.789′ E | Sampling point located at km 67 on the highway (near a paved road, DC77, which crosses the highway) | 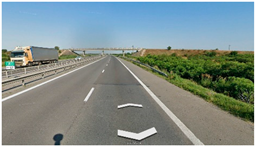 |
| OP 4 | 44°42.676′ N 25°8.986′ E | Sampling point located at km 87 on the highway, direction Bucharest–Pitesti, a free zone) | 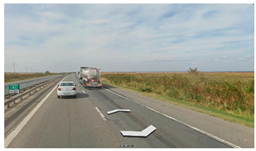 |
| OP 5 | 44°47.874′ N 24°58.669′ E | Sampling point located at km 104 on the highway in the vicinity of an industrial area | 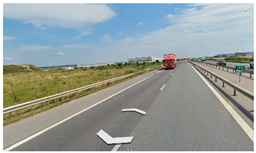 |
| A1 Highway, Pitesti–Bucharest Direction | |||
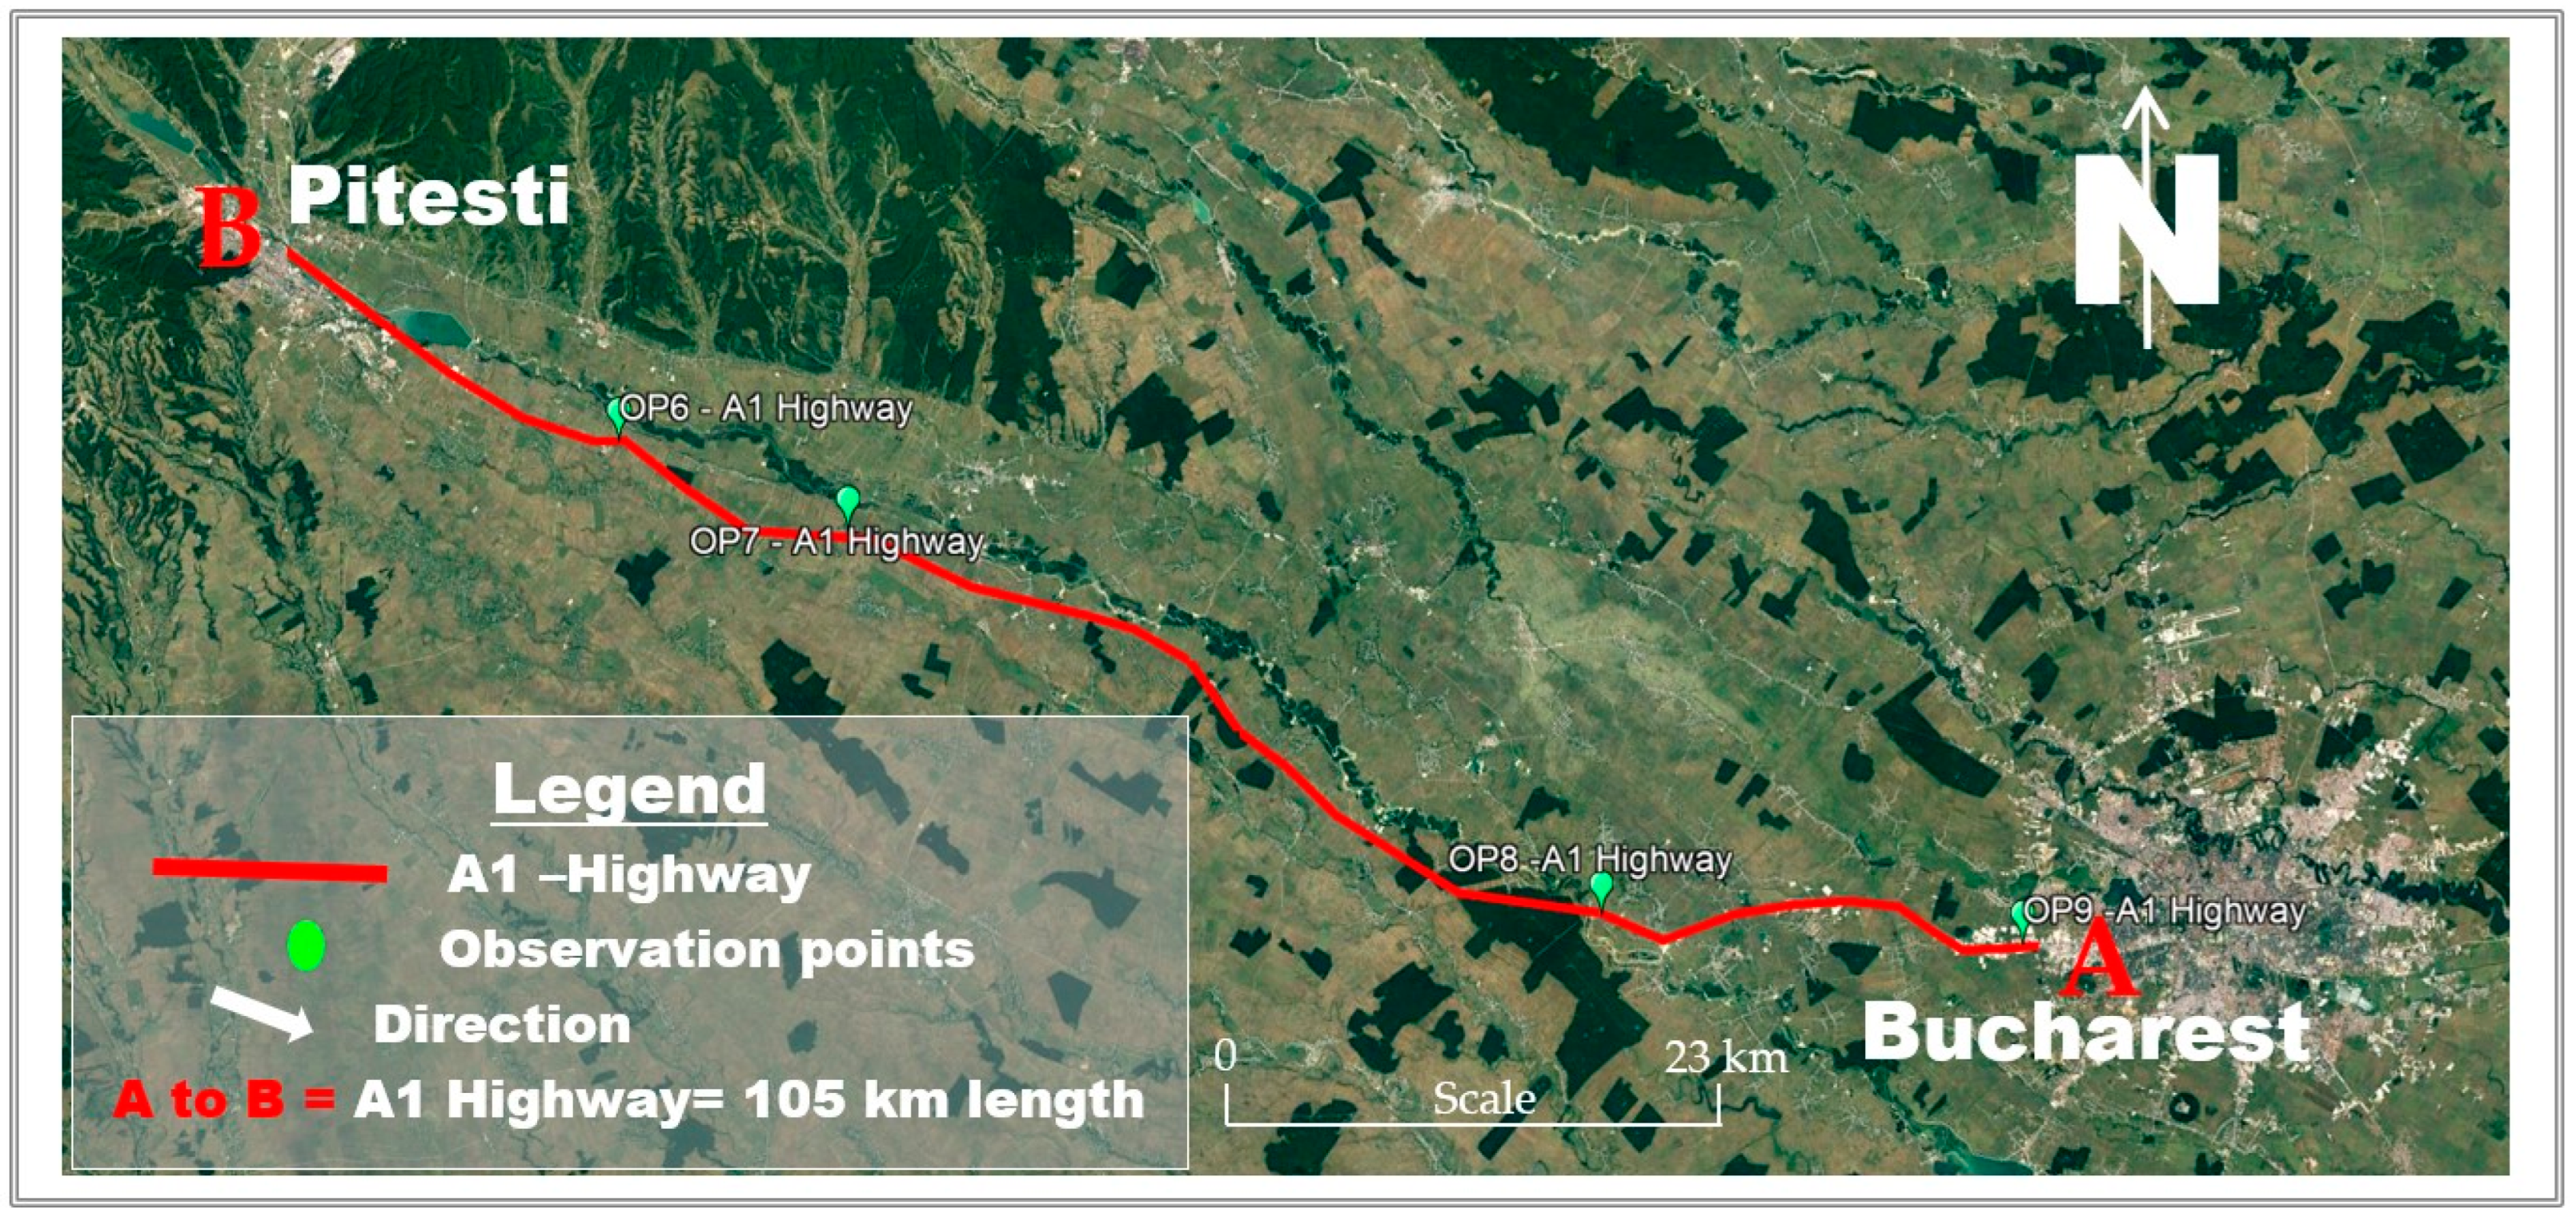
| OP 6 | 44°45.259′ N 25°5.137′ E | Sampling point located at km 94 on the highway, an area with logistics warehouses | 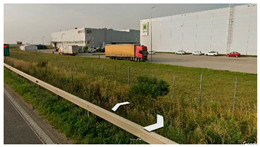 |
| OP7 | 44°42.000′ N 25°13.685′ E | Sampling point located at km 80 on the highway, with service areas (fuel distribution station) | 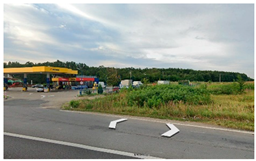 |
| OP8 | 44°28.602′ N 25°41.179′ E | Sampling point located at km 35 on the highway (free zone after crossing the Arges river) |  |
| OP9 | 44°26.217′ N 25°57.470′ E | Sampling point located at km 10 on the highway (exit from the highway), a commercial area |  |
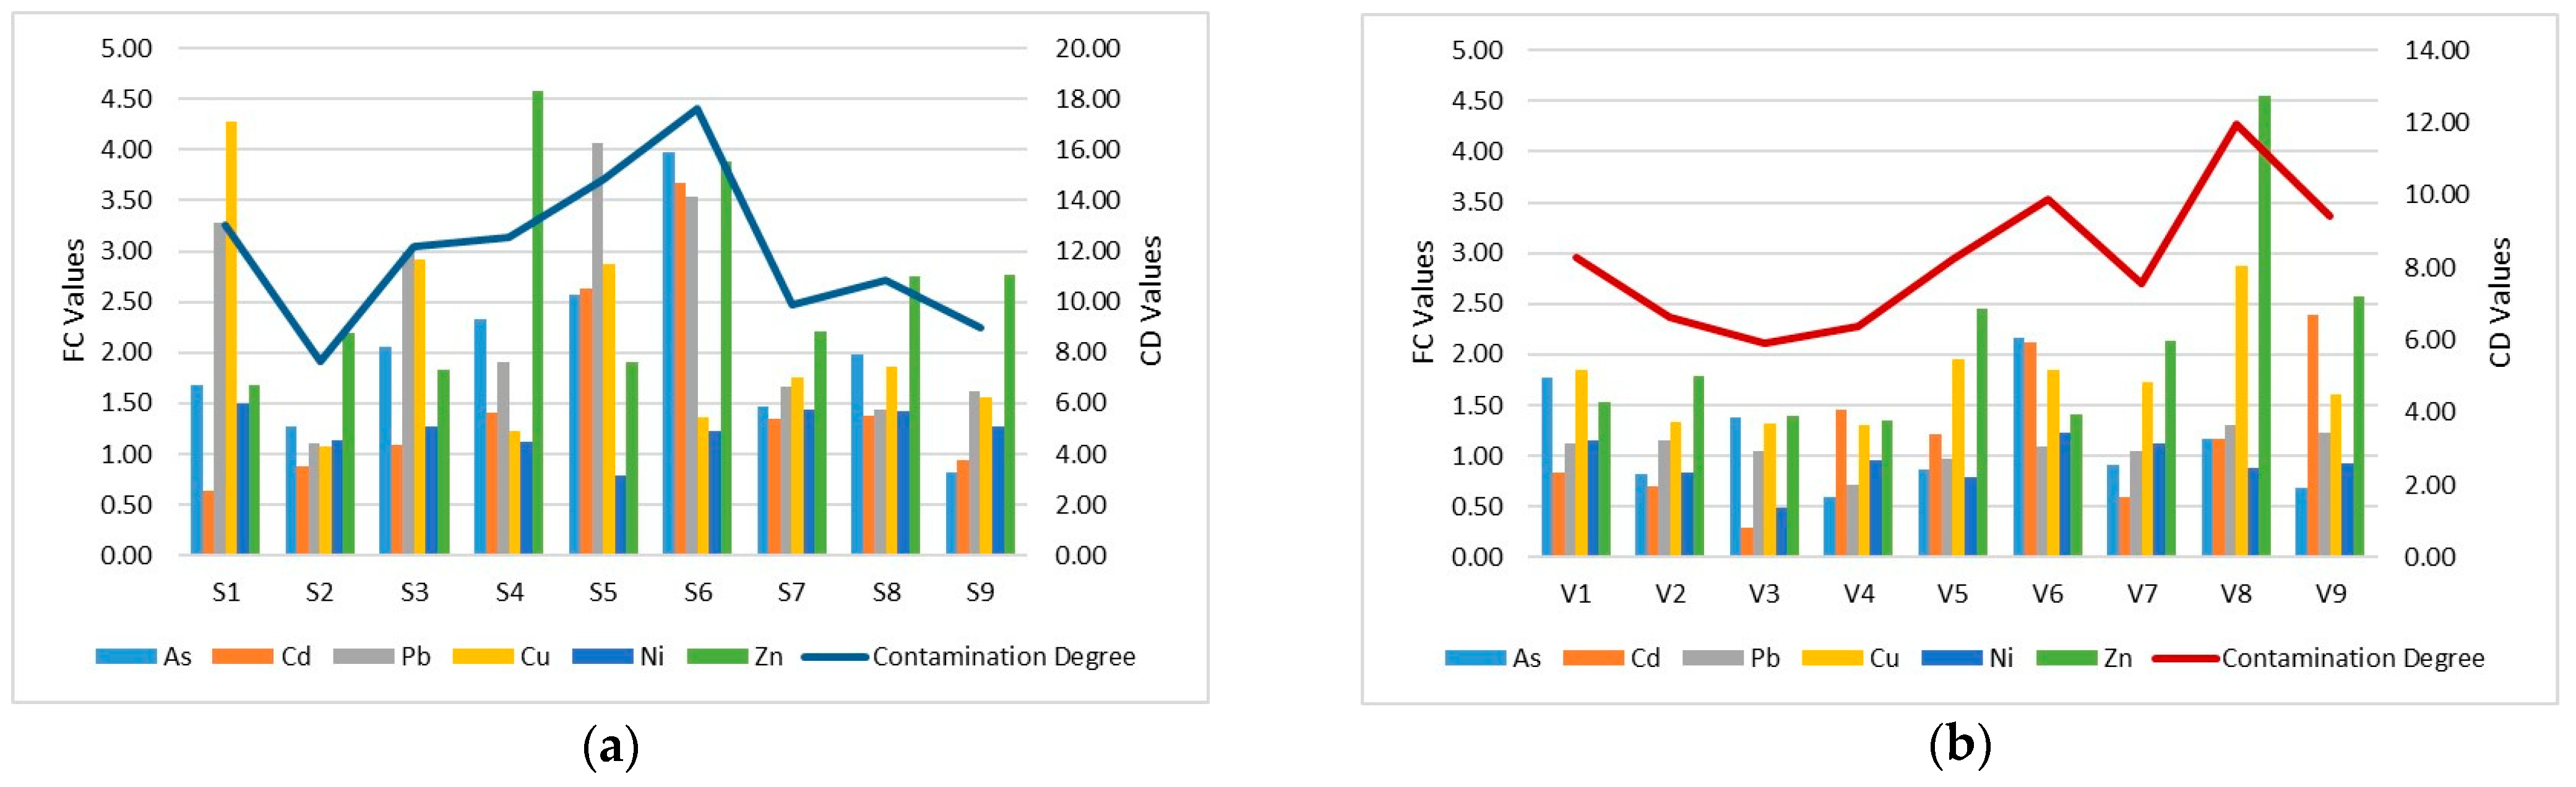
| Toxic Metals | As | Cd | Pb | Cu | Ni | Zn |
|---|---|---|---|---|---|---|
| Normal values | 5 | 1 | 20 | 20 | 20 | 100 |
| Alert thresholds | 15 | 3 | 50 | 100 | 75 | 300 |
| Intervention thresholds | 25 | 5 | 100 | 200 | 150 | 600 |
| Index | Value | Category | ||||
|---|---|---|---|---|---|---|
| Contamination factor (CF) | CF < 1 | Low contamination | ||||
| 1 ≤ CF < 3 | Moderate contamination | |||||
| 3 ≤ CF < 6 | Considerable contamination | |||||
| CF > 6 | Very high contamination | |||||
| Contamination degree (CD) | CD < 6 | Low contamination degree | ||||
| 6 ≤ CF < 12 | Moderate contamination degree | |||||
| 12 ≤ CF < 24 | Considerable contamination degree | |||||
| CF > 24 | Very high contamination degree | |||||
| Index | Value | Category | ||||
| Pollution load index (PLI) | PLI < 1 | Unpolluted level | ||||
| PLI = 1 | Baseline level of pollution | |||||
| PLI > 1 | The presence of pollution | |||||
| Index | Value | Class | Pollution level | |||
| Geoaccumulation Index (Igeo) | ≤0 | 0 | Unpolluted level | |||
| 0–1 | 1 | Unpolluted level to moderate pollution level | ||||
| 1–2 | 2 | Moderate pollution level | ||||
| 2–3 | 3 | Moderate pollution level to high pollution level | ||||
| 3–4 | 4 | High pollution level | ||||
| 4–5 | 5 | High pollution level to very high pollution level | ||||
| >5 | 6 | Very high pollution level | ||||
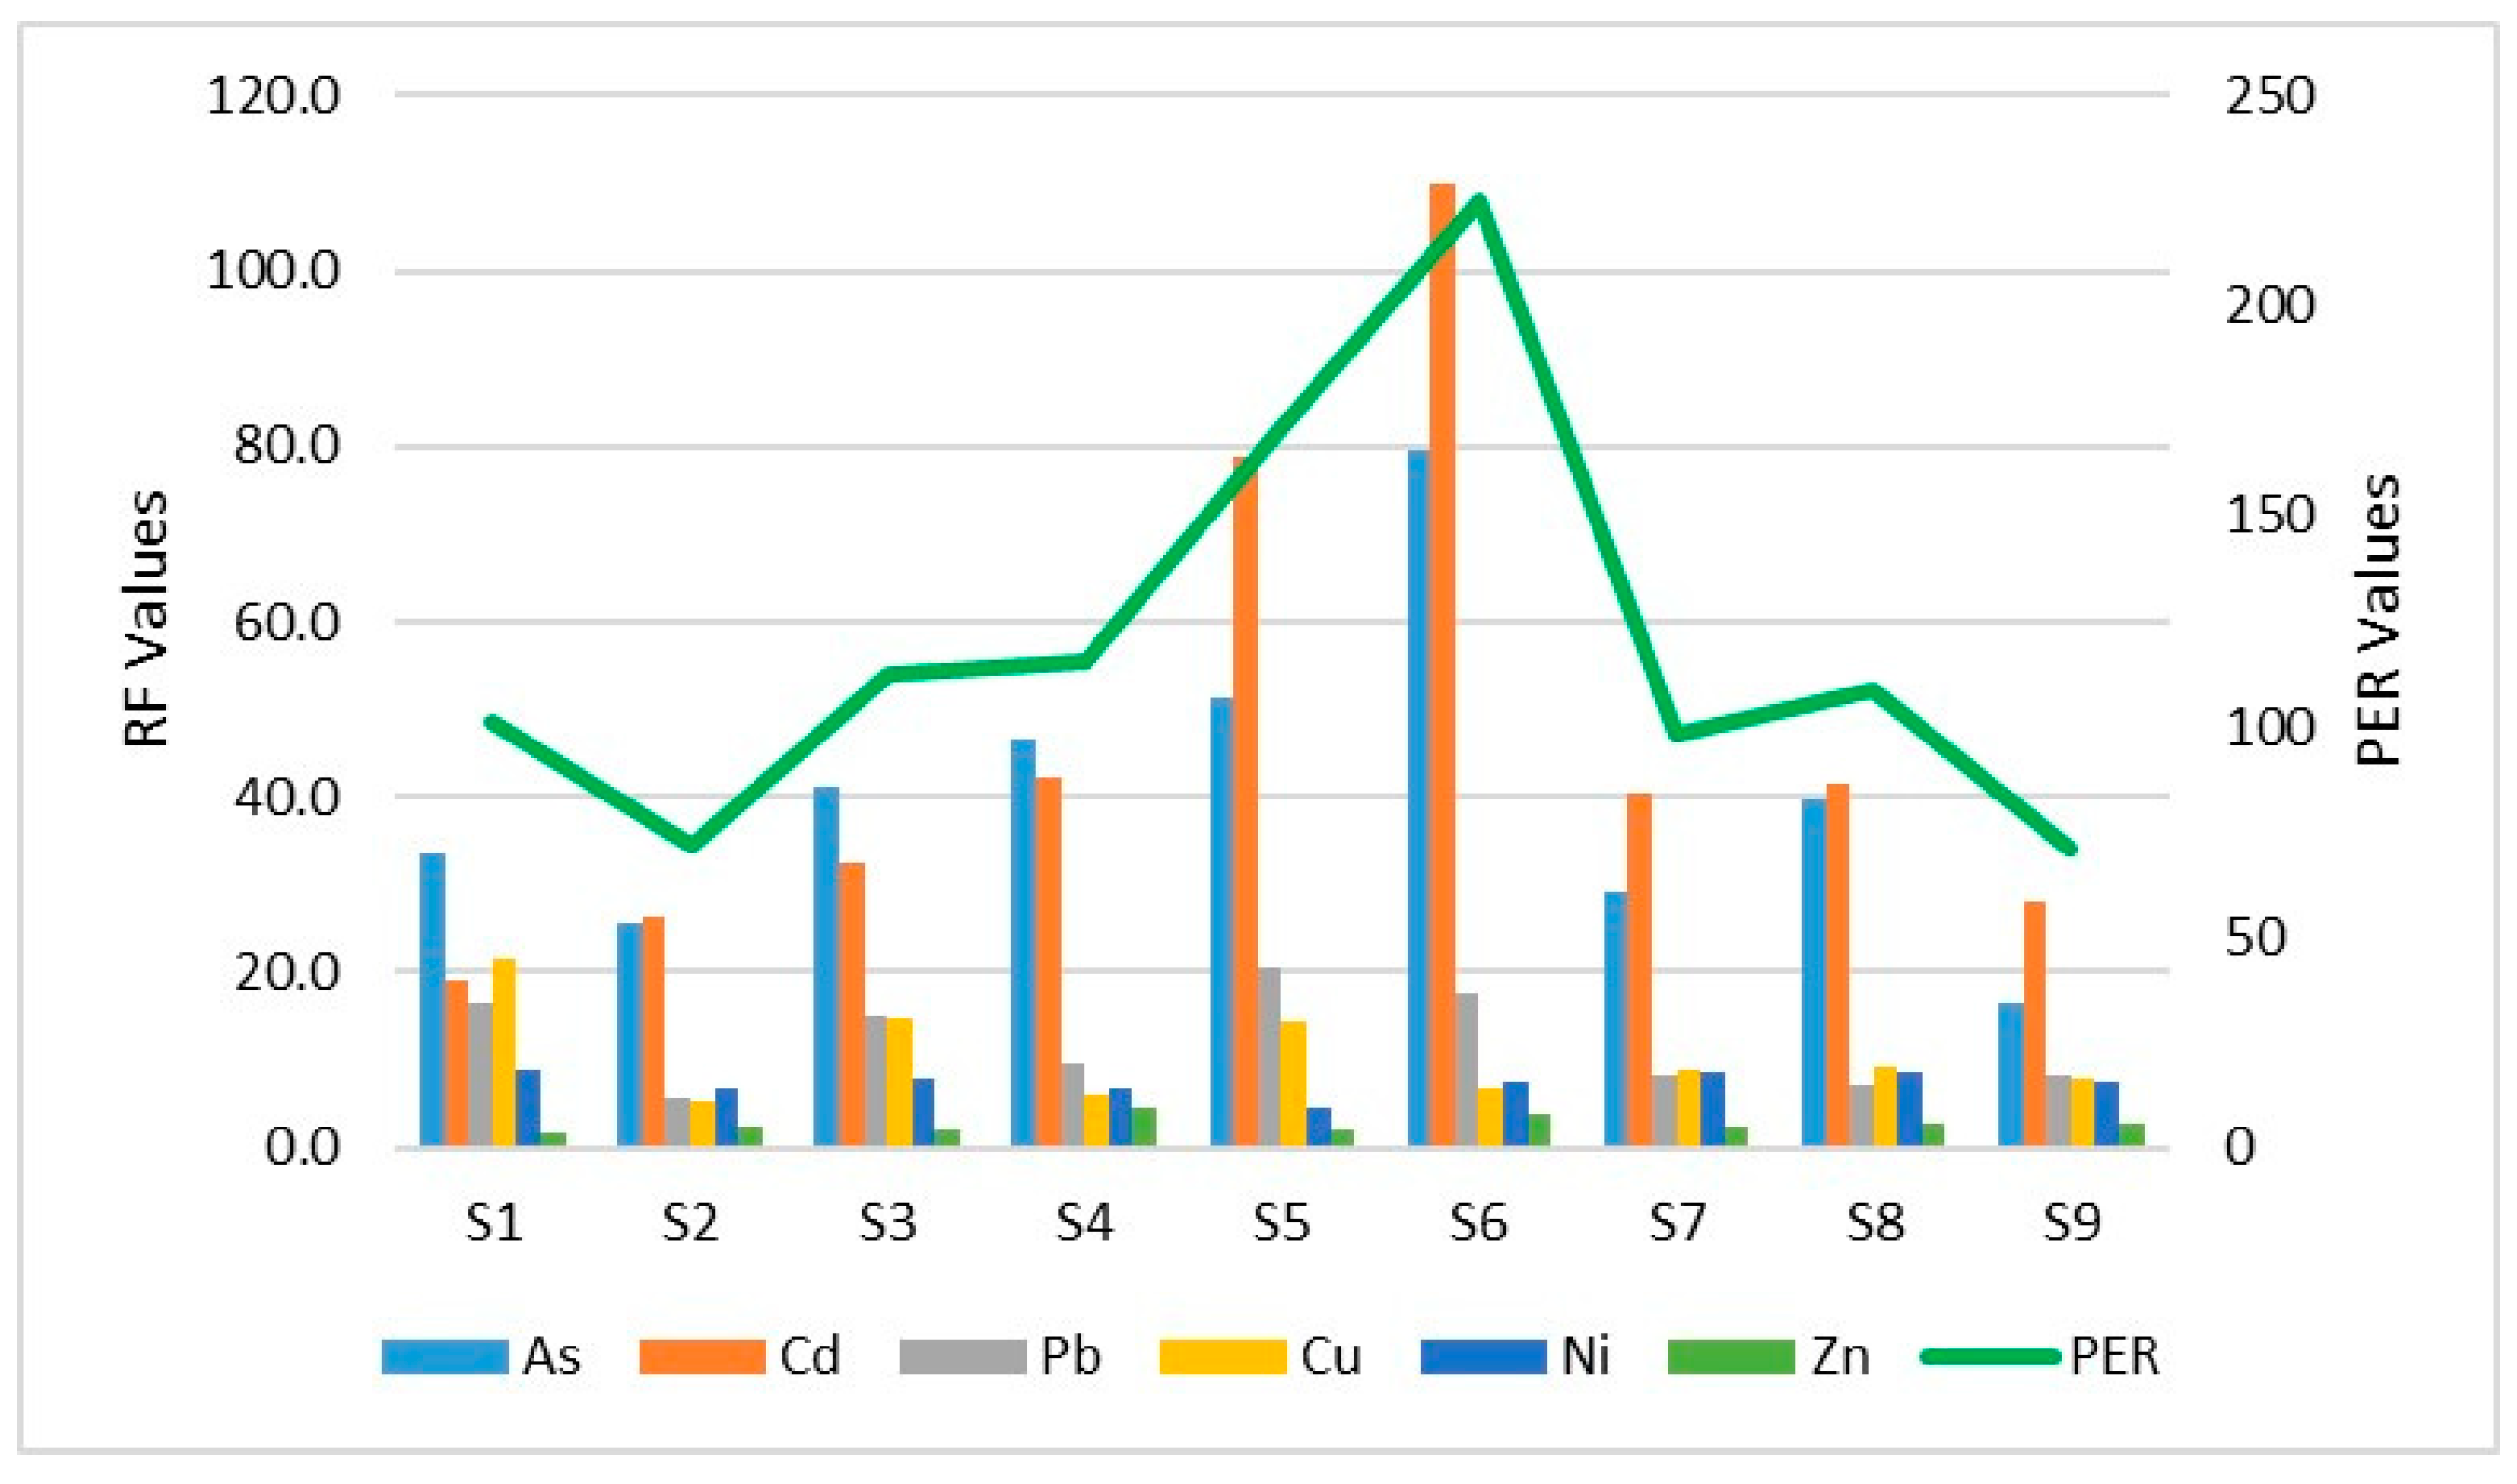
| Index | RF | PER | Ecological risk | |||
| Risk factor (RF) and Potential ecological risk (PER) | RF < 40 | PER < 150 | Low ecological risk | |||
| 40 ≤ RF < 80 | 150 ≤ PER < 300 | Moderate ecological risk | ||||
| 80 ≤ RF < 160 | 300 ≤ PER < 600 | High ecological risk | ||||
| 160 ≤ RF < 320 | - | Very high ecological risk | ||||
| RF ≥ 320 | PER ≥ 600 | Extremely high ecological risk | ||||
| Toxic metal | As | Cd | Pb | Cu | Ni | Zn |
| Toxic response factor (Tf) | 20 | 30 | 5 | 5 | 6 | 1 |
| Observation Points | Sampling Points | As | Cd | Pb | Cu | Ni | Zn | |
|---|---|---|---|---|---|---|---|---|
| OP1 | S1 (2 m) | Min. | 5.32 | 0.14 | 20.70 | 19.40 | 12.92 | 239.00 |
| Max. | 5.74 | 0.19 | 41.63 | 46.79 | 28.40 | 246.00 | ||
| Median | 5.74 | 0.19 | 41.63 | 46.79 | 28.40 | 246.00 | ||
| MAD | 0.42 | 0.05 | 20.93 | 22.69 | 2.88 | 7.00 | ||
| CV (%) | 7.32 | 24.21 | 50.28 | 48.49 | 10.14 | 2.85 | ||
| S1 (RL) | Median | 3.41 | 0.30 | 12.71 | 10.93 | 18.99 | 146.00 | |
| OP2 | S2 (2 m) | Min. | 3.35 | 0.06 | 12.60 | 17.30 | 20.64 | 155.00 |
| Max. | 7.15 | 0.50 | 17.93 | 47.49 | 26.50 | 444.00 | ||
| Median | 6.04 | 0.14 | 17.59 | 28.25 | 25.40 | 182.00 | ||
| MAD | 1.11 | 0.08 | 0.34 | 10.95 | 1.10 | 27.00 | ||
| CV (%) | 18.38 | 55.00 | 1.93 | 38.76 | 4.33 | 14.84 | ||
| S2 (RL) | Median | 4.73 | 0.16 | 15.81 | 26.16 | 22.30 | 83.15 | |
| OP3 | S3 (2 m) | Min. | 2.20 | 0.04 | 34.10 | 20.50 | 21.80 | 91.90 |
| Max. | 5.51 | 0.79 | 88.92 | 32.38 | 32.18 | 177.00 | ||
| Median | 3.47 | 0.27 | 44.90 | 26.78 | 25.66 | 147.00 | ||
| MAD | 1.27 | 0.23 | 10.80 | 5.60 | 3.86 | 30.00 | ||
| CV (%) | 36.62 | 84.87 | 24.05 | 20.91 | 15.04 | 20.41 | ||
| S3 (RL) | Median | 1.68 | 0.25 | 14.99 | 9.18 | 20.07 | 80.31 | |
| OP4 | S4 (2 m) | Min. | 1.80 | 0.06 | 18.90 | 12.61 | 13.17 | 387.00 |
| Max. | 4.46 | 0.53 | 33.84 | 42.14 | 29.09 | 665.00 | ||
| Median | 3.68 | 0.20 | 21.92 | 19.20 | 22.80 | 535.00 | ||
| MAD | 0.78 | 0.14 | 3.02 | 6.59 | 6.29 | 130.00 | ||
| CV (%) | 21.20 | 68.00 | 13.78 | 34.32 | 27.59 | 24.30 | ||
| S4 (RL) | Median | 1.58 | 0.14 | 11.47 | 15.74 | 20.34 | 117.00 | |
| OP5 | S5 (2 m) | Min. | 1.82 | 0.07 | 14.90 | 12.60 | 14.47 | 87.80 |
| Max. | 6.32 | 0.61 | 57.65 | 20.19 | 20.72 | 164.00 | ||
| Median | 4.73 | 0.42 | 20.83 | 16.20 | 17.40 | 149.00 | ||
| MAD | 1.59 | 0.19 | 5.93 | 3.60 | 2.93 | 15.00 | ||
| CV (%) | 33.62 | 45.24 | 28.47 | 22.22 | 16.84 | 10.07 | ||
| S5 (RL) | Median | 1.84 | 0.16 | 5.12 | 5.64 | 22.26 | 78.40 | |
| OP6 | S6 (2 m) | Min. | 1.46 | 0.05 | 28.19 | 42.00 | 15.91 | 276.00 |
| Max. | 4.33 | 0.89 | 47.95 | 88.18 | 24.00 | 453.00 | ||
| Median | 3.94 | 0.66 | 31.50 | 76.27 | 18.10 | 347.00 | ||
| MAD | 0.39 | 0.23 | 3.31 | 11.91 | 2.19 | 71.00 | ||
| CV (%) | 9.87 | 34.85 | 10.51 | 15.62 | 12.10 | 20.46 | ||
| S6 (RL) | Median | 0.99 | 0.18 | 8.90 | 56.20 | 14.77 | 89.50 | |
| OP7 | S7 (2 m) | Min. | 2.28 | 0.10 | 17.60 | 22.80 | 21.29 | 105.00 |
| Max. | 8.50 | 0.66 | 77.65 | 71.26 | 45.81 | 231.00 | ||
| Median | 5.78 | 0.27 | 38.05 | 41.68 | 25.70 | 230.00 | ||
| MAD | 2.72 | 0.17 | 20.45 | 18.88 | 4.41 | 1.00 | ||
| CV (%) | 47.06 | 62.59 | 53.75 | 45.30 | 17.16 | 0.43 | ||
| S7 (RL) | Median | 3.94 | 0.20 | 22.83 | 23.77 | 17.82 | 104.00 | |
| OP8 | S8 (2 m) | Min. | 1.51 | 0.11 | 26.80 | 25.74 | 16.07 | 113.00 |
| Max. | 5.40 | 0.74 | 50.05 | 36.80 | 23.78 | 207.00 | ||
| Median | 3.94 | 0.18 | 44.90 | 30.03 | 20.20 | 186.00 | ||
| MAD | 1.46 | 0.07 | 5.15 | 4.29 | 3.58 | 21.00 | ||
| CV (%) | 37.08 | 37.22 | 11.47 | 14.29 | 17.72 | 11.29 | ||
| S8 (RL) | Median | 1.99 | 0.13 | 31.13 | 16.09 | 14.23 | 67.60 | |
| OP9 | S9 (2 m) | Min. | 1.76 | 0.10 | 23.12 | 26.21 | 17.89 | 110.00 |
| Max. | 5.25 | 0.81 | 42.28 | 96.22 | 37.61 | 246.00 | ||
| Median | 2.00 | 0.15 | 34.10 | 31.50 | 22.30 | 192.00 | ||
| MAD | 0.24 | 0.05 | 8.18 | 5.29 | 4.41 | 54.00 | ||
| CV (%) | 12.00 | 33.33 | 23.99 | 16.79 | 19.78 | 28.13 | ||
| S9 (RL) | Median | 2.44 | 0.16 | 21.00 | 20.12 | 17.61 | 69.30 |
| S1 | S2 | S3 | S4 | S5 | S6 | S7 | S8 | S9 | NV | AT | IT | |
|---|---|---|---|---|---|---|---|---|---|---|---|---|
| As (2 m) | 5.74 | 6.04 | 3.47 | 3.68 | 4.73 | 3.94 | 5.78 | 3.94 | 2.00 | 5.00 | 15.00 | 25.00 |
| As (RL) | 3.41 | 4.73 | 1.68 | 1.58 | 1.84 | 0.99 | 3.94 | 1.99 | 2.44 | 5.00 | 15.00 | 25.00 |
| Cd (2 m) | 0.19 | 0.14 | 0.27 | 0.20 | 0.42 | 0.66 | 0.27 | 0.18 | 0.15 | 1.00 | 3.00 | 5.00 |
| Cd (RL) | 0.30 | 0.16 | 0.25 | 0.14 | 0.16 | 0.18 | 0.20 | 0.13 | 0.16 | 1.00 | 3.00 | 5.00 |
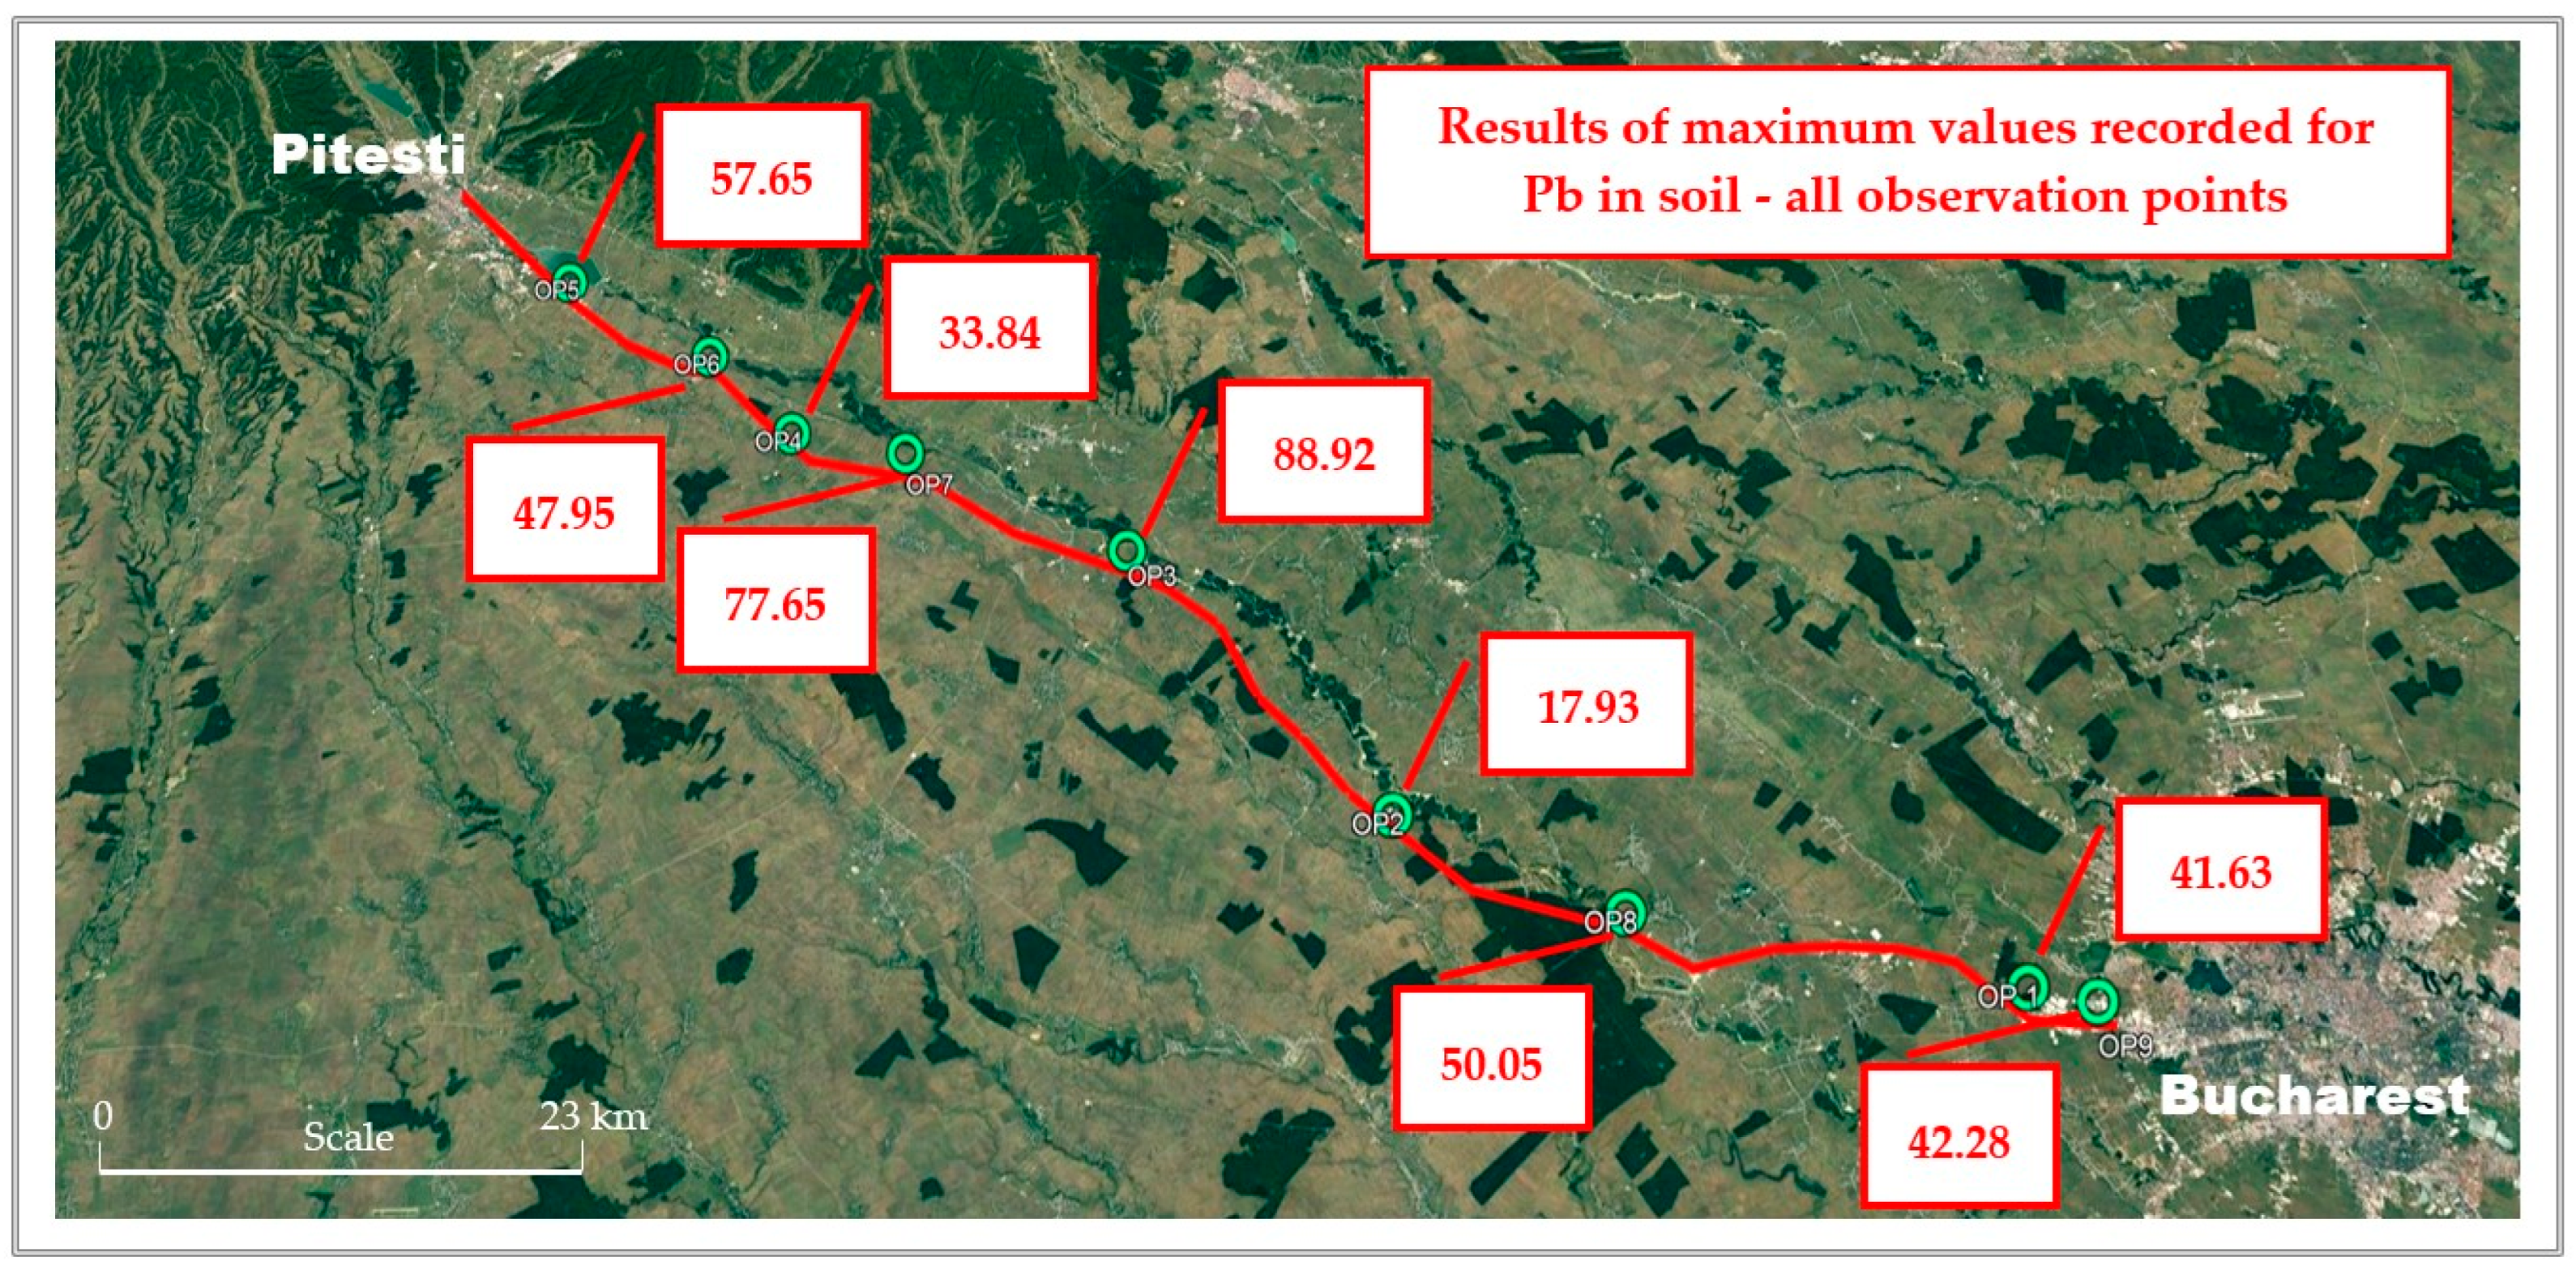
| Pb (2 m) | 41.63 | 17.59 | 44.90 | 21.92 | 20.83 | 31.50 | 38.05 | 44.90 | 34.10 | 20.00 | 50.00 | 100.00 |
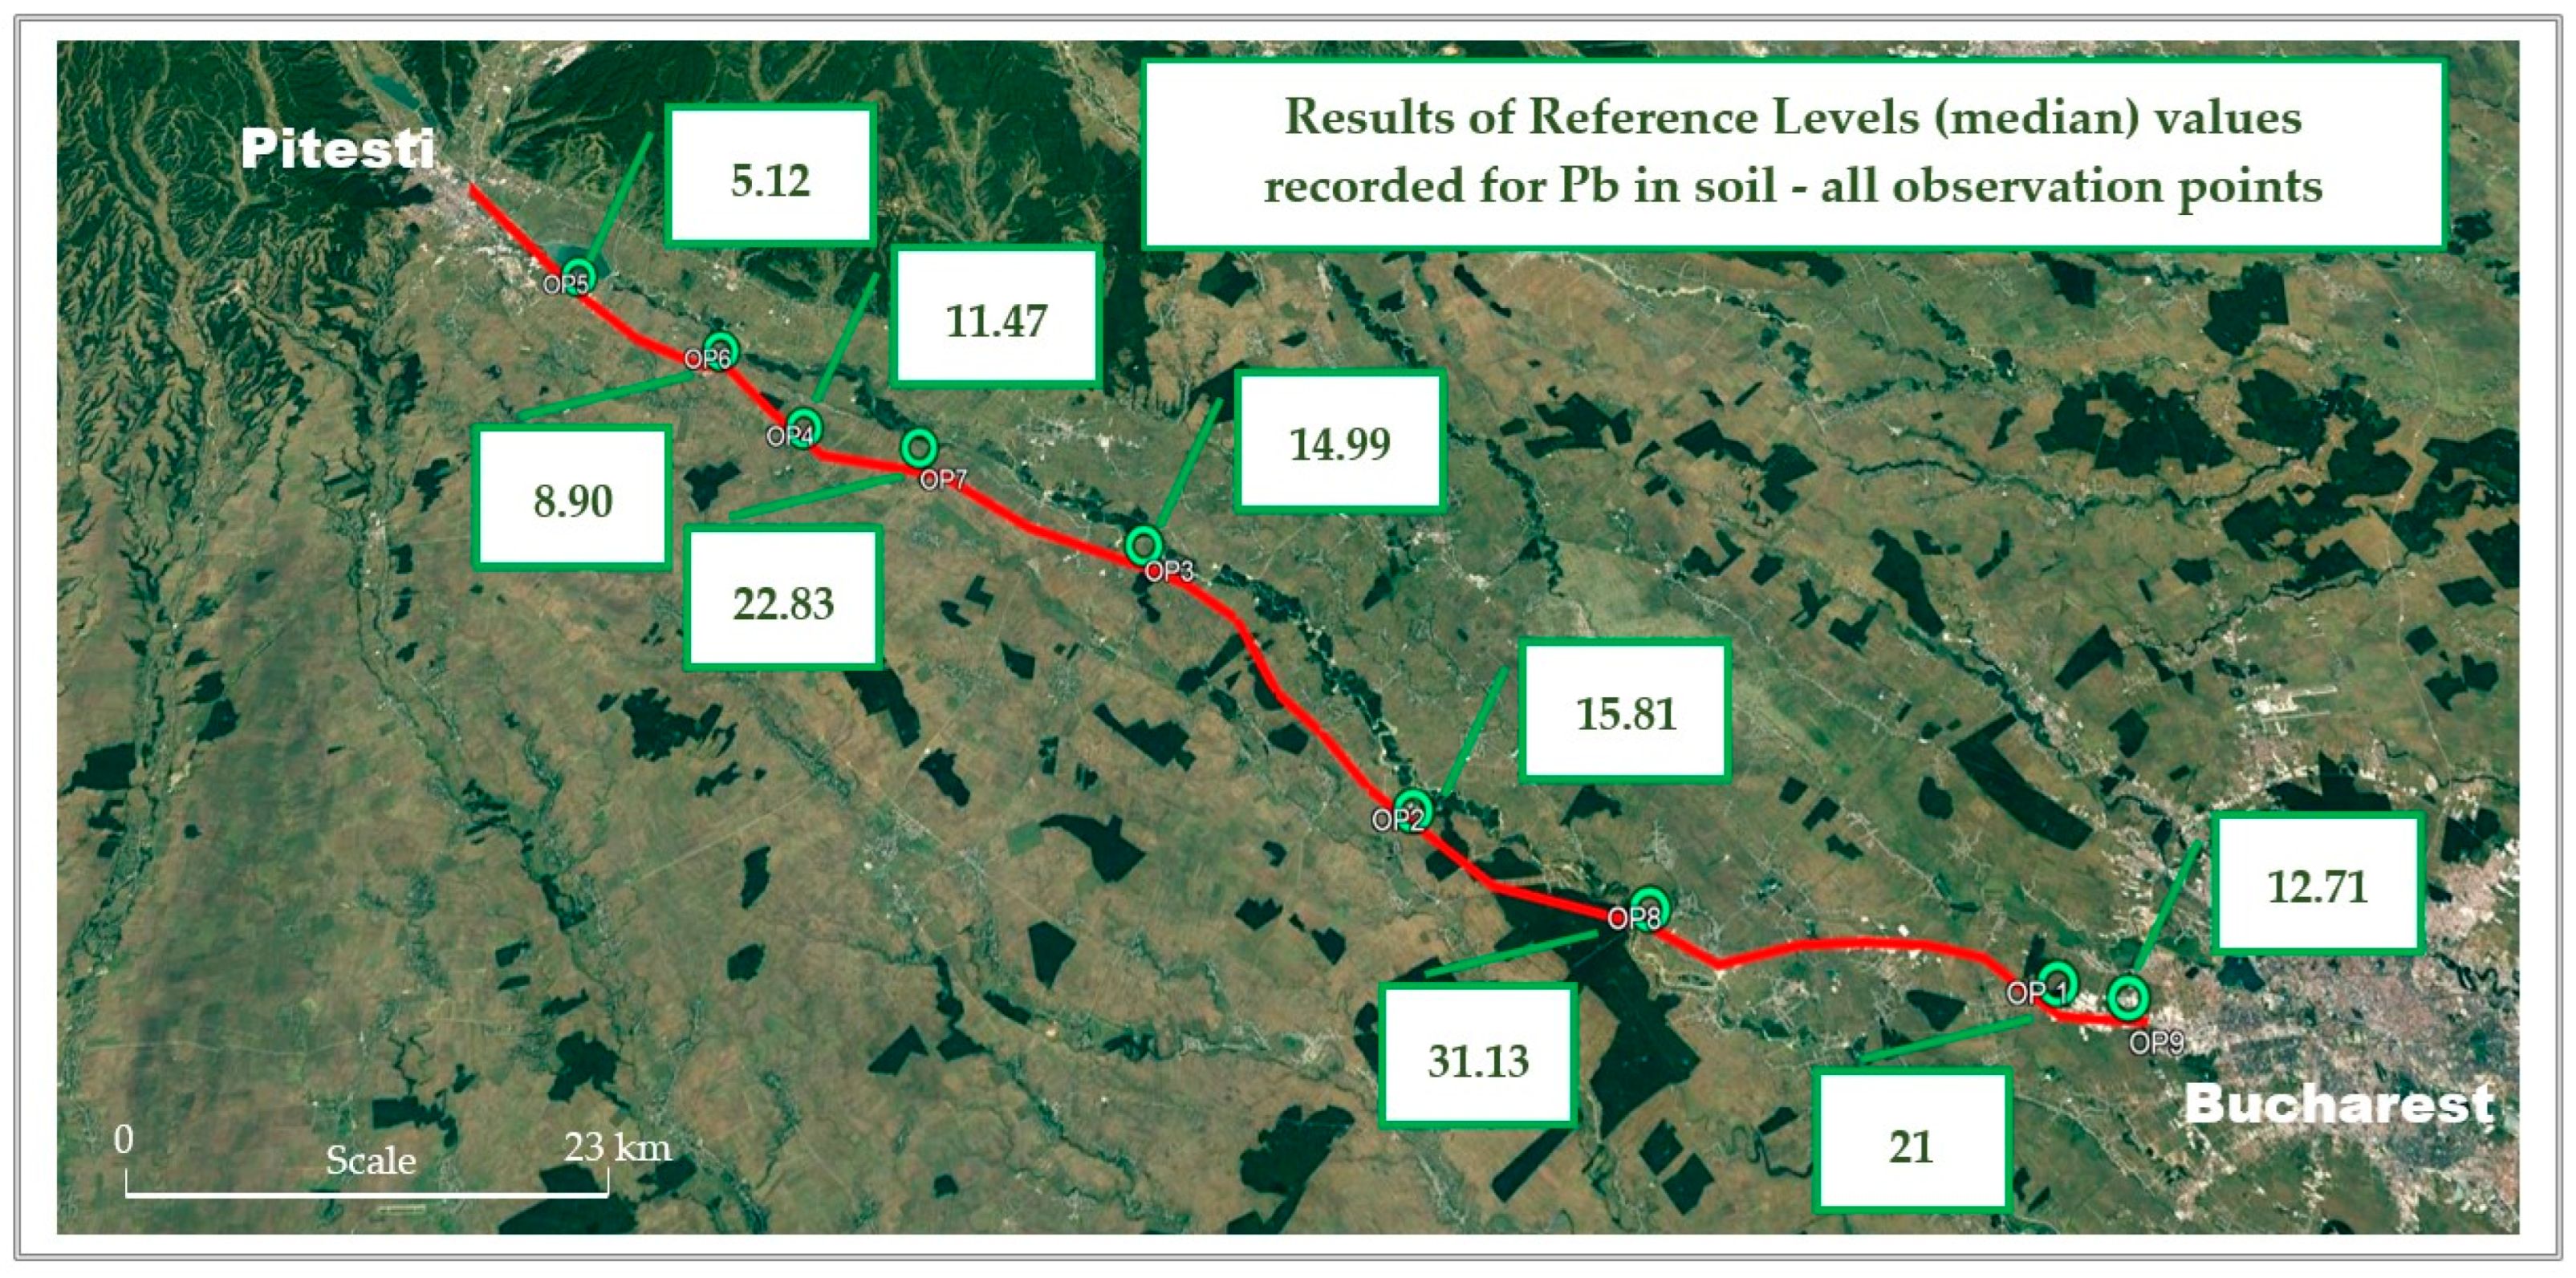
| Pb (RL) | 12.71 | 15.81 | 14.99 | 11.47 | 5.12 | 8.90 | 22.83 | 31.13 | 21.00 | 20.00 | 50.00 | 100.00 |
| Cu (2 m) | 46.79 | 28.25 | 26.78 | 19.20 | 16.20 | 76.27 | 41.68 | 30.03 | 31.50 | 20.00 | 100.00 | 200.00 |
| Cu (RL) | 10.93 | 26.16 | 9.18 | 15.74 | 5.64 | 56.20 | 23.77 | 16.09 | 20.12 | 20.00 | 100.00 | 200.00 |
| Ni (2 m) | 28.40 | 25.40 | 25.66 | 22.80 | 17.40 | 18.10 | 25.70 | 20.20 | 22.30 | 20.00 | 75.00 | 150.00 |
| Ni (RL) | 18.99 | 22.30 | 20.07 | 20.34 | 22.26 | 14.77 | 17.82 | 14.23 | 17.61 | 20.00 | 75.00 | 150.00 |
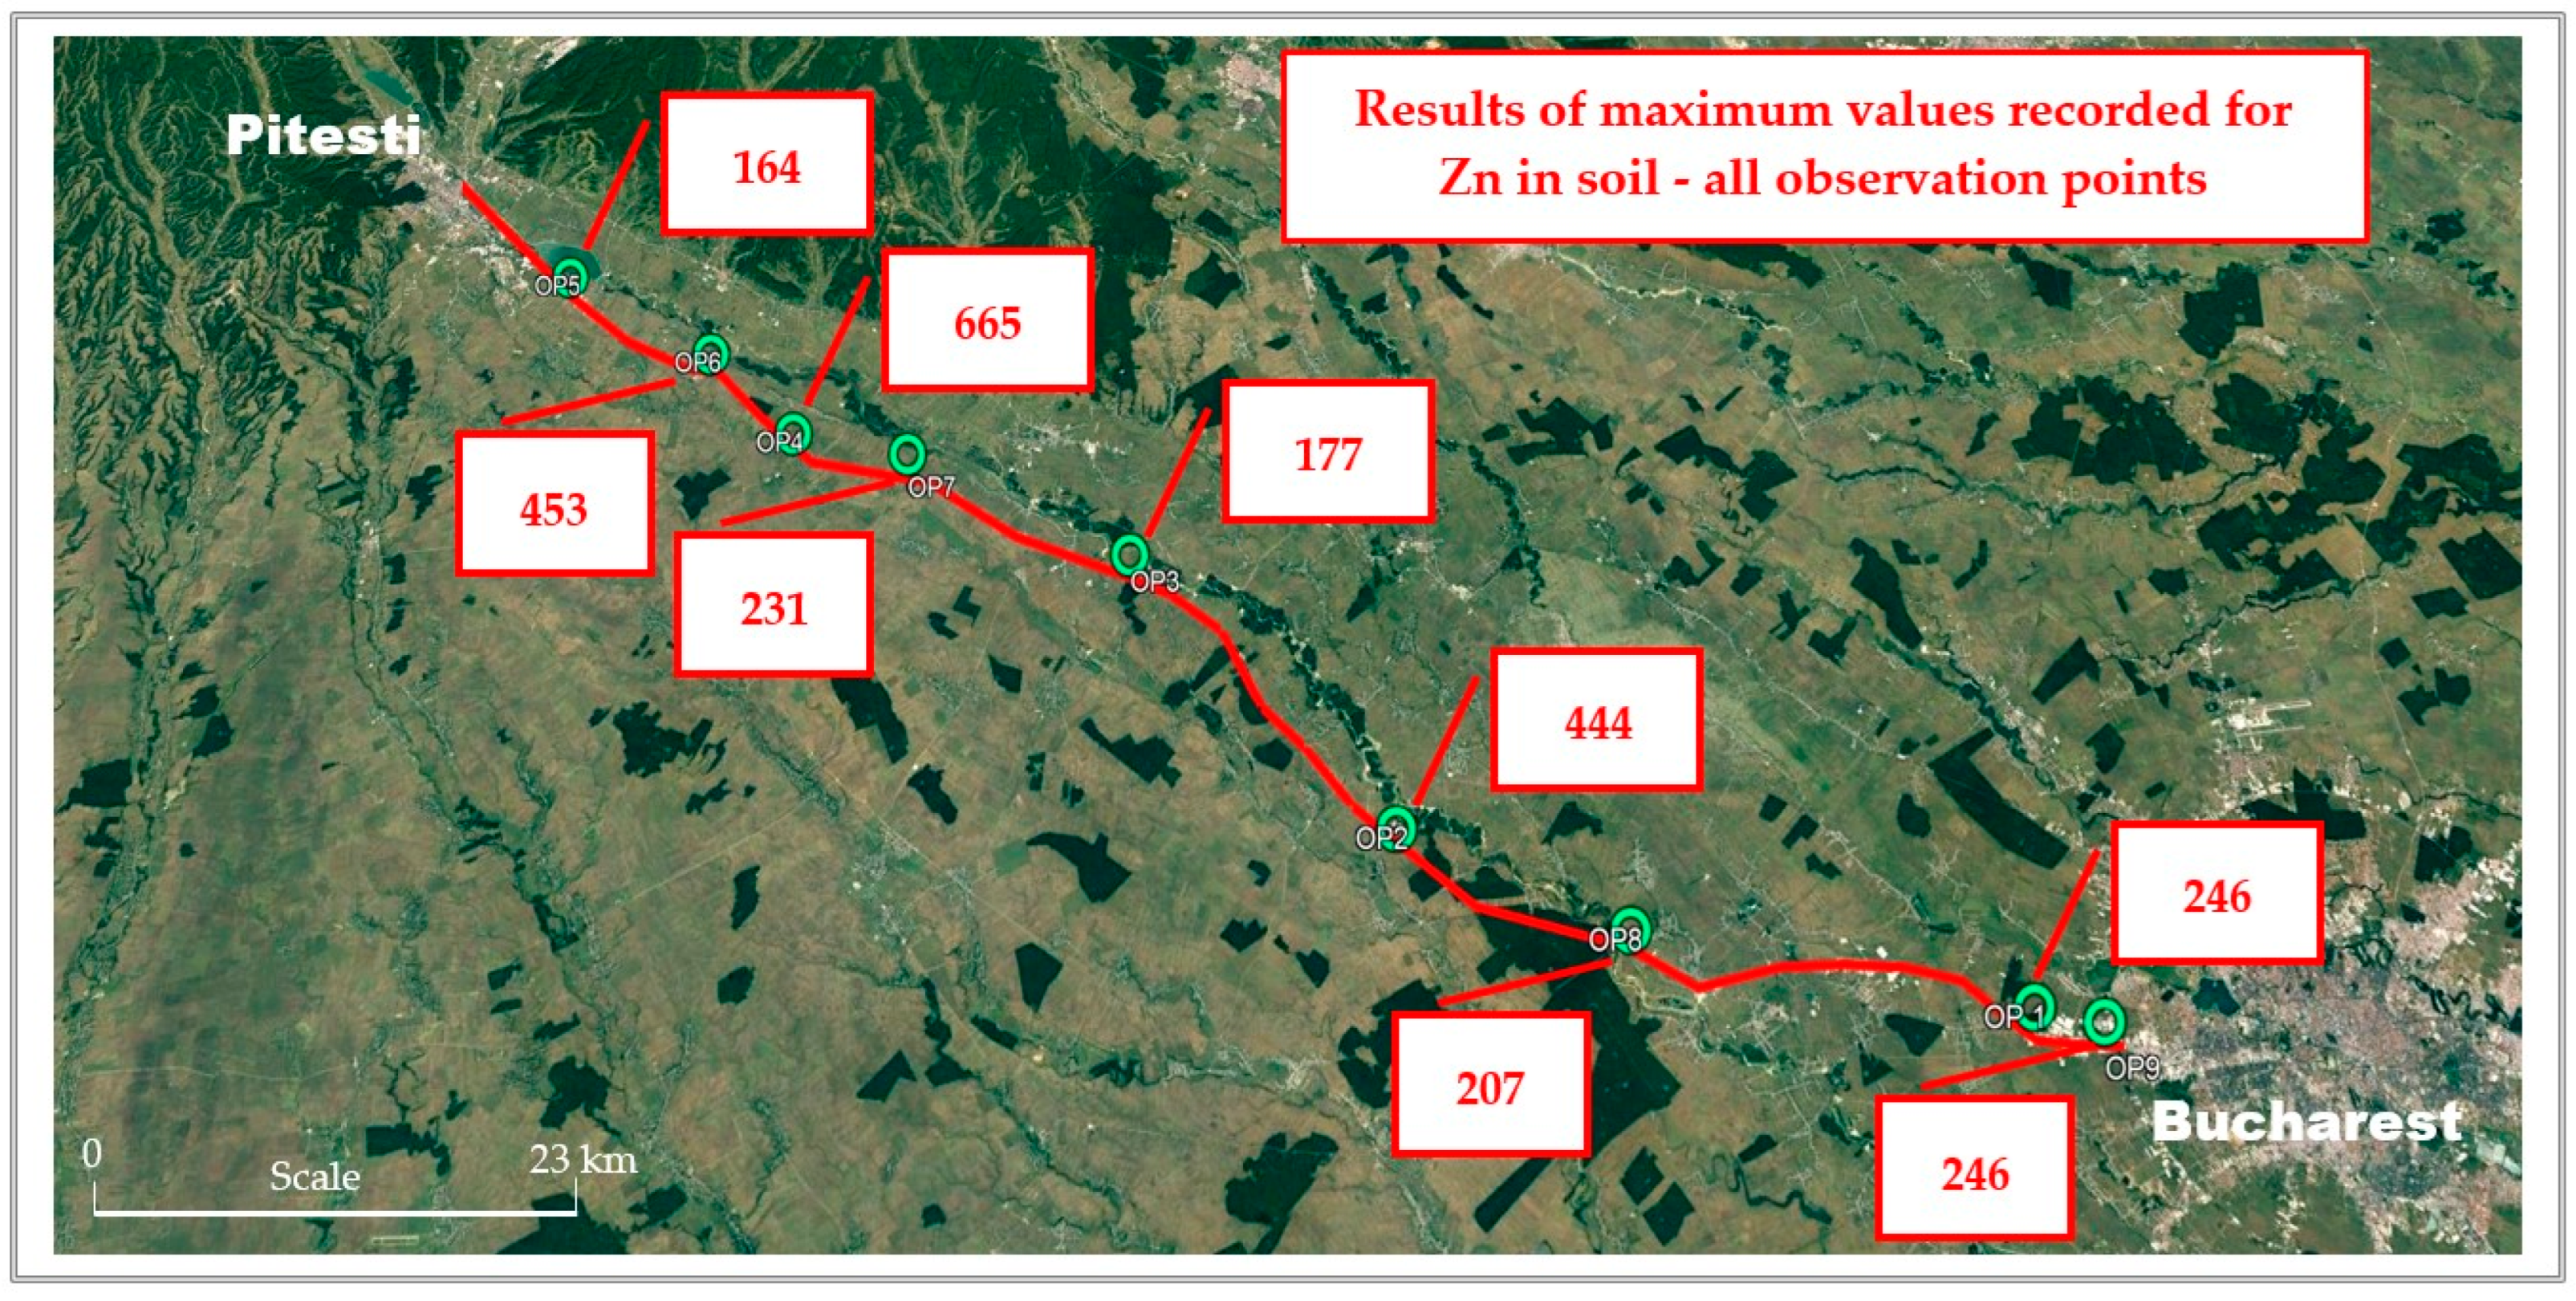
| Zn (2 m) | 246.00 | 182.00 | 147.00 | 535.00 | 149.00 | 347.00 | 230.00 | 186.00 | 192.00 | 100.00 | 300.00 | 600.00 |
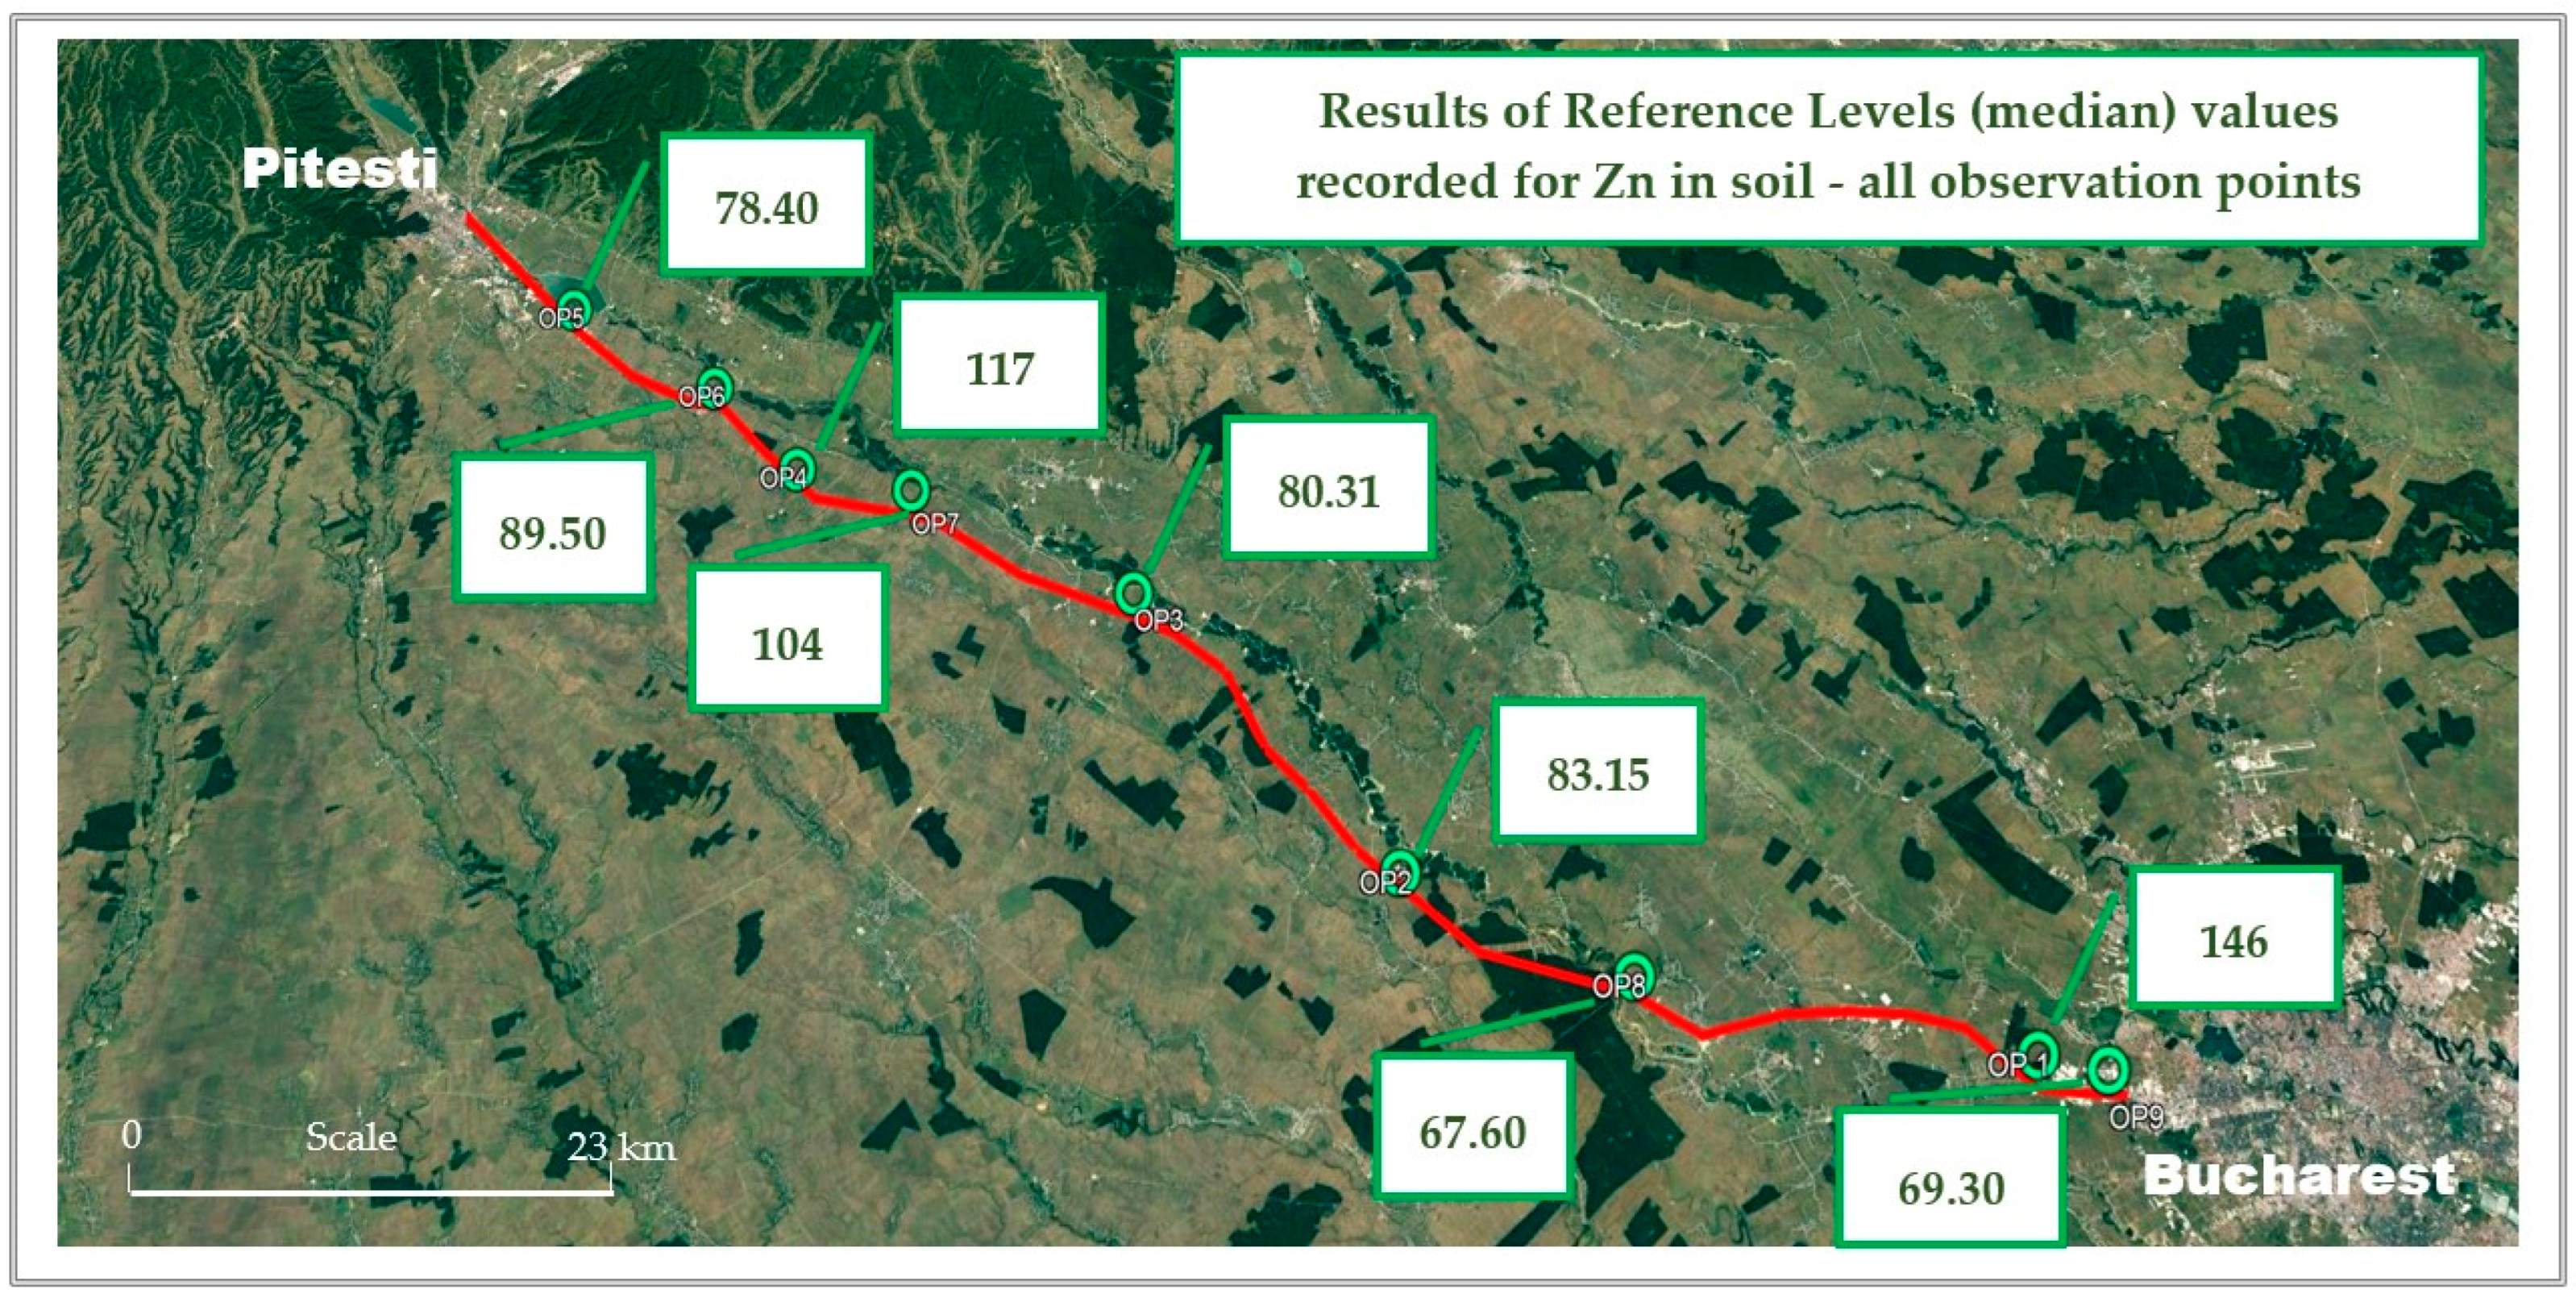
| Zn (RL) | 146.00 | 83.15 | 80.31 | 117.00 | 78.40 | 89.50 | 104.00 | 67.60 | 69.30 | 100.00 | 300.00 | 600.00 |
| Legend: | The pollutant concentration value corresponds to the normal value of reference (NV) | |||||||||||
| The pollutant concentration value corresponds to the value of the alert threshold (AT) | ||||||||||||
| The pollutant concentration value corresponds to the value of the intervention thresholds (IT) | ||||||||||||
| Sampling Points | As (mg/kg) | Cd (mg/kg) | Pb (mg/kg) | Cu (mg/kg) | Ni (mg/kg) | Zn (mg/kg) | ||||||
|---|---|---|---|---|---|---|---|---|---|---|---|---|
| 2 m | (RL) | 2 m | (RL) | 2 m | (RL) | 2 m | (RL) | 2 m | (RL) | 2 m | (RL) | |
| V1 | 0.95 | 0.53 | 0.21 | 0.25 | 4.13 | 3.66 | 7.56 | 4.11 | 12.37 | 10.70 | 47.86 | 31.16 |
| V2 | 0.61 | 0.75 | 0.11 | 0.15 | 3.84 | 3.31 | 6.41 | 4.78 | 6.52 | 7.74 | 44.03 | 24.72 |
| V3 | 0.69 | 0.50 | 0.05 | 0.19 | 3.48 | 3.33 | 7.05 | 5.34 | 5.30 | 10.78 | 45.69 | 32.65 |
| V4 | 0.43 | 0.73 | 0.24 | 0.16 | 3.57 | 4.94 | 7.81 | 6.02 | 9.01 | 9.35 | 40.72 | 30.03 |
| V5 | 0.51 | 0.59 | 0.31 | 0.25 | 3.31 | 3.41 | 7.33 | 3.76 | 7.69 | 9.79 | 39.94 | 16.33 |
| V6 | 0.74 | 0.34 | 0.18 | 0.09 | 2.77 | 2.52 | 7.61 | 4.12 | 8.41 | 6.83 | 45.37 | 32.04 |
| V7 | 0.78 | 0.85 | 0.06 | 0.11 | 3.22 | 3.06 | 5.11 | 2.95 | 5.74 | 5.11 | 38.81 | 18.15 |
| V8 | 1.03 | 0.88 | 0.18 | 0.15 | 4.78 | 3.66 | 12.08 | 4.19 | 6.83 | 7.71 | 89.00 | 19.58 |
| V9 | 0.52 | 0.77 | 0.19 | 0.08 | 4.66 | 3.80 | 8.30 | 5.15 | 6.78 | 7.34 | 73.98 | 28.73 |
| Vegetation/Soil | As | Cd | Pb | Cu | Ni | Zn |
|---|---|---|---|---|---|---|
| V1/S1 | 0.16 | 1.10 | 0.10 | 0.16 | 0.44 | 0.19 |
| V2/S2 | 0.10 | 0.75 | 0.22 | 0.23 | 0.26 | 0.24 |
| V3/S3 | 0.20 | 0.20 | 0.08 | 0.26 | 0.21 | 0.31 |
| V4/S4 | 0.12 | 1.20 | 0.16 | 0.41 | 0.40 | 0.08 |
| V5/S5 | 0.11 | 0.73 | 0.16 | 0.45 | 0.44 | 0.27 |
| V6/S6 | 0.19 | 0.27 | 0.09 | 0.10 | 0.46 | 0.13 |
| V7/S7 | 0.13 | 0.24 | 0.08 | 0.12 | 0.22 | 0.17 |
| V8/S8 | 0.26 | 1.00 | 0.11 | 0.40 | 0.34 | 0.48 |
| V9/S9 | 0.26 | 1.27 | 0.14 | 0.26 | 0.30 | 0.39 |
| Sampling Point | Igeo | PLI | PLI Zone | |||||
|---|---|---|---|---|---|---|---|---|
| As | Cd | Pb | Cu | Ni | Zn | |||
| S1 | 0.17 | −1.24 | 1.13 | 1.51 | 0.00 | 0.17 | 1.83 | 2 |
| S2 | −0.23 | −0.78 | −0.43 | −0.47 | −0.40 | 0.55 | 1.22 | |
| S3 | 0.46 | −0.47 | 1.00 | 0.96 | −0.23 | 0.29 | 1.89 | |
| S4 | 0.63 | −0.09 | 0.35 | −0.30 | −0.42 | 1.61 | 1.84 | |
| S5 | 0.78 | 0.81 | 1.44 | 0.94 | −0.94 | 0.34 | 2.21 | |
| S6 | 1.41 | 1.29 | 1.24 | −0.14 | −0.29 | 1.37 | 2.63 | |
| S7 | −0.03 | −0.15 | 0.15 | 0.23 | −0.06 | 0.56 | 1.63 | |
| S8 | 0.40 | −0.12 | −0.06 | 0.32 | −0.08 | 0.88 | 1.75 | |
| S9 | −0.87 | −0.68 | 0.11 | 0.06 | −0.24 | 0.89 | 1.38 | |
Disclaimer/Publisher’s Note: The statements, opinions and data contained in all publications are solely those of the individual author(s) and contributor(s) and not of MDPI and/or the editor(s). MDPI and/or the editor(s) disclaim responsibility for any injury to people or property resulting from any ideas, methods, instructions or products referred to in the content. |
© 2024 by the authors. Licensee MDPI, Basel, Switzerland. This article is an open access article distributed under the terms and conditions of the Creative Commons Attribution (CC BY) license (https://creativecommons.org/licenses/by/4.0/).
Share and Cite
Pascu, L.F.; Stănescu, B.A.; Gâsnac, M.G.; Kim, L. Spatiotemporal Assessment of Soil and Vegetation Pollution with Toxic Metals from Road Traffic along the First Romanian Highway. Environments 2024, 11, 21. https://doi.org/10.3390/environments11010021
Pascu LF, Stănescu BA, Gâsnac MG, Kim L. Spatiotemporal Assessment of Soil and Vegetation Pollution with Toxic Metals from Road Traffic along the First Romanian Highway. Environments. 2024; 11(1):21. https://doi.org/10.3390/environments11010021
Chicago/Turabian StylePascu, Luoana Florentina, Bogdan Adrian Stănescu, Marian Gabriel Gâsnac, and Lidia Kim. 2024. "Spatiotemporal Assessment of Soil and Vegetation Pollution with Toxic Metals from Road Traffic along the First Romanian Highway" Environments 11, no. 1: 21. https://doi.org/10.3390/environments11010021
APA StylePascu, L. F., Stănescu, B. A., Gâsnac, M. G., & Kim, L. (2024). Spatiotemporal Assessment of Soil and Vegetation Pollution with Toxic Metals from Road Traffic along the First Romanian Highway. Environments, 11(1), 21. https://doi.org/10.3390/environments11010021