Abstract
Biomass-derived carbon dots (CDs) are gaining much interest in recent times, as they provide a sustainable option with abundant availability, a low cost and tunable luminescence. Herein, we report a simple green synthesis method to produce highly fluorescent CDs from Eucalyptus globulus leaves using the one-pot hydrothermal approach. The fabricated CDs exhibit strong blue fluorescence with an excitation and emission maxima of 320 nm and 445 nm, respectively. The highest quantum yield (QY) obtained was 60.7%. With the reported optical properties and biocompatibility, CDs can be looked at as a promising candidate for potential biosensing applications. Moreover, we employed a life cycle assessment (LCA) cradle-to-gate approach to study the environmental impacts of the synthesis strategy used for the fabrication of CDs. The results point out that citric acid is the main hotspot in CD synthesis, regarding environmental impacts in most categories. This justifies the introduction of biomass, which reduces the amount of citric acid, thus leading to a more sustainable synthesis strategy for fabricating CDs.
1. Introduction
Carbon dots (CDs) are fluorescent spherical carbon nanomaterials with a particle size typically less than 10 nm, discovered in 2004 by Xu et al. [1] and named in 2006 by Sun et al. [2]. They possess excellent properties such as an adjustable emission wavelength, easy surface modification, low cytotoxicity, good biocompatibility, photostability and excellent water stability, among others [3]. Multiple methods are available for the preparation of CDs, and they follow two main synthesis routes: top-down and bottom-up methods [4]. Top-down approaches involve the exfoliation of large pure carbon compounds like carbon black, carbon nanotubes or graphite into nanoscale CDs. These methods are relatively expensive and require complex steps and harsh experimental conditions [3]. Laser ablation [5], electrochemical oxidation [6], chemical oxidation [7], etc., are examples of top-down methods. Bottom-up approaches like the hydrothermal method [8], microwave-assisted methods [9], solvothermal methods [10], pyrolysis [11], etc., convert small organic molecules or biological carbon materials like biomass waste or plant and animal products into carbon dots via carbonization and passivation [3]. Bottom-up methods are thus more advantageous in the sense that they are cost-effective and environmentally friendly, and simple surface modification can be achieved with one pot [12].
CDs synthesized from biomass are today becoming an important research subject in application fields such as sensing [13], imaging [14], drug delivery [15], photocatalysis [16], etc., due to various advantages including an abundance of carbon sources, simplicity in preparation and the practicality of large-scale production. The composition of biomass waste, which is a natural source of carbon, mainly consists of cellulose, hemicellulose, lignin, ash, proteins, etc., [3]. For example, in the case of plant biomass, cellulose accounts for 30–60%, hemicellulose accounts for 20–40%, and lignin accounts for 15–25% [17]. Hence, it is useful to utilize biomass waste as raw materials to produce CDs. Another important aspect about CDs from biomass waste is the possibility of self-passivation during the synthetic process itself due to the presence of heteroatoms containing compounds that can act as self-passivating agents [3]. Examples of biomass-derived CDs reported in the literature are from sources like spent coffee grounds [18], green tea leaves [19], Pyrus pyrifolia fruit [20], papaya waste pulp [21], banana peels [22], willow catkin [23], Chionantus retusus fruit extract [24], bamboo leaves [25], orange juice [26], Seville oranges [27], starch fermentation wastewater [28] and mango peels [29], among others.
Haghani et al. used eucalyptus leaves for the first time as a carbon dot precursor for an optical sensor application based on the molecular imprinting technique [30]. Eucalyptus globulus is the main eucalyptus species cultivated in Portugal and is characterized by high productivity [31]. Due to its richness in hydrocarbon groups and abundant availability, eucalyptus leaves can be an excellent choice as a carbon precursor for CD synthesis [32]. However, the most common precursors used for the preparation of CDs are citric acid as the carbon source and amine-containing molecules as the nitrogen source, as nitrogen doping is indicated to be an efficient strategy to enhance photoluminescence [33,34,35]. In this paper, we discuss the green synthesis of nitrogen-doped CDs based on Eucalyptus globulus leaves and citric acid. The novelty of the present work is the introduction of an environmentally friendly synthesis strategy using eucalyptus leaves to produce highly fluorescent CDs with a quantum yield of 60.7%, which is relatively quite high compared to CDs synthesized from other biomass precursors discussed above. In addition, we also evaluate the environmental impacts of the synthesis method using the life cycle assessment (LCA) approach.
LCA is an important approach for sustainable development. As the name indicates, LCA is a methodology for the systematic analysis of the potential environmental impacts of a product (or service) during its entire life cycle from cradle to grave, i.e., raw material extraction, transportation, production, distribution, use and end-of-life phases [36]. LCA has already been employed to study the environmental impacts of CDs for the comparative study of different bottom-up procedures for the fabrication of CDs [37,38,39]. Some examples of LCAs related to our daily life include the sustainability evaluation of cheese [40], buildings [41], gravity dams [42], etc. In this study, we identify the most critical parameters giving rise to environmental impacts. With this objective in mind, we propose a basis for future studies to design a sustainable strategy for the high-yield production of CDs.
2. Materials and Methods
2.1. Materials
Eucalyptus leaves (Eucalyptus globulus) were collected from local plantations in Portugal. Citric acid (anhydrous, ≥99.5%) and ethylenediamine (≥99%) were purchased from Sigma-Aldrich (St. Louis, MO, USA). Quinine sulfate dihydrate from VWR Chemicals BDH® (Leuven, Belgium) and sulfuric acid from Merck (Darmstadt, Germany) were used for quantum yield (QY) calculations. The dialysis membranes with a molecular weight cut-off 1000 Da were from Float-A-Lyzer®G2 Dialysis Device SPECTRUM® (New Brunswick, NJ, USA).
2.2. Instrumentation
Fluorescence spectra were obtained in a standard 10 mm fluorescence quartz cell and collected in a Horiba Jobin Yvon Fluoromax-4 spectrofluorometer(Longjumeau, France). The absorption measurements were made with a Jasco V-760 UV–visible spectrophotometer (Tokyo, Japan). Attenuated total reflectance–Fourier Transform Infrared Spectroscopy (ATR-FTIR) measurements were performed in the range of 600–4000 cm−1 using the spectrophotometer Bruker FT-IR System Tensor 27 with a diamond ATR crystal(Billerica, MI, USA). High-Resolution Transmission Electron Microscopy (HRTEM) was performed on a probe-corrected FEI Titan G2 80-200 with ChemiSTEM technology (Hillsboro, OR, USA), operated at an acceleration voltage of 200 kV. Atomic force microscopy (AFM) analysis was carried out using Veeco Metrology Multimode/Nanoscope IVA in the tapping mode using a Bruker silicon probe (model TESP-SS, resonant frequency of 320 kHz (Billerica, MI, USA), nominal force constant of 42 N/m, estimated tip radius of 2 nm). X-ray diffraction (XRD) analysis was performed with a SmartLab Rigaku Diffractometer (Cu-Kα radiation) with θ = 2θ scanning equipment and using Bragg Brentano (BB) geometry (Tokyo, Japan). The Raman spectrum was measured with a Renishaw inVia Raman microscope coupled with 633 nm 17 mW (He–Ne) and 785 nm 300 mW (diode) lasers (Wotton-under-Edge, UK).
2.3. Preparation of CDs
Eucalyptus leaves were used as the main carbon source, and ethylenediamine was used as the nitrogen dopant in a single-step hydrothermal method for the synthesis of carbon dots, as illustrated in the Figure 1. First, eucalyptus leaves were carefully rinsed with distilled water to remove any contamination or dirt and were then dried at room temperature. Next, the leaves were milled, and fine powders of 112 µm size were obtained using a vibratory sieve shaker of Retsch AS 200 series.
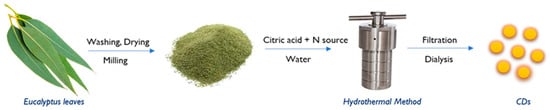
Figure 1.
Schematic representation of synthesis of CDs from eucalyptus leaves.
The optimum proportion of the reagents (eucalyptus power, citric acid and ethylenediamine) and experimental factors (temperature and time) to obtain the highest QY was obtained using a multivariate experimental design strategy with Unscramble Design v9.6 (CAMO Software AS, Oslo, Norway) using a sequence of designs.
The optimum experimental factors were as follows: 1 g of powdered eucalyptus leaves and 1 g of citric acid were added to 40 mL of distilled water, followed by the addition of 863 μL of ethylenediamine. The pH was adjusted to 9.5, and the mixture was transferred into a stainless-steel autoclave and kept in a hot air oven at 180 °C for 24 h. As a result, a dark brown solution was obtained. After that, it was centrifuged at 6000 rpm for 30 min to remove larger particles and non-fluorescent particles. A clear brown-colored solution was collected and filtered using 0.45 μm membrane filter paper. The product was purified by using dialysis bags of MWCO 1000 Da for about 48 h. The purified CDs obtained were then lyophilized in a freeze dryer for 48 h to produce a brownish powder form and were stored at 4 °C. The average synthesis yield was calculated to be 1.95% by considering the final weight of the powder obtained relative to the initial weight of the precursor(s) used in a powder form.
2.4. Quantum Yield Measurements
The fluorescence quantum yield (QY) was calculated by comparing the integrated luminescence intensities and absorbance values of the synthesized CDs with the known substance, quinine sulfate, with the following equation [18,43]:
where Grad is the gradient from the plot of the integrated fluorescence intensity versus the absorbance and the refractive index. Quinine sulfate was chosen as a reference fluorophore of a known quantum yield (QY = 0.54) [35].
2.5. Environmental Impact Assessment
The environmental impact assessment associated with the synthesis of CDs was based on inventory data from laboratory-scale synthesis procedures described in Section 2.3. The life cycle inventory data for the foreground system of the synthesis procedure consist of different processes and chemicals included in this study, and they were modeled with the following data present in the Ecoinvent® 3.5 database (Zurich, Switzerland) as described in Table 1, where GLO stands for global, RER for regional market for Europe, and PT for Portugal. Unlike commercial reagents, electricity produced and treated water, biomass was added in the simulation model as ‘input from nature’ without considering various factors like processing, transportation, etc. As leaves are naturally occurring residues from eucalyptus trees, they are considered to have negligible or no environmental impacts. The objective here was to use biomass as an effort to reduce the amount of commercial reagent. So, our focus was on assessing the environmental impacts associated with lowering the amount of citric acid used.

Table 1.
Data inventory used from Ecoinvent® 3.5 database.
The present LCA study is based on a cradle-to-gate approach, from the production of precursor materials to the fabrication of CDs. ReCiPe2016 is a widely used life cycle impact assessment method, of which the environmental model refers to the global scale [44]. The individualistic (I), the Hierarchist (H) and the Egalitarian (E) are the three perspectives included in ReCiPe2016, out of which the Hierarchist is a more realistic approach based on scientific consensus with regard to the time frame and plausibility of impact mechanisms [45]. The midpoint-level characterization has a strong relation to the environmental flows and low parameter uncertainty [46]. Environmental impacts were modeled in this study using the Hierarchist version of the ReCiPe2016 v1.1 midpoint method. The impact potentials evaluated according to the ReCiPe2016 midpoint method were as follows: global warming (GW), stratospheric ozone depletion (SOD), ionizing radiation (IR), ozone formation–human health (OF–HH), fine particulate matter formation (FPM), ozone formation–terrestrial ecosystem (OF–TE), terrestrial acidification (TA), freshwater eutrophication (FE), marine eutrophication (ME), terrestrial ecotoxicity (TET), freshwater ecotoxicity (FET), marine ecotoxicity (MET), human carcinogenic toxicity (HCT), human non-carcinogenic toxicity (HNCT), land use (LU), mineral resource scarcity (MRS), fossil resource scarcity (FRS) and water consumption (WC). The LCA study was performed by using SimaPro9 software.
3. Results and Discussion
3.1. Surface Morphology
HRTEM measurements were performed to study the morphology of CDs and especially to ensure that the particles were indeed nanosized. Figure 2a shows spherical-shaped CDs with some possible agglomeration. The average particle size was measured to be 6.33 ± 1.34 nm. In Figure 2b, the Fast Fourier Transform (FFT) and the Inverse FFT (IFFT) patterns of the region of interest indicate the crystalline nature of CDs. The interplanar spacing of the lattice fringes was found to be 0.234 nm, which is close to the (100) planes of graphite lattice [47].
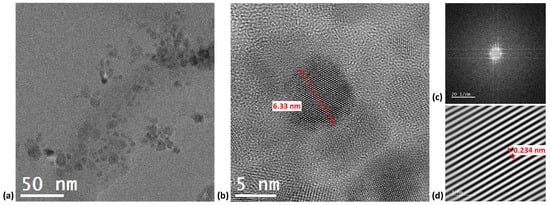
Figure 2.
TEM images of CDs at (a) low resolution and (b) high resolution (c) FFT and (d) IFFT images.
Figure 3a shows the AFM image of the CDs, and the average particle size was determined to be 6 ± 2 nm, which is in agreement with the HRTEM results. FTIR spectroscopy was used to analyze the surface functional groups present in the CDs. As evident from the spectrum in Figure 3b, the broad characteristic peak around 3232 cm−1 refers to the stretching vibrations of N–H or O–H bonds. The absorbance band at 2927 cm−1 indicates the C–H stretching vibration [30]. The sharp peaks at 1555 cm−1 and 1384 cm−1 correspond to the stretching vibrations of the COO− and C–H groups, respectively [48]. The aliphatic C–N stretching vibration is ascribed to the peak at 1264 cm−1. The absorption bands ranging from 1200 to 1000 cm−1 can be attributed to the C–O–C groups. The N–H deformation vibration is observed at 831 cm−1 [49]. The FTIR signals demonstrate that CDs have hydrophilic functional groups (hydroxyl, amino and carboxyl groups) that promote water solubility and fluorescence of the synthesized CDs [50]. Figure 3c shows the 1H-NMR spectrum of CDs. Deuterium oxide (D2O) was used as the solvent. The following chemical shift (δ) regions were found in the 1H-NMR spectrum: 1–3 ppm (for sp3 C–H protons), 3–6 ppm (for the protons attached with hydroxyl, ether and carbonyl groups) and 6–9 ppm (for amide protons) [51,52].
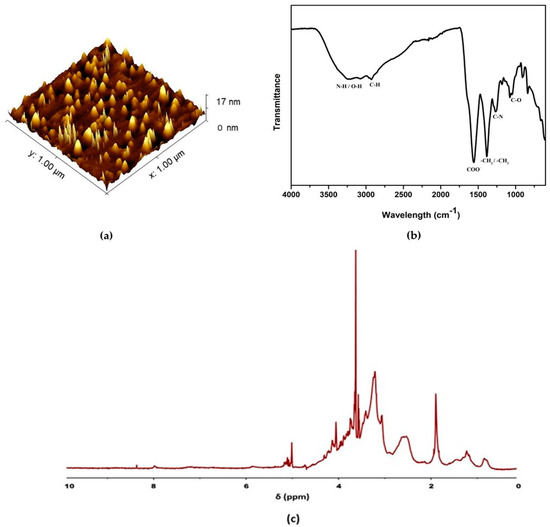
Figure 3.
(a) AFM image of CDs; (b) FTIR spectra of CDs; (c) 1H−NMR spectra of CDs.
To study the surface composition and electronic states of the elements present in CDs, XPS analysis was carried out, and the results are shown in Figure 4a. It shows three major peaks of C 1s, N 1s and O 1s at 285, 400 and 532.4 eV, respectively. Si 2s and Si 2p peaks were also present due to the most common silica contamination and hence were not taken into account for detailed analysis. The contents of C, N and O (in %) were 67.3, 10.7 and 22%, respectively.
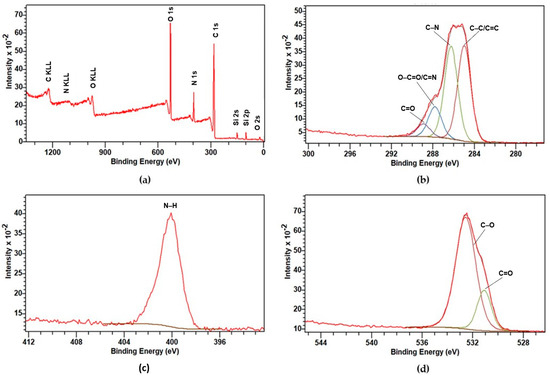
Figure 4.
XPS: (a) Full survey spectrum of CDs; High-resolution XPS spectra of (b) C 1s, (c) N 1s and (d) O 1s.
A detailed analysis was performed for C 1s, O 1s and N 1s for deconvolution, chemical state and quantitative analysis. The C 1s spectrum displays four distinct peaks at 284.9 eV (41.25%), 286.2 eV (40.01%), 287.8 eV (13.23%) and 288.9 eV (5.51%), as shown in Figure 4b. These peaks can be attributed to a C–C/C=C bond (284.9 eV), C–N bond (286.2 eV), O–C=O/C=N bond (287.8 eV) and C=O bond (288.9 eV), respectively [53,54]. As given in Figure 4c, the N 1s core-level spectrum shows only one peak at 400 eV, which can be ascribed to the N–H group [54]. The deconvolution of the O 1s spectrum shown in Figure 4d yielded a major peak at 532.5 eV (79.56%) due to C–O linkage, with a relatively small contribution at 531 eV (20.44%) representing a C=O functional group [55]. The results are in good agreement with the FTIR results.
The XRD spectrum in Figure 5a reveals a weak broad peak around 2Ɵ = 24°, corresponding to a (002) hkl plane (JCPDS card no. 26-1076). The interplanar distance (002) was calculated to be 0.37 nm, which is slightly higher than the graphitic interlayer spacing (0.34 nm) [56]. This indicates weak graphitic crystallinity [57]. This partial amorphous nature can be attributed to the functional groups’ presence on the surface of the CDs [58].
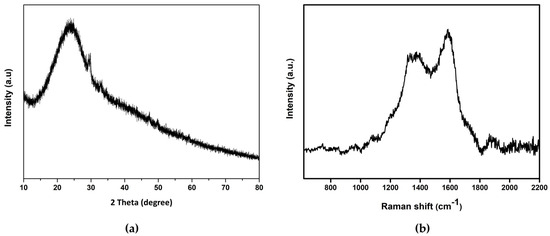
Figure 5.
(a) XRD spectrum of CDs; (b) Raman spectrum of CDs.
The Raman spectrum given in Figure 5b shows two broad peaks at 1367 cm−1 and 1585 cm−1, which can be assigned to the D (disorder) and G (graphite) bands, respectively. The D band corresponds the vibrations of carbon atoms with dangling bonds in the termination plane of disordered graphite or glassy carbon. The G band represents the E2g mode of graphite and the vibration of sp2 bonded carbon atoms in a two-dimensional hexagonal lattice. The higher intensity of the G band compared to the D band indicates that the CDs are principally composed of sp2 graphitic carbon with some sp3 carbon defects [59,60].
3.2. Optical Properties
The UV–Vis absorption spectrum of CD in Figure 6a reveals two absorption bands. The peak at 285 nm is due to the π−π* transition of C=C bonds in the sp2 hybridized domain of the graphitic core, which do not usually generate fluorescence [61,62]. However, the peak at 345 nm is attributed to the n−π* transition of C=O, C–N or C–OH bonds in the sp3 hybridized domains, which can be originated from carboxyl (–COOH) or amine (–NH2) groups existing on the surface of CDs [63]. The fluorescence of CDs upon UV irradiation at 365 nm is represented in Figure 6b. Bright blue luminescence was observed under the illumination of UV light (365 nm).
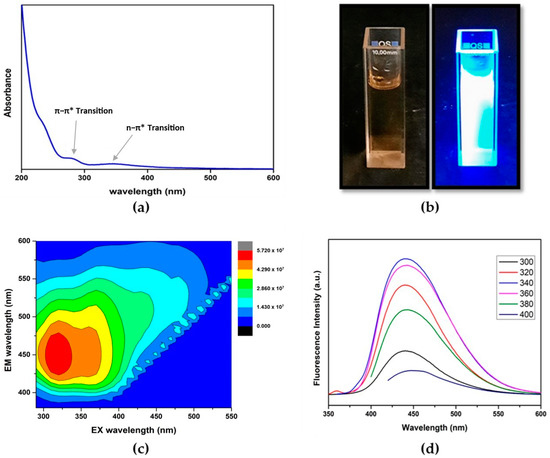
Figure 6.
(a) UV–visible spectrum of CDs in aqueous solution; (b) CDs in aqueous solution before and after UV irradiation; (c) 2D excitation (EX)–emission (EM) contour plot; (d) Excitation-independent emission fluorescence spectra of CDs in aqueous solution.
The optical properties of the CDs were further studied using fluorescence spectrometry. From the fluorescence 2D contour plot of CDs in Figure 6c, the maximum excitation and emission wavelength of CDs were found to be around 320 nm and 445 nm, respectively. As indicated in Figure 6d, the CDs clearly show excitation-independent emission throughout the range of 300–400 nm. Usually, excitation-dependent fluorescent behaviors of CDs reflect effects from (i) particles of different sizes in the sample and/or (ii) a distribution of different surface states [64]. However, more recent studies have reported that inadequate sample purification can be a cause for the incomplete removal of low-molecular-weight organic fluorophores, the presence of which can give rise to excitation-dependent emission [65]. Therefore, the excitation-independent behavior of the CDs suggests the absence of organic impurities due to proper purification during the synthesis of CDs, ensured by combining multiple purification methods including centrifugation, filtration and membrane dialysis. Using quinine sulfate as a reference (QY = 54%, λex = 350 nm), the relative quantum yield (QY) of CDs was measured to be 60.7%. Compared to the QY ranging from 8.5 to 31.7% for the reported CDs derived from other biomass sources given in Table 2, eucalyptus CDs have a relatively high QY of 60.7%.
Table 2.
Synthesis methods, conditions, quantum yields, maximum excitation and emission wavelengths of various biomass-derived CDs.
The fluorescence lifetime analysis spectrum of CDs given in Figure 7 was obtained using biexponential fitting. The lifetime decay of CDs fits (with a χ2 = 1.24) the two-fluorophores model, giving average lifetimes of 4.29 ± 0.2 ns and 15.12 ± 0.02 ns with the pre-exponential factors A = 11.36 ± 0.2, B1 = 7.41 × 10⁻³ ± 8 × 10⁻⁵ and B2 = 3.52 × 10⁻² ± 3 × 10⁻⁵.
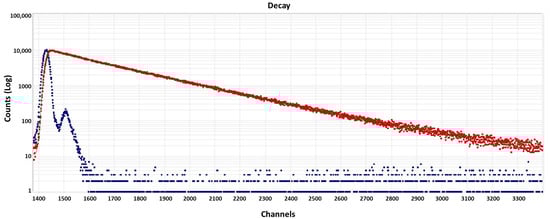
Figure 7.
Fluorescence lifetime analysis spectra of CDs (red dote denote sample decay and blue dots denote the blank).
3.3. Life Cycle Assessment
The LCA study was carried out to understand the environmental impacts of the hydrothermal synthesis under study using a weight-based functional unit of 1 kg of CDs. The Hierarchist version of the ReCiPe2016 midpoint method was followed, and the results obtained are shown in Figure 8. The objective of this study was to make qualitative appreciations of the environmental impacts of each material input by comparing the contributions to the different impact categories of the input involved in this synthesis.
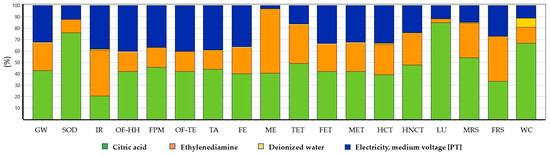
Figure 8.
Environmental impact analysis of CDs with the ReCiPe2016 midpoint (H) method. Abbreviations are explained in Section 2.5.
From the analysis, it is evident that citric acid is a resource with major contributions (between 20 and 85%) when compared to other resources in almost all environmental impact categories. The contribution of citric acid is much higher in the categories of land use (85%) and stratospheric ozone depletion (76.2%). The only exceptions are the categories of ionizing radiation, marine eutrophication and fossil resource scarcity, where ethylenediamine is the major contributor with 40%, 56.9% and 39.4%, respectively. After ethylenediamine, electricity is another important resource with significant contributions up to 40.6% in most categories, except marine eutrophication (2.79%). However, deionized water does not have any relevant environmental impact in comparison with the other resources, even in the categories related to water consumption.
In general, the carbon precursor used for the bottom-up synthesis of CDs, being the main hotspot with higher associated environmental impacts, followed by electricity being another significant contributing parameter, is in line with the existing literature [38,39].
Based on the results of the LCA, citric acid is a major hotspot in most of the environmental impact categories evaluated in this study. It can be deduced that a more sustainable route was adopted for the synthesis of CDs by using biomass as a precursor, as it reduced the amount of citric acid used. Otherwise, the environmental impacts would have been significantly higher, doubling the amount used for the main hotspot.
However, it is also important to evaluate the possible reduction in the environmental impacts using biomass in the synthesis of CDs. For this, a simulation model was created for CDs synthesized via the elimination of eucalyptus leaves, where the amount of citric acid was doubled in comparison with the synthesis method of CDs reported in this study. All eighteen impact categories were analyzed to compare the environmental impacts caused by CDs synthesized with and without biomass, as given in Figure 9. It clearly demonstrates that the environmental impacts associated with the use of leaves as a co-precursor are just, on average, 69% of those associated with CDs produced only from citric acid for the different impact categories. The environmental impact contribution from biomass-based CDs was only 54% and 57% of those with only citric acid, in the categories of land use and stratospheric ozone depletion, respectively. However, in the category of ionizing radiation, the environmental impacts of CDs with biomass were around 83% of those CDs without biomass.
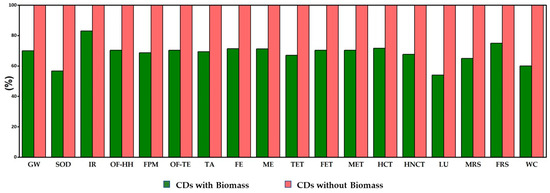
Figure 9.
Comparison of environmental impact analysis of hydrothermally synthesized CDs with and without biomass using the ReCiPe2016 midpoint (H) method. Abbreviations are explained in Section 2.5.
4. Conclusions
In summary, eucalyptus leaves prove to be a good candidate for the bioinspired preparation of carbon dots, with blue fluorescence and a high quantum yield. The preparation methods are easy and environmentally friendly. LCA studies also support the idea of the inclusion of biomass in the hydrothermal synthesis route adopted. The results show that a commercial carbon precursor, citric acid, is mainly responsible for environmental impacts, which can be reduced by 31% on average using eucalyptus leaves in the synthesis of CDs. A high quantum yield of around 60.7% was achieved. Since CDs exhibit good solubility in water and superior fluorescent properties, including a high quantum yield and excitation-independent emission, they can be potentially explored for various applications in the fields of biosensing [66], bioimaging [67], photocatalysis [68] and drug delivery [69] and in interesting opto-electronic domains like light-emitting devices using directional amplified photoluminescence [70].
Author Contributions
Conceptualization, C.M.P. and J.C.G.E.d.S.; methodology, A.J., L.P.d.S. and J.C.G.E.d.S.; software, A.J. and L.P.d.S.; validation, A.J., L.P.d.S. and J.C.G.E.d.S.; formal analysis, A.J.; investigation, A.J., C.M.P. and J.C.G.E.d.S.; resources, A.J., C.M.P. and J.C.G.E.d.S.; writing—original draft preparation, A.J. and J.C.G.E.d.S.; writing—review and editing, A.J., L.P.d.S., C.M.P. and J.C.G.E.d.S.; supervision, C.M.P. and J.C.G.E.d.S.; project administration, J.C.G.E.d.S.; funding acquisition, C.M.P. and J.C.G.E.d.S. All authors have read and agreed to the published version of the manuscript.
Funding
This research was funded by ‘Fundação para a Ciência e Tecnologia’ (FCT), Portugal, grant number UI/BD/151340/2021. We also acknowledge FCT for funding the R&D Unit CIQUP (UIDB/000081/2020 and UIDP/00081/2020), the Associated Laboratory IMS (LA/P/0056/2020) and L.P.S. (CEECINST/00069/2021).
Data Availability Statement
No new data were created or analyzed in this study. Data sharing is not applicable to this article.
Acknowledgments
The authors wish to acknowledge Joaquim Agostinho Moreira’s group from the Institute of Physics for Advanced Materials, Nanotechnology and Photonics (IFIMUP), Physics and Astronomy Department, FCUP (Porto, Portugal), for allowing the use of their excellent Raman facility (Renishaw spectrometer).
Conflicts of Interest
The authors declare no conflict of interest.
References
- Xu, X.; Ray, R.; Gu, Y.; Ploehn, H.J.; Gearheart, L.; Raker, K.; Scrivens, W.A. Electrophoretic Analysis and Purification of Fluorescent Single-Walled Carbon Nanotube Fragments. J. Am. Chem. Soc. 2004, 126, 12736–12737. [Google Scholar] [CrossRef] [PubMed]
- Sun, Y.-P.; Zhou, B.; Lin, Y.; Wang, W.; Fernando, K.S.; Pathak, P.; Meziani, M.J.; Harruff, B.A.; Wang, X.; Wang, H. Quantum-Sized Carbon Dots for Bright and Colorful Photoluminescence. J. Am. Chem. Soc. 2006, 128, 7756–7757. [Google Scholar] [CrossRef] [PubMed]
- Kang, C.; Huang, Y.; Yang, H.; Yan, X.F.; Chen, Z.P. A Review of Carbon Dots Produced from Biomass Wastes. Nanomaterials 2020, 10, 2316. [Google Scholar] [CrossRef] [PubMed]
- da Silva, J.C.E.; Gonçalves, H.M.R. Analytical and bioanalytical applications of carbon dots. TrAC Trends Anal. Chem. 2011, 30, 1327–1336. [Google Scholar] [CrossRef]
- Reyes, D.; Camacho, M.; Camacho, M.; Mayorga, M.; Weathers, D.; Salamo, G.; Wang, Z.; Neogi, A. Laser Ablated Carbon Nanodots for Light Emission. Nanoscale Res. Lett. 2016, 11, 424. [Google Scholar] [CrossRef] [PubMed]
- Hou, Y.; Lu, Q.; Deng, J.; Li, H.; Zhang, Y. One-pot electrochemical synthesis of functionalized fluorescent carbon dots and their selective sensing for mercury ion. Anal. Chim. Acta 2015, 866, 69–74. [Google Scholar] [CrossRef]
- Qiao, Z.-A.; Wang, Y.; Gao, Y.; Li, H.; Dai, T.; Liu, Y.; Huo, Q. Commercially activated carbon as the source for producing multicolor photoluminescent carbon dots by chemical oxidation. Chem. Commun. 2009, 46, 8812–8814. [Google Scholar] [CrossRef]
- Qu, K.; Wang, J.; Ren, J.; Qu, X. Carbon Dots Prepared by Hydrothermal Treatment of Dopamine as an Effective Fluorescent Sensing Platform for the Label-Free Detection of Iron(III) Ions and Dopamine. Chem. A Eur. J. 2013, 19, 7243–7249. [Google Scholar] [CrossRef]
- Wang, X.; Qu, K.; Xu, B.; Ren, J.; Qu, X. Microwave assisted one-step green synthesis of cell-permeable multicolor photoluminescent carbon dots without surface passivation reagents. J. Mater. Chem. 2011, 21, 2445–2450. [Google Scholar] [CrossRef]
- Lu, Z.; Su, T.; Feng, Y.; Jiang, S.; Zhou, C.; Hong, P.; Sun, S.; Li, C. Potential Application of Nitrogen-Doped Carbon Quantum Dots Synthesized by a Solvothermal Method for Detecting Silver Ions in Food Packaging. Int. J. Environ. Res. Public Health 2019, 16, 2518. [Google Scholar] [CrossRef]
- Qin, J.; Zhang, L.; Yang, R. Solid pyrolysis synthesis of excitation-independent emission carbon dots and its application to isoniazid detection. J. Nanopart. Res. 2019, 21, 59. [Google Scholar] [CrossRef]
- Ozyurt, D.; Al Kobaisi, M.; Hocking, R.K.; Fox, B. Properties, Synthesis, and Applications of Carbon Dots: A Review. Carbon Trends 2023, 12, 100276. [Google Scholar] [CrossRef]
- Issa, M.A.; Abidin, Z.Z.; Sobri, S.; Rashid, S.; Mahdi, M.A.; Ibrahim, N.A.; Pudza, M.Y. Facile Synthesis of Nitrogen-Doped Carbon Dots from Lignocellulosic Waste. Nanomaterials 2019, 9, 1500. [Google Scholar] [CrossRef] [PubMed]
- Atchudan, R.; Edison, T.N.J.I.; Shanmugam, M.; Perumal, S.; Somanathan, T.; Lee, Y.R. Sustainable synthesis of carbon quantum dots from banana peel waste using hydrothermal process for in vivo bioimaging. Phys. E Low-Dimens. Syst. Nanostruct. 2020, 126, 114417. [Google Scholar] [CrossRef]
- John, T.S.; Yadav, P.K.; Kumar, D.; Singh, S.K.; Hasan, S.H. Highly fluorescent carbon dots from wheat bran as a novel drug delivery system for bacterial inhibition. Luminescence 2020, 35, 913–923. [Google Scholar] [CrossRef] [PubMed]
- Achilleos, D.S.; Kasap, H.; Reisner, E. Photocatalytic hydrogen generation coupled to pollutant utilisation using carbon dots produced from biomass. Green Chem. 2020, 22, 2831–2839. [Google Scholar] [CrossRef]
- Hosseini Koupaie, E.; Dahadha, S.; Bazyar Lakeh, A.A.; Azizi, A.; Elbeshbishy, E. Enzymatic pretreatment of lignocellulosic biomass for enhanced biomethane production—A review. J. Environ. Manag. 2019, 233, 774–784. [Google Scholar] [CrossRef]
- Crista, D.M.A.; El Mragui, A.; Algarra, M.; Esteves Da Silva, J.C.G.; Luque, R.; Pinto Da Silva, L. Turning Spent Coffee Grounds into Sustainable Precursors for the Fabrication of Carbon Dots. Nanomaterials 2020, 10, 1209. [Google Scholar] [CrossRef]
- Hu, Z.; Jiao, X.-Y.; Xu, L. The N,S co-doped carbon dots with excellent luminescent properties from green tea leaf residue and its sensing of gefitinib. Microchem. J. 2019, 154, 104588. [Google Scholar] [CrossRef]
- Bhamore, J.R.; Jha, S.; Singhal, R.K.; Park, T.J.; Kailasa, S.K. Facile green synthesis of carbon dots from Pyrus pyrifolia fruit for assaying of Al3+ ion via chelation enhanced fluorescence mechanism. J. Mol. Liq. 2018, 264, 9–16. [Google Scholar] [CrossRef]
- Pooja, D.; Singh, L.; Thakur, A.; Kumar, P. Green synthesis of glowing carbon dots from Carica papaya waste pulp and their application as a label-freechemo probe for chromium detection in water. Sens. Actuators B Chem. 2019, 283, 363–372. [Google Scholar] [CrossRef]
- Atchudan, R.; Edison, T.N.J.I.; Perumal, S.; Muthuchamy, N.; Lee, Y.R. Hydrophilic nitrogen-doped carbon dots from biowaste using dwarf banana peel for environmental and biological applications. Fuel 2020, 275, 117821. [Google Scholar] [CrossRef]
- Cheng, C.; Xing, M.; Wu, Q. A universal facile synthesis of nitrogen and sulfur co-doped carbon dots from cellulose-based biowaste for fluorescent detection of Fe3+ ions and intracellular bioimaging. Mater. Sci. Eng. C 2019, 99, 611–619. [Google Scholar] [CrossRef] [PubMed]
- Atchudan, R.; Edison, T.N.J.I.; Chakradhar, D.; Perumal, S.; Shim, J.-J.; Lee, Y.R. Facile green synthesis of nitrogen-doped carbon dots using Chionanthus retusus fruit extract and investigation of their suitability for metal ion sensing and biological applications. Sens. Actuators B Chem. 2017, 246, 497–509. [Google Scholar] [CrossRef]
- Yang, X.; Wang, D.; Luo, N.; Feng, M.; Peng, X.; Liao, X. Green synthesis of fluorescent N,S-carbon dots from bamboo leaf and the interaction with nitrophenol compounds. Spectrochim. Acta Part A Mol. Biomol. Spectrosc. 2020, 239, 118462. [Google Scholar] [CrossRef]
- Li, Z.; Zhang, Y.; Niu, Q.; Mou, M.; Wu, Y.; Liu, X.; Yan, Z.; Liao, S. A fluorescence probe based on the nitrogen-doped carbon dots prepared from orange juice for detecting Hg2+ in water. J. Lumin. 2017, 187, 274–280. [Google Scholar] [CrossRef]
- Senol, A.M.; Bozkurt, E. Facile green and one-pot synthesis of seville orange derived carbon dots as a fluorescent sensor for Fe3+ ions. Microchem. J. 2020, 159, 105357. [Google Scholar] [CrossRef]
- Man, Y.; Li, Z.; Kong, W.-L.; Li, W.; Dong, W.; Wang, Y.; Xie, F.; Zhao, D.; Qu, Q.; Zou, W.-S. Starch fermentation wastewater as a precursor to prepare S,N-doped carbon dots for selective Fe(III) detection and carbon microspheres for solution decolorization. Microchem. J. 2020, 159, 105338. [Google Scholar] [CrossRef]
- Jiao, X.-Y.; Li, L.-S.; Qin, S.; Zhang, Y.; Huang, K.; Xu, L. The synthesis of fluorescent carbon dots from mango peel and their multiple applications. Colloids Surf. A Physicochem. Eng. Asp. 2019, 577, 306–314. [Google Scholar] [CrossRef]
- Haghani, S.K.; Ensafi, A.A.; Kazemifard, N.; Rezaei, B. A Sensitive and Selective Optical Sensor Based on Molecularly Imprinting Technique Using Green Synthesized Carbon Dots for Determination of Trace Amount of Metronidazole. IEEE Sens. J. 2020, 20, 7. [Google Scholar] [CrossRef]
- Águas, A.; Ferreira, A.; Maia, P.; Fernandes, P.M.; Roxo, L.; Keizer, J.; Silva, J.S.; Rego, F.C.; Moreira, F. Natural establishment of Eucalyptus globulus Labill. in burnt stands in Portugal. For. Ecol. Manag. 2014, 323, 47–56. [Google Scholar] [CrossRef]
- Sebei, K.; Sakouhi, F.; Herchi, W.; Khouja, M.; Boukhchina, S. Chemical composition and antibacterial activities of seven Eucalyptus species essential oils leaves. Biol. Res. 2015, 48, 7. [Google Scholar] [CrossRef] [PubMed]
- Kasprzyk, W.; Świergosz, T.; Bednarz, S.; Walas, K.; Bashmakova, N.V.; Bogdał, D. Luminescence phenomena of carbon dots derived from citric acid and urea—A molecular insight. Nanoscale 2018, 10, 13889–13894. [Google Scholar] [CrossRef] [PubMed]
- Sendão, R.M.S.; Crista, D.M.A.; Afonso, A.C.P.; Martinez de Yuso, M.D.V.; Algarra, M.; Esteves da Silva, J.C.G.; Pinto da Silva, L.P. Insight into the hybrid luminescence showed by carbon dots and molecular fluorophores in solution. Phys. Chem. Chem. Phys. 2019, 21, 20919–20926. [Google Scholar] [CrossRef] [PubMed]
- Christé, S.; Esteves da Silva, J.C.; Pinto da Silva, L. Evaluation of the Environmental Impact and Efficiency of N-Doping Strategies in the Synthesis of Carbon Dots. Materials 2020, 13, 504. [Google Scholar] [CrossRef] [PubMed]
- Ayres, R.U.; de Constance, B.; Cede, F. Life Cycle Analysis: A Critique; Elsevier: Amsterdam, The Netherlands, 1995. [Google Scholar]
- Fernandes, S.; da Silva, J.C.G.E.; da Silva, L.P. Life Cycle Assessment-Based Comparative Study between High-Yield and “Standard” Bottom-Up Procedures for the Fabrication of Carbon Dots. Materials 2022, 15, 3446. [Google Scholar] [CrossRef] [PubMed]
- Fernandes, S.; da Silva, J.C.E.; da Silva, L.P. Comparative life cycle assessment of high-yield synthesis routes for carbon dots. NanoImpact 2021, 23, 100332. [Google Scholar] [CrossRef]
- Sendão, R.; Yuso, M.D.V.M.D.; Algarra, M.; da Silva, J.E.; da Silva, L.P. Comparative life cycle assessment of bottom-up synthesis routes for carbon dots derived from citric acid and urea. J. Clean. Prod. 2020, 254, 120080. [Google Scholar] [CrossRef]
- Borghesi, G.; Stefanini, R.; Vignali, G. Life cycle assessment of packaged organic dairy product: A comparison of different methods for the environmental assessment of alternative scenarios. J. Food Eng. 2022, 318, 110902. [Google Scholar] [CrossRef]
- Vega, M.; Llantoy, N.; Chafer, M.; Ushak, S.; Cabeza, L.F. Life cycle assessment of the inclusion of phase change materials in lightweight buildings. J. Energy Storage 2022, 56, 105903. [Google Scholar] [CrossRef]
- Mostafaei, H.; Keshavarz, Z.; Rostampour, M.A.; Mostofinejad, D.; Wu, C. Sustainability Evaluation of a Concrete Gravity Dam: Life Cycle Assessment, Carbon Footprint Analysis, and Life Cycle Costing. Structures 2023, 53, 279–295. [Google Scholar] [CrossRef]
- Williams, A.T.R.; Winfield, S.A.; Miller, J.N. Relative fluorescence quantum yields using a computer-controlled luminescence spectrometer. Analyst 1983, 108, 1067–1071. [Google Scholar] [CrossRef]
- Huijbregts, M.A.J.; Steinmann, Z.J.N.; Elshout, P.M.F.; Stam, G.; Verones, F.; Vieira, M.; Zijp, M.; Hollander, A.; van Zelm, R. ReCiPe2016: A harmonised life cycle impact assessment method at midpoint and endpoint level. Int. J. Life Cycle Assess 2017, 22, 138–147. [Google Scholar] [CrossRef]
- Huijbregts, M.A.J.; Steinmann, Z.J.; Elshout, P.M.; Stam, G.; Verones, F.; Vieira, M.D.; Hollander, A.; Zijp, M.; van Zelm, R. ReCiPe2016 v1.1 A Harmonized Life Cycle Impact Assessment Method at Midpoint and 501 Endpoint Level, Report I: Characterization, RIVM Report 2016-0104a; National Institute for Human Health and the 502 Environment: Debilt, The Netherlands, 2016.
- Hauschild, M.Z.; Huijbregts, M.A.J. Introducing Life Cycle Impact Assessment. In Life Cycle Impact Assessment; Hauschild, M.Z., Huijbregts, M.A.J., Eds.; In LCA Compendium—The Complete World of Life Cycle Assessment; Springer: Dordrecht, The Netherlands, 2015; pp. 1–16. [Google Scholar] [CrossRef]
- Tomskaya, A.; Asanov, I.P.; Yushina, I.; Rakhmanova, M.I.; Smagulova, S. Optical Properties of Tricarboxylic Acid-Derived Carbon Dots. ACS Omega 2022, 7, 44093–44102. [Google Scholar] [CrossRef]
- Long, Y.-M.; Zhou, C.-H.; Zhang, Z.-L.; Tian, Z.-Q.; Lin, Y.; Pang, D.-W. Shifting and non-shifting fluorescence emitted by carbon nanodots. J. Mater. Chem. 2012, 22, 5917–5920. [Google Scholar] [CrossRef]
- Wang, K.; Geng, C.; Wang, F.; Zhao, Y.; Ru, Z. Urea-doped carbon dots as fluorescent switches for the selective detection of iodide ions and their mechanistic study. RSC Adv. 2021, 11, 27645–27652. [Google Scholar] [CrossRef]
- Liu, Y. Green preparation of carbon dots from Momordica charantia L. for rapid and effective sensing of p-aminoazobenzene in environmental samples. Environ. Res. 2021, 198, 111279. [Google Scholar] [CrossRef]
- Sharma, N.; Sharma, I.; Bera, M.K. Microwave-Assisted Green Synthesis of Carbon Quantum Dots Derived from Calotropis Gigantea as a Fluorescent Probe for Bioimaging. J. Fluoresc. 2022, 32, 1039–1049. [Google Scholar] [CrossRef]
- Mintz, K.J.; Bartoli, M.; Rovere, M.; Zhou, Y.; Hettiarachchi, S.D.; Paudyal, S.; Chen, J.; Domena, J.B.; Liyanage, P.Y.; Sampson, R.; et al. A deep investigation into the structure of carbon dots. Carbon 2021, 173, 433–447. [Google Scholar] [CrossRef]
- Gao, X.; Wang, L.; Sun, C.; Zhou, N. Research on Preparation Methods of Carbon Nanomaterials Based on Self-Assembly of Carbon Quantum Dots. Molecules 2022, 27, 1690. [Google Scholar] [CrossRef]
- Tiwari, A.; Walia, S.; Sharma, S.; Chauhan, S.; Kumar, M.; Gadly, T.; Randhawa, J.K. High quantum yield carbon dots and nitrogen-doped carbon dots as fluorescent probes for spectroscopic dopamine detection in human serum. J. Mater. Chem. B 2023, 11, 1029–1043. [Google Scholar] [CrossRef] [PubMed]
- Padasalagi, A.B.; Rabinal, M.H.K. Controlled Emission of Carbon Quantum Dots Derived from Waste Silk Sericin. Part. Part. Syst. Charact. 2022, 39, 2200041. [Google Scholar] [CrossRef]
- Shaikh, A.F.; Tamboli, M.S.; Patil, R.H.; Bhan, A.; Ambekar, J.D.; Kale, B.B. Bioinspired Carbon Quantum Dots: An Antibiofilm Agents. J. Nanosci. Nanotechnol. 2019, 19, 2339–2345. [Google Scholar] [CrossRef] [PubMed]
- Özbek, N.; Çekirge, E.; Ocak, M.; Ocak, Ü.T. Highly Blue-fluorescent Carbon Quantum Dots Obtained from Medlar Seed for Hg2+ Determination in Real Water Samples. J. Fluoresc. 2023. [Google Scholar] [CrossRef] [PubMed]
- Zhang, J.-H.; Niu, A.; Li, J.; Fu, J.-W.; Xu, Q.; Pei, D.-S. In vivo characterization of hair and skin derived carbon quantum dots with high quantum yield as long-term bioprobes in zebrafish. Sci. Rep. 2016, 6, 37860. [Google Scholar] [CrossRef] [PubMed]
- Ferrari, A.C.; Robertson, J. Interpretation of Raman spectra of disordered and amorphous carbon. Phys. Rev. B 2000, 61, 14095–14107. [Google Scholar] [CrossRef]
- Liu, Y.-Y.; Yu, N.-Y.; Fang, W.-D.; Tan, Q.-G.; Ji, R.; Yang, L.-Y.; Wei, S.; Zhang, X.-W.; Miao, A.-J. Photodegradation of carbon dots cause cytotoxicity. Nat. Commun. 2021, 12, 812. [Google Scholar] [CrossRef]
- Dong, Y.; Pang, H.; Bin Yang, H.; Guo, C.; Shao, J.; Chi, Y.; Li, C.M.; Yu, T. Carbon-Based Dots Co-doped with Nitrogen and Sulfur for High Quantum Yield and Excitation-Independent Emission. Angew. Chem. Int. Ed. 2013, 52, 7800–7804. [Google Scholar] [CrossRef]
- Zhang, Y.; Cui, P.; Zhang, F.; Feng, X.; Wang, Y.; Yang, Y.; Liu, X. Fluorescent probes for “off–on” highly sensitive detection of Hg2+ and L-cysteine based on nitrogen-doped carbon dots. Talanta 2016, 152, 288–300. [Google Scholar] [CrossRef]
- Emam, A.N. Cyto-toxicity, biocompatibility and cellular response of carbon dots–plasmonic based nano-hybrids for bioimaging. RSC Adv. 2017, 7, 23502–23514. [Google Scholar] [CrossRef]
- Li, Y.; Chen, J.; Wang, Y.; Li, H.; Yin, J.; Li, M.; Wang, L.; Sun, H.; Chen, L. Large-scale direct pyrolysis synthesis of excitation-independent carbon dots and analysis of ferric (III) ion sensing mechanism. Appl. Surf. Sci. 2020, 538, 148151. [Google Scholar] [CrossRef]
- Mishra, K.; Barai, M.; Ghosh, S. Roles of Impurity and Sample Heterogeneity in Intriguing Photoluminescence Properties of Zero-Dimensional (0D) Carbonaceous Materials. J. Phys. Chem. C 2022, 126, 16905–16918. [Google Scholar] [CrossRef]
- Xu, Q.; Xiao, F.; Xu, H. Green-derived carbon dots: A potent tool for biosensing in food safety. In Critical Reviews in Food Science and Nutrition; Taylor & Francis: Abingdon, UK, 2023; pp. 1–18. [Google Scholar] [CrossRef]
- Ahmed, F.; Xu, W.; Hussain, M.M.; Khan, W.U.; Xiong, H. Bioimaging-guided discrimination of normal/cancer cells using Ag+-mediated red fluorescent carbon dots. Chem. Eng. J. 2023, 477, 147300. [Google Scholar] [CrossRef]
- Sendão, R.M.S.; da Silva, J.C.G.E.; da Silva, L.P. Applications of Fluorescent Carbon Dots as Photocatalysts: A Review. Catalysts 2023, 13, 179. [Google Scholar] [CrossRef]
- Qi, J.; Zhang, R.; Liu, X.; Liu, Y.; Zhang, Q.; Cheng, H.; Li, R.; Wang, L.; Wu, X.; Li, B. Carbon Dots as Advanced Drug-Delivery Nanoplatforms for Antiinflammatory, Antibacterial, and Anticancer Applications: A Review. ACS Appl. Nano Mater. 2023, 6, 9071–9084. [Google Scholar] [CrossRef]
- Aftenieva, O.; Brunner, J.; Adnan, M.; Sarkar, S.; Fery, A.; Vaynzof, Y.; König, T.A.F. Directional Amplified Photoluminescence through Large-Area Perovskite-Based Metasurfaces. ACS Nano 2023, 17, 2399–2410. [Google Scholar] [CrossRef]
Disclaimer/Publisher’s Note: The statements, opinions and data contained in all publications are solely those of the individual author(s) and contributor(s) and not of MDPI and/or the editor(s). MDPI and/or the editor(s) disclaim responsibility for any injury to people or property resulting from any ideas, methods, instructions or products referred to in the content. |
© 2024 by the authors. Licensee MDPI, Basel, Switzerland. This article is an open access article distributed under the terms and conditions of the Creative Commons Attribution (CC BY) license (https://creativecommons.org/licenses/by/4.0/).