Article

Environmental Impact Assessment of Plastic Waste Management Scenarios in the Canadian Context

1
5R Enabler Designs and Operations Inc. (5REDO), Kitchener, ON N2K 3C7, Canada
2
LaboNFC, Department of Economics and Administrative Sciences, University of Quebec at Chicoutimi, Saguenay, QC G7H 2B1, Canada
*
Author to whom correspondence should be addressed.
Environments 2023, 10(12), 213; https://doi.org/10.3390/environments10120213
Submission received: 7 September 2023 / Revised: 27 November 2023 / Accepted: 29 November 2023 / Published: 4 December 2023
(This article belongs to the Collection Trends and Innovations in Environmental Impact Assessment)

Abstract

:
Given the scale of plastic generation, its persistent presence in the environment, and the urgent need to transition to a net-zero emissions paradigm, managing plastic waste has gained increasing attention globally. Developing an effective strategy for plastic waste management requires a comprehensive assessment of the potential benefits offered by different solutions, particularly with respect to their environmental impact. This study employs the life cycle assessment (LCA) methodology to evaluate the environmental impact of two alternative scenarios to the As-Is scenario for managing plastic waste in the province of British Columbia in Canada. The LCA results suggest that the Zero Plastic Waste scenario, which heavily relies on chemical recycling, may not inherently result in a reduced environmental footprint across all impact categories. This is notable when the focus is solely on end-of-life treatment processes, without considering the produced products and energy. The Intermediate scenario reduces the amount of plastic waste sent to landfills by directing more end-of-life plastic to mechanical recycling facilities. This scenario provides immediate benefits for resource conservation, with a minimal increase in the environmental burden resulting from treatment processes. Nonetheless, achieving a net-zero transition requires combining traditional and emerging recycling technologies. The current study could offer some guidance to policymakers on strategies for fostering more sustainable management of plastic waste.

1. Introduction

In recent years, countries around the world have been formulating and implementing strategies to combat climate change and achieve net-zero greenhouse gas emissions [1]. These strategies are crucial in guiding policy decisions, shaping energy systems, and fostering sustainable development [2]. Several countries have set forth clear plans to address climate change, including Canada [3], the United States [4], the United Kingdom [5], China [6], European Union [7], and Japan [8]. Efforts to achieve net-zero targets are closely tied to the management of municipal waste, as this sector is a major contributor to greenhouse gas emissions and environmental degradation [9]. As plastic waste constitutes a substantial portion of global municipal solid waste (e.g., 13% in the United States and 8% in the European Union [10]), achieving sustainable plastic waste management practices can have a significant impact on mitigating climate change and conserving natural resources [11,12].
Plastic waste management involves various end-of-life treatment processes, including mechanical recycling, incineration for energy recovery, and landfilling [13]. In mechanical recycling, plastic waste is physically processed into granulates which can be used as raw material to produce new products. Compared with other materials such as ferrous metals (78%), paper (58%), and glass (90%) [14], the recycling rate of plastic waste is much lower globally (e.g., 10% in the USA [15]). Another treatment process is incineration in which plastic waste is burned at high temperatures and the released heat energy is harnessed and used for generating electricity or providing heat to industrial processes [16]. Around 24% of global plastic waste is managed via incineration [17]. Recently, there has been growing interest in chemical recycling methods to manage plastic waste [18]. Common processes include hydrolysis and pyrolysis, which break down plastic waste into valuable building blocks that can be used to produce fuels and plastics [19]. Despite all these traditional and advanced technologies and processes, an overwhelming majority of plastic waste is currently being landfilled or ending up unmanaged in the environment globally [17].
In Canada, plastic waste management has been unsustainable thus far, with only a small fraction being recycled or recovered [20]. In 2016, out of the 4667 kilotons of plastics introduced to the market, approximately 3268 kilotons were discarded as waste [20]. Only nine percent of those plastics were collected for recycling [21], while four percent were incinerated for energy recovery [20]. The majority, 86 percent, ended up in landfills, with around one percent lost to the environment through unmanaged dumps or leaks [20]. The current status underscores the urgent need to prioritize and enhance the sustainability of plastic waste management in Canada [22]. Since 2018, Canada’s federal, provincial, and territorial governments have adopted a zero-plastic waste agenda [23], aligning with similar global initiatives [24]. This agenda has served as a catalyst for developing strategies within the plastic waste management sector, aiming to steer the overall system towards a zero-plastic waste vision [20]. However, the effective design of a comprehensive strategy for plastic waste management necessitates a thorough evaluation of the potential offered by various solutions, especially in terms of their environmental impacts [25].
Life cycle assessment (LCA) provides a framework for evaluating the environmental impacts of a waste management system [26,27]. While LCA has its own standardized methodology, it has also inspired the development of other environmental assessment systems, such as the Product Environmental Footprint (PEF) [28], Environmental Product Declaration (EPD) [29], and social life cycle assessment (SLCA) [30]. Conducting an LCA of a system involves gathering data on energy consumption, material inputs and outputs, emissions, waste generation, and other relevant parameters. These data are subsequently utilized to calculate a range of environmental impact indicators using standardized methods [31]. The potential of LCA leads to the emergence of some interesting questions, namely: How can LCA be used to evaluate the environmental impacts of a waste management system? What are the results of a comparative analysis of different scenarios and strategies for managing plastic waste? What are the implications of the findings for waste managers and policymakers in developing sustainable plastic waste management strategies?
This study aims at assessing the environmental impact of a waste management system using Life Cycle Assessment (LCA) as the evaluation tool. Numerous studies have employed LCA to quantify impacts and compare various scenarios related to plastic waste management at national, regional, or municipal levels [31,32,33,34,35,36]. To the best of our knowledge, our study is the first to build on the data in the Canadian context to provide a comparative analysis on a range of plastic waste management scenarios, aiming to identify the most environmentally sustainable strategies. This study mainly focuses on the province of British Columbia in Canada and compares three scenarios (As-Is, Zero Plastic Waste, and Intermediate) for managing plastic waste by 2030. Our LCA study encompasses all types of plastics commonly encountered in a waste mix and considers five potential end-of-life fates: mechanical recycling, incineration, chemical recycling, landfill, and unmanaged dumps. The environmental impact assessment has been limited to end-of-life treatment processes to enhance its relevance to regional actions and strategies. Other aspects such as the environmental impacts of plastic production and material transportation, as well as the benefits gained from substitution of virgin plastic with recycled plastic have been excluded from the impact assessment. This study serves as a starting point for future research to help waste managers and policymakers devise strategic directions for sustainable management of plastic waste.
The main contributions of this work are as follows: (i) offering a more comprehensive perspective on the environmental impact of various scenarios for managing plastic waste, particularly in light of a study sponsored by Environment and Climate Change Canada [20]; (ii) constructing an LCA model using the most relevant data for the Canadian context, thereby improving its relevance and applicability to national and regional policies; and (iii) encompassing both conventional and emerging end-of-life treatment processes for plastics, ensuring a thorough analysis of the waste management landscape in the near future.

2. Materials and Methods

The goal of this study is to analyze the environmental impacts of three scenarios for managing plastic waste in the province of British Columbia in Canada by using the LCA technique. British Columbia is located on the west coast of Canada along the Pacific Ocean and has a population of approximately 5 million people. The plastic waste composition used in this study is calculated based on the data reported in [20], considering the plastic products manufactured in and imported to Canada. The data have been estimated by analyzing different industry and market sectors whose products significantly contribute to the generation of plastic waste in the country. These sectors include packaging, construction, automotive, electronic equipment (e.g., computers, phones, and electric wires), textiles, white goods (small and large appliances), agriculture, toys, furniture, and medical supplies. The manufacturing, import, and export statistics within each sector were used to estimate the mass flow of plastics in Canada [20]. We assume that the nationwide data regarding the proportion of plastic products in the market [20] are applicable at the provincial level. The data for the total amount of plastics supplied to and disposed of in British Columbia are sourced from Recycle BC’s annual report in 2019 [32]. As a not-for-profit organization, Recycle BC provides recycling services across the province.
Table 1 presents different categories of products and their associated plastic types considered in this study. Categories of films (including plastic bags), bottles, and non-bottle rigid products (e.g., plastic containers for food products) are associated with packaging materials for food, beverage, healthcare, and consumer goods. Other packaging products (including foams) have been grouped into a separate category. Insulation boards and foams used in the construction industry have been grouped together. The building profiles category primarily includes plastics used in window and door frames. In the automotive sector, plastics constitute about 8 to 10 percent of the total vehicle weight. Plastic materials are commonly used in the production of automotive components like bumpers and fluid containers, as well as interior elements like seats and dashboards [33,34]. The textile category comprises fibers used in clothing and other products such as carpets and furniture. Plastic consumption in the agricultural sector includes its use in transporting grains and seeds, packaging fertilizers and pesticides, and applications in agricultural films. The “other plastics” category in Table 1 comprises plastics utilized in chemical products and resins, as well as those employed in medical, dental, and personal care applications, along with their use in toys, furniture, and industrial machinery.
Plastic types within each category have been identified based on available data and statistics [20]. When detailed information about the composition of plastic types was not accessible, we assumed an equal proportion for plastics within the product category. For example, in the “other packaging” category, a proportion of 33% was allocated to each plastic type of PVC, PS, and PP. Similarly, within the automotive category, in addition to 28% rubber, a proportion of 18% was assigned to each of the four non-rubbery plastic types commonly used in the sector [33,34]. Plastic products are also grouped into durable and non-durable applications, where the average life of durable products is over one year [20]. It has been estimated that approximately 9% of plastics are used in electronic equipment and home appliances [20]. These product categories were not included in the study due to the complexity of their material composition and the advanced technologies needed to separate these materials for further processing [35].
Using the data from Table 1, we can calculate the composition of waste based on the type of plastic (Table 2). Eleven plastic types are listed in the table. Rubbery plastics are grouped together into a single category referred to as Rubber. Textile plastics are treated as an aggregated group, primarily due to the availability of specific data in life cycle databases for end-of-life processing of textiles. The textile-related process data used in this study rarely include the composition of textile fibers within their processes. In one instance, the composition of plastic types in textile waste was reported as 60% synthetic and 40% natural fibers [36]. In addition, since the global bioplastics market is small (1% [37]), and there are limited data regarding their use and disposal in Canada, these plastics have not been considered in the current study.
The total quantity of plastics introduced into the market within the province of British Columbia was estimated to be 64,120 tons in 2019 [32], encompassing the various plastic groups presented in Table 2. To determine the amount of plastic discarded over a year, it is assumed that all non-durable plastics along with a portion of durable plastic products (assumed to be 55% [20]) turn into waste. Durable plastic waste represents the waste generated from products that entered into the market in previous years.
By keeping the plastic end-use application constant, three scenarios for managing plastic waste by 2030 are considered in this study: (1) As-Is, (2) Zero Plastic Waste, and (3) Intermediate. A summary of the assumptions for end-of-life mass flows in each scenario is given in Table 3. For example, the ratios of plastic waste going to landfills are 85.5%, 67.6%, and 15.3% for the As-Is, Intermediate, and Zero Plastic Waste scenarios, respectively. Based on national data, the As-Is scenario represents the current status of plastic waste management in the province [20]. The Zero Plastic Waste scenario was devised by the authors of another study [20] based on current trends in product designs and emerging resource recovery technologies. In this scenario, mechanical recycling is increased fourfold compared with the As-Is scenario. In addition, chemical recycling is significantly scaled up, considering the potential improvements in readiness levels of these technologies by 2030. Incineration is also used to manage hard-to-recycle plastics.
The Intermediate scenario assumes minimal technical advancements from the As-Is scenario, with an increase in the rate of mechanical recycling and a decrease in the percentage loss due to unmanaged dumps and leaks. This scenario is closely aligned with various programs introduced by the BC government since 2021 to enhance mechanical recycling in the province. Examples of these programs are CleanBC Plastics Action Fund [38] and Extended Producer Responsibility Five-Year Action Plan 2021–2026 [39].
We use the open-source software openLCA [40] for conducting the environmental impact assessment. Diverse databases are employed to source process inventory data. Each process dataset provides information about the quantities of materials and resources used, the energy and water consumed, and the emissions in the form of solid, liquid, or gas generated during the process. In addition, it includes data related to the infrastructure, energy sources, transportation networks, and other aspects of the overall system that indirectly contribute to the environmental impact of the process. In the current study, data for processes in Canada are preferred, followed by those in the United States, European Union, and globally. For instance, data related to incineration and landfilling of textiles are extracted from the EXIOBASE Canada database [41], while data for mechanical textile recycling are taken from Thinkstep AG [42]. For the treatment of each type of plastic waste, the process specific to that plastic was preferred (e.g., incineration of PE), followed by the process for general plastics (e.g., incineration of plastics, unspecified), depending on the availability of data.
Unmanaged dumps or leaks were grouped under landfills to quantify their environmental impact. Mechanical recycling typically includes processing steps of grinding, metal separation, plastic type identification and sorting, washing, and palletization. Incineration involves heating materials in the presence of oxygen to combust their hydrocarbon contents and release the embodied energy [43]. Incineration of plastic waste offers energy recovery through heat and/or electricity [44,45]. Currently, five waste-to-energy plants are operating in Canada [20]. Chemical recycling was assumed to be gasification and pyrolysis, equally distributed in terms of mass flow. These technologies produce gasses and liquids that can be used to manufacture new plastics, fuels, or other chemicals [46].
The current study solely examines environmental impacts resulting from end-of-life treatment of plastic waste. Other aspects such as plastic production, material transportation, and substitution of virgin plastic with recycled plastic are excluded. In the context of LCA, impact indicators are quantitative measures used to evaluate the environmental effects of a product, process, or system. These indicators represent potential impacts on human health, ecosystems, and resources. In this study, the following impact indicators are considered: (1) abiotic depletion, which encompasses all natural resources such as metal-containing ores, crude oil, and mineral raw materials; (2) acidification, which occurs predominantly through the transformation of air pollutants into acids and affects soils and waters; (3) eutrophication, which is the enrichment of nutrients in a certain place, caused by air pollutants, wastewater and fertilization; (4) 100-year global warming potential, which is associated with the greenhouse effect; (5) ozone depletion potential, which is a measure of how much a substance can contribute to the depletion of the ozone layer in the earth’s stratosphere; and (6) photochemical oxidation, which is associated with the formation of ground-level ozone, and occurs when pollutants released into the atmosphere undergo reactions in the presence of sunlight. Finally, we considered four human and ecotoxicity impact indicators: (7) marine aquatic ecotoxicity; (8) human toxicity; (9) freshwater aquatic ecotoxicity; and (10) terrestrial ecotoxicity. These are calculated for a substance based on several parameters, including its chemical composition, physical properties, and emission sources.
We use the CML-IA Baseline method [47] to calculate the values of these impact indicators for each end-of-life process. In general, impact assessment methods assign characterization factors to different emissions (e.g., carbon dioxide, methane, heavy metals, etc.) and resources (energy, water, chemicals, etc.) associated with the process. Characterization factors represent the potential impact of a unit of emissions or resource in each impact category. These factors are derived from scientific data and models, and their values can be updated with further research [48]. The current study uses the default CML-IA Baseline method incorporated into the openLCA software 1.10.3 for impact assessment.

3. Results

3.1. Comparison between End-of-Life Treatments

To better understand how different end-of-life treatment processes contribute to the environmental impact indicators, we compare the impact results for textiles and plastics in Table 4 and Table 5. For plastics, the impact results for all plastic types in Table 2, excluding textiles, are aggregated. The results presented in Table 4 and Table 5 are normalized with respect to the impact results for landfilling. On a per kg waste basis, no end-of-life treatment method is less impactful than landfill across all impact categories. This is primarily because landfilling is a passive process that does not require energy or material input. For textiles (Table 4), incineration has high impacts in terms of terrestrial ecotoxicity, marine aquatic ecotoxicity, human toxicity, and acidification, but its abiotic depletion is low. Mechanical recycling is significantly more impactful in terms of abiotic depletion, and its terrestrial ecotoxicity impact is also relatively high. Gasification exhibits higher global warming potential and terrestrial ecotoxicity, while pyrolysis shows significantly elevated impacts in terms of acidification, human toxicity, and photochemical oxidation.
For plastics (Table 5), incineration has high impacts in terms of marine aquatic ecotoxicity, human toxicity, and terrestrial ecotoxicity, but its abiotic depletion is low. Mechanical recycling is significantly more impactful in terms of abiotic depletion, but its impact is less than other processes for almost all other impact indicators. Gasification has a higher global warming potential, terrestrial ecotoxicity, and human toxicity. For pyrolysis, the impacts in terms of photochemical oxidation and human toxicity are significantly higher than other end-of-life treatment processes.
Compared with landfills, incineration increases CO2 emissions, while some benefits include avoiding the emission of molybdenum, vanadium, selenium, nickel, and hydrogen fluoride. In mechanical recycling, using molybdenum, sulfur, and silicon in the metal separation process contributes to the high level of abiotic depletion. Gasification results in higher CO2 and lead emissions. SO2 and PM2.5 emissions are the main contributors to the high environmental impacts of pyrolysis.

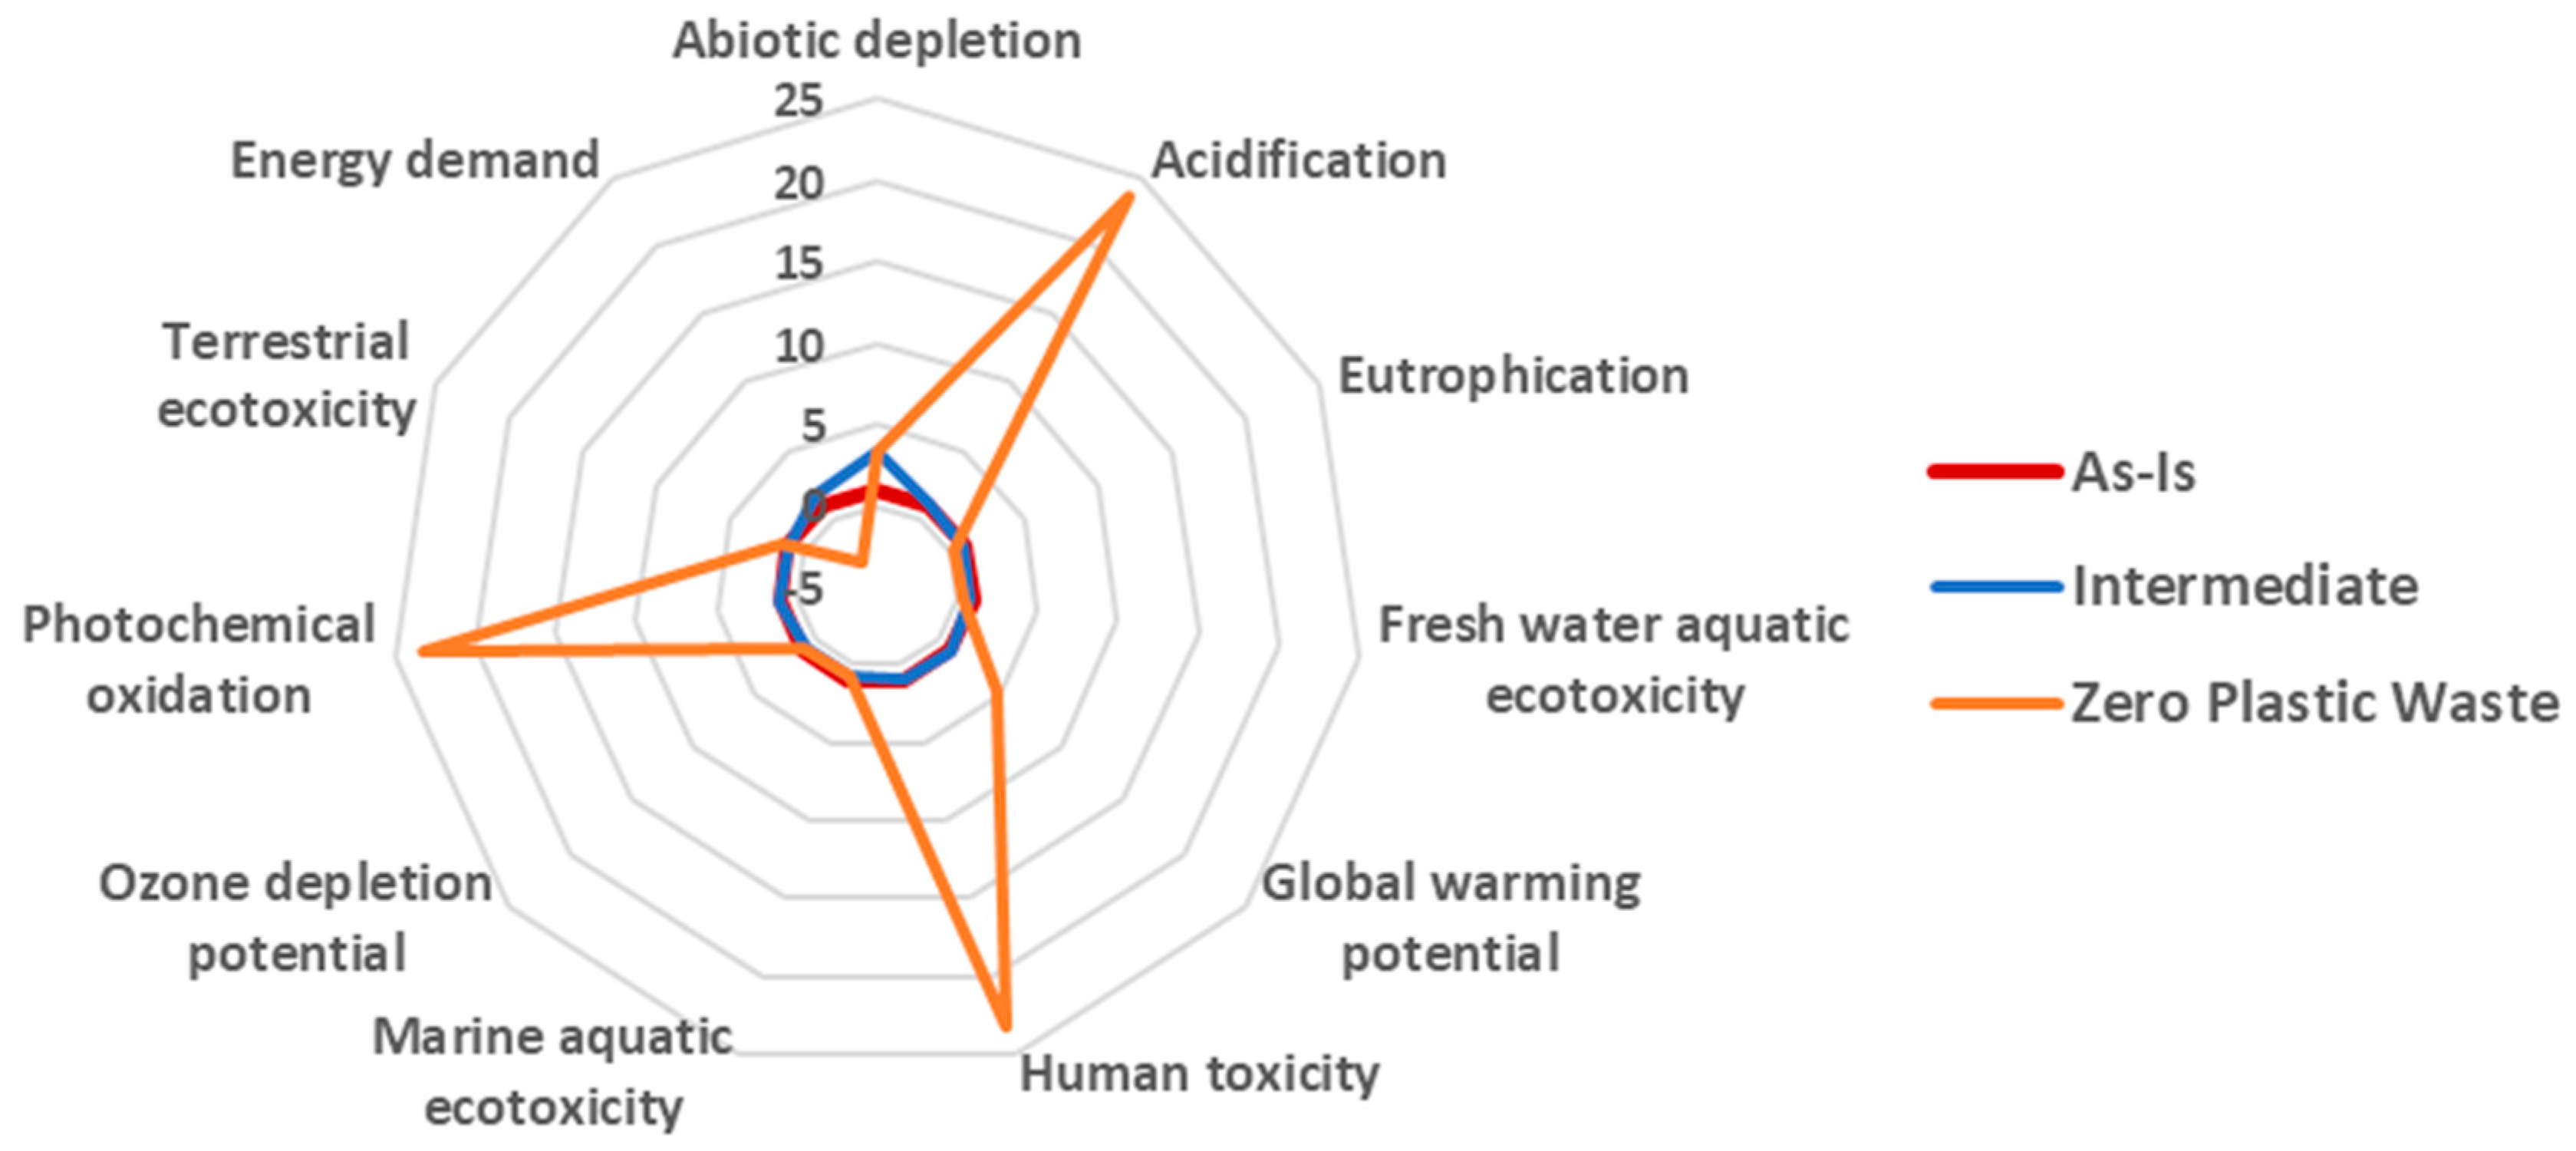
3.2. Environmental Impact of Different Scenarios for Managing Plastic Waste

Based on the available data and assumptions made, the LCA results for managing plastic waste through three scenarios, defined in Table 3, are plotted in Figure 1. The impact results are normalized with respect to the result of the As-Is scenario. Neither the Intermediate nor the Zero Plastic Waste scenarios present noticeably fewer environmental impacts than the baseline (Figure 1). While increasing mechanical recycling and decreasing unmanaged dumps (Intermediate scenario) decreases the impact of ozone depletion potential, freshwater aquatic ecotoxicity, marine aquatic ecotoxicity, and eutrophication, it increases the impact of abiotic depletion. Most environmental impacts come from the use of energy in the mechanical recycling process. Moving to a Zero Plastic Waste scenario presents much less impact in terms of eutrophication, freshwater aquatic ecotoxicity, ozone depletion potential, and marine aquatic ecotoxicity but significantly increases acidification, human toxicity, and photochemical oxidation. The plot in Figure 1 also compares the energy required for implementing each scenario. As this measure accounts for the energy recovered through incineration and chemical recycling processes, the net energy demand for Zero Plastic Waste is lower compared with other scenarios.

4. Discussion

It is known that chemical recycling often results in higher environmental impacts compared with more passive treatments like landfill or mechanical recycling [49]. For this reason, the Zero Plastic Waste scenario, which heavily relies on chemical recycling, demonstrates less environmental advantage in certain impact indicators compared with the other two scenarios (Figure 1). However, it is important to acknowledge that the impact results for chemical recycling are based on the available data for current technologies. Given the rapid advancements and growing interest in the field, it is highly possible that these impacts may decrease in the future as more sustainable and efficient technologies are developed and implemented [50].
In a separate study [20], the Zero Plastic Waste scenario was projected to result in a reduction of 1.8 megatons of CO2 emissions. This reduction is obtained by replacing virgin feedstock with recycled plastic. Additionally, it involves offsetting emissions from other energy sources through the utilization of the energy recovered during the processing of plastic waste. In this context, our study underscores the importance of considering diverse impact categories when evaluating the environmental consequences of waste management scenarios. Based on our results (Figure 1), indicators such as acidification, human toxicity, marine aquatic ecotoxicity, and photochemical oxidation show significantly higher impacts compared with the As-Is scenario. The global warming potential indicator, representing CO2 emissions, also shows a higher impact but to a lesser extent than the aforementioned indicators. It is, therefore, important to assess the environmental impact of plastic waste management scenarios through a comprehensive methodology that considers a wide range of impact categories.
The outcomes of the Intermediate scenario indicate that by investing in the required infrastructure for mechanical recycling, immediate advantages can be attained, including an increase in recycling rates (from approximately 8% to 27%) without imposing the substantial environmental burden that is inherent in treatment processes. Previous LCA studies have also confirmed the environmental benefits of mechanical recycling over pyrolysis and incineration [51,52].
The results of this study, which covers different treatment processes (Section 3.1) and plastic waste management scenarios (Section 3.2), reveal distinct variations in the environmental performance of processes and scenarios across various impact categories. The primary focus of this study was on quantifying the environmental impact of alternative practices for managing plastic waste as a pivotal step toward making well-informed decisions. However, it is essential to augment these findings with discussions on interpreting LCA results [53] and on prioritizing different impact categories [54]. While the LCA study enables a more comprehensive assessment, the broad spectrum of impact categories it encompasses can pose challenges in decision-making and strategic planning [53]. For future studies, the present work can be expanded to include the interpretation of LCA results within the Canadian setting, providing more relevant and contextual insights.
The LCA methodology used in this study did not account for the impact of microplastics. A recent study [55] shows that filtration steps during mechanical recycling do not remove microplastics smaller than 5 microns. Microplastics can also pose a threat when they enter the environment through landfill leachate [55,56]. Including microplastics in LCA studies would offer a better representation of plastic waste management processes.
In this study, we used national average data to estimate plastic waste composition at the provincial level. Considering that environmental impact results are sensitive to variations in waste mix [56], future studies can incorporate more representative and accurate data specific to the region. Also, while we made efforts to incorporate representative life cycle inventory data in this study, it is important to acknowledge that some local and regional databases lacked necessary information for certain processes. The variability in site-specific data (e.g., energy grid, representative waste composition sent to incineration facilities, landfill gas management, etc.) were limitations in the present study. Examining comparative LCA results on landfilling and incineration, as outlined in [57], can provide insights into the significance of LCA assumptions.
Furthermore, this study exclusively focused on the impacts related to end-of-life treatments, neglecting the avoided burden resulting from substitution practices (e.g., replacing virgin plastic with recycled plastic or grid energy with recovered energy). Suitable methodologies and formulas for modeling avoided burden and credits acquired through end-of-life processes are still under discussion and subject to ongoing research [44,45]. Additionally, this study did not consider certain waste management options, including the reuse of plastic waste in construction applications such as concrete, mortar, and pavement [58]. These reuse options have gained attention in recent years as an avenue for reducing environmental impacts and achieving greater circularity in the construction sector. In some scenario analyses [56], this reuse option has been distinguished from mechanical recycling due to the fewer processing steps required for plastic waste. Future research could explore the relevance of this plastic waste management pathway for Canada.
In summary, this work provides some insights into the environmental impact of plastic waste management scenarios in the province of British Columbia, Canada. Technology remains a key macroenvironmental factor to consider when discussing plastic waste management [54]. Future research could focus on incorporating emerging technological advancements and quantifying the benefits of avoided environmental burden. Additionally, investigating the socio-economic aspects of implementing these strategies (e.g., through social life cycle assessment and life cycle costing) and assessing their long-term sustainability would establish a more robust foundation for decision and policy making.

Author Contributions

Conceptualization, O.Z. and M.T.; methodology, O.Z. and M.T.; software, O.Z. and M.T.; validation, O.Z., M.T. and M.E.; formal analysis, O.Z. and M.T.; investigation, O.Z., M.T. and M.E.; resources, M.T.; data curation, O.Z. and M.T.; writing—original draft preparation, O.Z. and M.T.; writing—review and editing, W.A. and M.E.; visualization, W.A. and M.E.; supervision, M.T. and M.E.; project administration, M.T. and M.E. All authors have read and agreed to the published version of the manuscript.

Funding

This research received no external funding.

Data Availability Statement

The data presented in this study are available on request from the corresponding author.

Acknowledgments

The authors are grateful for the valuable technical and administrative work performed by the staff at 5REDO to make this research possible.

Conflicts of Interest

Author Ophela Zhang and Mahdi Takaffoli were employed by 5R Enabler Designs and Operations Inc. (5REDO).

References

  1. Rogelj, J.; Geden, O.; Cowie, A.; Reisinger, A. Three ways to improve net-zero emissions targets. Nature 2021, 591, 365–368. [Google Scholar] [CrossRef] [PubMed]
  2. Höhne, N.; Gidden, M.J.; Elzen, M.D.; Hans, F.; Fyson, C.; Geiges, A.; Jeffery, M.L.; Gonzales-Zuñiga, S.; Mooldijk, S.; Hare, W.; et al. Wave of net zero emission targets opens window to meeting the Paris Agreement. Nat. Clim. Chang. 2021, 11, 820–822. [Google Scholar] [CrossRef]
  3. Government of Canada. Canada 2030 Emissions Reduction Plan: Canada’s Next Steps for Clean Air and a Strong Economy; Environment and Climate Change Canada: Montreal, QC, Canada, 2022.
  4. Kerry, J. The Long-Term Strategy of the United States, Pathways to Net-Zero Greenhouse Gas Emissions by 2050; United States Department of State: Washington, DC, USA, 2022.
  5. Committee, C.C. The Sixth Carbon Budget: The UK’s Path to Net Zero; Climate Change Committee: London, UK, 2020. [Google Scholar]
  6. State Council. Action Plan for Carbon Dioxide Peaking before 2030; State Council: Beijing, China, 2021.
  7. Grimault, J.; Tronquet, C.; Bellassen, V.; Bonvillain, T.; Foucherot, C. Carbon Sinks: Is France’s Ambition Realistic? Analysis of the National Low Carbon Strategy 2; Institute for Climate Economics: Paris, France, 2022. [Google Scholar]
  8. Ohta, H. Japan’s Policy on Net Carbon Neutrality by 2050. East Asian Policy 2021, 13, 19–32. [Google Scholar] [CrossRef]
  9. Gautam, M.; Agrawal, M. Greenhouse Gas Emissions from Municipal Solid Waste Management: A Review of Global Scenario. In Carbon Footprint Case Studies: Municipal Solid Waste Management, Sustainable Road Transport and Carbon Sequestration; Muthu, S.S., Ed.; In Environmental Footprints and Eco-design of Products and Processes; Springer: Singapore, 2021; pp. 123–160. [Google Scholar] [CrossRef]
  10. Idumah, C.I.; Nwuzor, I.C. Novel trends in plastic waste management. SN Appl. Sci. 2019, 1, 1402. [Google Scholar] [CrossRef]
  11. Seto, K.C.; Churkina, G.; Hsu, A.; Keller, M.; Newman, P.W.; Qin, B.; Ramaswami, A. From Low- to Net-Zero Carbon Cities: The Next Global Agenda. Annu. Rev. Environ. Resour. 2021, 46, 377–415. [Google Scholar] [CrossRef]
  12. Tan, X.; Zhu, K.; Meng, X.; Gu, B.; Wang, Y.; Meng, F.; Liu, G.; Tu, T.; Li, H. Research on the status and priority needs of developing countries to address climate change. J. Clean. Prod. 2021, 289, 125669. [Google Scholar] [CrossRef]
  13. Tejaswini, M.S.S.R.; Pathak, P.; Ramkrishna, S.; Ganesh, P.S. A comprehensive review on integrative approach for sustainable management of plastic waste and its associated externalities. Sci. Total Environ. 2022, 825, 153973. [Google Scholar] [CrossRef]
  14. Hole, G.; Hole, A.S. Improving recycling of textiles based on lessons from policies for other recyclable materials: A minireview. Sustain. Prod. Consum. 2020, 23, 42–51. [Google Scholar] [CrossRef]
  15. Siracusa, V.; Blanco, I. Bio-polyethylene (Bio-PE), Bio-polypropylene (Bio-PP) and Bio-poly (ethylene terephthalate)(Bio-PET): Recent developments in bio-based polymers analogous to petroleum-derived ones for packaging and engineering applications. Polymers 2020, 12, 1641. [Google Scholar] [CrossRef]
  16. Shen, M.; Hu, T.; Huang, W.; Song, B.; Qin, M.; Yi, H.; Zeng, G.; Zhang, Y. Can incineration completely eliminate plastic wastes? An investigation of microplastics and heavy metals in the bottom ash and fly ash from an incineration plant. Sci. Total Environ. 2021, 779, 146528. [Google Scholar] [CrossRef]
  17. Geyer, R.; Jambeck, J.R.; Law, K.L. Production, use, and fate of all plastics ever made. Sci. Adv. 2017, 3, e1700782. [Google Scholar] [CrossRef] [PubMed]
  18. Thiounn, T.; Smith, R.C. Advances and approaches for chemical recycling of plastic waste. J. Polym. Sci. 2020, 58, 1347–1364. [Google Scholar] [CrossRef]
  19. Chen, H.; Wan, K.; Zhang, Y.; Wang, Y. Waste to Wealth: Chemical Recycling and Chemical Upcycling of Waste Plastics for a Great Future. ChemSusChem 2021, 14, 4123–4136. [Google Scholar] [CrossRef] [PubMed]
  20. Environment and Climate Change Canada. Economic Study of the Canadian Plastic Industry, Markets and Waste: Summary Report to Environment and Climate Change Canada; Environment and Climate Change Canada: Montreal, QC, Canada, 2019.
  21. 2016_postconcumerplasticrecyclingincanada_v9_1.pdf. Available online: https://www.plasticsmarkets.org/jsfcode/srvyfiles/wd_151/2016_postconcumerplasticrecyclingincanada_v9_1.pdf (accessed on 12 November 2023).
  22. Canada Parliament; House of Commons; Standing Committee on Environment and Sustainable Development; Aldag, J. The Last Straw: Turning the Tide on Plastic Pollution in Canada; House of Commons Canada (Chambre des Communes Canada): Ottawa, ON, Canada, 2019.
  23. CCME. Canada-Wide Action Plan on Zero Plastic Waste: Phase 2; PN 1606; CCME: Winnipeg, MB, Canada, 2020. [Google Scholar]
  24. Abbott, J.K.; Sumaila, U.R. Reducing marine plastic pollution: Policy insights from economics. Rev. Environ. Econ. Policy 2019, 13, 327–336. [Google Scholar] [CrossRef]
  25. Lau, W.W.; Shiran, Y.; Bailey, R.M.; Cook, E.; Stuchtey, M.R.; Koskella, J.; Velis, C.A.; Godfrey, L.; Boucher, J.; Murphy, M.B.; et al. Evaluating scenarios toward zero plastic pollution. Science 2020, 369, 1455–1461. [Google Scholar] [CrossRef] [PubMed]
  26. Christensen, T.H.; Damgaard, A.; Levis, J.; Zhao, Y.; Björklund, A.; Arena, U.; Barlaz, M.; Starostina, V.; Boldrin, A.; Astrup, T.; et al. Application of LCA modelling in integrated waste management. Waste Manag. 2020, 118, 313–322. [Google Scholar] [CrossRef]
  27. Khandelwal, H.; Dhar, H.; Thalla, A.K.; Kumar, S. Application of life cycle assessment in municipal solid waste management: A worldwide critical review. J. Clean. Prod. 2019, 209, 630–654. [Google Scholar] [CrossRef]
  28. Finkbeiner, M. Product environmental footprint—Breakthrough or breakdown for policy implementation of life cycle assessment? Int. J. Life Cycle Assess 2014, 19, 266–271. [Google Scholar] [CrossRef]
  29. Del Borghi, A. LCA and communication: Environmental Product Declaration. Int. J. Life Cycle Assess 2013, 18, 293–295. [Google Scholar] [CrossRef]
  30. Huertas-Valdivia, I.; Ferrari, A.M.; Settembre-Blundo, D.; García-Muiña, F.E. Social Life-Cycle Assessment: A Review by Bibliometric Analysis. Sustainability 2020, 12, 6211. [Google Scholar] [CrossRef]
  31. Hauschild, M.Z. Introduction to LCA methodology. In Life Cycle Assessment: Theory and Practice; Springer: Berlin/Heidelberg, Germany, 2018; pp. 59–66. [Google Scholar]
  32. Recycle BC. Annual Report; Recycle BC: Vancouver, BC, Canada, 2019. [Google Scholar]
  33. Patil, A.; Patel, A.; Purohit, R. An overview of Polymeric Materials for Automotive Applications. Mater. Today Proc. 2017, 4, 3807–3815. [Google Scholar] [CrossRef]
  34. Vieyra, H.; Molina-Romero, J.M.; Calderón-Nájera, J.d.D.; Santana-Díaz, A. Engineering, Recyclable, and Biodegradable Plastics in the Automotive Industry: A Review. Polymers 2022, 14, 3412. [Google Scholar] [CrossRef] [PubMed]
  35. Maris, E.; Botané, P.; Wavrer, P.; Froelich, D. Characterizing plastics originating from WEEE: A case study in France. Miner. Eng. 2015, 76, 28–37. [Google Scholar] [CrossRef]
  36. Recycling of Textiles into Fibers, Production Mix, at Plant. Fiber Composition Estimated as 60% Synthetic Fiber and 40% Natural Fiber, Collection, Transport, Sorting, Fibration, Spinning, Textile Waste, Efficiency 85%. Available online: https://nexus.openlca.org/search/ (accessed on 30 November 2023).
  37. Cooke, T.; Pomeroy, R.S. Chapter 11—The bioplastics market: History, commercialization trends, and the new eco-consumer. In Rethinking Polyester Polyurethanes; Pomeroy, R.S., Ed.; Emerging Issues in Analytical Chemistry; Elsevier: Amsterdam, The Netherlands, 2023; pp. 261–280. [Google Scholar] [CrossRef]
  38. CleanBC Plastics Action Fund. Available online: https://www.alacritycanada.com/plasticsactionfund/ (accessed on 30 November 2023).
  39. Advancing Recycling in B.C.—Extended Producer Responsibility Action Plan 2021–2026. Available online: https://www2.gov.bc.ca/assets/gov/environment/waste-management/recycling/recycle/extended_producer_five_year_action_plan.pdf (accessed on 30 November 2023).
  40. openLCA.org|openLCA is a Free, Professional Life Cycle Assessment (LCA) and Footprint Software with a Broad Range of Features and Many Available Databases, Created by GreenDelta since 2006. Available online: https://www.openlca.org/ (accessed on 16 August 2023).
  41. Bjelle, E.L.; Stadler, K.; Wood, R. EXIOBASE 3rx; Zenodo: Geneva, Switzerland, 2019. [Google Scholar] [CrossRef]
  42. Welcome!—Sphera Solutions GmbH. Available online: https://lcdn.thinkstep.com/ (accessed on 17 August 2023).
  43. Al-Salem, S.M. 3—Energy Production From Plastic Solid Waste (PSW). In Plastics to Energy; Al-Salem, S.M., Ed.; Plastics Design Library; William Andrew Publishing: New York, NY, USA, 2019; pp. 45–64. [Google Scholar] [CrossRef]
  44. Chirayil, C.J.; Mishra, R.K.; Thomas, S. 3—Materials Recovery, Direct Reuse and Incineration of PET Bottles. In Recycling of Polyethylene Terephthalate Bottles; Thomas, S., Rane, A., Kanny, K., Abitha, V.K., Thomas, M.G., Eds.; Plastics Design Library; William Andrew Publishing: New York, NY, USA, 2019; pp. 37–60. [Google Scholar] [CrossRef]
  45. Cudjoe, D.; Wang, H. Plasma gasification versus incineration of plastic waste: Energy, economic and environmental analysis. Fuel Process. Technol. 2022, 237, 107470. [Google Scholar] [CrossRef]
  46. Porshnov, D. Evolution of pyrolysis and gasification as waste to energy tools for low carbon economy. Wiley Interdiscip. Rev. Energy Environ. 2022, 11, e421. [Google Scholar] [CrossRef]
  47. Guinée, J.B. Handbook on Life Cycle Assessment: Operational Guide to the ISO Standards; Springer Science & Business Media: Berlin/Heidelberg, Germany, 2002; Volume 7. [Google Scholar]
  48. Çolak, A.; Laratte, B.; Elevli, B.; Çoruh, S. Abiotic Depletion of Boron: An Update Characterization Factors for CML 2002 and ReCiPe. Minerals 2022, 12, 435. [Google Scholar] [CrossRef]
  49. Meys, R.; Frick, F.; Westhues, S.; Sternberg, A.; Klankermayer, J.; Bardow, A. Towards a circular economy for plastic packaging wastes—The environmental potential of chemical recycling. Resour. Conserv. Recycl. 2020, 162, 105010. [Google Scholar] [CrossRef]
  50. Vollmer, I.; Jenks, M.J.F.; Roelands, M.C.P.; White, R.J.; van Harmelen, T.; de Wild, P.; van der Laan, G.P.; Meirer, F.; Keurentjes, J.T.F.; Weckhuysen, B.M. Beyond Mechanical Recycling: Giving New Life to Plastic Waste. Angew. Chem. Int. Ed. 2020, 59, 15402–15423. [Google Scholar] [CrossRef]
  51. Rigamonti, L.; Grosso, M.; Møller, J.; Sanchez, V.M.; Magnani, S.; Christensen, T.H. Environmental evaluation of plastic waste management scenarios. Resour. Conserv. Recycl. 2014, 85, 42–53. [Google Scholar] [CrossRef]
  52. Lee, K.J.L.; Wong, S.F. Comparative environmental and socioeconomic assessment on mixed plastic waste management: A Singapore case study. Sci. Total Environ. 2023, 893, 164884. [Google Scholar] [CrossRef]
  53. Esnouf, A.; Heijungs, R.; Coste, G.; Latrille, É.; Steyer, J.-P.; Hélias, A. A tool to guide the selection of impact categories for LCA studies by using the representativeness index. Sci. Total Environ. 2019, 658, 768–776. [Google Scholar] [CrossRef]
  54. Bai, S.; Zhu, X.; Wang, X.; Ren, N. Identify stakeholders’ understandings of life cycle assessment results on wastewater related issues. Sci. Total Environ. 2018, 622–623, 869–874. [Google Scholar] [CrossRef] [PubMed]
  55. Brown, E.; MacDonald, A.; Allen, S.; Allen, D. The potential for a plastic recycling facility to release microplastic pollution and possible filtration remediation effectiveness. J. Hazard. Mater. Adv. 2023, 10, 100309. [Google Scholar] [CrossRef]
  56. Neo, E.R.K.; Soo, G.C.Y.; Tan, D.Z.L.; Cady, K.; Tong, K.T.; Low, J.S.C. Life cycle assessment of plastic waste end-of-life for India and Indonesia. Resour. Conserv. Recycl. 2021, 174, 105774. [Google Scholar] [CrossRef]
  57. Anshassi, M.; Sackles, H.; Townsend, T.G. A review of LCA assumptions impacting whether landfilling or incineration results in less greenhouse gas emissions. Resour. Conserv. Recycl. 2021, 174, 105810. [Google Scholar] [CrossRef]
  58. Zulkernain, N.H.; Gani, P.; Chuan, N.C.; Uvarajan, T. Utilisation of plastic waste as aggregate in construction materials: A review. Constr. Build. Mater. 2021, 296, 123669. [Google Scholar] [CrossRef]
Figure 1. Environmental impact and energy demand comparisons between different scenarios; the impact results for Intermediate and Zero Plastic Waste scenarios are normalized in relation to the results of the As-Is scenario.
Environments 10 00213 g001
Table 1. Breakdown of plastic product categories and their associated plastic types. ABS: acrylonitrile-butadiene-styrene; PET: polyethylene terephthalate; HDPE: high-density polyethylene; LDPE: low-density polyethylene; LLDPE: linear low-density polyethylene; PS: polystyrene; PVC: polyvinyl chloride; PP: polypropylene; PU: polyurethane; PB: Polybutylene.
Category% of Product CategoryPlastic TypeDurable/
Non-Durable
Films12.45%LDPE (100%)Non-durable
Bottles10.66%PET (100%)Non-durable
Non-bottle rigid products10.15%HDPE (100%)Non-durable
Other packaging4.28%PVC (33%), PS (33%), PP (33%)Non-durable
Foam plastic in building17.64%PS (100%)Durable
Paints and coating4.49%PVC (100%)Durable
Building profiles4.49%PVC (100%)Durable
Automotive11.50%Nylon (18%), ABS (18%), PP (18%), PU (18%),Durable
Rubber (28%)
Textiles6.45%Textiles (100%)Durable
Agriculture1.11%LLDPE (100%)Non-durable
Other plastics16.77%ABS (8%), Nylon (8%), HDPE (9%), LDPE (9%), PET (9%), LLDPE (8%), PVC (8%), PS (9%), PP (8%), Rubber (16%), PB (8%)Durable
Table 2. Plastic waste composition by type. ABS: acrylonitrile-butadiene-styrene; PET: polyethylene terephthalate; HDPE: high-density polyethylene; LDPE: low-density polyethylene; LLDPE: linear low-density polyethylene; PS: polystyrene; PVC: polyvinyl chloride; PP: polypropylene; PU: polyurethane; PB: Polybutylene.
Type of PlasticDurableNon-Durable
PS19.15%1.41%
LDPE1.51%12.45%
PVC10.33%1.41%
PET1.51%10.66%
HDPE1.51%10.15%
Textiles6.45%-
Rubber5.90%-
PP3.41%1.45%
Nylon3.41%-
ABS3.41%-
LLDPE1.34%1.11%
PU2.07%-
PB1.34%-
Table 3. End-of-life mass flows for plastic waste in the three scenarios considered in the current study.
End-of-Life Treatment Scenario
As-IsIntermediateZero Plastic Waste
Landfill85.5%67.6%15.3%
Unmanaged dumps or leaks0.9%0.1%0.1%
Incineration4.2%4.2%22.4%
Mechanical recycling7.8%26.6%26.6%
Chemical recycling1.5%1.5%35.6%
Table 4. Environmental impact comparisons between landfill and alternative end-of-life treatments for textiles: the impact results for the four alternative treatment methods have been normalized in relation to the results of the landfill treatment.
Impact IndicatorIncinerationMechanical RecyclingGasificationPyrolysis
Abiotic depletion−6.01 × 10−12.38 × 103--
Acidification2.376.01 × 10−29.34 × 10−21.06 × 104
Eutrophication7.90 × 10−22.34 × 10−33.59 × 10−33.04 × 10⁻²
Freshwater aquatic ecotoxicity4.35 × 10−11.85 × 10−46.38 × 10−2-
GWP100a4.21 × 10−1-2.791.55 × 10−1
Human toxicity3.731.03 × 10−29.66 × 10−13.76 × 103
Marine aquatic ecotoxicity9.789.77 × 10−49.47 × 10⁻³-
ODP9.79 × 10−1---
Photochemical oxidation2.51 × 10−1−6.42 × 10⁻²-8.06 × 10²
Terrestrial ecotoxicity4.94 × 101.452.17-
Table 5. Environmental impact comparisons between landfill and alternative end-of-life treatments for plastics: the impact results for the four alternative treatment methods are normalized in relation to the results of the landfill treatment.
Impact IndicatorIncinerationMechanical RecyclingGasificationPyrolysis
Abiotic depletion−3.254.25 × 103--
Acidification1.557.77 × 10−31.55 × 10−11.75 × 10−4
Eutrophication1.80 × 10−11.02 × 10−32.02 × 10−21.70 × 10⁻¹
Freshwater aquatic ecotoxicity1.83 × 10−17.86 × 10−53.19 × 10−2-
GWP100a3.20 × 10-3.88 × 102.10
Human toxicity3.941.31 × 10−21.264.52 × 103
Marine aquatic ecotoxicity5.392.73 × 10−37.73 × 10⁻³-
ODP9.12 × 10−1---
Photochemical oxidation1.01−5.06 × 10⁻²-8.16 × 10³
Terrestrial ecotoxicity3.407.59 × 10−11.61-
Disclaimer/Publisher’s Note: The statements, opinions and data contained in all publications are solely those of the individual author(s) and contributor(s) and not of MDPI and/or the editor(s). MDPI and/or the editor(s) disclaim responsibility for any injury to people or property resulting from any ideas, methods, instructions or products referred to in the content.

