Article

‘Typical’ No More: Digital Re-Evaluation of Yanguoxia Caririchnium Trackways Reveals Behavioural Complexity


Advancement and Community Engagement, The University of Queensland, St. Lucia, QLD 4072, Australia
Geosciences 2026, 16(6), 221; https://doi.org/10.3390/geosciences16060221
Submission received: 30 March 2026 / Revised: 24 May 2026 / Accepted: 31 May 2026 / Published: 2 June 2026

Abstract

Ornithopod dinosaur trackways (OA and OB) from the Lower Cretaceous Hekou Group at Yanguoxia (Gansu Province, China) have previously been described as “typical”—a term applied to contrast them with swim traces from the same surface rather than as a comprehensive behavioural assessment. Building on published trackway maps, this study uses an expanded suite of quantitative digital analytical tools to reassess ichnotaxonomic affinity, manus–pes relationships, and locomotor behaviour. Pes morphology in both trackways is consistent with the ornithopod ichnogenus Caririchnium, with closest affinity to Caririchnium lotus. However, quantitative analysis reveals crossover events, extreme pes-dominated heteropody, and unusual manus placement that depart substantially from expectations for typical quadrupedal ornithopod locomotion. These features are most parsimoniously explained by trackmaker locomotion under shallow subaqueous conditions, in which partial buoyancy reduced effective forelimb loading rather than reflecting anatomically reduced palmar surfaces. Exploratory statistical analysis indicates left–right asymmetry in pace and step parameters within the OA trackway, raising the possibility of lateralised locomotor behaviour. Together, these findings demonstrate that trackways previously regarded as typical may preserve unrecognised behavioural complexity, and that digital re-evaluation of legacy ichnological datasets can substantially refine interpretations of dinosaur locomotion.

1. Introduction

A succession of fossil footprints—collectively termed a fossilised trackway—provides a sequential record of extinct animals interacting with their environment [1]. Whereas body fossils capture organisms predominantly at the moment of death [2], footprints document active moments during an animal’s lifetime [3]. Because dinosaur tracks and trackways vastly outnumber skeletal remains [4], their abundance provides sample sizes sufficient to identify both typical and atypical locomotor patterns across a range of depositional settings [5]. By capturing behaviour at the scale of the individual, trackways offer insights not only into locomotion but also into gait variability [6,7], and potential behavioural states (e.g., limping, turning, pausing) [8,9,10]. When examined across multiple specimens and tracksites, such data can elucidate the locomotor repertoire of a given trackmaker clade [11], as well as patterns of habitat use, substrate interaction [12], and social dynamics [13,14].
The tracksites of the Lower Cretaceous Yanguoxia locality (Hekou Group, Gansu Province, China) are notable for their exceptional preservation across a wide range of trackmaker clades and environmental conditions [15]. Prints are recorded under subaerial exposure, as well as under moderate and deeper subaqueous conditions [16]. Li et al. [15] documented a striking example from the Yanguoxia Site 2 locality, where several ornithopod trackways (A and B, sensu Li et al. [15], situated approximately 21 m apart, preserve sinuous tail traces associated with digit-only pes impressions). Both Li et al. [15] and a subsequent, more detailed analysis by Fujita et al. [16] interpreted the tail drag and Wintonopus-like footprints as evidence of semi-buoyant locomotion under water depths of approximately 2–3 m, with the trackmakers contacting the substrate with only the distal portions of the pes and tail [16].
These swimming trackways contrast with a pair of quadrupedal ornithopod trackways from the same surface, designated OA and OB, which were described as “typical trackways of walking ornithopods” [16]. For OA and OB, Fujita et al. [16] reported track dimensions and standard trackway parameters—pace, stride, and pace angulation—and provided a detailed map depicting subparallel tridactyl pes impressions with Caririchnium-like morphology [15]. However, the analytical treatment of these trackways was necessarily limited in scope, and only a restricted subset of track and trackway parameters was examined. The detailed trackway map published by Fujita et al. [16] provides the foundation for a more comprehensive re-analysis: this study applies an expanded suite of traditional and non-traditional digital analytical tools to that dataset, with the aim of extracting quantitative information beyond what the original analysis provided and assessing whether the behavioural characterisation of OA and OB as “typical” is fully supported by the available evidence.

2. Geological Setting and Location

The Yanguoxia Site 2 tracksite is located within the Lanzhou–Minhe Basin of Gansu Province, north-central China (36.055661° N, 103.252970° E). This intracontinental fault basin, developed on the Middle Qilian Mountain uplift zone, covers approximately 11,300 km2 [17]. The Lower Cretaceous Hekou Group constitutes the most extensively exposed stratigraphic unit within the basin, forming a largely monolithic succession of purplish-red clastic sediments approximately 3482 m thick [17]. The group is subdivided into eight informal formation-level units [18], consolidated by Cai et al. [19] into four composite formations: from oldest to youngest, the Zhujiatai Formation (units 1–5), the Yanguoxia Formation (unit 6), the Honggucheng Formation (unit 7), and the Huazhuang Formation (unit 8). In the Yanguoxia area, most exposed strata belong to informal unit 4, corresponding to the upper Zhujiatai Formation [18].
The age of the Hekou Group is constrained to the Early Cretaceous on the basis of palynological, ostracod, magnetostratigraphic, and sedimentological evidence [20,21]. Proposed age ranges span Barremian–Aptian to Valanginian–Albian, with the upper Zhujiatai Formation most consistently assigned a Valanginian–Hauterivian age [21]. Magnetostratigraphic investigations of the Xining–Lanzhou and Liupanshan basins constrain the Hekou and Liupanshan groups to approximately 138–106 Ma and 127–110 Ma, respectively, consistent with the biostratigraphic record [20,21]. For the purposes of this study, the Yanguoxia trackways are regarded as Early Cretaceous in age, most plausibly Barremian–Aptian.
The Hekou Group represents a fluvial–lacustrine depositional system dominated by purplish-red, medium- to thick-bedded silty mudstones, with interbedded argillaceous siltstones and subordinate fine-grained sandstones [17]. The Yanguoxia locality preserves a diverse vertebrate track assemblage attributed to theropods, sauropods, ornithopods, pterosaurs, and birds [20,22], with track-bearing surfaces recording locomotion under both subaerial and subaqueous conditions. A simplified stratigraphic section can be viewed in the original 2006 study by Li et al. [15].

3. Materials and Methods

3.1. Data Acquisition and Digital Preparation

This study did not involve new field data collection. Instead, analyses were based on previously published trackway map data from Fujita et al. (Figure 8) [16] and digitally analysed within Blender (v.4.1). The map was imported into Blender and digitally and correctly scaled and oriented to align with digital world’s coordinate system. All subsequent measurements and calculations were performed within this environment using custom Python 3.11 scripts developed specifically for trackway analysis as described elsewhere [10].
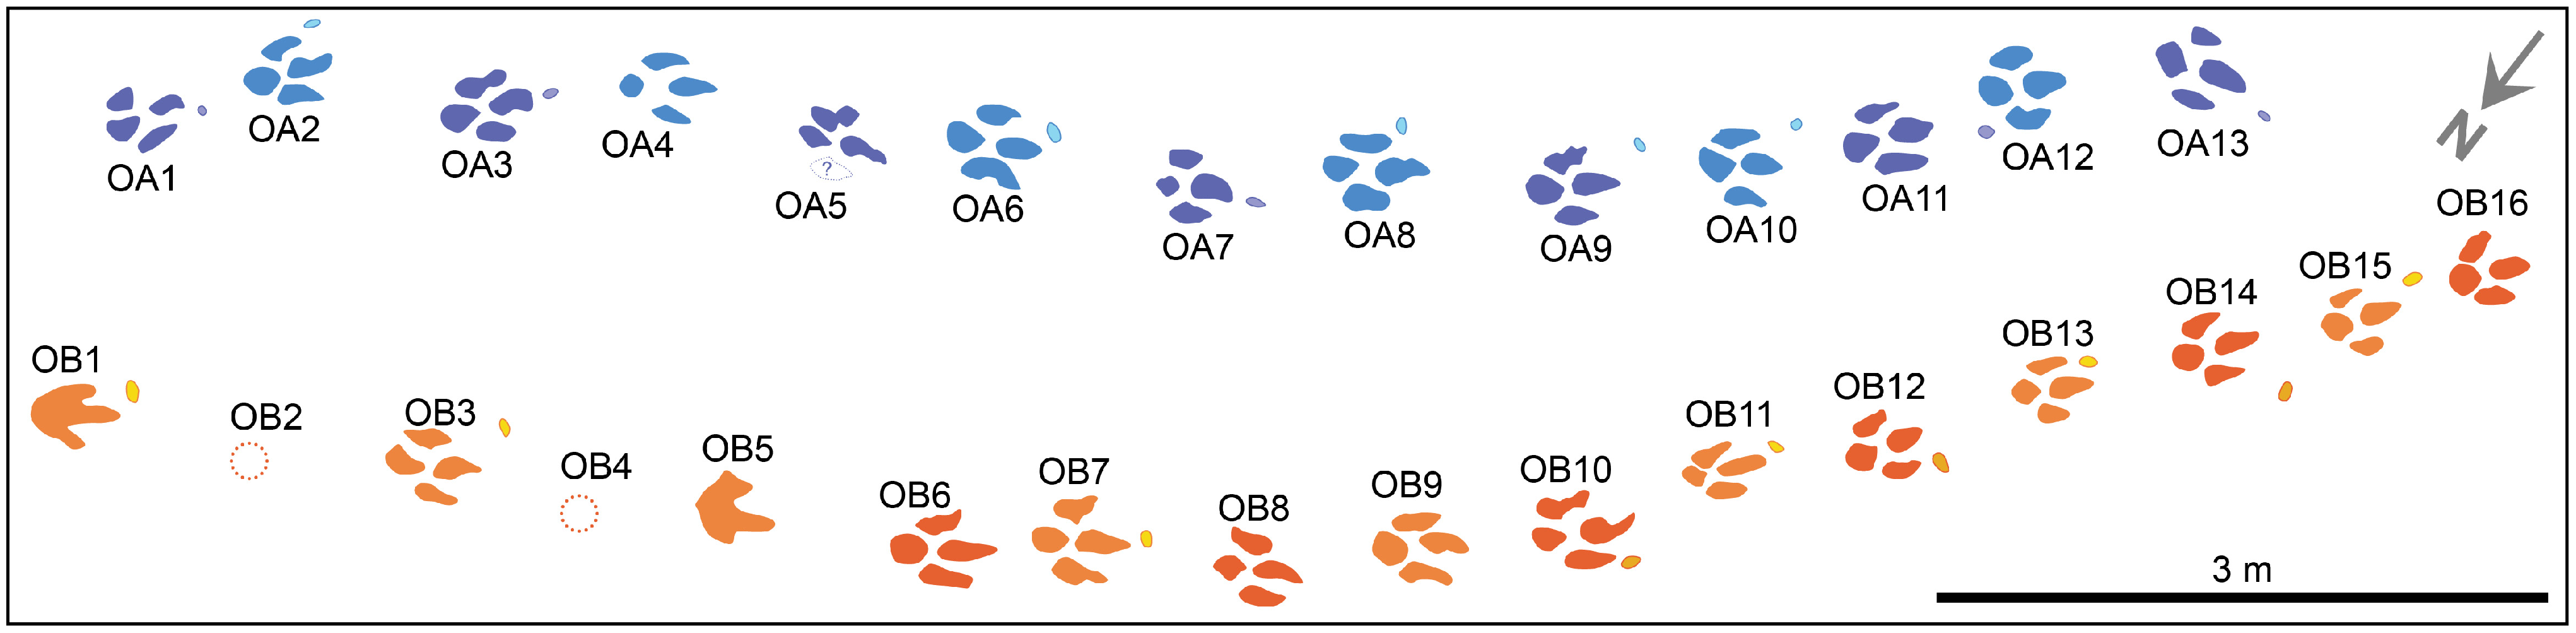
An earlier simplified representation of the OB trackway presented by Li et al. (Figure 2) [15] depicts two additional footprints not included in the more detailed map of Fujita et al. [16]. As the Li et al. [15] figure is stylised and lacks the morphological resolution required for quantitative analysis, only the higher-resolution trackway map of Fujita et al. (Figure 8) [16] was used in the present study (see Figure 1).

3.2. Trackway Parameter Calculations

3.2.1. Length Measurements

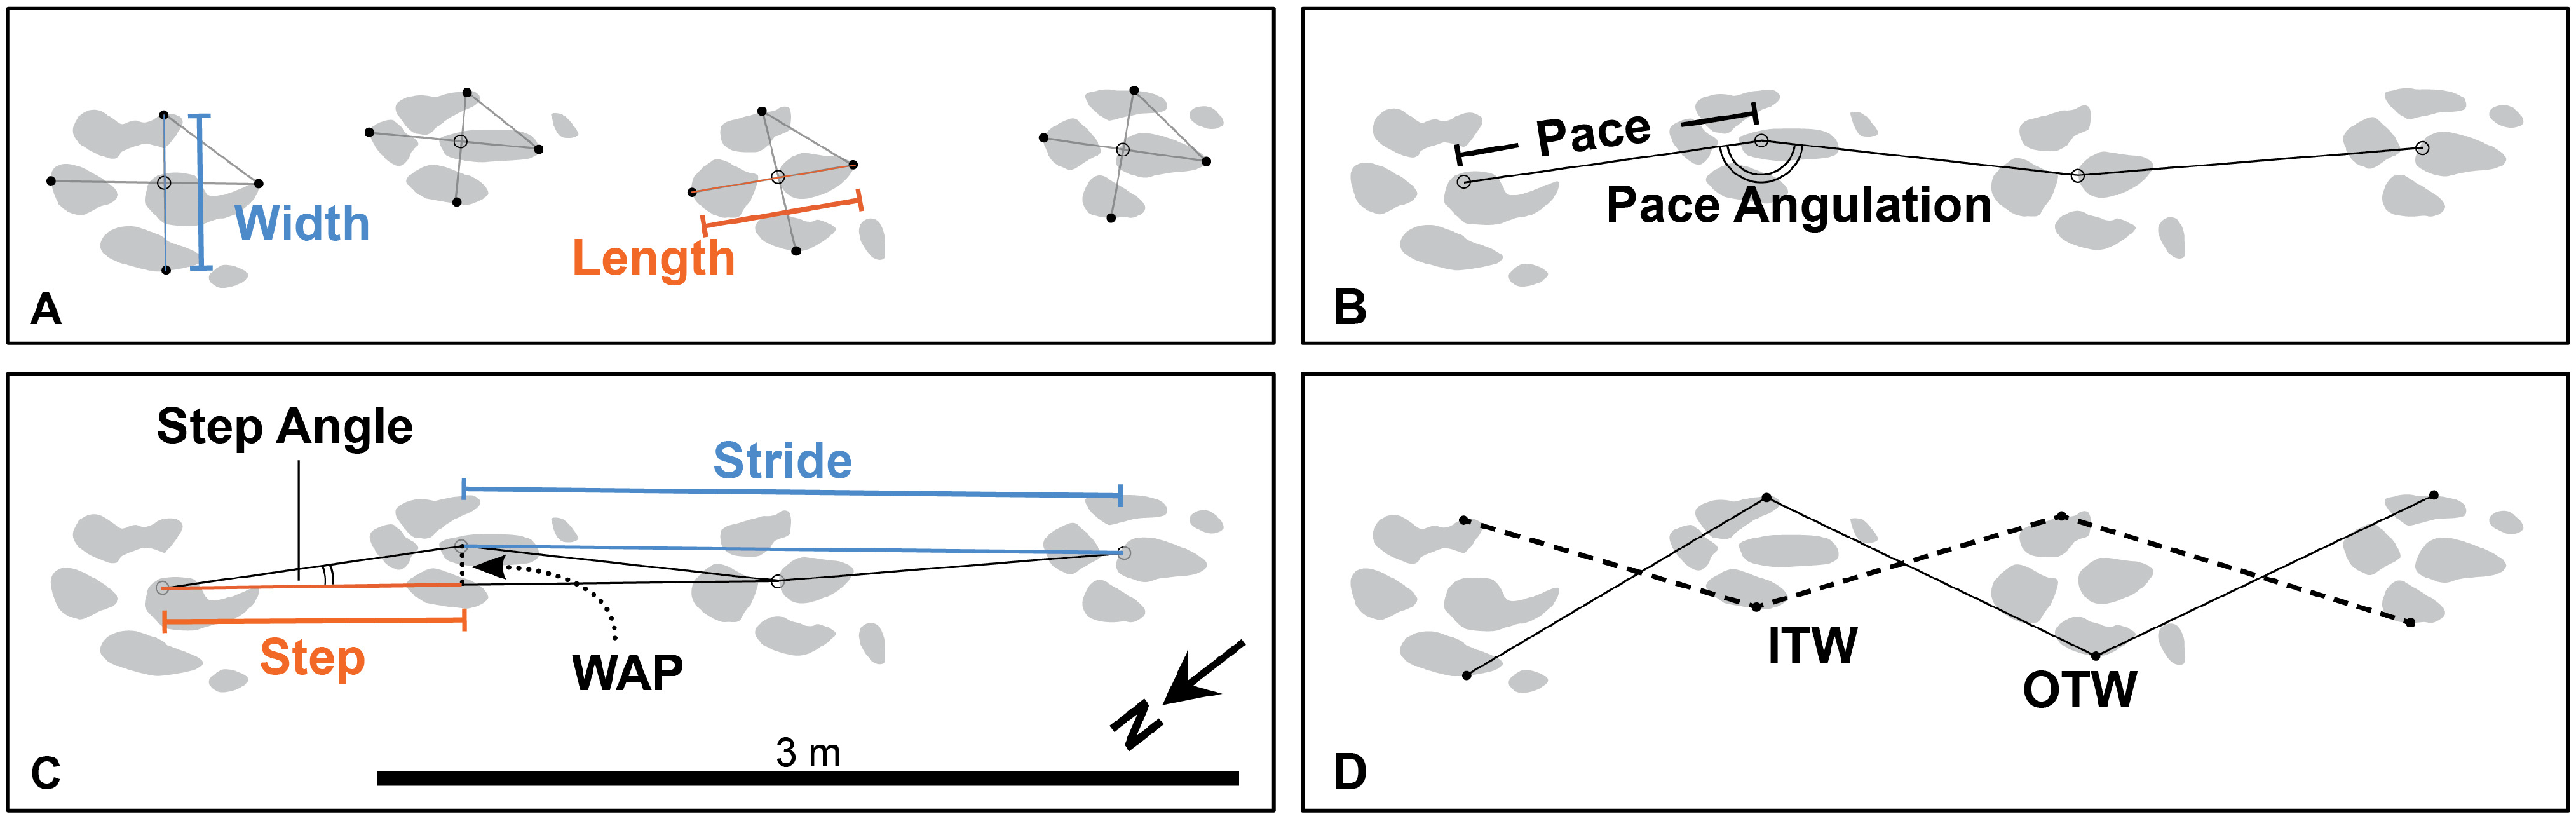
A four-vertex polyline was constructed for each complete footprint and handprint (Figure 2A). The first and second vertices were placed at the proximal- and distal-most extents of the impression to define track length, while the third and fourth vertices were placed at the lateral- and medial-most extents to define track width. For each trackway, a multi-vertex polyline was then constructed, with vertices positioned at the geometric centre of each track. These centre points correspond to the intersection of the length and width axes defined by the four-vertex polyline for each individual footprint or handprint.
Following the interpretation of Fujita et al. (Figure 8) [16], elongated gaps between the first and second, and between the second and third preserved footprints of the OB trackway were interpreted as representing missing impressions (corresponding to footprints 2 and 4). These missing footprints were incorporated into the reconstructed trackway geometry by placing vertices at positions equidistant between the adjacent preserved footprints.
The resulting centre-point polyline formed the basis for the calculation of trackway parameters, including pace length, step length, stride length, and associated angular measurements (Figure 2B,C).
Linear trackway measurements, including pace and stride lengths, were calculated as the distance between the start (x1, y1) and the end (x2, y2) coordinates of each parameter, following Equation (1):
Length = ((x2 − x1)2 + (y2 − y1)2)0.5
In dinosaur ichnology, pace length is defined as the distance between successive placements of contralateral feet (e.g., from the heel of a left pes impression to the heel of the subsequent right pes impression). Step length, by contrast, represents the forward component of this displacement when aligned parallel to the stride axis [5,23,24]. Consequently, pace length incorporates both longitudinal and lateral components of movement, whereas step length isolates forward progression along the direction of travel, using Equation (2):
Step length = (pace2 − trackway width2)0.5
The path- or trackway length was defined as the distance covered by the trackmaker along the trackway trajectory and was calculated by summing step lengths.

3.2.2. Lateral Foot Placement and Trackway Gauge

Trackway gauge reflects the lateral spacing of successive foot placements and can be expressed using angular, linear, and proportional metrics. To capture these complementary aspects of gauge, multiple interrelated parameters were quantified, allowing both step-level variability and overall trackway geometry to be assessed.
Pace angulation (Equation (3)) represents the angle between two successive pace lengths and is widely employed as an angular proxy for trackway gauge. Values approaching 180º indicate progressive narrowing of the trackway (narrow gauge), whereas lower values reflect increased lateral separation of foot placements (wide gauge). Step angle (Equation (4)), equivalent to the “angle of divergence” sensu [10], is defined as the angle between a pace length and the stride axis. Although less commonly reported, step angle provides an intuitive measure of lateral spacing, with larger values indicating greater separation between successive footfalls and smaller values indicating being closer to the trackway midline.
In many previous studies, pace angulation has been constrained to a maximum value of 180º. Such treatment obscures crossover behaviour, in which pedal impressions cross the trackway midline. To preserve this directional information, the present study employs a crossover-aware approach that permits pace angulation values to exceed 180º during crossover intervals. Step angle measurements are treated similarly and are allowed to assume negative values under the same conditions:
Cos (pace angulation) = ((pace1)2 + (pace2)2 − (stride)2)/(2 × pace1 × pace2)
Cos (step angle) = ((pace1)2 + (stride)2 − (pace2)2)/(2 × pace1 × stride)
Trackway width (also referred to as WAP: Width at Angulation Pattern) was defined as the perpendicular distance between successive footprints relative to the stride orientation and was calculated using Equation (5). To quantify inner- and outer-trackway widths (ITW and OTW, respectively), two additional polylines were constructed for each pedal trackway (Figure 2D). The ITW polyline traced the medial-most positions of successive footprints, while the OTW traced the lateral-most footprint positions:
Trackway width = pace × sin (step angle)
Trackway gauge was assessed using Equation (6) and classified following established categories [25], with narrow gauge defined as values ≥ 50%, medium gauge as values between 35% and 50%, and wide gauge as values ≤ 35%:
Gauge = 100 × (PW/OTW)
Gauge was first calculated using a single representative pes width (PW = 0.350 m), here termed “traditional gauge”. Because pes width may vary along a trackway, pes width was also measured incrementally (PWi) for each footprint as the distance between the medial and lateral pes margins defined by the ITW and OTW polylines, respectively. This footprint-specific pes width was combined with the corresponding outer-trackway width to calculate ‘incremental gauge,’ allowing assessment of within-trackway variation in gauge and evaluation of the robustness of gauge classification.

3.2.3. Trackway Directional Variability and Orientation

Stride orientation was quantified along each trackway using azimuthal measurements (degrees) and corresponding cardinal directions. These measurements provide a global descriptor of overall trackway heading, as well as the basis for assessing local directional variation between successive strides.
Directional variability was quantified using tortuosity, expressed as the ratio of straight-line displacement to path length [26,27,28]. Global tortuosity was calculated as the straight-line distance between the first and last footprints (DL) divided by the total trackway length (TL). Values approaching 1.0 indicate a near-linear trackway, whereas progressively lower values reflect increasing curvature and deviation from a straight trajectory.
To characterise local directional variability, an incremental tortuosity approach was implemented using a custom Python script. This method evaluates curvature across all possible subsequences of the trackway. For every pair of footprints (i, j), where i < j, the straight-line distance between those footprints (DLi,j) was divided by the corresponding along-trackway path length (TLi,j) to yield a local tortuosity value (Equation (7)):
Tortuosity = DLi,j/TLi,j
This procedure generated a large distribution of local tortuosity values (for example: exceeding 100 for the OA trackway), spanning short to long path segments (e.g., footprints 1–2, 1–3, …, 1–13; 2–3, 2–4, …, 2–13). These values permit identification of where along the trackway, and over what spatial scales, directional curvature is most pronounced.
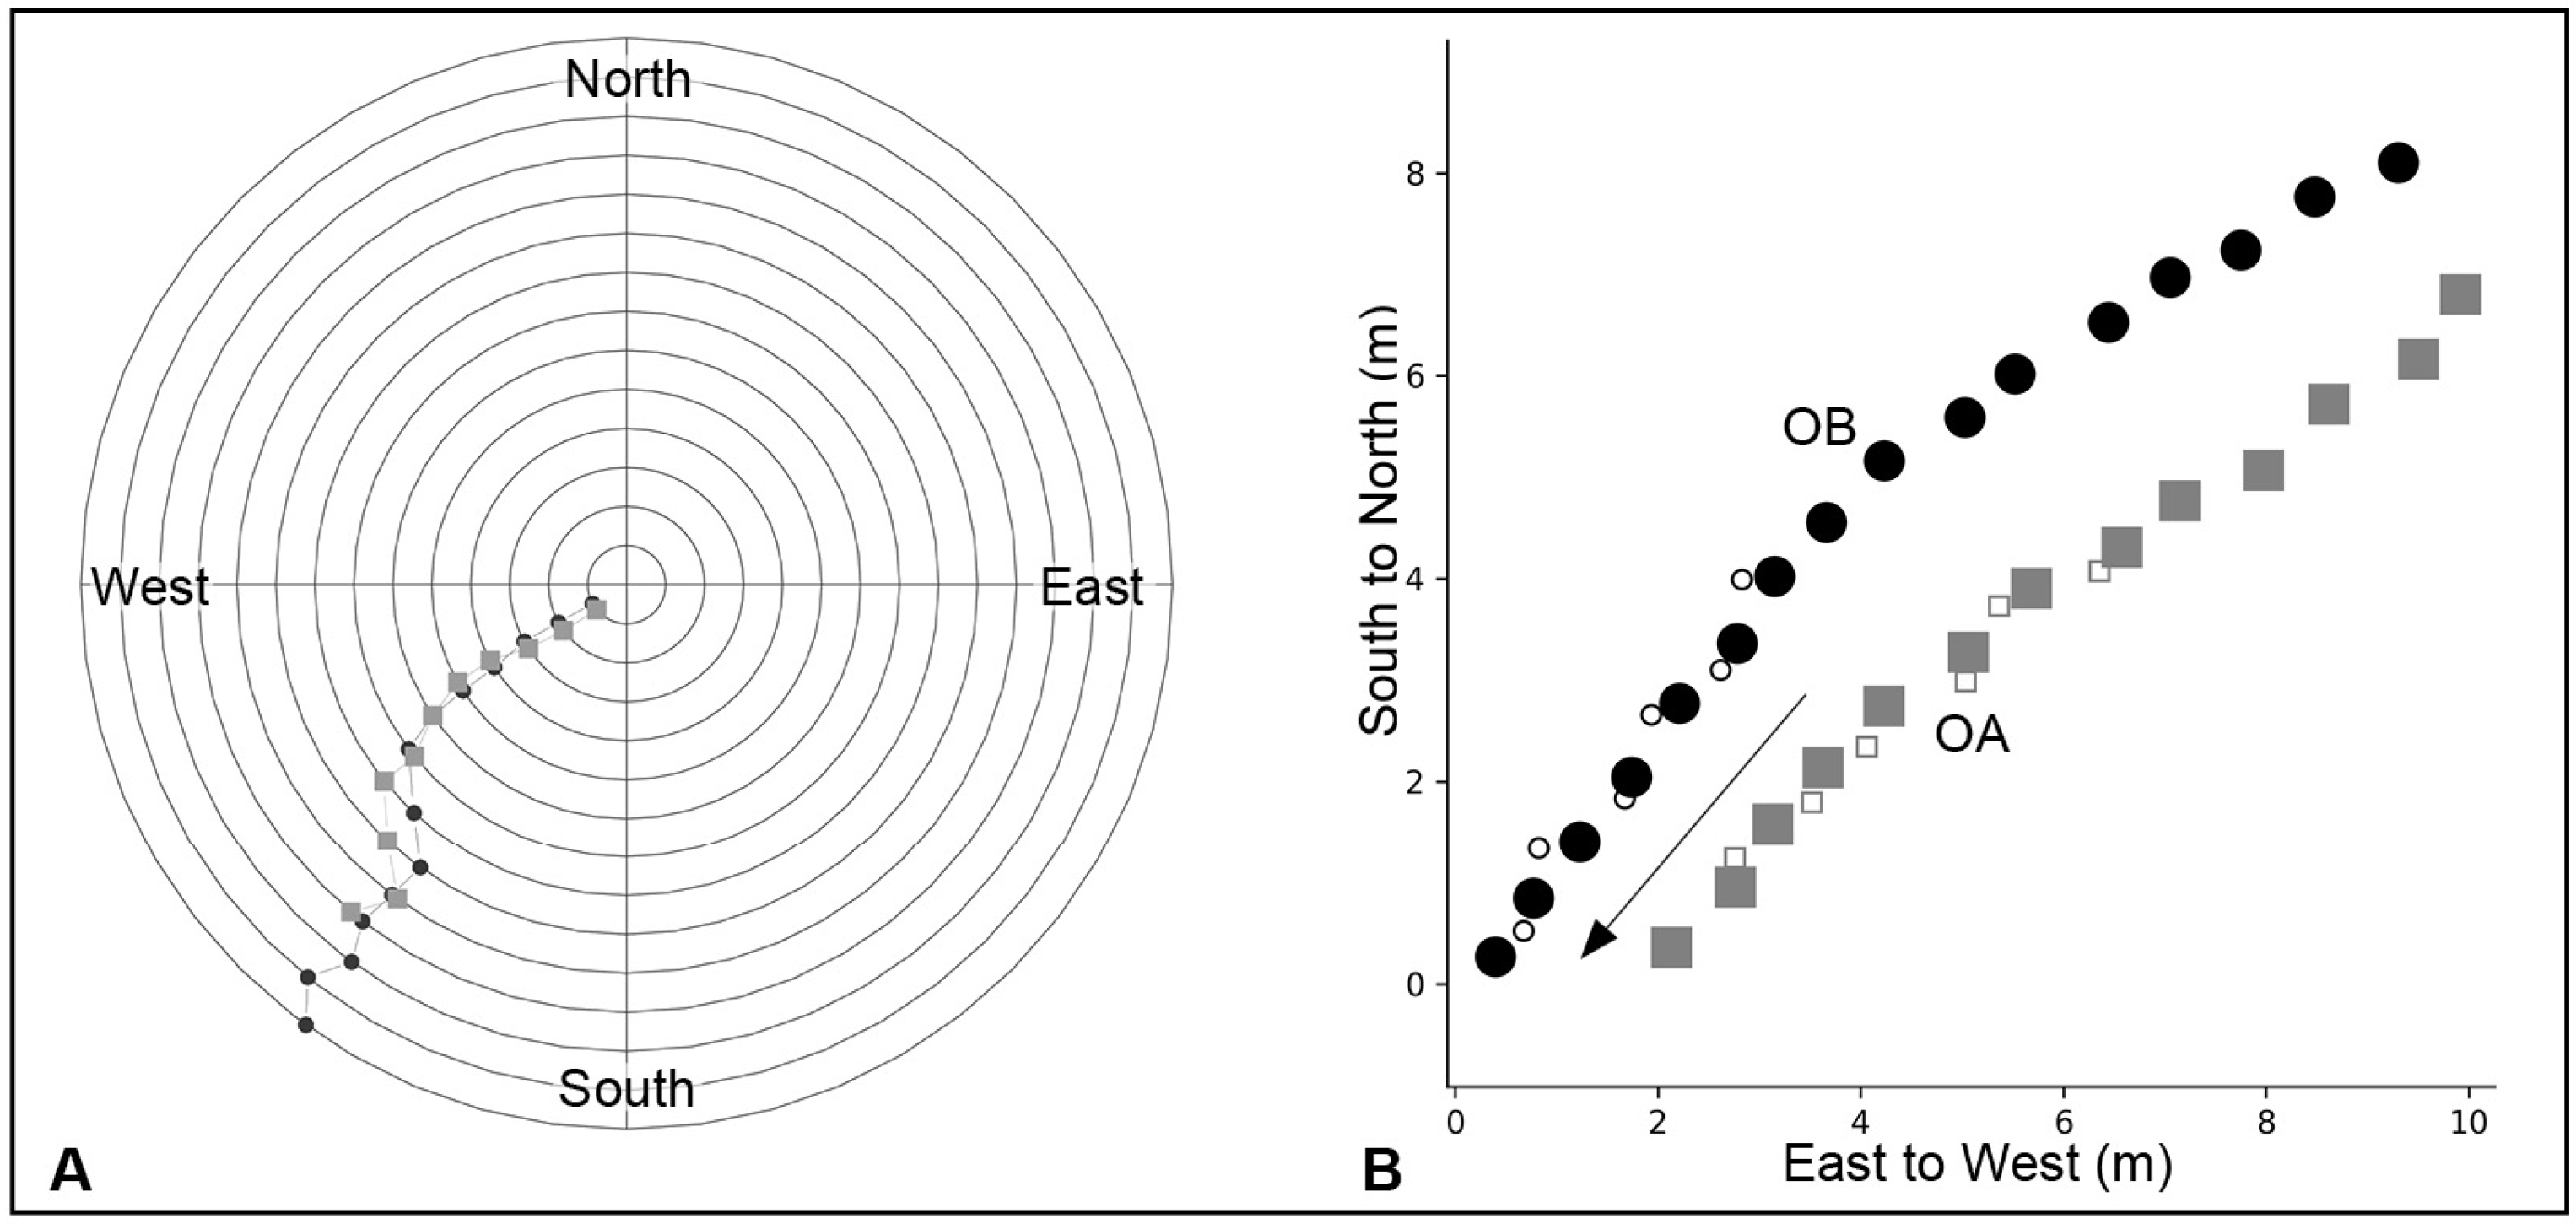
Directional variation was additionally visualised using polar plots of stride azimuths generated with a custom Python script within Blender. Each point represents the orientation of a single stride derived from successive pes print positions. Strides are plotted sequentially, with the first stride at the innermost radius and subsequent strides placed at evenly spaced radial intervals outward, such that radial position reflects stride order rather than physical distance. Concentric rings at each stride intervals are included for reference. This representation enables assessment of progressive directional change and curvature patterns that are not captured by traditional rose diagrams, particularly where directional shifts are subtle or non-uniform.

3.2.4. Heteropody

Heteropody quantifies the proportional difference between manus and pes impressions. In this study, two approaches were used: (1) a traditional Rectangular Print Area method, in which manus and pes areas are calculated as the product of track length and width; and (2) a Surface Area method, which calculates the true area of each print [29]. Although the latter more accurately represents actual footprint geometry, the former is widely used in the ichnological literature and facilitates direct comparison with previously published heteropody indices.
The Rectangular Print Area was derived directly from the four-vertex polylines defined for each complete pes and manus impression (Section 3.2.1), using the length axis (proximal–distal vertices) and width axis (medial–lateral vertices). Surface Area, by contrast, was calculated by tracing the outline of each manus and pes impression and digitally computing the enclosed area. This approach captures the true footprint geometry and avoids the geometric distortions inherent in length–width approximations. A third method, the Index of Print Area, which uses the geometric mean of length and width, was not applied in this study, as previous work has demonstrated that it introduces substantial inaccuracies when estimating true footprint area [29].
An important methodological distinction of the present study is the use of multiple manus–pes couplets within each trackway to assess heteropody, rather than the common practice of relying on a single representative couplet. This multi-couplet approach allows intra-trackway variation in heteropody to be quantified and provides a more robust assessment of manus–pes proportionality. For trackway OA, heteropody was calculated for couplets 1–3, 6–11, and 13 (n = 10); for trackway OB, couplets 1, 3, 7, and 10–15 (n = 9) were analysed. Each couplet was treated independently, generating distributions of heteropody values for both Rectangular Print Area and Surface Area methods.
Li et al. [15] considered the pes morphology of the OA and OB trackways to be similar to that of the ichnogenus Caririchnium. The ichnospecies Caririchnium lotus from the Qijiang County Tracksite [30] closely resembles OA and OB in pedal morphology. To provide a consistent comparative reference, manus and pes impressions of C. lotus were analysed using the same Rectangular Print Area and Surface Area methods.

3.2.5. Trackway Asymmetry Analysis

Lateralised locomotion was evaluated by separating each trackway into right-to-left and left-to-right footfall sequences and comparing corresponding parameters between these two classes. This approach tests for systematic asymmetry in foot placement and progression across the trackway.
Both global and local measures were assessed, including pace length, step length, stride length, trackway width (WAP, ITW, and OTW), pace angulation, step angle, and gauge (traditional/global and incremental). For each parameter, paired comparisons were conducted between left and right measurements derived from corresponding footfall positions along the trackway.
Statistical significance was evaluated using paired, two-tailed t-tests with a significance threshold of p < 0.05.

3.3. Trackmaker Biometrics

Fujita et al. [16] noted that the derived non-hadrosauriform iguanodontian (Styracosterna) Lanzhousaurus magnidens occurs within the Hekou Group and may represent a plausible trackmaker candidate for the Yanguoxia ornithopod trackways. Lanzhousaurus magnidens is phylogenetically positioned between styracosternans (e.g., Uteodon aphanoecetes) and derived hadrosauriforms (e.g., Iguanodon bernissartensis) [31]. In the absence of a complete fossilised hindlimb for Lanzhousaurus, foot-length-to-hip-height relationships from Uteodon and Iguanodon were used as proxies. These ratios were derived from skeletal reconstructions by Scott Hartman (https://www.skeletaldrawing.com/), yielding foot-length multipliers of 3.921 and 3.101 (respectively). Hip height of the Yanguoxia ornithopod trackmakers was estimated using the mean of these values, resulting in a foot-length multiplier of 3.511.
Trackmaker velocity was calculated using Alexander’s [6] equation (Equation (8)):
v = 0.25 × (9.80.5) × (stride1.67) × (hip height−1.17)
Gait classification followed the criteria of Alexander [6]. Relative stride length (stride length/hip height) values < 2 were interpreted as walking, values > 2.9 as running, and intermediate values as trotting. Transition velocities were estimated by substituting stride lengths equivalent to 2 × hip height for the walk-to-trot transition and 2.9 × hip height for the trot-to-run transition into Equation (8).
It is important to note that these velocity and gait estimates are derived from models for fully terrestrial locomotion and assume weight-bearing limbs. Consequently, the resulting speed and gait classifications should be regarded as approximations, particularly if the OA and OB trackways were formed under conditions involving reduced effective body weight or partial buoyancy at the time of track registration.

4. Results

4.1. Trackway Parameter Calculations

4.1.1. Length Measurements

Footprint length, width, and length-to-width (L:W) ratios for pes and manus impressions from trackways OA and OB are summarised in Table 1. In both trackways, pes impressions are consistently elongate, with mean L:W ratios of 1.248 (OA) and 1.297 (OB), whereas manus impressions are transversely broader than long, with mean L:W ratios of 0.649 (OA) and 0.596 (OB). Pes dimensions are broadly comparable between the two trackways (mean lengths ~45 cm), but manus impressions in OB are notably more uniform (SD: 0.4 cm length; 1.0 cm width) than those in OA (SD: 1.0 cm; 1.8 cm width), possibly indicative of inter-individual behavioural differences rather than taphonomic variation.
The OA pes sequence (13 prints; 10.19 m) and OB pes sequence (16 prints; 12.09 m) yield comparable mean stride lengths of 170.6 cm and 161.4 cm, respectively, with similar variability (SD: ~11–13 cm; Table 2). Manus sequences are shorter in both trackways (OA: 6 prints, 4.61 m; OB: 6 prints, 4.07 m), with mean stride lengths of 181.0 cm and 164.0 cm, respectively. Notably, the OA manus stride length (181.0 cm) exceeds its corresponding pes stride length (170.6 cm), a pattern not replicated in OB, where manus and pes stride lengths are broadly concordant (164.0 cm and 161.4 cm, respectively). The significance of this discrepancy is discussed in Section 5 in the context of substrate and buoyancy effects.

4.1.2. Lateral Foot Placement and Trackway Gauge

Gauge and lateral placement data for both trackways are provided in Table 3. Both OA and OB are classified as narrow gauge throughout, with all global and incremental gauge values exceeding the 50% threshold (OA global gauge mean: 80.7; OB: 92.9), indicating consistent mediolateral limb posture across both individuals. OB shows somewhat wider and more variable gauge values (global gauge SD: 19.0) compared with OA (SD: 10.5), suggesting greater lateral foot displacement in that individual.
Crossover events—where the pes crosses the trackway midline—occur in both trackways and are identifiable by negative WAP values and pace angulations exceeding 180°. In OA, a single crossover is recorded at track 10; in OB, crossovers occur at tracks 14 and 15. These events are considered further in Section 5.
Manus sequences in both trackways show consistently wider WAP values and lower pace angulations than their corresponding pes sequences, consistent with forelimb placement lateral to the midline relative to the hindlimbs.

4.1.3. Trackway Directional Variability and Orientation

Both OA and OB maintain near-linear trajectories throughout, with traditional tortuosity ratios of 0.993 and 0.982, respectively, and no incremental segment falling substantially below these values. Stride azimuths in both trackways are tightly clustered in the southwest to west–southwest quadrant (216–241°), with net directional shifts of approximately 10° (OA) and 25° (OB) expressed as gradual azimuthal drift rather than discrete turns (Figure 3). Collectively, these results indicate that both individuals were travelling in the same direction along consistently straight, sub-parallel paths.

4.1.4. Heteropody

Heteropody indices calculated using Rectangular Print Area and Surface Area methods for all manus–pes couplets are provided in Table 4. Both trackways are strongly pes-dominated. In OA, manus impressions represent 2.0% (Rectangular) and 3.7% (Surface Area) of pes area, while in OB the corresponding values are 3.0% and 5.6%—higher than OA under both methods, indicating a proportionally greater manus contribution in that individual. Regardless of method, pes area accounts for more than 94% of total track area in both trackways.
Comparison with the Caririchnium lotus specimen of Xing et al. [30] places these values in broader ichnotaxonomic context. That specimen yields manus:pes area ratios of 14.8% (Rectangular) and 19.2% (Surface Area)—substantially higher than either OA or OB under both approaches. The manus–pes proportionality observed here therefore falls well outside the range indicated by the C. lotus reference specimen, a disparity that is considered in Section 5 in relation to substrate effects and potential underrepresentation of manus depth.

4.1.5. Trackway Asymmetry Analysis

Left–right comparisons of pace, step, stride, pace angulation, step angle, and trackway width for both trackways are summarised in Table 5. No statistically significant asymmetry was detected in either trackway at α = 0.05. Mean left–right differences in pace and step length within the OA trackway are nonetheless noted—approximately 10 cm for pes and 25 cm for manus sequences—but given the constraints of the preserved record, these differences cannot be distinguished from substrate irregularity or preservation bias, and are not interpreted as evidence of lateralised gait.

4.2. Trackmaker Biometrics

Biometric estimates for both trackmakers are broadly comparable. Mean pes lengths of 0.453 m (OA) and 0.446 m (OB) yield estimated hip heights of 1.59 m and 1.57 m, respectively. Relative stride lengths fall consistently within the walking range for both individuals (OA mean: 1.10; OB mean: 1.03), and velocity estimates cluster between approximately 3.7 and 4.0 km/h. Predicted gait transition thresholds—walk–trot at ~11.2 km/h and trot–run at ~21.0 km/h—lie substantially above all recorded velocities, confirming that neither trackway preserves evidence of elevated locomotor speed.

5. Discussion

5.1. Ichnotaxonomic Affinity

The OA and OB trackways exhibit pes morphology consistent with the ornithopod ichnogenus Caririchnium—specifically tridactyl impressions with blunt, rounded digit terminations, a mesaxonic digit III, moderate interdigital divarication, and narrow-gauge trackway geometry broadly comparable to Caririchnium lotus from the Qijiang County tracksite [30]. As pes morphology is the primary ichnotaxonomic criterion for ornithopod trackways, this correspondence provides the strongest basis for Caririchnium affinity, and the present study concurs with the assessment of Li et al. [15] in this regard.
However, manus morphology and manus–pes proportional relationships depart from the C. lotus condition. In classic Caririchnium trackways, manus impressions are well developed and contribute to a clearly quadrupedal trackway pattern. The reduced and variably preserved manus impressions in OA and OB therefore represent a departure from C. lotus sensu Xing et al. [30], and the OA and OB trackways are best regarded as Caririchnium-like rather than unequivocally referable to that ichnospecies. This conservative position acknowledges strong pes-based similarities while recognising that manus morphology and heteropody fall outside the typical range for C. lotus, and avoids over-reliance on manus characters that may be disproportionately influenced by substrate conditions and preservational bias.

5.2. Heteropody, Manus Registration, and Subaqueous Locomotion

Strong heteropody represents the most striking departure of OA and OB from typical Caririchnium trackways. Manus impressions in OA represent only 2.0% (Rectangular) and 3.7% (Surface Area) of pes area; in OB, 3.0% and 5.6%—compared with 14.8% and 19.2% for C. lotus under the same methods. Two explanations merit consideration: anatomical reduction of the forelimbs, or behavioural–environmental suppression of manus registration.
An anatomical explanation—that the trackmakers possessed proportionally small palmar surfaces—cannot be entirely excluded, but is difficult to evaluate given the limited morphological resolution of the available manus impressions and the absence of independent skeletal data. A behavioural–environmental explanation is more parsimonious and is favoured here.
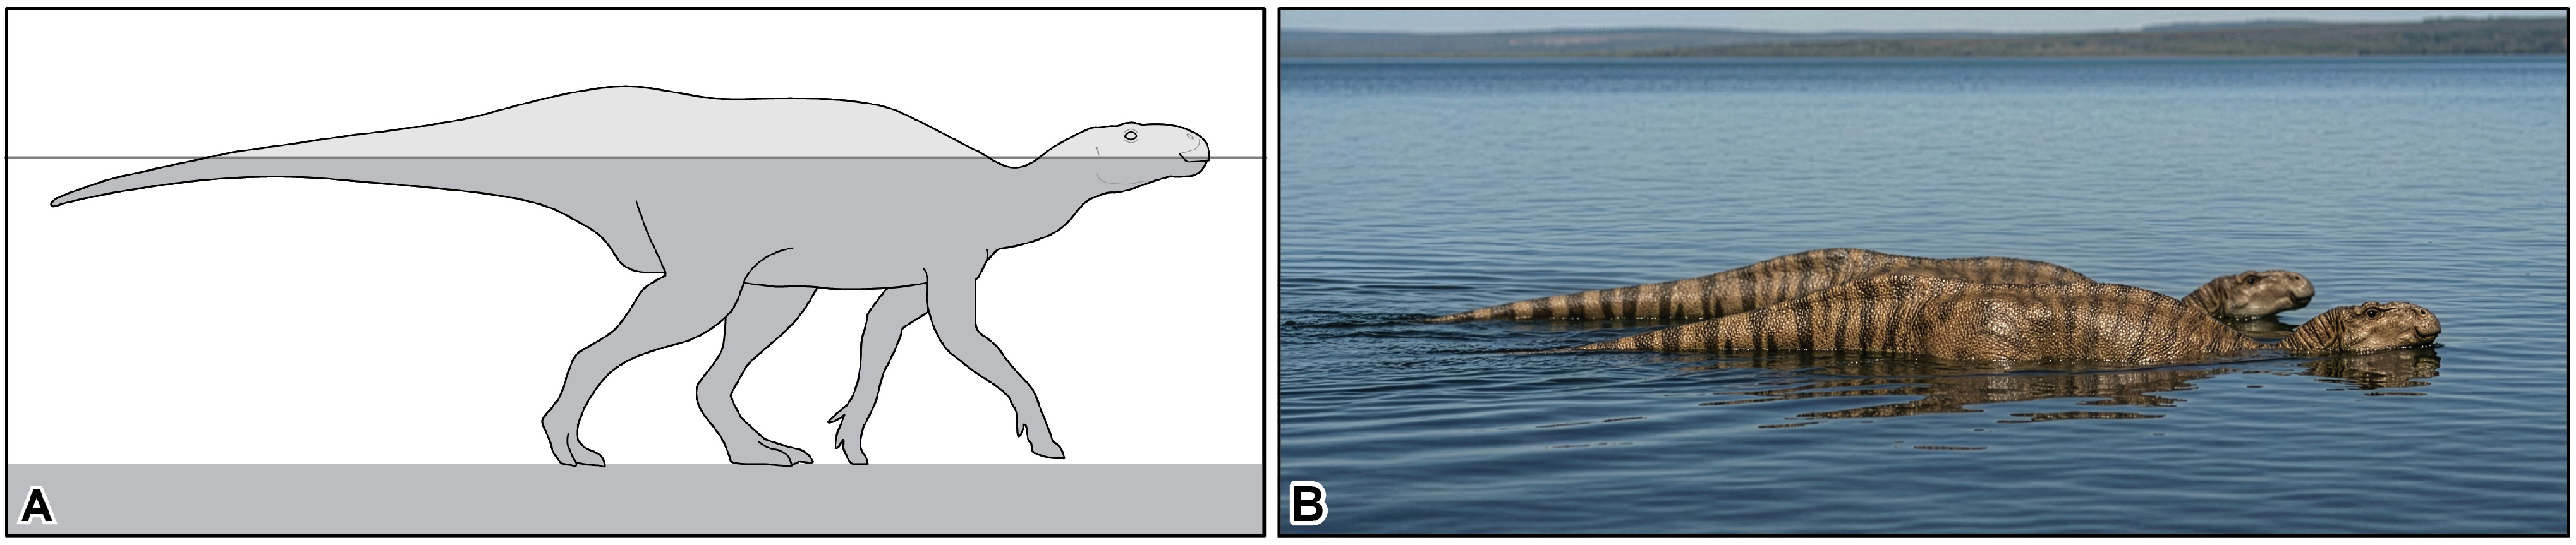
The Yanguoxia Site 2 surface preserves trackways formed under both subaerial and subaqueous conditions [15,16]. The track-bearing surface records the co-occurrence of fully load-bearing pedal impressions and trackways indicative of semi-buoyant locomotion—including sauropod and ornithopod sequences with digit-only pes impressions and associated tail-drag traces—alongside sedimentary structures such as ripple marks and desiccation cracks, which together document variable water cover across the surface [15,16]. Within this depositional context, the OA and OB trackways are most plausibly interpreted as recording locomotion under subaqueous exposure (Figure 4). In this scenario, the hindlimbs—longer and responsible for the majority of weight-bearing—remained in continuous substrate contact, producing well-defined pes impressions. The shorter forelimbs, by contrast, experienced reduced effective loading as partial buoyancy relieved the anterior body, resulting in shallow, incomplete, or intermittent manus impressions. This model does not require sufficient buoyancy to lift the hindlimbs from the substrate, as would be expected in true swimming behaviour [16,32]; instead, it represents an intermediate locomotor regime consistent with the regular step and stride spacing, coherent pace angulation, and absence of elongate digit scratches or other swim-trace features characteristic of OA and OB (Figure 4).
Critically, this interpretation is independently supported by the systematic difference in heteropody between the two trackways. OB exhibits consistently greater manus contribution than OA under both area methods, despite the trackmakers being of similar estimated body size. Under fully terrestrial conditions, a size difference of this magnitude would not be expected to produce such pronounced divergence in manus loading within the same ichnotaxon. However, under shallow subaqueous conditions, size-dependent buoyancy effects provide a plausible explanation: the slightly smaller OA individual would have experienced proportionally greater anterior buoyancy relief than the larger OB individual, resulting in more pronounced suppression of manus loading. The between-trackway heteropody difference is therefore not merely noise—it constitutes an internally consistent signal of differential buoyant unloading across two individuals moving through the same water body.

5.3. Crossover Events and Locomotor Variability

Crossover events—where the pes crosses the trackway midline—are recorded in both trackways: once in OA (track 10) and twice in OB (tracks 14–15). In otherwise regular ornithopod trackways, such events are uncommon [33] and warrant consideration beyond taphonomic artefact.
The crossovers in OA and OB do not coincide with abrupt changes in stride length, pace angulation, or trackway orientation that would indicate stumbling or loss of balance. Instead, they are embedded within coherent trackway sequences, implying controlled and deliberate limb placement. A behavioural–environmental origin is therefore preferred: under shallow subaqueous conditions, subtle variations in substrate firmness or water depth could necessitate transient lateral adjustments to maintain stability or traction, manifesting as crossover rather than persistent gait abnormality. That OB records two crossover events while OA records one cannot be attributed to differing substrate conditions, given that both individuals were traversing the same surface simultaneously. The difference is more plausibly a reflection of individual variation in limb placement behaviour, and may indicate subtle differences in gait kinematics or body posture between the two trackmakers.

5.4. Anomalous Manus Placement in Trackway OA

Manus impression 9 in the OA trackway is positioned on the left side of its associated right pes track, whereas it is expected to be a right manus impression, when based on its sequential position. In typical quadrupedal ornithopod trackways, right manus impressions are placed lateral to or anterolateral to the corresponding right pes. The observed placement would require implausible medial adduction of the right forelimb well beyond the sagittal midline—inconsistent with normal ornithopod forelimb kinematics [34] and with the otherwise regular geometry of the trackway [35].
A more parsimonious interpretation is that manus impressions 8, 9, and 10 represent a short sequence of repeated left-manus registrations rather than an alternating left–right–left pattern. Under this reading, manus impression 9 is not anomalously positioned right manus print; it reflects repeated left-manus contact during an interval in which the right manus failed to engage the substrate sufficiently to leave a discernible impression—consistent with the environmental modulation of forelimb loading discussed in Section 5.2. This interpretation remains provisional given the absence of three-dimensional depth data, but it accommodates all observed features without invoking anatomically implausible limb postures.

5.5. Lateralised Locomotor Behaviour

Paired comparisons of pace and step length parameters in the OA trackway (Table 5) reveal left–right differences that are consistent in direction across both pes (~10 cm) and manus (~25 cm) sequences. Although these differences do not reach conventional statistical significance (Table 5; α = 0.05), their agreement across multiple parameters and both limb pairs may unlikely reflect random variation. This coherence implies coordinated lateral bias at the level of whole-body locomotion and is interpreted here as a signal of preferential limb use rather than noise—while acknowledging that the preserved trackway does not provide the sample size needed to confirm this statistically.
No comparable asymmetry is detected in OB, suggesting that this pattern is individual-specific rather than a product of shared environmental conditions. The spatial association of these asymmetries with crossover behaviour and the proposed left-manus-only sequence (tracks 8–10) further supports the interpretation that the OA trackmaker exhibited a lateral locomotor preference during this interval—most plausibly a transient tendency to favour longer steps on the left side. The observed asymmetries are detectable here only through comprehensive parameter-level analysis, and no equivalent signal has previously been reported for ornithopod trackways. Their detection underscores the capacity of detailed quantitative analysis to recover behavioural information that qualitative description alone cannot access.
Asymmetry within ornithopod trackways has been recognised previously, although the strength of statistical support varies between cases [36]. The BLC1 trackway from the Cameros Basin, Spain [37], displays left–right differences that, much like the OA trackway examined here, do not reach conventional statistical thresholds, and a comparable pattern has been reported elsewhere [36]. More conclusively asymmetric examples are documented in the Caririchnium trackway from Mosquero Creek, New Mexico, USA [8], and in the Valdete ornithopod trackway from the Cameros Basin, Spain [38]. The OA pattern therefore aligns with a small but growing body of evidence that lateralised locomotor behaviour may be more widespread among ornithopods than the relatively few statistically robust cases alone would suggest.

6. Conclusions

Digital re-evaluation of the OA and OB ornithopod trackways from Yanguoxia Site 2 demonstrates that comprehensive quantitative analysis of legacy ichnological data can recover behavioural information not accessible to qualitative description alone. Pes morphology is consistent with the ichnogenus Caririchnium and most closely resembles that of C. lotus, although working from published two-dimensional trackway maps precludes formal ichnospecific attribution. The trackways characterised previously as “typical” in fact display pronounced pes-dominated heteropody, and—in OA—a repeated left-manus sequence associated with crossover behaviour, features most parsimoniously explained by locomotion under shallow subaqueous conditions in which partial buoyancy reduced effective forelimb loading. Parameter-level analysis additionally reveals coherent left–right asymmetries in OA that, while not statistically significant, are consistent in direction across multiple parameters and both limb pairs and are absent in the contemporaneous OB trackway, suggesting a transient lateralised locomotor preference. Together, these findings indicate that trackways previously regarded as typical may preserve unrecognised behavioural complexity, and that quantitative re-evaluation of published trackway datasets offers a tractable means of refining interpretations of dinosaur locomotion.

Funding

This research received no external funding.

Data Availability Statement

Data is contained within the article.

Acknowledgments

The author is grateful to the six anonymous reviewers for their comments and constructive critiques, which significantly contributed to the refinement of this manuscript. The author acknowledges the use of generative artificial intelligence during figure preparation. During the preparation of this study, the author used Google Gemini (version 3) to assist in generating a life reconstruction image (Figure 4B) based on a 3D ornithopod model created by the author in Blender. The generative tool was used solely for visual reconstruction purposes. The generative artificial intelligence tool ChatGPT (versions 5.0–5.2) was used to assist in the drafting and refinement of Python scripts; however, all analytical concepts and parameter definitions were drawn from established ichnological literature, while their computational implementation, validation, and interpretive application were determined and executed by the author. The author reviewed and edited all outputs and takes full responsibility for the content of this publication.

Conflicts of Interest

The author declares no conflicts of interest.

Abbreviations

The following abbreviations are used in this manuscript:
OAYanguoxia tracksite 2, ornithopod trackway A
OBYanguoxia tracksite 2, ornithopod trackway B
WAPWidth at Angulation Pattern (aka trackway width)
ITWInner trackway width
OTWOuter trackway width
DL Direct (straight-line) distance between two footprints
TLTrackway distance between two footprints, measured following the trackway path
SDStandard Deviation

References

  1. Thulborn, T. Dinosaur Tracks; Chapman and Hill: London, UK, 1990; p. xvii + 410pp. [Google Scholar]
  2. Lockley, M.G. The dinosaur footprint renaissance. Mod. Geol. 1991, 16, 139–160. [Google Scholar]
  3. Falkingham, P.L.; Bates, K.T.; Avanzini, M.; Bennett, M.; Bordy, E.; Breithaupt, B.H.; Castanera, D.; Citton, P.; Díaz- Martínez, I.; Farlow, J.O.; et al. A standard protocol for documenting modern and fossil ichnological data. Paleontology 2018, 61, 469–480. [Google Scholar] [CrossRef] [Scilit]
  4. Lockley, M.G. The vertebrate track record. Nature 1998, 396, 429–432. [Google Scholar] [CrossRef] [Scilit]
  5. Romilio, A.; Shao, C. Analysing trackway-based speed calculations to infer dinosaur locomotive capabilities and behaviours. Hist. Biol. 2024, 36, 2244–2253. [Google Scholar] [CrossRef] [Scilit]
  6. Alexander, R.M. Estimates of speeds of dinosaurs. Nature 1976, 261, 129–130. [Google Scholar] [CrossRef] [Scilit]
  7. Farlow, J.O. Estimates of dinosaur speeds from a new trackway site in Texas. Nature 1981, 294, 747–748. [Google Scholar] [CrossRef] [Scilit]
  8. Lockley, M.G.; Hunt, A.P.; Moratalla, J.J.; Matsukawa, M. Limping dinosaurs? Trackway evidence for abnormal gaits. Ichnos 1994, 3, 193–202. [Google Scholar] [CrossRef] [Scilit]
  9. McLarty, J.A.; Esperante, R. Stops and turns: Uncommonly preserved theropod locomotive behavior patterns in an Upper Cretaceous tracksite from Torotoro National Park, Bolivia. J. S. Am. Earth Sci. 2024, 143, 105011. [Google Scholar] [CrossRef] [Scilit]
  10. Romilio, A.; Murphey, P.C.; Matthews, N.A.; Schumacher, B.A.; Murphey, L.D.; Toscanini, M.; Boyce, P.; Fitzner, Z. Track by Track: Revealing Sauropod Turning and Lateralised Gait at the West Gold Hill Dinosaur Tracksite (Upper Jurassic, Bluff Sandstone, Colorado). Geomatics 2025, 5, 67. [Google Scholar] [CrossRef] [Scilit]
  11. Weems, R.E. A re-evaluation of the taxonomy of Newark Supergroup saurischian dinosaur tracks, using extensive statistical data from a recently exposed tracksite near Culpeper, Virginia. Publ. Va. Div. Miner. Resour. 1992, 119, 113–127. [Google Scholar]
  12. Gatesy, S.M. Skin impressions of Triassic theropods as records of foot movement. Bull. Mus. Comp. Zool. 2001, 156, 137–149. [Google Scholar]
  13. Bird, R.T. Did Brontosaurus ever walk on land? Nat. Hist. 1944, 53, 60–67. [Google Scholar]
  14. Xing, L.; Lockley, M.G.; Guo, Y.; Klein, H.; Zhang, J.; Zhang, L.; Persons, W.S.; Romilio, A.; Tang, Y.; Wang, X. Multiple parallel deinonychosaurian trackways from a diverse dinosaur track assemblage of the Lower Cretaceous Dasheng Group of Shandong Province, China. Cretac. Res. 2018, 90, 40–55. [Google Scholar] [CrossRef] [Scilit]
  15. Li, D.; Azuma, Y.; Fujita, M.; Lee, Y.-N.; Yohei, A. A preliminary report on two new vertebrate tracks sites including dinosaurs from the Early Cretaceous Hekou Group, Gansu Province, China. J. Paleontol. Soc. Korea 2006, 22, 29–49. [Google Scholar]
  16. Fujita, M.; Yuong Nam, L.; Azuma, Y.; Daqing, L. Unusual tridactyl trackways with tail traces from the lower cretaceous Hekou group, Gansu Province, China. Palaios 2012, 27, 560–570. [Google Scholar] [CrossRef] [Scilit]
  17. Chen, J.; Liu, Y.Q.; Kuang, H.W.; Liu, Y.-X.; Peng, N.; Xu, H.; Dong, C.; Liu, H.Z.; Xue, P.-L.; Xu, J.-L. Sedimentology and basin analysis of the Early Cretaceous Hekou Group in Lanzhou-Minhe Basin. Geol. Bull. China 2013, 32, 488–501. [Google Scholar]
  18. Zhang, H.; Lin, Q.; Zhang, Z.; Gu, Y.; Cai, X.; Yan, X. Study on the sedimentary sequence and sedimentary facies of the Early Cretaceous Hekou Group in Lanzhou-Minhe Basin. Geol. Sci. Technol. Inf. 2003, 22, 21–26. [Google Scholar]
  19. Cai, X.F.; Chen, B.; Li, C.A.; Zhang, F. Further discussion on the function of basic sequence and facies analysis in the regional stratigraphic division: Take Lower Cretaceous Hekou Group in Minhe Basin of Gansu as example. J. Stratigr. 2002, 26, 59–63. [Google Scholar]
  20. Li, D.; Xing, L.; Lockley, M.G.; Piñuela, L.; Zhang, J.; Dai, H.; Kim, J.Y.; Persons, W.S.; Kong, D. A manus dominated pterosaur track assemblage from Gansu, China: Implications for behavior. Sci. Bull. 2015, 60, 264–272. [Google Scholar] [CrossRef] [Scilit]
  21. Xi, D.; Wan, X.; Li, G.; Li, G. Cretaceous integrative stratigraphy and timescale of China. Sci. China Earth Sci. 2019, 62, 256–286. [Google Scholar] [CrossRef] [Scilit]
  22. Xing, L.; Peng, C.; Lockley, M.G.; Wang, Y.; Li, D.; Klein, H.; Yang, J.; Li, L.; Persons, W.S.; Wang, M. A diversified tetrapod ichnite fauna from the Lower Cretaceous Hekou Group of Gansu Province, China. Hist. Biol. 2021, 33, 3018–3030. [Google Scholar] [CrossRef] [Scilit]
  23. Romilio, A.; Park, R.; Nichols, W.; Jackson, O. Dinosaur footprints from the Lower Jurassic (Hettangian–Sinemurian) Precipice Sandstone of the Callide Basin, Queensland, Australia. Hist. Biol. 2026, 38, 134–145. [Google Scholar] [CrossRef] [Scilit]
  24. Romilio, A.; Dick, R.; Skinner, H.; Millar, J. Uncovering hidden footprints: Revision of the Lower Jurassic (Sinemurian) Razorback Beds—Home to Australia’s earliest reported dinosaur trackway. Hist. Biol. 2025, 37, 596–603. [Google Scholar] [CrossRef] [Scilit]
  25. Romano, M.; Whyte, M.A.; Jackson, S.J. Trackway ratio: A new look at trackway gauge in the analysis of quadrupedal dinosaur trackways and its implications for ichnotaxonomy. Ichnos 2007, 14, 257–270. [Google Scholar] [CrossRef] [Scilit]
  26. Benhamou, S. How to reliably estimate the tortuosity of an animal’s path: Straightness, sinuosity, or fractal dimension? J. Theor. Biol. 2004, 229, 209–220. [Google Scholar] [CrossRef] [Scilit] [PubMed]
  27. Nams, V.O. Using animal movement paths to measure response to spatial scale. Oecologia 2005, 143, 179–188. [Google Scholar] [CrossRef] [Scilit]
  28. Bustos, D.; Jakeway, J.; Urban, T.M.; Holliday, V.T.; Fenerty, B.; Raichlen, D.A.; Budka, M.; Reynolds, S.C.; Allen, B.D.; Love, D.W.; et al. Footprints preserve terminal Pleistocene hunt? Human-sloth interactions in North America. Sci. Adv. 2018, 4, eaar7621. [Google Scholar] [CrossRef] [Scilit]
  29. Romilio, A. Evaluating heteropody in tracks: Novel methodologies for manus-pes ratio calculation. Hist. Biol. 2026, 38, 127–133. [Google Scholar] [CrossRef] [Scilit]
  30. Xing, L.; Wang, F.; Pan, S.; Chen, W. The discovery of dinosaur footprints from the middle Cretaceous Jiaguan Formation of Qijiang County, Chongqing City. Acta Geol. Sin. 2007, 81, 1591–1602. [Google Scholar]
  31. Suarez, C.A.; You, H.-L.; Suarez, M.B.; Li, D.-Q.; Trieschmann, J.B. Stable Isotopes Reveal Rapid Enamel Elongation (Amelogenesis) Rates for the Early Cretaceous Iguanodontian Dinosaur Lanzhousaurus magnidens. Sci. Rep. 2017, 7, 15319. [Google Scholar] [CrossRef] [Scilit]
  32. Romilio, A.; Tucker, R.T.; Salisbury, S.W. Re-evaluation of the Lark Quarry dinosaur tracksite (late Albian–Cenomanian Winton Formation, central-western Queensland, Australia): No longer a stampede? J. Vertebr. Paleontol. 2013, 33, 102–120. [Google Scholar] [CrossRef] [Scilit]
  33. Romilio, A.; Salisbury, S.W. Large dinosaurian tracks from the Upper Cretaceous (Cenomanian–Turonian) portion of the Winton Formation, Lark Quarry, central-western Queensland, Australia: 3D photogrammetric analysis renders the ‘stampede trigger’ scenario unlikely. Cretac. Res. 2014, 51, 186–207. [Google Scholar] [CrossRef] [Scilit]
  34. Carpenter, K.; Wilson, Y. A new species of Camptosaurus (Ornithopoda: Dinosauria) from the Morrison Formation (Upper Jurassic) of Dinosaur National Monument, Utah, and a biomechanical analysis of its forelimb. Ann. Carnegie Mus. 2008, 76, 227–263. [Google Scholar] [CrossRef] [Scilit]
  35. Lockley, M.G.; Wright, J.L. Trackways of large quadrupedal ornithopods from the Cretaceous: A review. In Mesozoic Vertebrate Life: New Research Inspired by the Paleontology of Philip J. Currie; Tanke, D.H., Carpenter, K., Farlow, J.O., Eds.; Life of the Past; Indiana University Press: Bloomington, IN, USA, 2001; pp. 428–442. [Google Scholar]
  36. Romilio, A. A Quantitative Framework for Assessing Locomotor Asymmetry in Dinosaur Trackways: Testing the Evidence for Limping and Lateral Preference. Foss. Stud. 2026, 4, 9. [Google Scholar] [CrossRef] [Scilit]
  37. Razzolini, N.L.; Vila, B.; Díaz-Martínez, I.; Manning, P.L.; Galobart, À. Pes shape variation in an ornithopod dinosaur trackway (Lower Cretaceous, NW Spain): New evidence of an antalgic gait in the fossil track record. Cretac. Res. 2016, 58, 125–134. [Google Scholar] [CrossRef] [Scilit]
  38. Moratalla, J.J.; Sanz, J.L.; Melero, I.; Jimenez, S. Yacimientos Paleoicnologocos de La Rioja (Huellas de Dinosaurios); Iberdrola y Gobierno de la Rioja: Logroño, Spain, 1988; p. 96.
Figure 1. Schematic of the ornithopod trackways OA and OB (Lower Cretaceous [Barremian–Aptian], Hekou Group, Gansu Province, China), adapted from Fujita et al. [16]. Trackways OA and OB are shown as subparallel sequences of tridactyl pes impressions with associated manus impressions. Trackway OA is shown in a blue colour palette and trackway OB in an orange colour palette; within each trackway, pes impressions are rendered in darker tones and manus impressions in lighter tones, with right impressions darker than left impressions. Note that the impressions labelled OA9 include a right pes impression and an impression interpreted here as a left manus. Scale bar = 3 m; north arrow shown.
Geosciences 16 00221 g001
Figure 2. Segment of ornithopod trackway OB (tracks 10–13) (Lower Cretaceous [Barremian–Aptian], Hekou Group, Gansu Province, China) showing track and trackway parameters used in this study. (A) Length and width measurements; (B) Pace and pace angulation measurements; (C) Stride, step angle, and trackway width (aka WAP, Width at Pace Angulation) measurements; (D) Inner trackway width (ITW) and outer trackway width (OTW) landmark positions.
Geosciences 16 00221 g002
Figure 3. Directional variability and spatial trajectory of the OA and OB ornithopod trackways (Lower Cretaceous [Barremian–Aptian], Hekou Group, Gansu Province, China). (A) Sequential polar plot of stride azimuths for trackways OA (squares) and OB (circles). Each point represents a single stride, plotted at evenly spaced radial intervals outward from the centre such that radial position reflects stride order rather than distance; the innermost point corresponds to the first stride. Both trackways show tightly clustered azimuths in the southwest to west–southwest quadrant, with gradual directional drift and no discrete turns. (B) Spatial distribution of pes (filled symbols) and manus (open symbols) impressions for trackways OA (squares) and OB (circles), plotted in map-view coordinates. The arrow indicates the overall direction of travel. Both trackways follow near-linear, subparallel trajectories across the tracked surface.
Geosciences 16 00221 g003
Figure 4. Locomotor interpretation of the OA and OB ornithopod trackways (Lower Cretaceous [Barremian–Aptian] Hekou Group, Yanguoxia tracksite (Gansu Province, China). (A) Schematic reconstruction illustrating inferred trackmaker posture and progression during track registration under subaqueous conditions, with hindlimb-dominated substrate contact and reduced forelimb loading. (B) Life reconstruction of the OA and OB ornithopod trackmakers moving southwestward of a palaeo-lacustrine setting.
Geosciences 16 00221 g004
Table 1. Trackway-level track parameters for the OA and OB ornithopod trackways (Lower Cretaceous [Barremian–Aptian], Hekou Group, Gansu Province, China).
TrackwayTrack Length (m)Track Width (m)Length:Width
OA pesMean 0.453 (SD 0.041)0.364 (SD 0.027)1.248 (SD 0.138)
Median 0.460 (SD 0.041)0.365 (SD 0.027)1.262 (SD 0.138)
Min–Max 0.382–0.5340.325–0.4171.041–1.424
OA manusMean 0.045 (SD 0.010)0.072 (SD 0.018)0.649 (SD 0.200)
Median 0.042 (SD 0.010)0.074 (SD 0.018)0.595 (SD 0.200)
Min–Max 0.033–0.0590.041–0.1020.408–1.024
OB pesMean 0.446 (SD 0.044)0.346 (SD 0.034)1.297 (SD 0.147)
Median 0.439 (SD 0.044)0.348 (SD 0.034)1.285 (SD 0.147)
Min–Max 0.400–0.5310.263–0.4151.098–1.589
OB manusMean 0.054 (SD 0.004)0.090 (SD 0.010)0.596 (SD 0.046)
Median 0.054 (SD 0.004)0.092 (SD 0.010)0.586 (SD 0.046)
Min–Max 0.047–0.0590.075–0.1030.549–0.677
Table 2. Trackway parameters for the OA and OB ornithopod trackways (Lower Cretaceous [Barremian–Aptian], Hekou Group, Gansu Province, China).
TrackwayPace (m)Step (m)Stride (m)
OA pesMean 0.860 0.8491.706
Median 0.872 (SD 0.097)0.863 (SD 0.098)1.701 (SD 0.133)
Min–Max 0.720–0.9900.711–0.9831.462–1.882
OA manusMean 0.8640.8571.694
Median 0.865 (SD 0.096)0.857 (SD 0.095)1.716 (SD 0.156)
Min–Max 0.720–0.9880.711–0.9831.462–1.861
OB pesMean 0.8100.8061.614
Median 0.814 (SD 0.099)0.814 (SD 0.099)1.604 (SD 0.113)
Min–Max 0.657–1.0550.652–1.0521.408–1.803
OB manusMean 0.8830.8131.640
Median 0.872 (SD 0.061)0.804 (SD 0.061)1.623 (SD 0.055)
Min–Max 0.814–0.9820.739–0.9061.586–1.727
Table 3. Trackway-level lateral foot placement and trackway gauge for the OA and OB ornithopod trackways (Lower Cretaceous [Barremian–Aptian], Hekou Group, Gansu Province, China). WAP denotes central trackway width (width of the angulation pattern), ITW denotes inner trackway width, OTW denotes outer trackway width, Gauge t denotes traditional gauge, and Gauge i denotes incremental gauge. Gauge values > 50 indicate narrow-gauge trackways.
TrackwayPace Ang (°)Step Angle (°)WAP (m)ITW (m)OTW (m)Gauge tGauge i
OA pesMean 164 8.30.123−0.3020.44680.784.4
Median 163 (SD 8)8.5 (SD 4.4)0.115 (SD 0.063)−0.294 (SD 0.050)0.453 (SD 0.051)78.4 (SD 10.5)81.8 (SD 10.2)
Min–Max 149–183−1.4–17.4−0.021–0.227−0.395–−0.2330.346–0.50770.0–102.574.4–104.9
OA manusMean 155 12.40.199
Median 158 (SD 16)12.2 (SD 7.5)0.181 (SD 0.123)
Min–Max 133–1714.6–20.40.069–0.365
OB pesMean 171 4.70.067−0.2860.39792.989.7
Median 168 (SD 7)5.9 (SD 3.5)0.086 (SD 0.049)−0.278 (SD 0.066)0.398 (SD 0.072)89.3 (SD 19.0)87.7 (SD 17.5)
Min–Max 161–187−3.2–9.1−0.040–0.142−0.423–−0.2090.266–0.48972.6–133.467.8–129.6
OB manusMean 136 21.70.332
Median 137 (SD 4)21.7 (SD 1.0)0.330 (SD 0.033)
Min–Max 130–14020.6–22.70.287–0.379
Table 4. Trackway-level manus-pes heteropody parameters for the OA and OB ornithopod trackways (Lower Cretaceous [Barremian–Aptian], Hekou Group, Gansu Province, China), with comparative values for Caririchnium lotus from the Qijiang County tracksite (after [30]).
Manus-Pes CoupletRectangular Print Area
(Manus:Pes)
Surface Area
(Manus:Pes)
OA (n = 10)0.020 (±0.007):10.037 (±0.010):1
1:50.2 (±17.3)1:27.1 (±7.3)
OB (n = 9)0.030 (±0.009):10.056 (±0.019):1
1:32.9 (±9.8)1:17.7 (±6.0)
Caririchnium lotus (n = 1)0.148:10.192:1
1:6.761:5.20
Table 5. Trackway-level left–right asymmetry test results for the OA and OB ornithopod trackways (Lower Cretaceous [Barremian–Aptian], Hekou Group, Gansu Province, China).
TrackwayStatisticPace (m)Step (m)Stride (m)Pace Ang (°)Step Angle (°)Trackway Width (m)
OA pesRight to Left Mean (±SD)0.810 (0.085)0.797 (0.106)1.695 (0.106)163.833 (11.703)8.750 (6.257)0.121 (0.087)
Left to Right Mean (±SD)0.909 (0.097)0.900 (0.095)1.720 (0.185)163.400 (4.336)7.720 (1.949)0.125 (0.039)
Mean difference (L-R)0.0990.1030.025−0.433−1.0300.004
t−1.884−1.968−0.2640.0840.382−0.115
df9.89.96.16.66.17.2
p0.0890.0780.8000.9360.7160.912
OA manusRight to Left Mean (±SD)0.792 (0.028)0.768 (0.002)1.800 (0.144)159.000 (16.971)12.200 (10.041)0.169 (0.141)
Left to Right Mean (±SD)1.050 (0.118)1.025 (0.123)1.820 (0.158)150.500 (24.749)12.500
(11.172)
0.229
(0.192)
Mean difference (L-R)0.2580.2570.020−8.5000.3000.060
t3.6433.6270.129−0.4010.0280.363
df2.32.02.01.82.01.8
p0.0540.0680.9090.7320.9800.754
OB pesRight to Left Mean (±SD)0.783 (0.086)0.780 (0.086)1.601 (0.123)173.000 (8.021)3.657 (4.079)0.049 (0.053)
Left to Right Mean (±SD)0.833 (0.116)0.828 (0.115)1.626 (0.120)168.143 (6.336)5.714 (3.113)0.085 (0.045)
Mean difference (L-R)0.0500.0480.025−4.8572.0570.036
t0.9440.9160.378−1.2571.0611.336
df12.712.712.011.411.211.7
p0.3630.3760.7120.2340.3110.207
OB manusRight to Left Mean (±SD)0.872 (0.043)0.799 (0.058)1.665 (0.088)136.500 (0.707)21.750 (1.344)0.330 (0.008)
Left to Right Mean (±SD)0.898 (0.119)0.834 (0.102)1.615 (0.041)135.000 (7.071)21.650 (1.485)0.333 (0.065
Mean difference (L-R)0.0260.035−0.050−1.500−0.1000.003
t−0.293−0.4360.7180.2990.071−0.065
df1.21.41.41.02.01.0
p0.8130.7190.5730.8150.9500.959
Disclaimer/Publisher’s Note: The statements, opinions and data contained in all publications are solely those of the individual author(s) and contributor(s) and not of MDPI and/or the editor(s). MDPI and/or the editor(s) disclaim responsibility for any injury to people or property resulting from any ideas, methods, instructions or products referred to in the content.