Development of a Parturition Detection System for Korean Native Black Goats
Abstract
Simple Summary
Abstract
1. Introduction
- Classify labor and non-labor behaviors using an ML classification algorithm for KNBGs;
- Develop an LPI that combines the amount of labor behaviors and the amount of activity to indicate the intensity of labor pain;
- Use the LPI to detect parturition; and
- Develop a notification system that can provide early warning for labor.
2. Material and Methods
2.1. Animals and Housing
2.2. Behavioral Observations
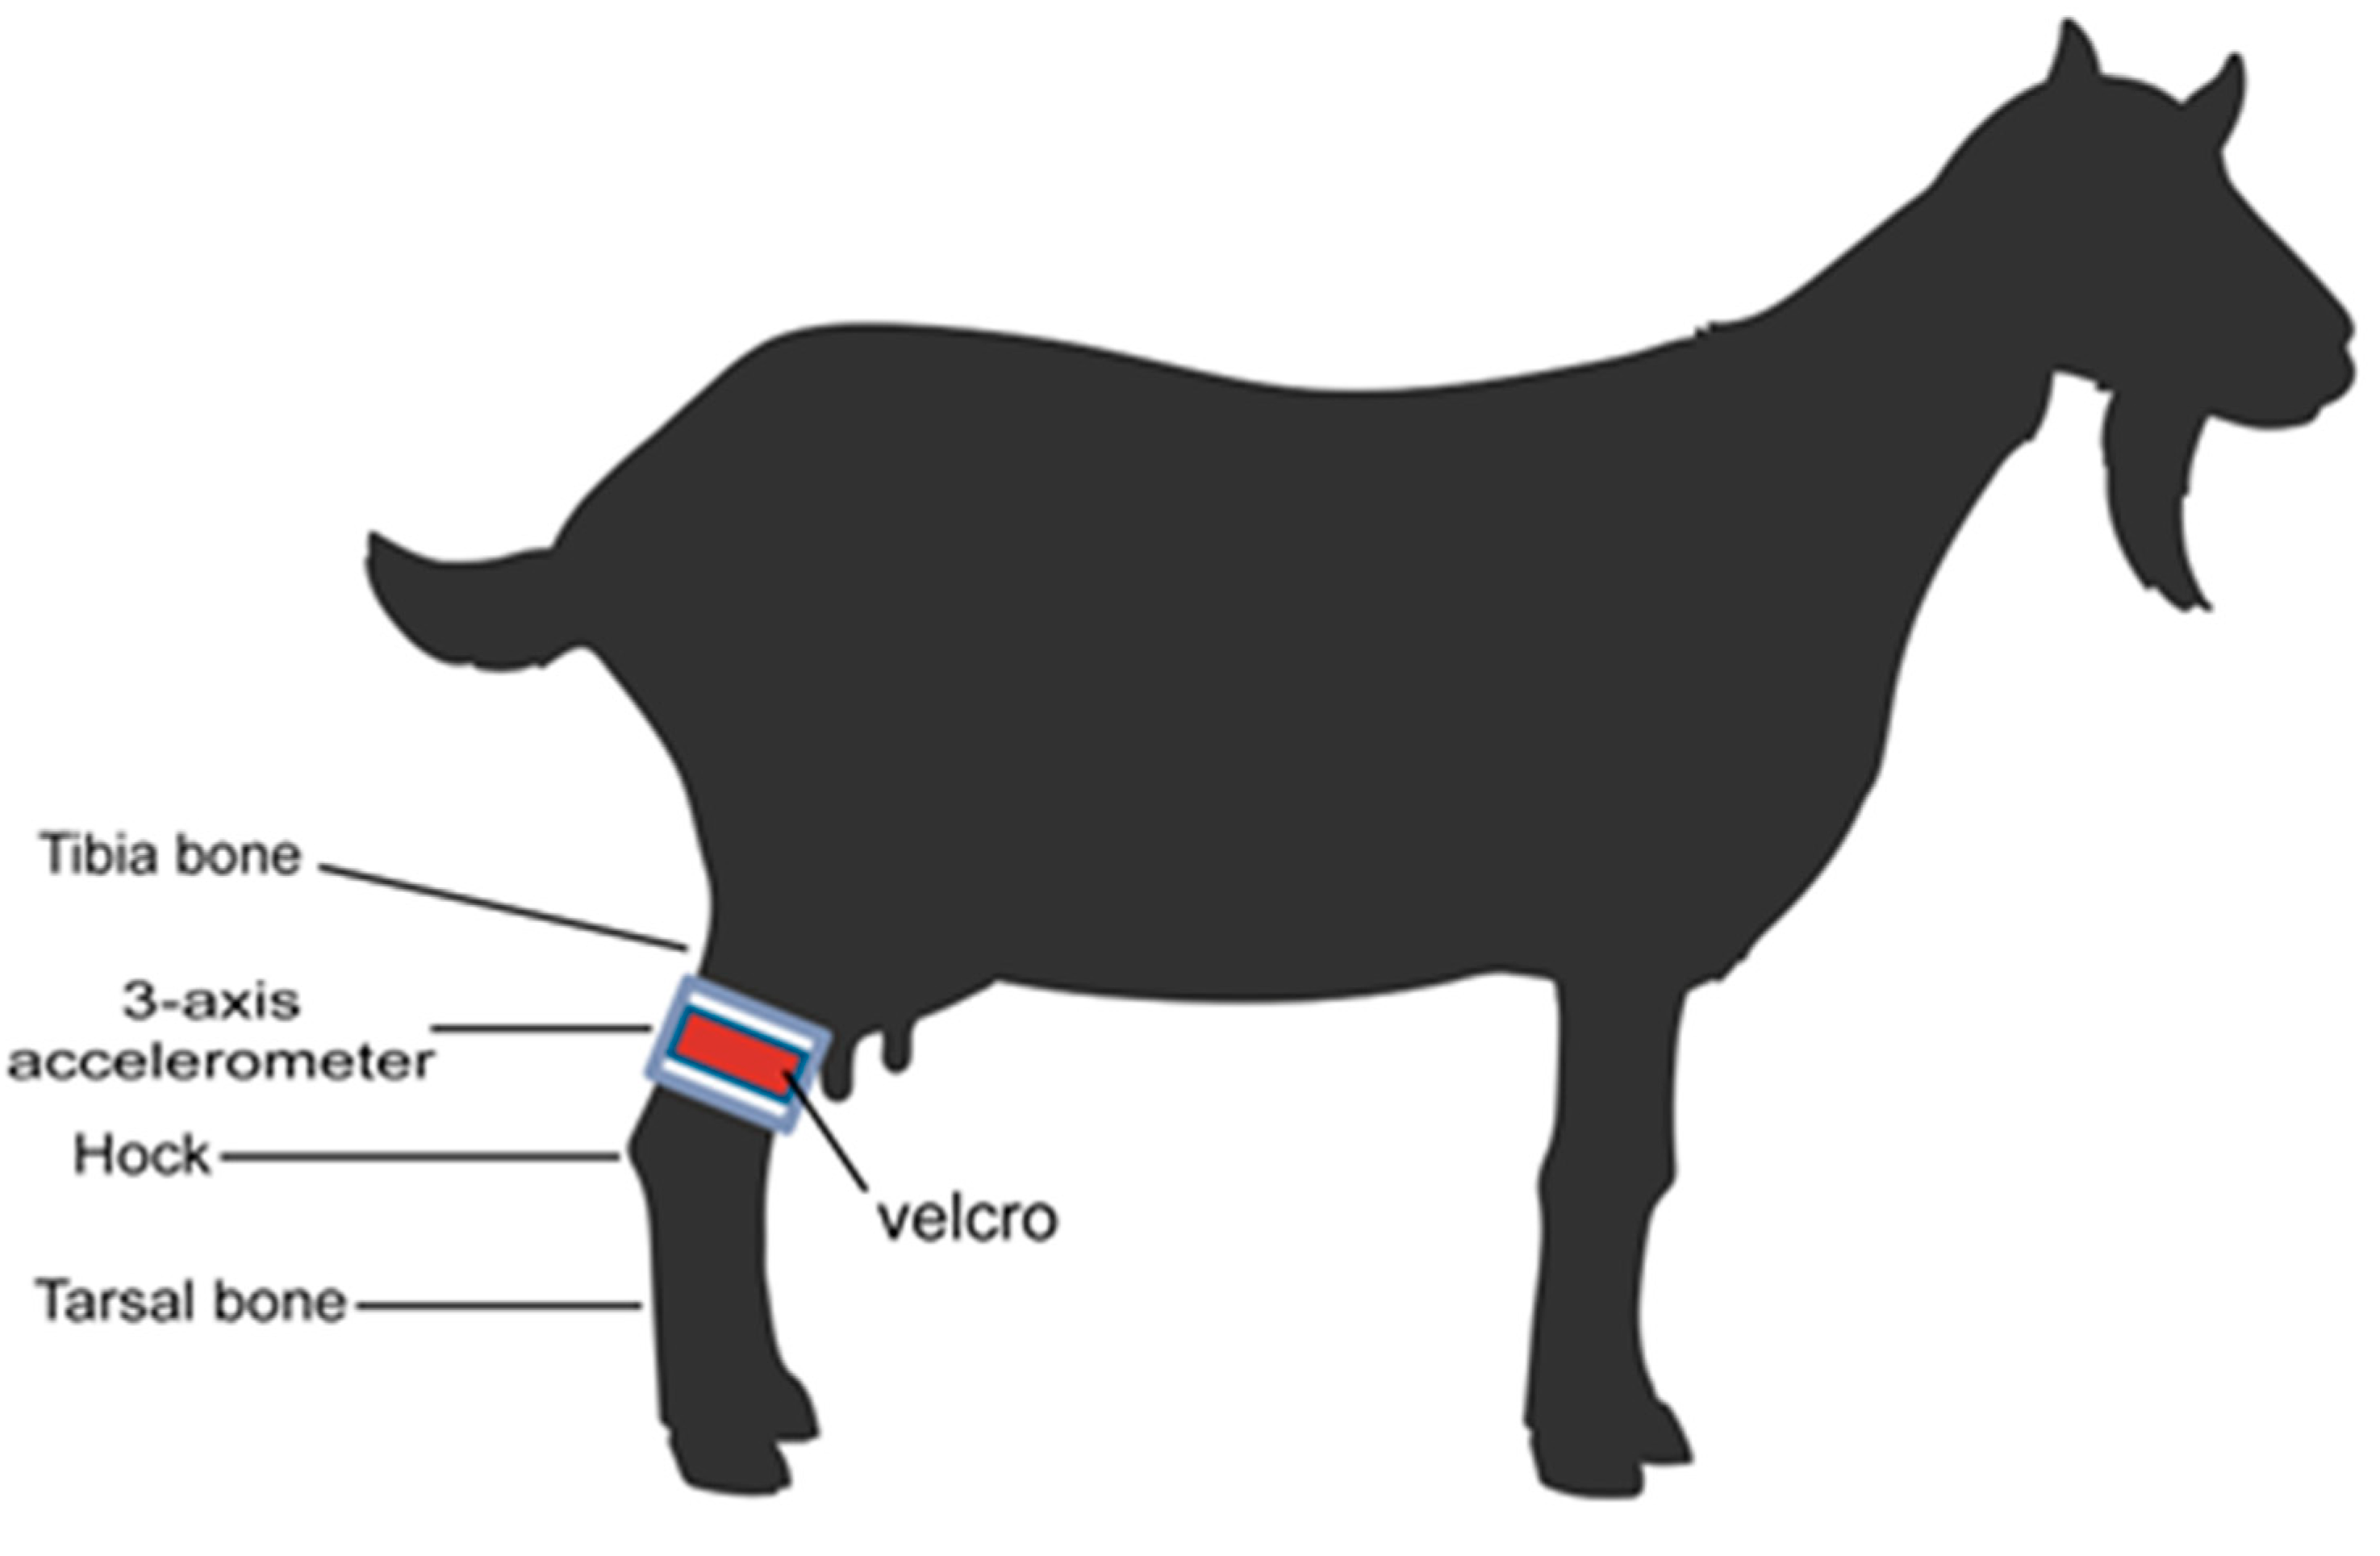
2.3. Attaching the Triaxial Acceleration Sensor
2.4. Acceleration Data Collection
2.5. ML for Labor Pain Classification
2.6. Calculation of the LPI
2.7. Selection of the Optimal Time Window
2.8. Calculation of the LPI Threshold for Classifying Parturition
3. Results
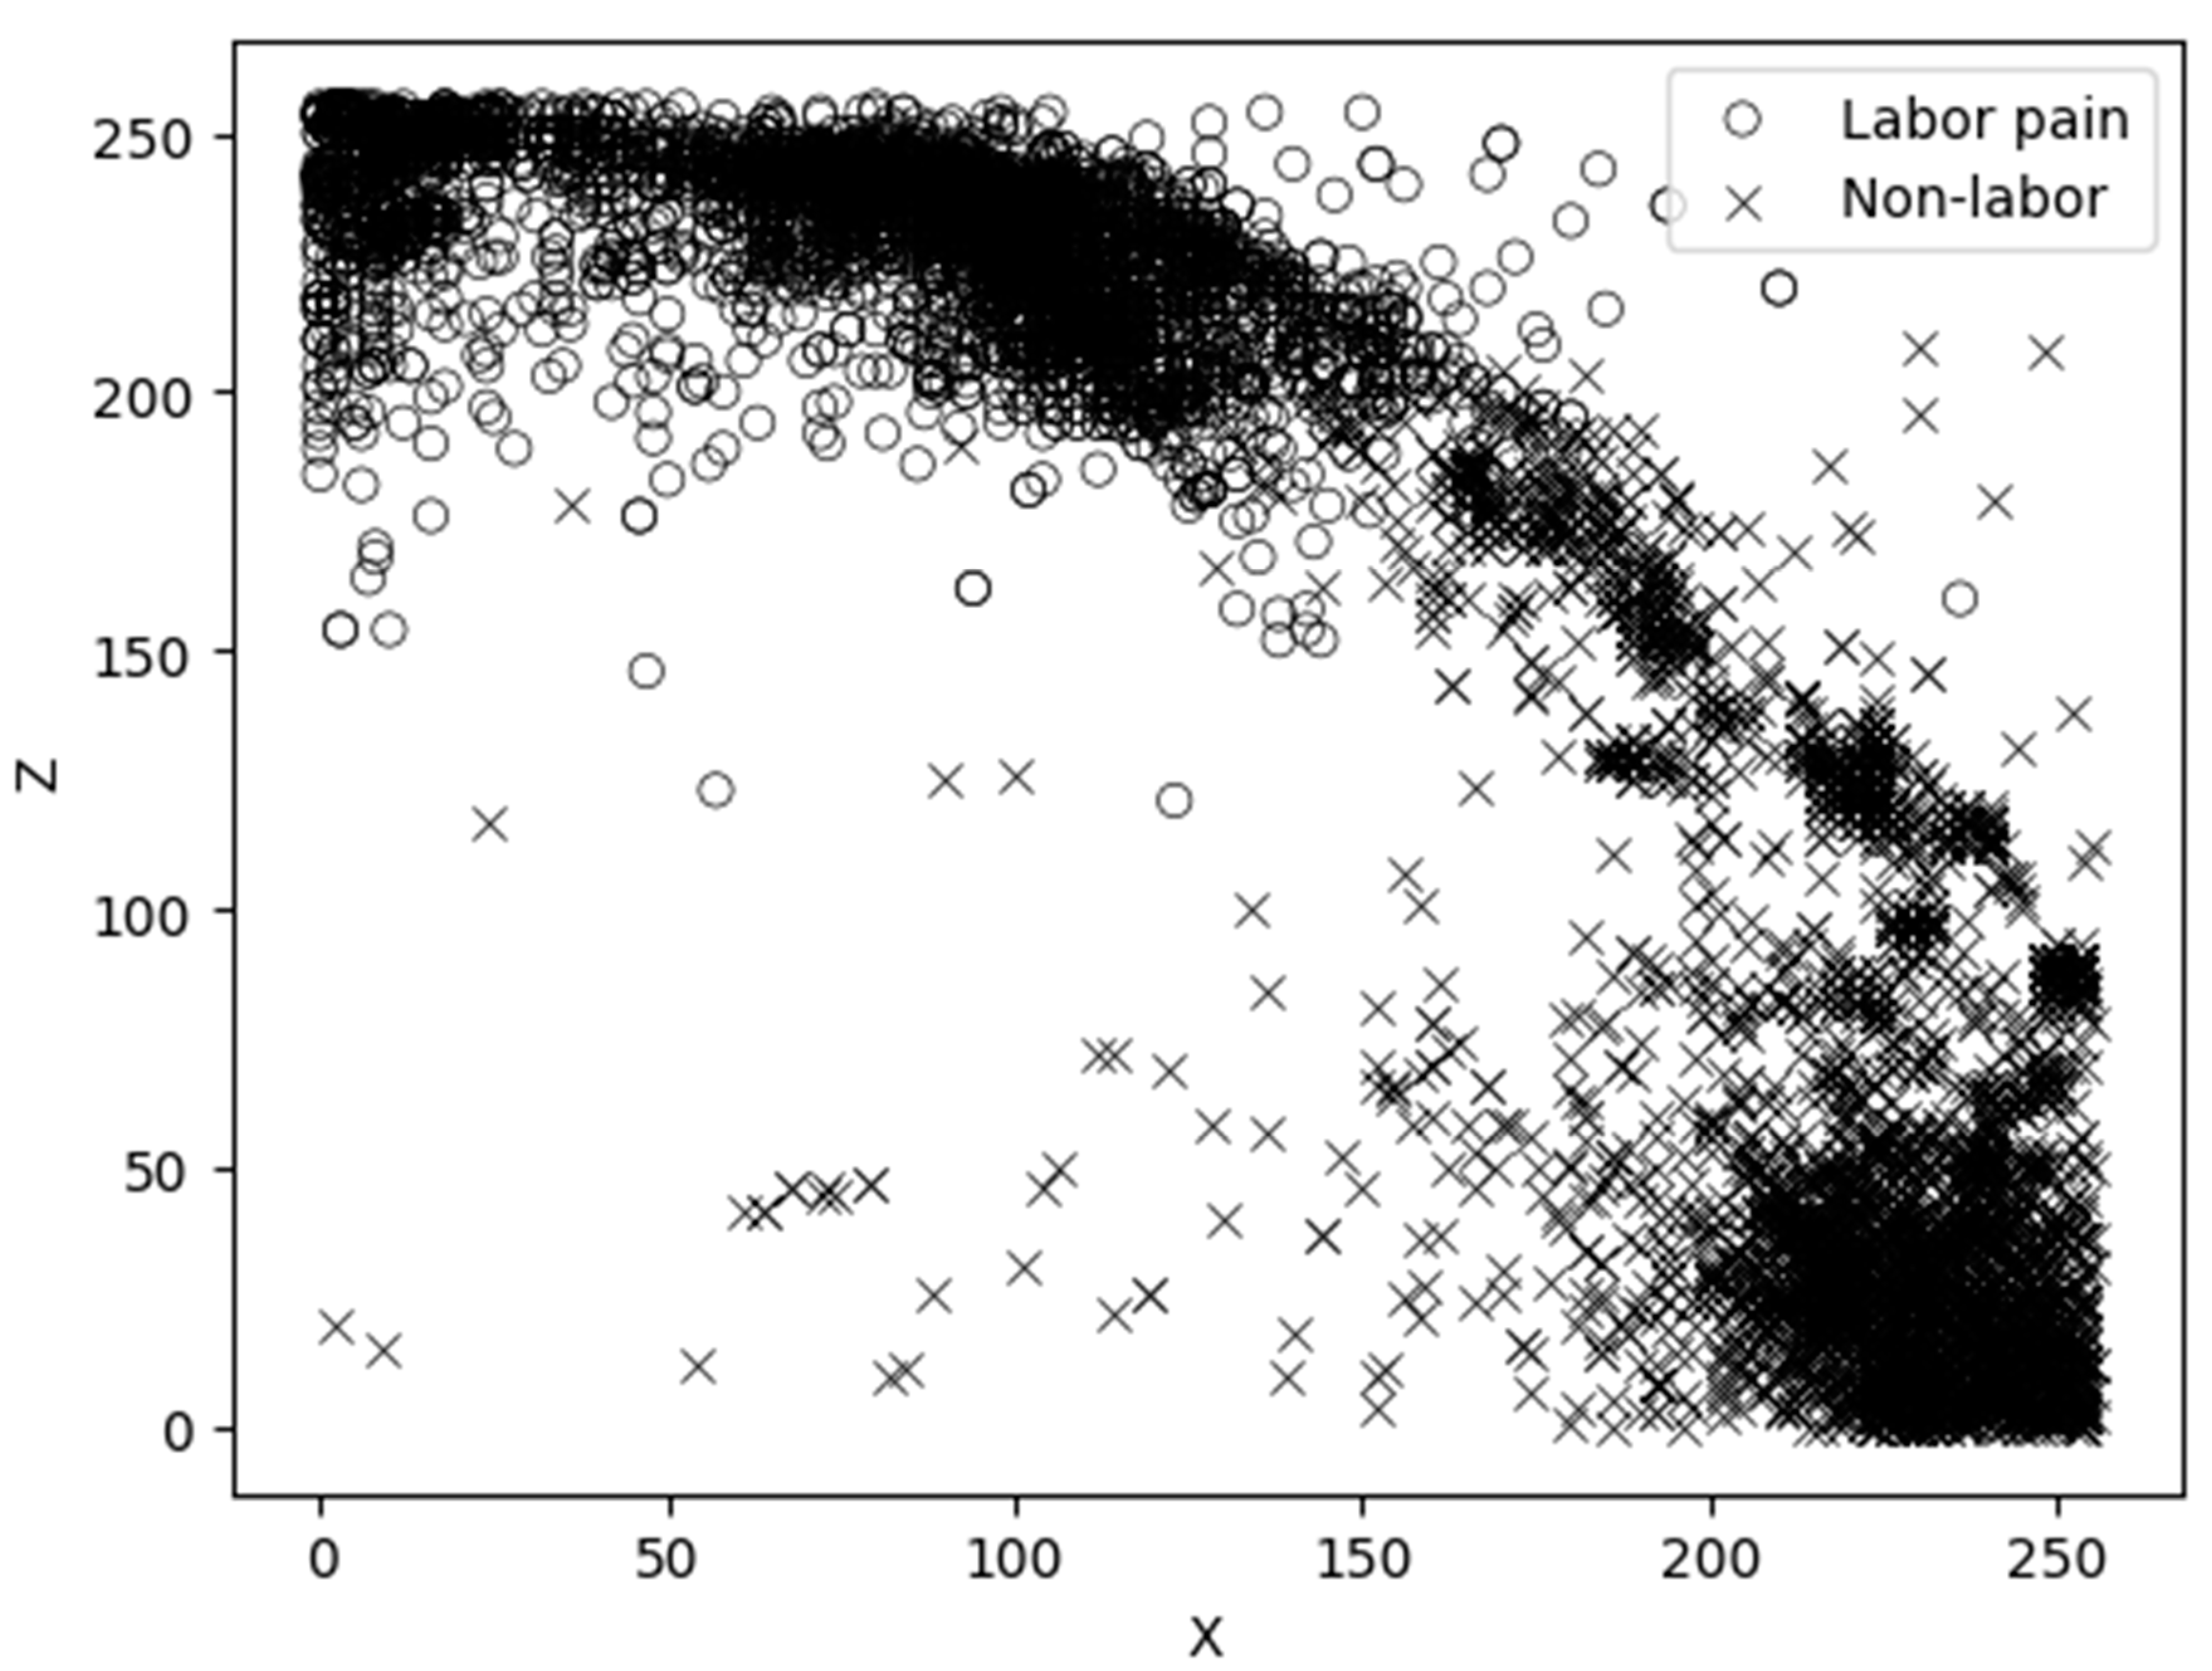
3.1. Selection of the Main Variables
3.2. Development of the Labor Behavior Classification Model
3.3. Selection of the Optimal Processing Time Window
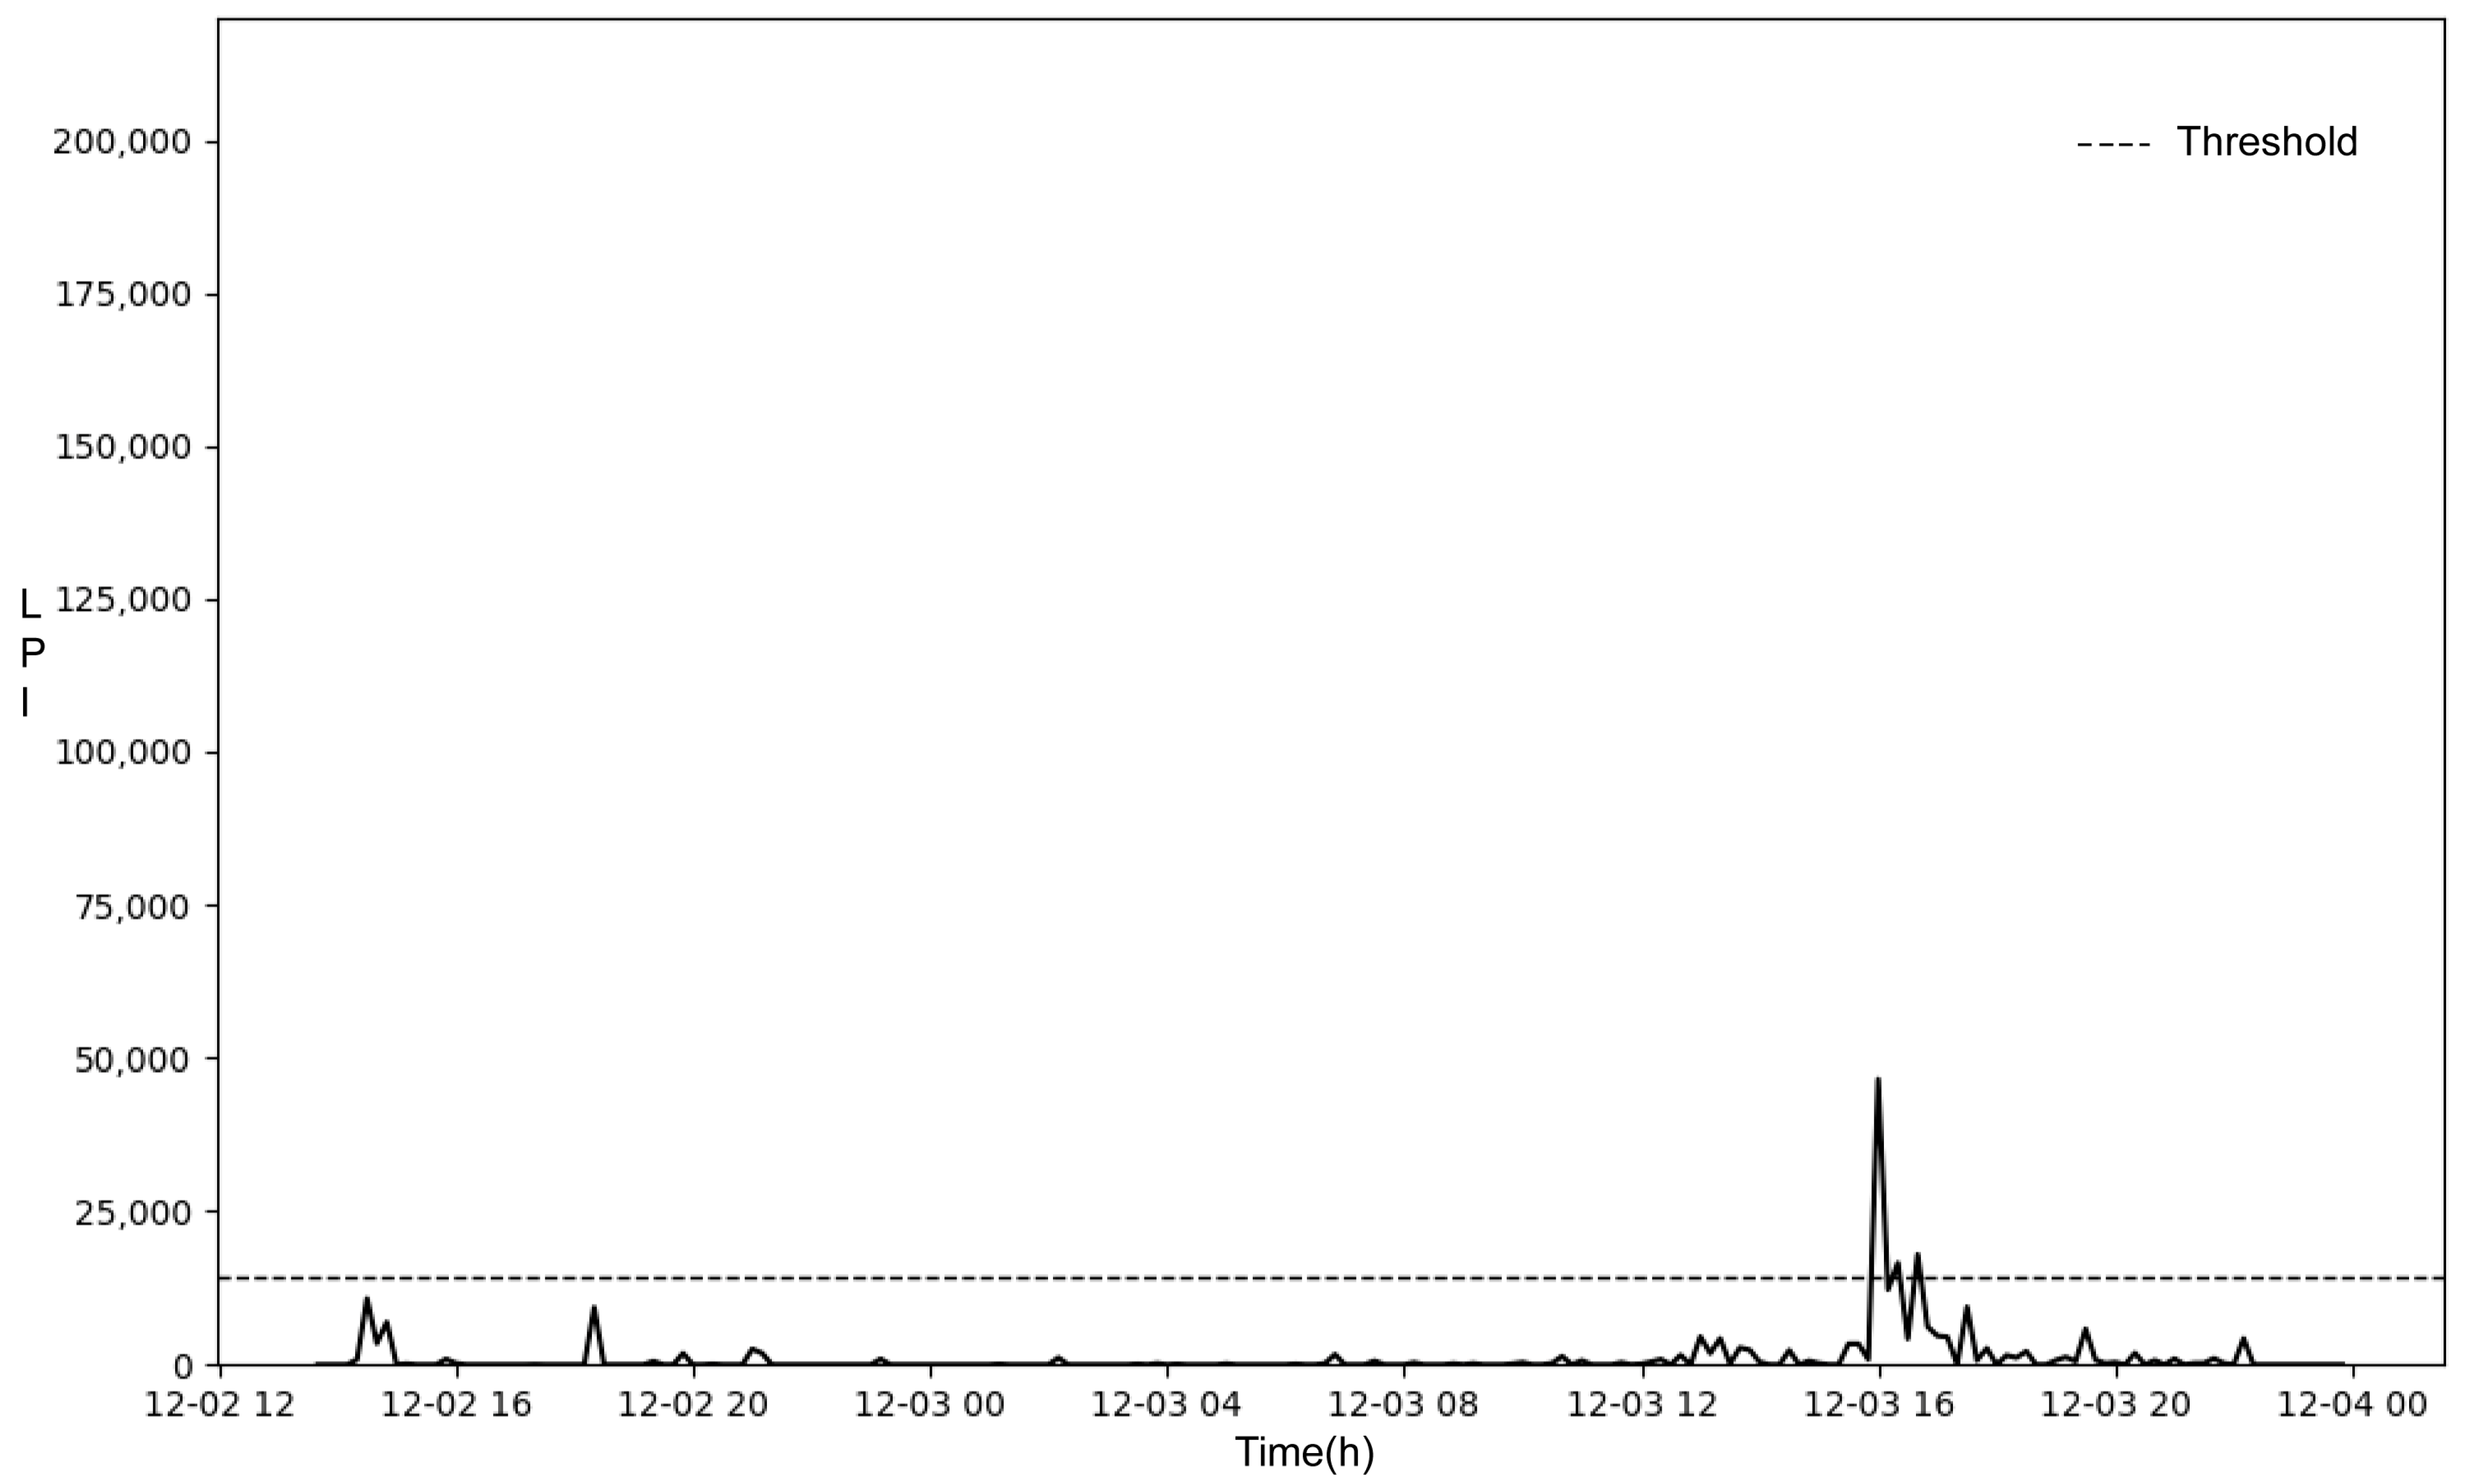
3.4. Determination of the Threshold for Parturition Classification
3.5. Calculation of the Parturition Detection Rate
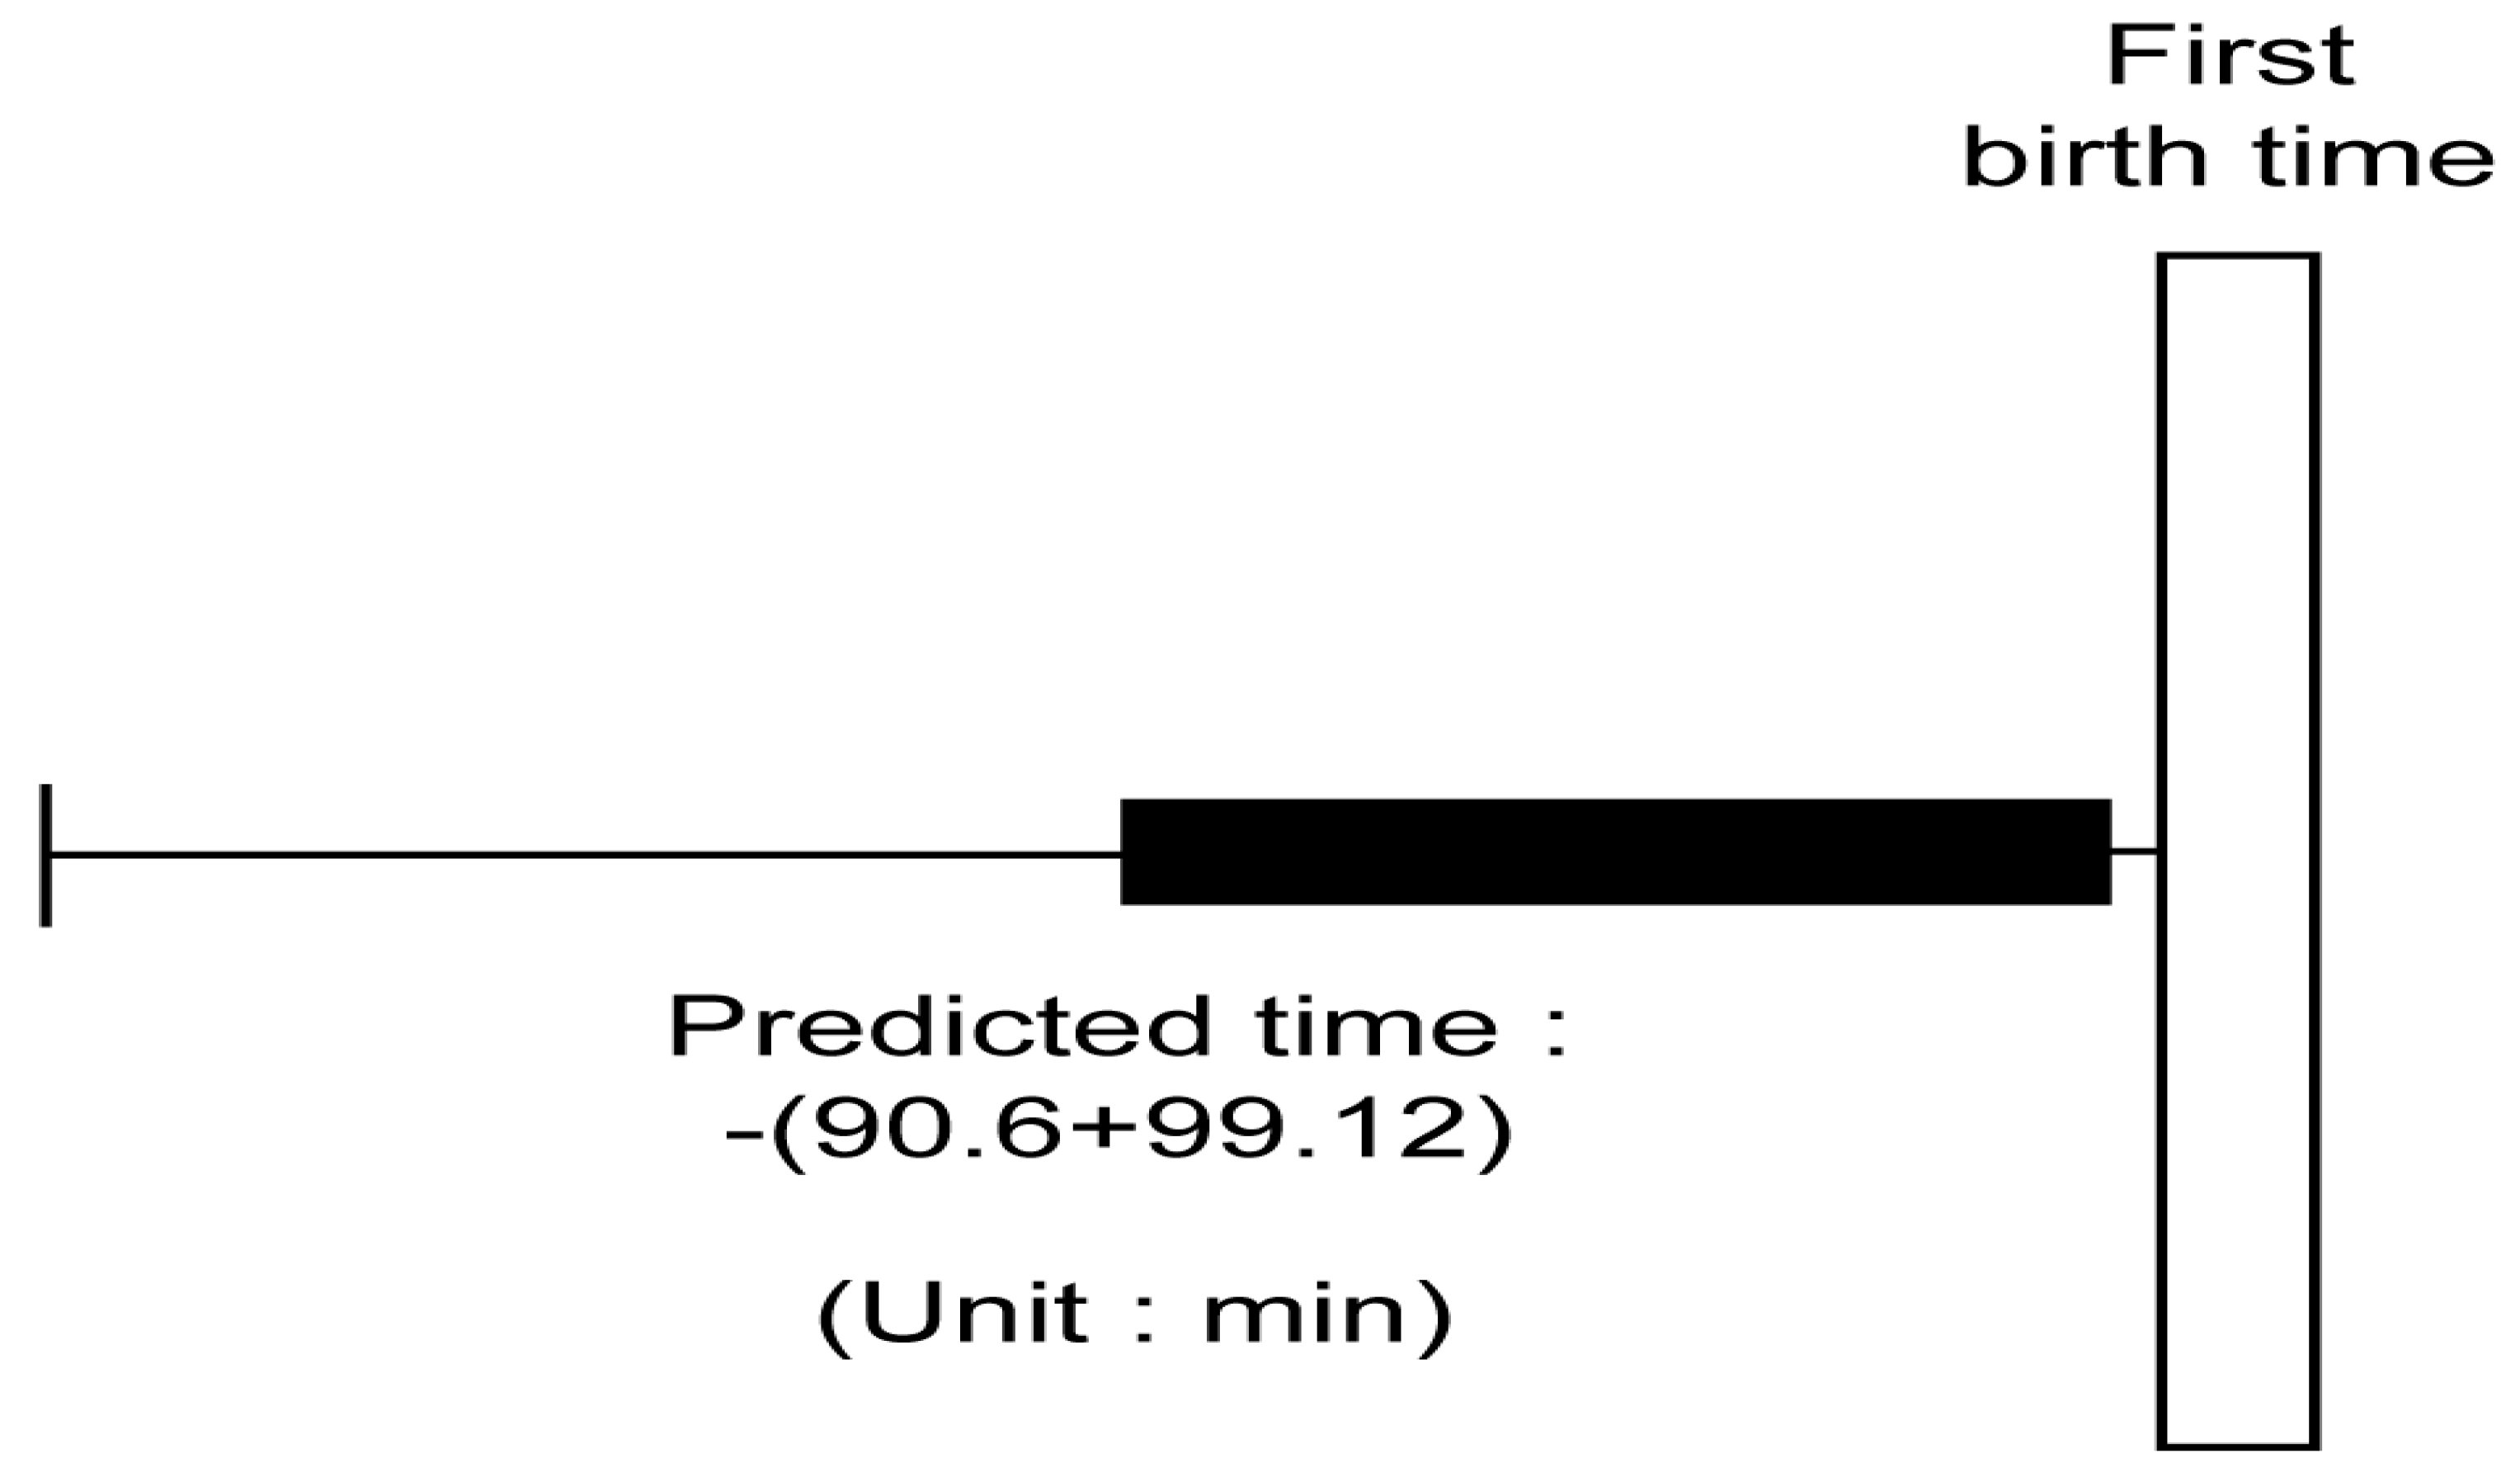
3.6. Determination of the Parturition Prediction Time
4. Discussion
5. Conclusions
Author Contributions
Funding
Institutional Review Board Statement
Informed Consent Statement
Data Availability Statement
Acknowledgments
Conflicts of Interest
References
- Kim, C.K.; Chung, Y.C. A study on the estrus and kid crop in Korean native goats. Korean J. Anim. Sci. 1979, 21, 127–133. [Google Scholar]
- Song, H.B.; Lee, J.I.; Kim, J.H.; King, K.O. Reproductive performance of the Korean native goats. J. Sci. Tech. Daegu Univ. 2000, 7, 235–246. [Google Scholar]
- Dwyer, C.M.; Conington, J.; Corbiere, F.; Holmøy, I.H.; Muri, K.; Nowak, R.; Rooke, J.; Vipond, J.; Gautier, J.M. Invited review: Improving neonatal survival in small ruminants: Science into practice. Animal 2016, 10, 449–459. [Google Scholar] [CrossRef]
- Chauhan, I.S.; Misra, S.S.; Kumar, A.; Gowane, G.R. Survival analysis of mortality in pre-weaning kids of Sirohi goat. Animal 2019, 13, 2896–2902. [Google Scholar] [CrossRef] [PubMed]
- Thiruvenkadani, A.K.; Karunanithp, K. Mortality and replacement rate of Tellicherry and its crossbred goats in Tamil Nadu. Indian J. Ofanimal Sci. 2007, 77, 590–594. [Google Scholar]
- Todd, C.G.; Bruce, B.; Deeming, L.; Zobel, G. Survival of replacement kids from birth to mating on commercial dairy goat farms in New Zealand. J. Dairy Sci. 2019, 102, 9382–9388. [Google Scholar] [CrossRef]
- Mandal, A.; Prasad, H.; Kumar, A.; Roy, R.; Sharma, N. Factors associated with lamb mortalities in Muzaffarnagari sheep. Small Rumin. Res. 2007, 71, 273–279. [Google Scholar] [CrossRef]
- Kaymakci, M. İleri Keçi Yetiştiriciliği (Advanced Goat Breeding); Mustafa Kemal University Faculty of Agriculture: Bornova, Turkey; ISBN 978-605-85998-0-2. (In Turkish)
- Tuncer, S.S.; Sireli, H.D.; Tatar, A.M. Behavioral patterns of goats. In Proceedings of the 7th International Scientific Agriculture Symposium Agrosym, Jahorina, Bosnia and Herzegovina, 6–9 October 2016; Available online: https://www.cabidigitallibrary.org/doi/pdf/10.5555/20173053982 (accessed on 12 February 2024).
- Brown, D.D.; Kays, R.; Wikelski, M.; Wilson, R.; Klimley, A.P. Observing the unwatchable through acceleration logging of animal behavior. Anim. Biotelemetry 2013, 1, 1–16. [Google Scholar] [CrossRef]
- Shepard, E.L.; Wilson, R.P.; Quintana, F.; Laich, A.G.; Liebsch, N.; Albareda, D.A.; Halsey, L.G.; Gleiss, A.; Morgan, D.T.; Myers, A.E.; et al. Identification of animal movement patterns using tri-axial accelerometry. Endanger. Species Res. 2008, 10, 47–60. [Google Scholar] [CrossRef]
- Laich, A.G.; Wilson, R.P.; Quintana, F.; Shepard, E.L. Identification of imperial cormorant Phalacrocorax atriceps behaviour using accelerometers. Endanger. Species Res. 2008, 10, 29–37. [Google Scholar] [CrossRef]
- Gurule, S.C.; Tobin, C.T.; Bailey, D.W.; Gifford, J.A.H. Evaluation of the tri-axial accelerometer to identify and predict parturition-related activities of Debouilletewes in an intensive setting. Appl. Anim. Behav. Sci. 2021, 237, 105296. [Google Scholar] [CrossRef]
- Fogarty, E.S.; Swain, D.L.; Cronin, G.M.; Moraes, L.E.; Trotter, M. Can accelerometer ear tags identify behavioural changes in sheep associated with parturition? Anim. Reprod. Sci. 2020, 216, 106345. [Google Scholar] [CrossRef] [PubMed]
- Jung, Y.; Chang, H.; Yoon, M. Development of a foaling alarm system using an accelerometer. J. Anim. Sci. Technol. 2022, 64, 1237. [Google Scholar] [CrossRef]
- Addison, W.E.; Baker, E. Agonistic behavior and social organization in a herd of goats as affected by the introduction of non-members. Appl. Anim. Ethol. 1982, 8, 527–535. [Google Scholar] [CrossRef]
- Andersen, I.L.; Tønnesen, H.; Estevez, I.; Cronin, G.M.; Bøe, K.E. The relevance of group size on goats’ social dynamics in a production environment. Appl. Anim. Behav. Sci. 2011, 134, 136–143. [Google Scholar] [CrossRef]
- Vas, J.; Andersen, I.L. Density-dependent spacing behaviour and activity budget in pregnant, domestic goats (Capra hircus). PLoS ONE 2015, 10, e0144583. [Google Scholar] [CrossRef] [PubMed]
- Zobel, G.; Weary, D.M.; Leslie, K.; Chapinal, N.; Von Keyserlingk, M.A.G. Validation of data loggers for recording lying behavior in dairy goats. J. Dairy Sci. 2015, 98, 1082–1108. [Google Scholar] [CrossRef] [PubMed]
- Maurmann, I.; Greiner, B.A.; von Korn, S.; Bernau, M. Lying behaviour in dairy goats: Effects of a new automated feeding system assessed by accelerometer technology. Animals 2021, 11, 2370. [Google Scholar] [CrossRef]
- Anous, M.R. A comparative study of muscle-bone relationships in the hind limb of goats and sheep. Anim. Sci. 1991, 53, 81–87. [Google Scholar] [CrossRef]
- Rifkin, R.E.; Grzeskowiak, R.M.; Mulon, P.Y.; Adair, H.S.; Biris, A.S.; Dhar, M.; Anderson, D.E. Use of a pressure-sensing walkway system for biometric assessment of gait characteristics in goats. PLoS ONE 2019, 14, e0223771. [Google Scholar] [CrossRef]
- Bowers, K.M.; Terrones, L.D.; Croy, E.G.; Mulon, P.Y.; Adair, H.S.; Anderson, D.E. Assessment of gait following locking plate fixation of a tibial segmental defect and cast immobilization in goats. Biomechanics 2022, 2, 575–590. [Google Scholar] [CrossRef]
- Tosto, M.S.L.; Santos, S.A.; da Costa Pinto Filho, R.; de Carvalho Rodrigues, T.C.G.; Nicory, I.M.C.; de Carvalho, G.G.P.; Bittencourt, R.F.; Ayres, M.C.C.; de Jesus Pereira, T.C. Metabolic and behavior changings during the transition period as predictors of calving proximity and welfare of dairy goats. Vet. Anim. Sci. 2021, 11, 100168. [Google Scholar] [CrossRef]
- Lickliter, R.E. Behavior associated with parturition in the domestic goat. Appl. Anim. Behav. Sci. 1985, 13, 335–345. [Google Scholar] [CrossRef]
- Maurmann, I.; Bernau, M. Circadian Lying Behaviour Assessed in a Commercial Mixed Horned Dairy Goat Herd. Ruminants 2023, 3, 111–120. [Google Scholar] [CrossRef]
- Mattachini, G.; Antler, A.; Riva, E.; Arbel, A.; Provolo, G. Automated measurement of lying behavior for monitoring the comfort and welfare of lactating dairy cows. Livest. Sci. 2013, 158, 145–150. [Google Scholar] [CrossRef]
- Zufferey, R.; Minnig, A.; Thomann, B.; Zwygart, S.; Keil, N.; Schüpbach, G.; Miserez, R.; Zanolari, P.; Stucki, D. Animal-based indicators for on-farm welfare assessment in sheep. Animals 2021, 11, 2973. [Google Scholar] [CrossRef] [PubMed]
- Muhammad, M.; Stokes, J.E.; Manning, L. Positive Aspects of Welfare in Sheep: Current Debates and Future Opportunities. Animals 2022, 12, 3265. [Google Scholar] [CrossRef] [PubMed]
- Patt, A.; Gygax, L.; Wechsler, B.; Hillmann, E.; Palme, R.; Keil, N.M. The introduction of individual goats into small established groups has serious negative effects on the introduced goat but not on resident goats. Appl. Anim. Behav. Sci. 2012, 138, 47–59. [Google Scholar] [CrossRef]
- Andersen, I.L.; Bøe, K.E. Resting pattern and social interactions in goats—The impact of size and organisation of lying space. Appl. Anim. Behav. Sci. 2007, 108, 89–103. [Google Scholar] [CrossRef]
- Battini, M.; Barbieri, S.; Vieira, A.; Stilwell, G.; Mattiello, S. Results of testing the prototype of the AWIN welfare assessment protocol for dairy goats in 30 intensive farms in Northern Italy. Ital. J. Anim. Sci. 2016, 15, 283–293. [Google Scholar] [CrossRef]


| Precision | Recall | F-1 Score | Support | |
|---|---|---|---|---|
| Non-labor (0) | 0.99 | 0.93 | 0.96 | 782 |
| Labor (1) | 0.93 | 0.99 | 0.96 | 794 |
| Accuracy | 0.96 | 1576 | ||
| Macro average | 0.96 | 0.96 | 0.96 | 1576 |
| Weightedaverage | 0.96 | 0.96 | 0.96 | 1576 |
| Precision | Recall | F-1 Score | Support | |
|---|---|---|---|---|
| Non-labor (0) | 0.96 | 0.97 | 0.96 | 782 |
| Labor (1) | 0.97 | 0.96 | 0.96 | 794 |
| Accuracy | 0.96 | 1576 | ||
| Macro average | 0.96 | 0.96 | 0.96 | 1576 |
| Weightedaverage | 0.96 | 0.96 | 0.96 | 1576 |
| Time Window (min) | Labor | Non-Labor | A–B | Significance | ||||
|---|---|---|---|---|---|---|---|---|
| Mean | Standard Deviation | Mean − Standard Deviation (A) | Mean | Standard Deviation | Mean + Standard Deviation (B) | |||
| 8 | 69,359.59 | 66,253.97 | 3105.62 | 3550.65 | 1781.54 | 5332.18 | −2226.57 | p < 0.001 |
| 10 | 77,780.06 | 68,137.81 | 9642.25 | 4807.18 | 3144.58 | 7951.75 | 1690.49 | p < 0.001 |
| 12 | 102,674.63 | 99,319.32 | 3355.31 | 6248.59 | 3222.90 | 9471.49 | −6116.18 | p < 0.001 |
| 14 | 107,822.07 | 102,600.46 | 5221.60 | 7547.88 | 4149.09 | 11.696.97 | −6475.37 | p < 0.001 |
Disclaimer/Publisher’s Note: The statements, opinions and data contained in all publications are solely those of the individual author(s) and contributor(s) and not of MDPI and/or the editor(s). MDPI and/or the editor(s) disclaim responsibility for any injury to people or property resulting from any ideas, methods, instructions or products referred to in the content. |
© 2024 by the authors. Licensee MDPI, Basel, Switzerland. This article is an open access article distributed under the terms and conditions of the Creative Commons Attribution (CC BY) license (https://creativecommons.org/licenses/by/4.0/).
Share and Cite
Kim, H.; Kim, H.; Kim, W.H.; Min, W.; Kim, G.; Chang, H. Development of a Parturition Detection System for Korean Native Black Goats. Animals 2024, 14, 634. https://doi.org/10.3390/ani14040634
Kim H, Kim H, Kim WH, Min W, Kim G, Chang H. Development of a Parturition Detection System for Korean Native Black Goats. Animals. 2024; 14(4):634. https://doi.org/10.3390/ani14040634
Chicago/Turabian StyleKim, Heungsu, Hyunse Kim, Woo H. Kim, Wongi Min, Geonwoo Kim, and Honghee Chang. 2024. "Development of a Parturition Detection System for Korean Native Black Goats" Animals 14, no. 4: 634. https://doi.org/10.3390/ani14040634
APA StyleKim, H., Kim, H., Kim, W. H., Min, W., Kim, G., & Chang, H. (2024). Development of a Parturition Detection System for Korean Native Black Goats. Animals, 14(4), 634. https://doi.org/10.3390/ani14040634


