
Behavioural Indicators of Intra- and Inter-Specific Competition: Sheep Co-Grazing with Guanaco in the Patagonian Steppe


Abstract
:Simple Summary
Abstract
1. Introduction
2. Materials and Methods
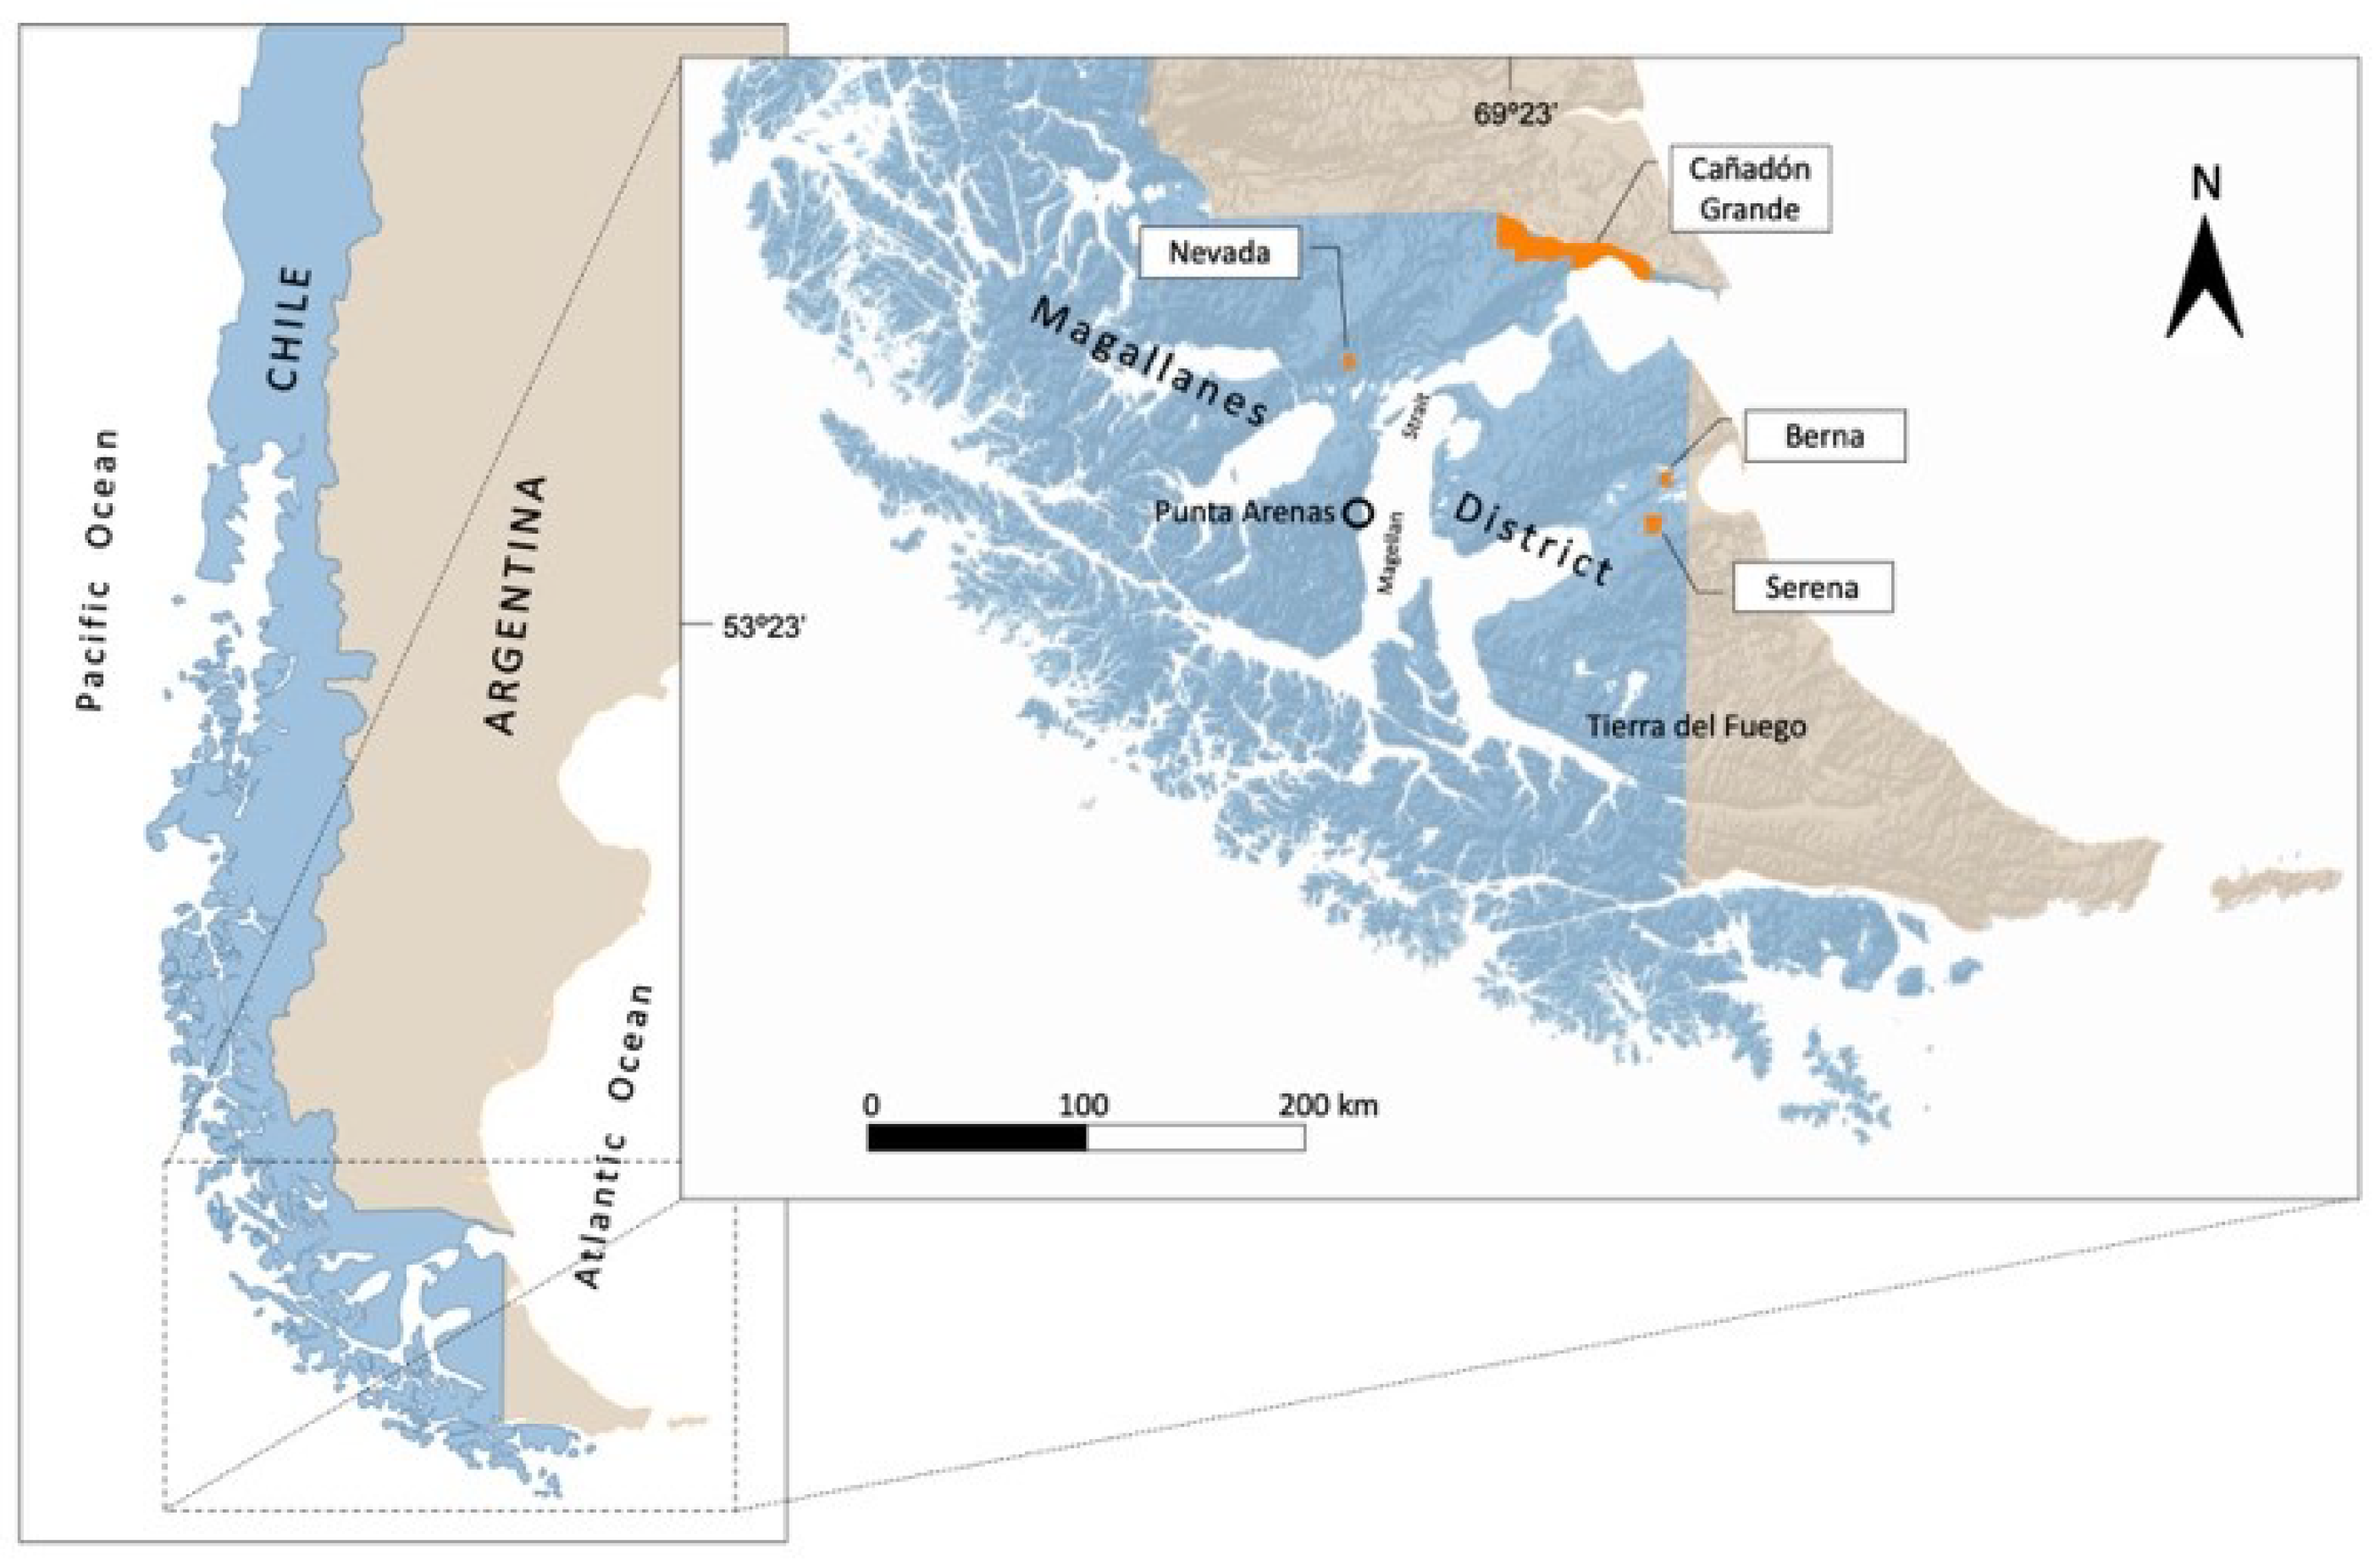
2.1. Study Sites
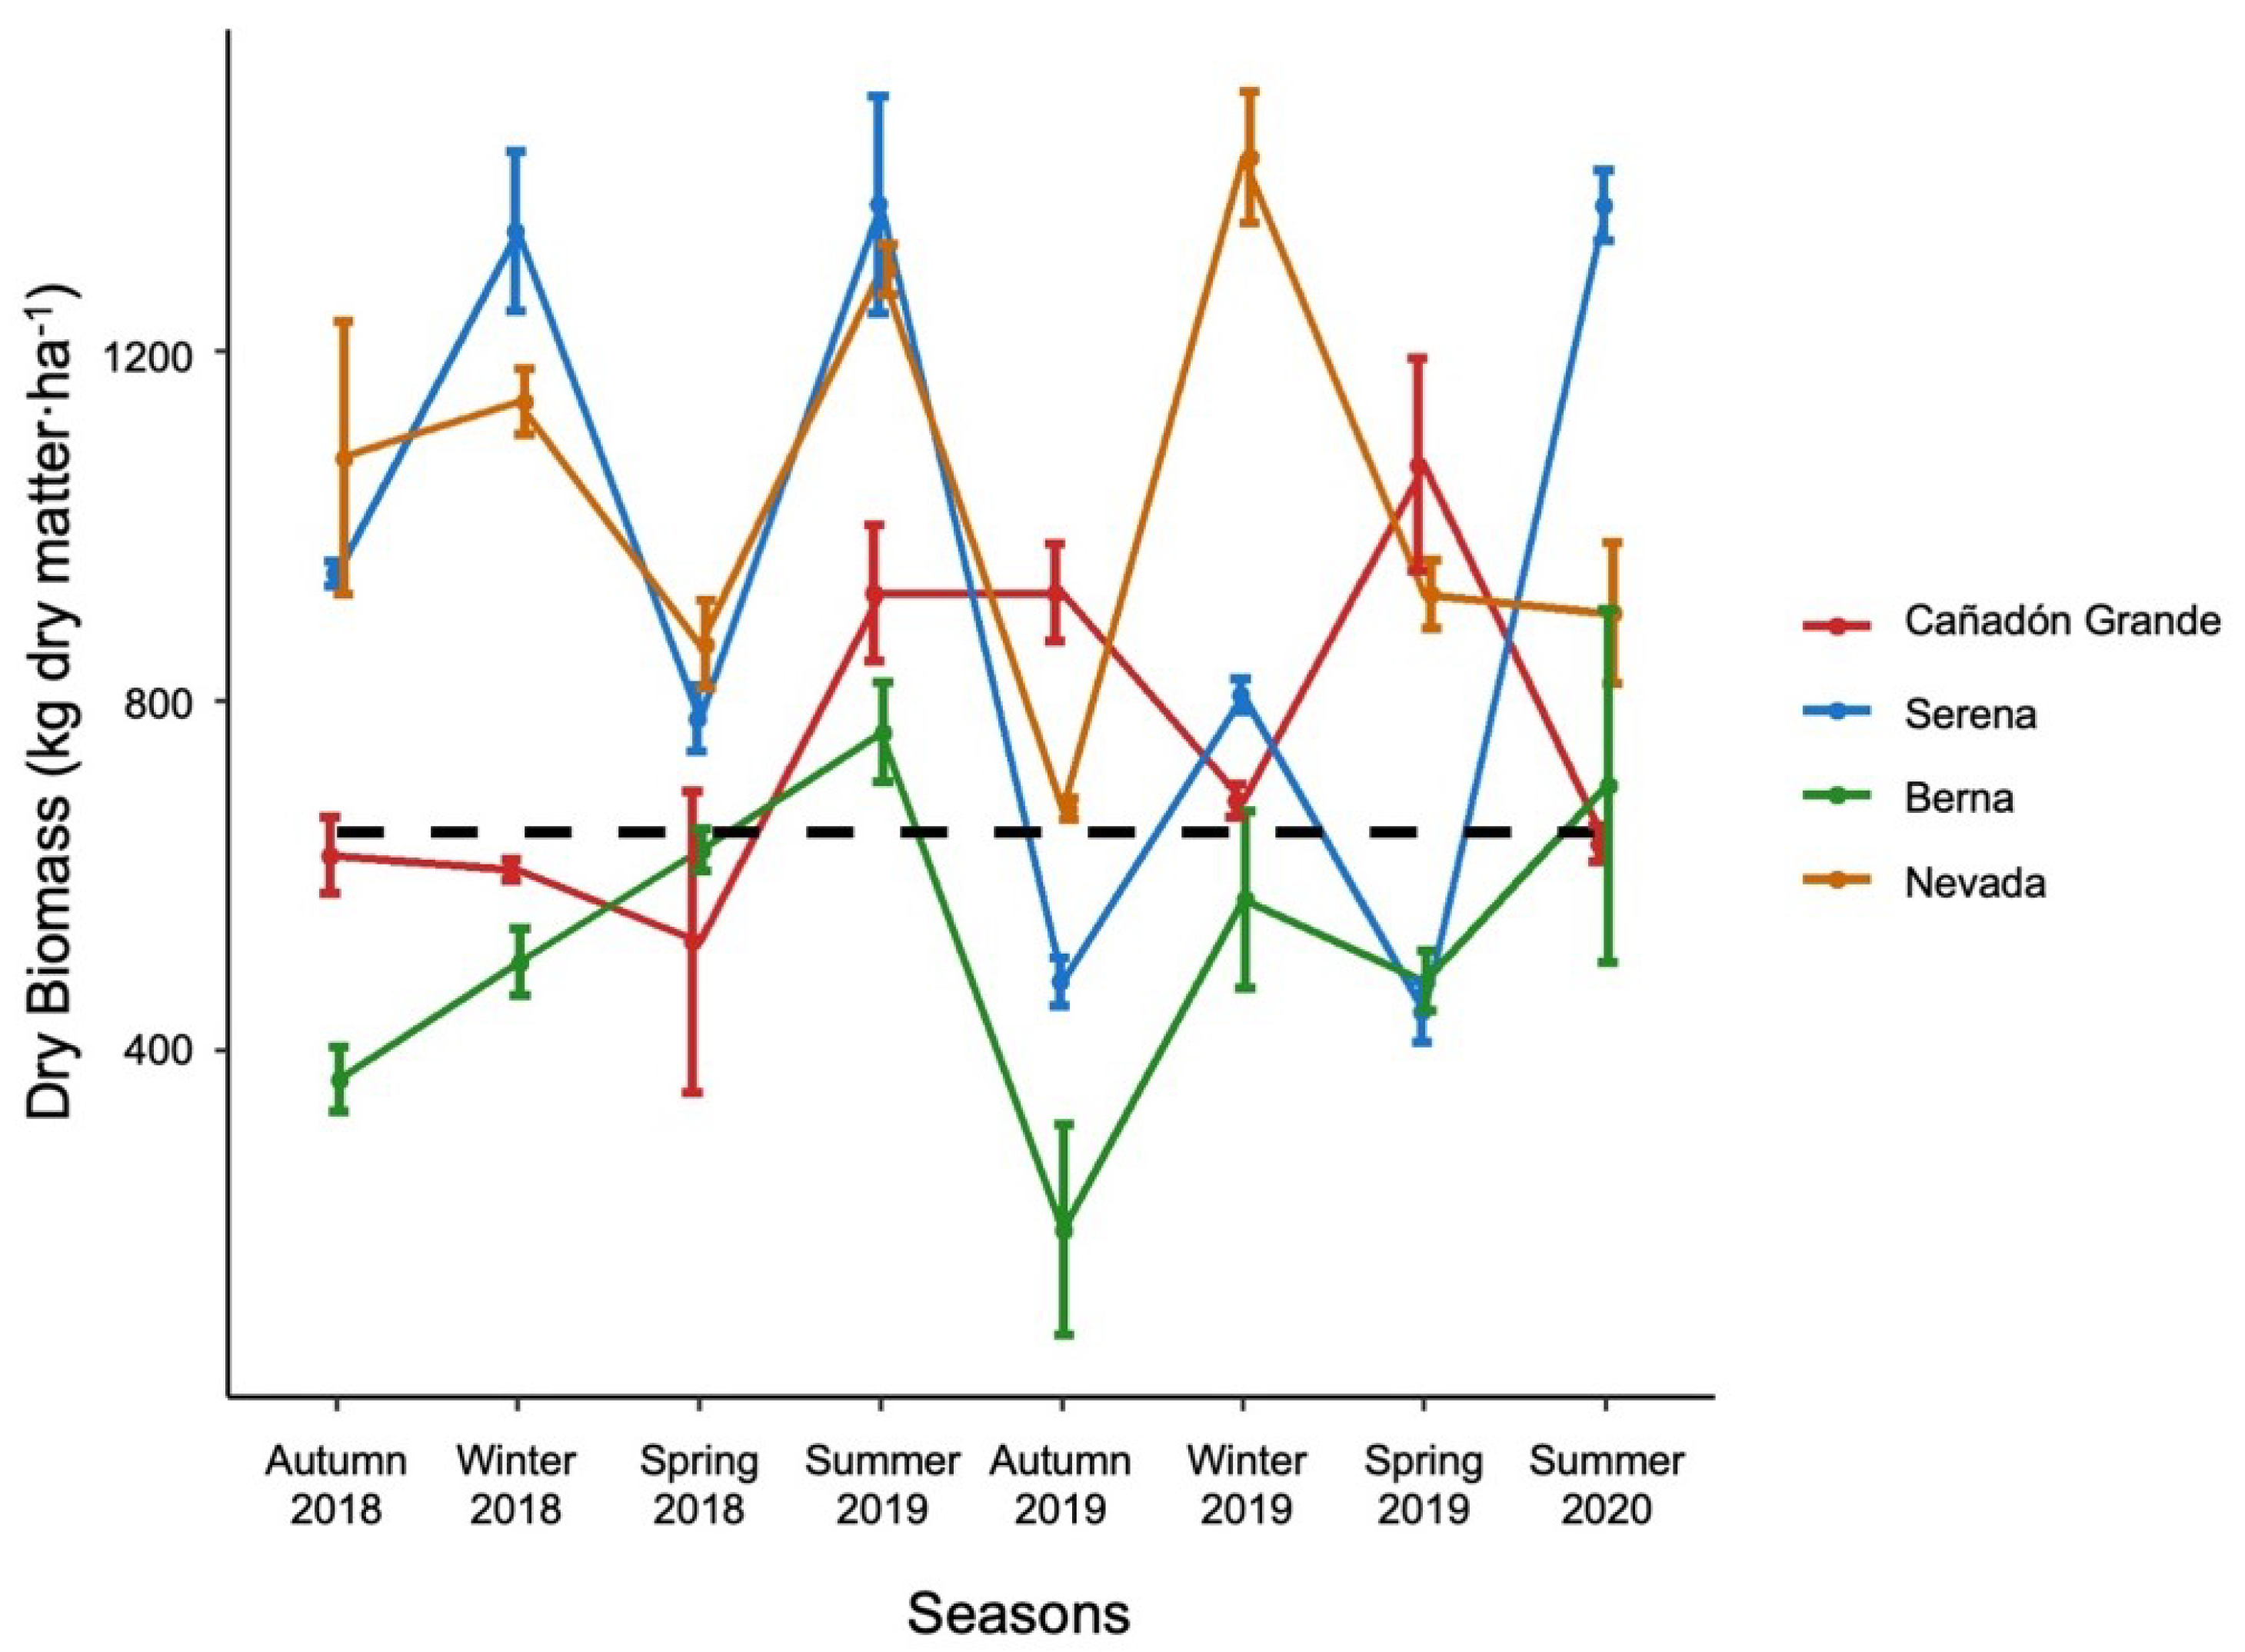
2.2. Food Seasonal Availability and Variation
2.3. Sheep Density, Stocking Rate and Guanaco Density
2.4. Sheep Behavioural Variation
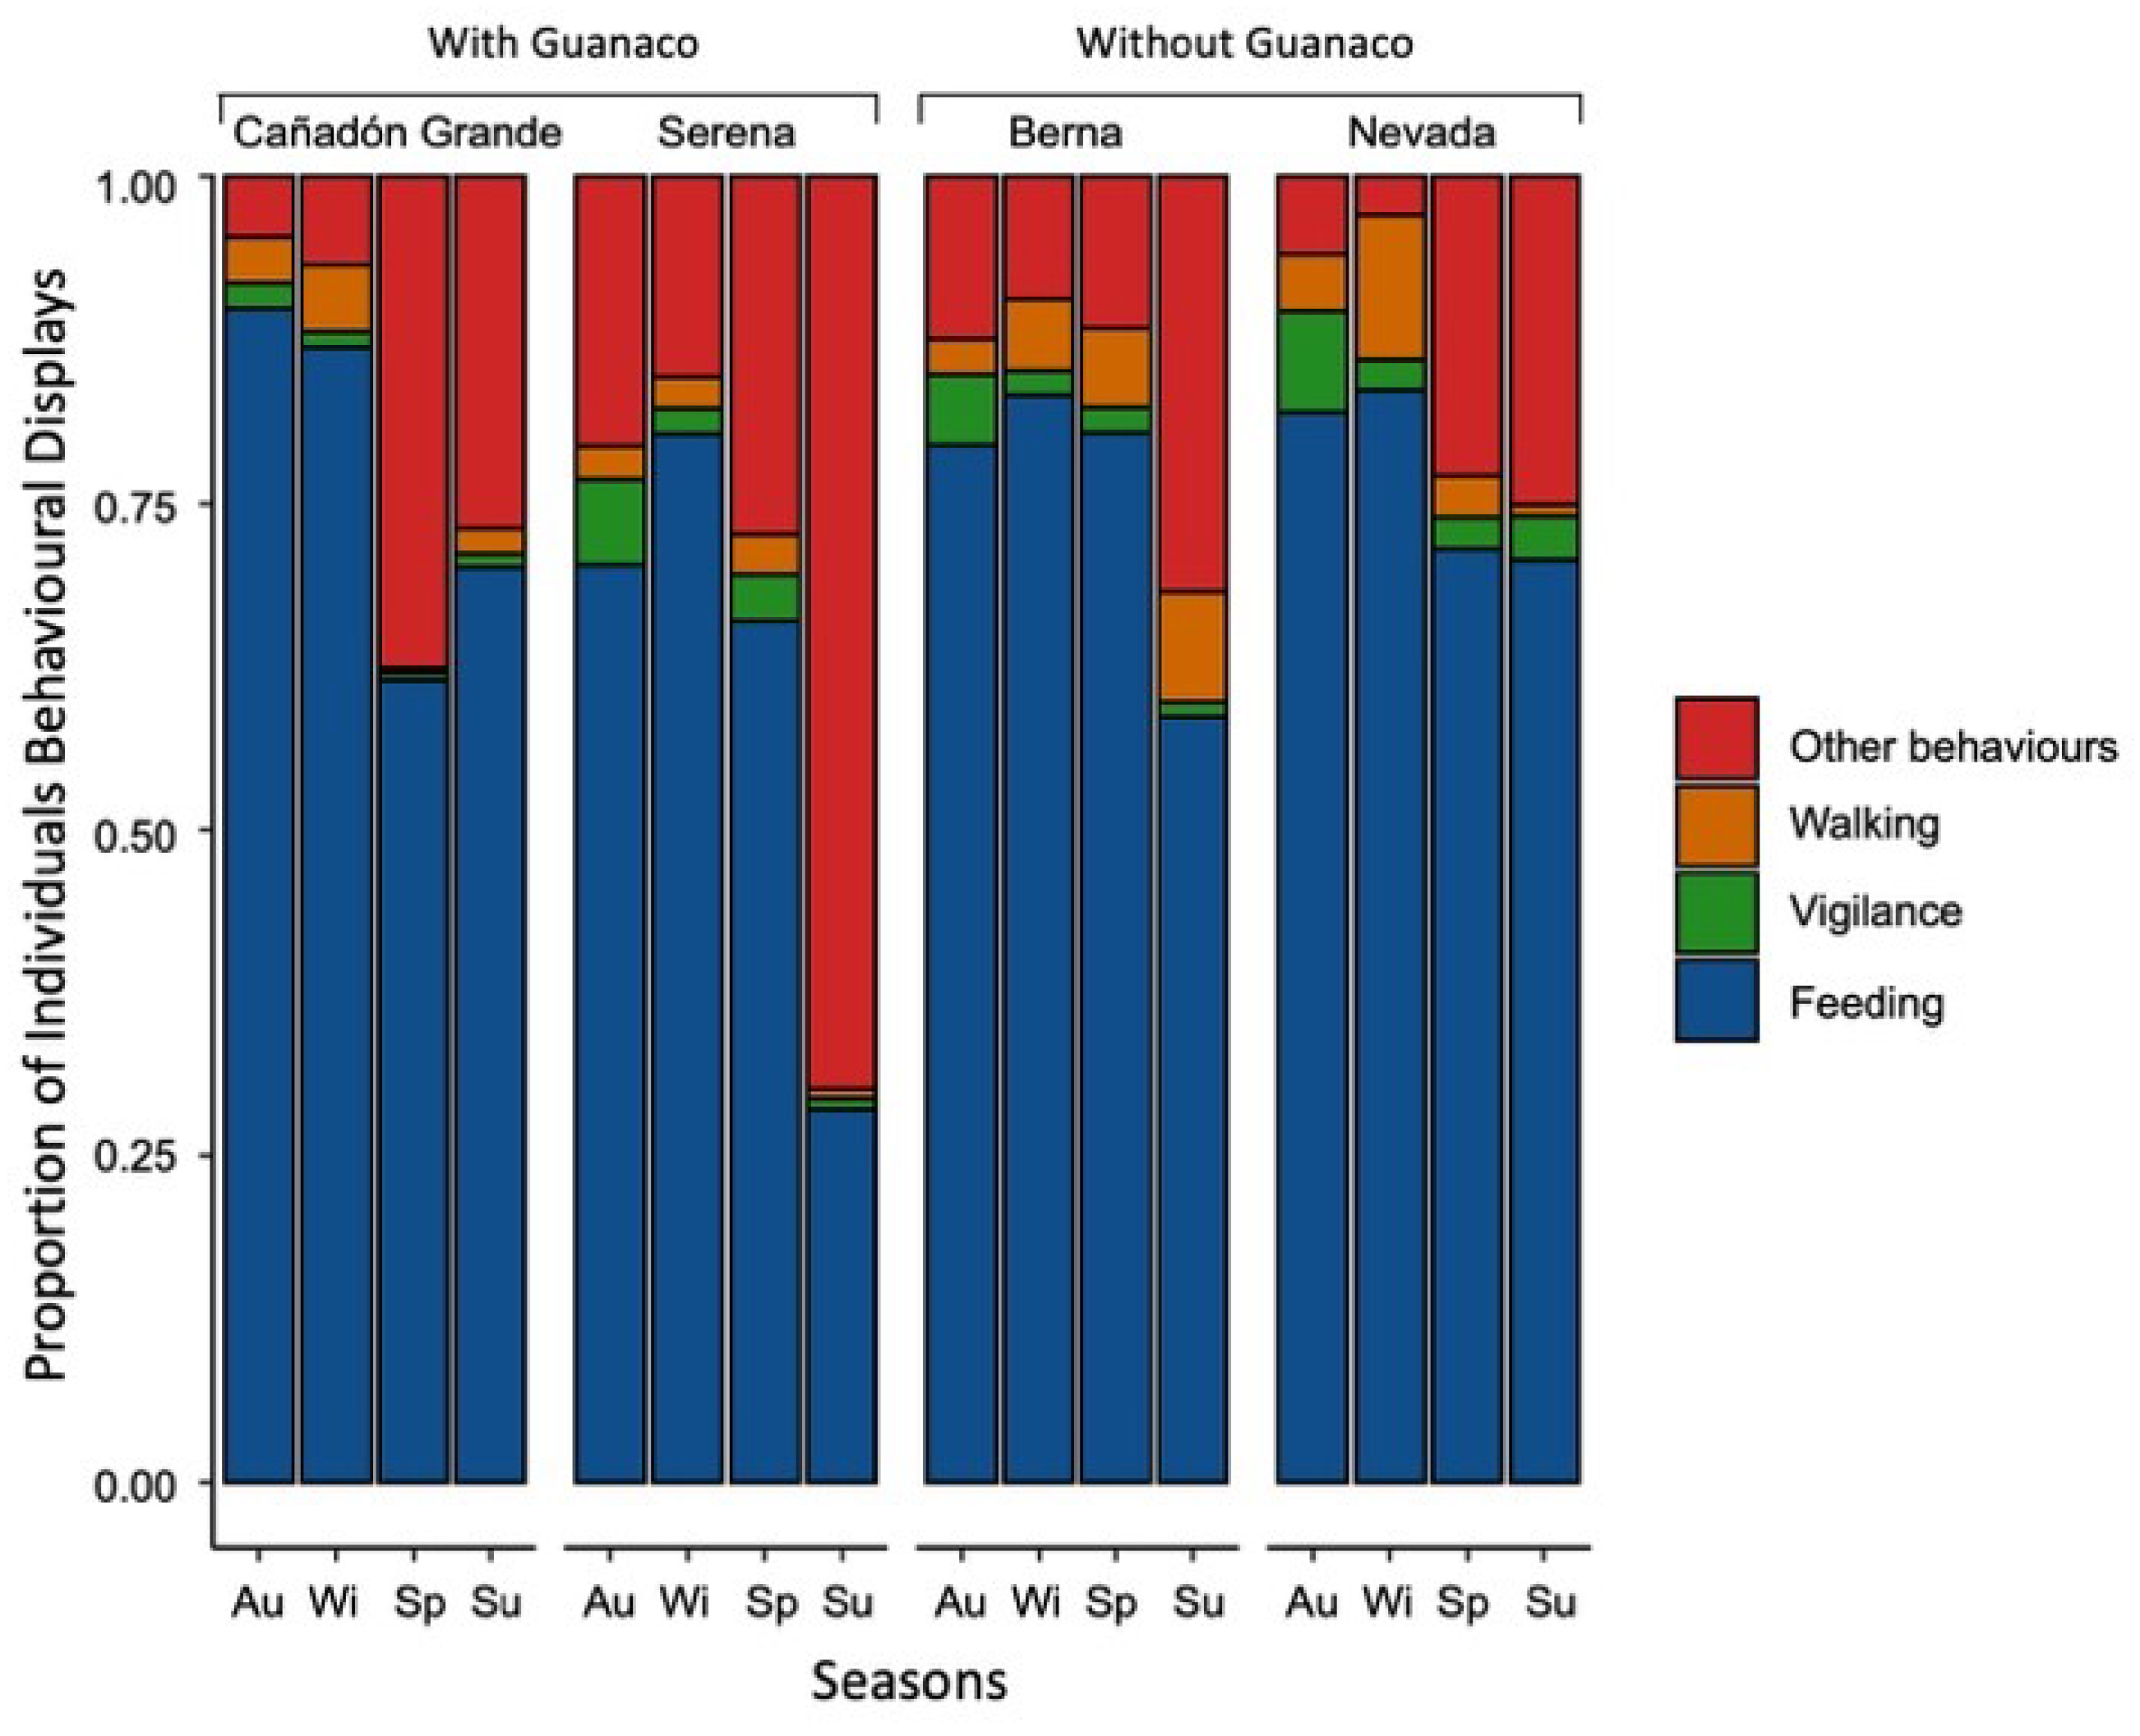
2.4.1. Group Activity Budgets
2.4.2. Focal Observations
2.5. Statistical Analysis
2.5.1. Group Activity Budgets
2.5.2. Focal Observations
2.5.3. Model Selection
3. Results
3.1. Food Availability and Carrying Capacity
3.2. Sheep Density, Stocking Rate and Guanaco Density
3.3. Sheep Behaviour Variation
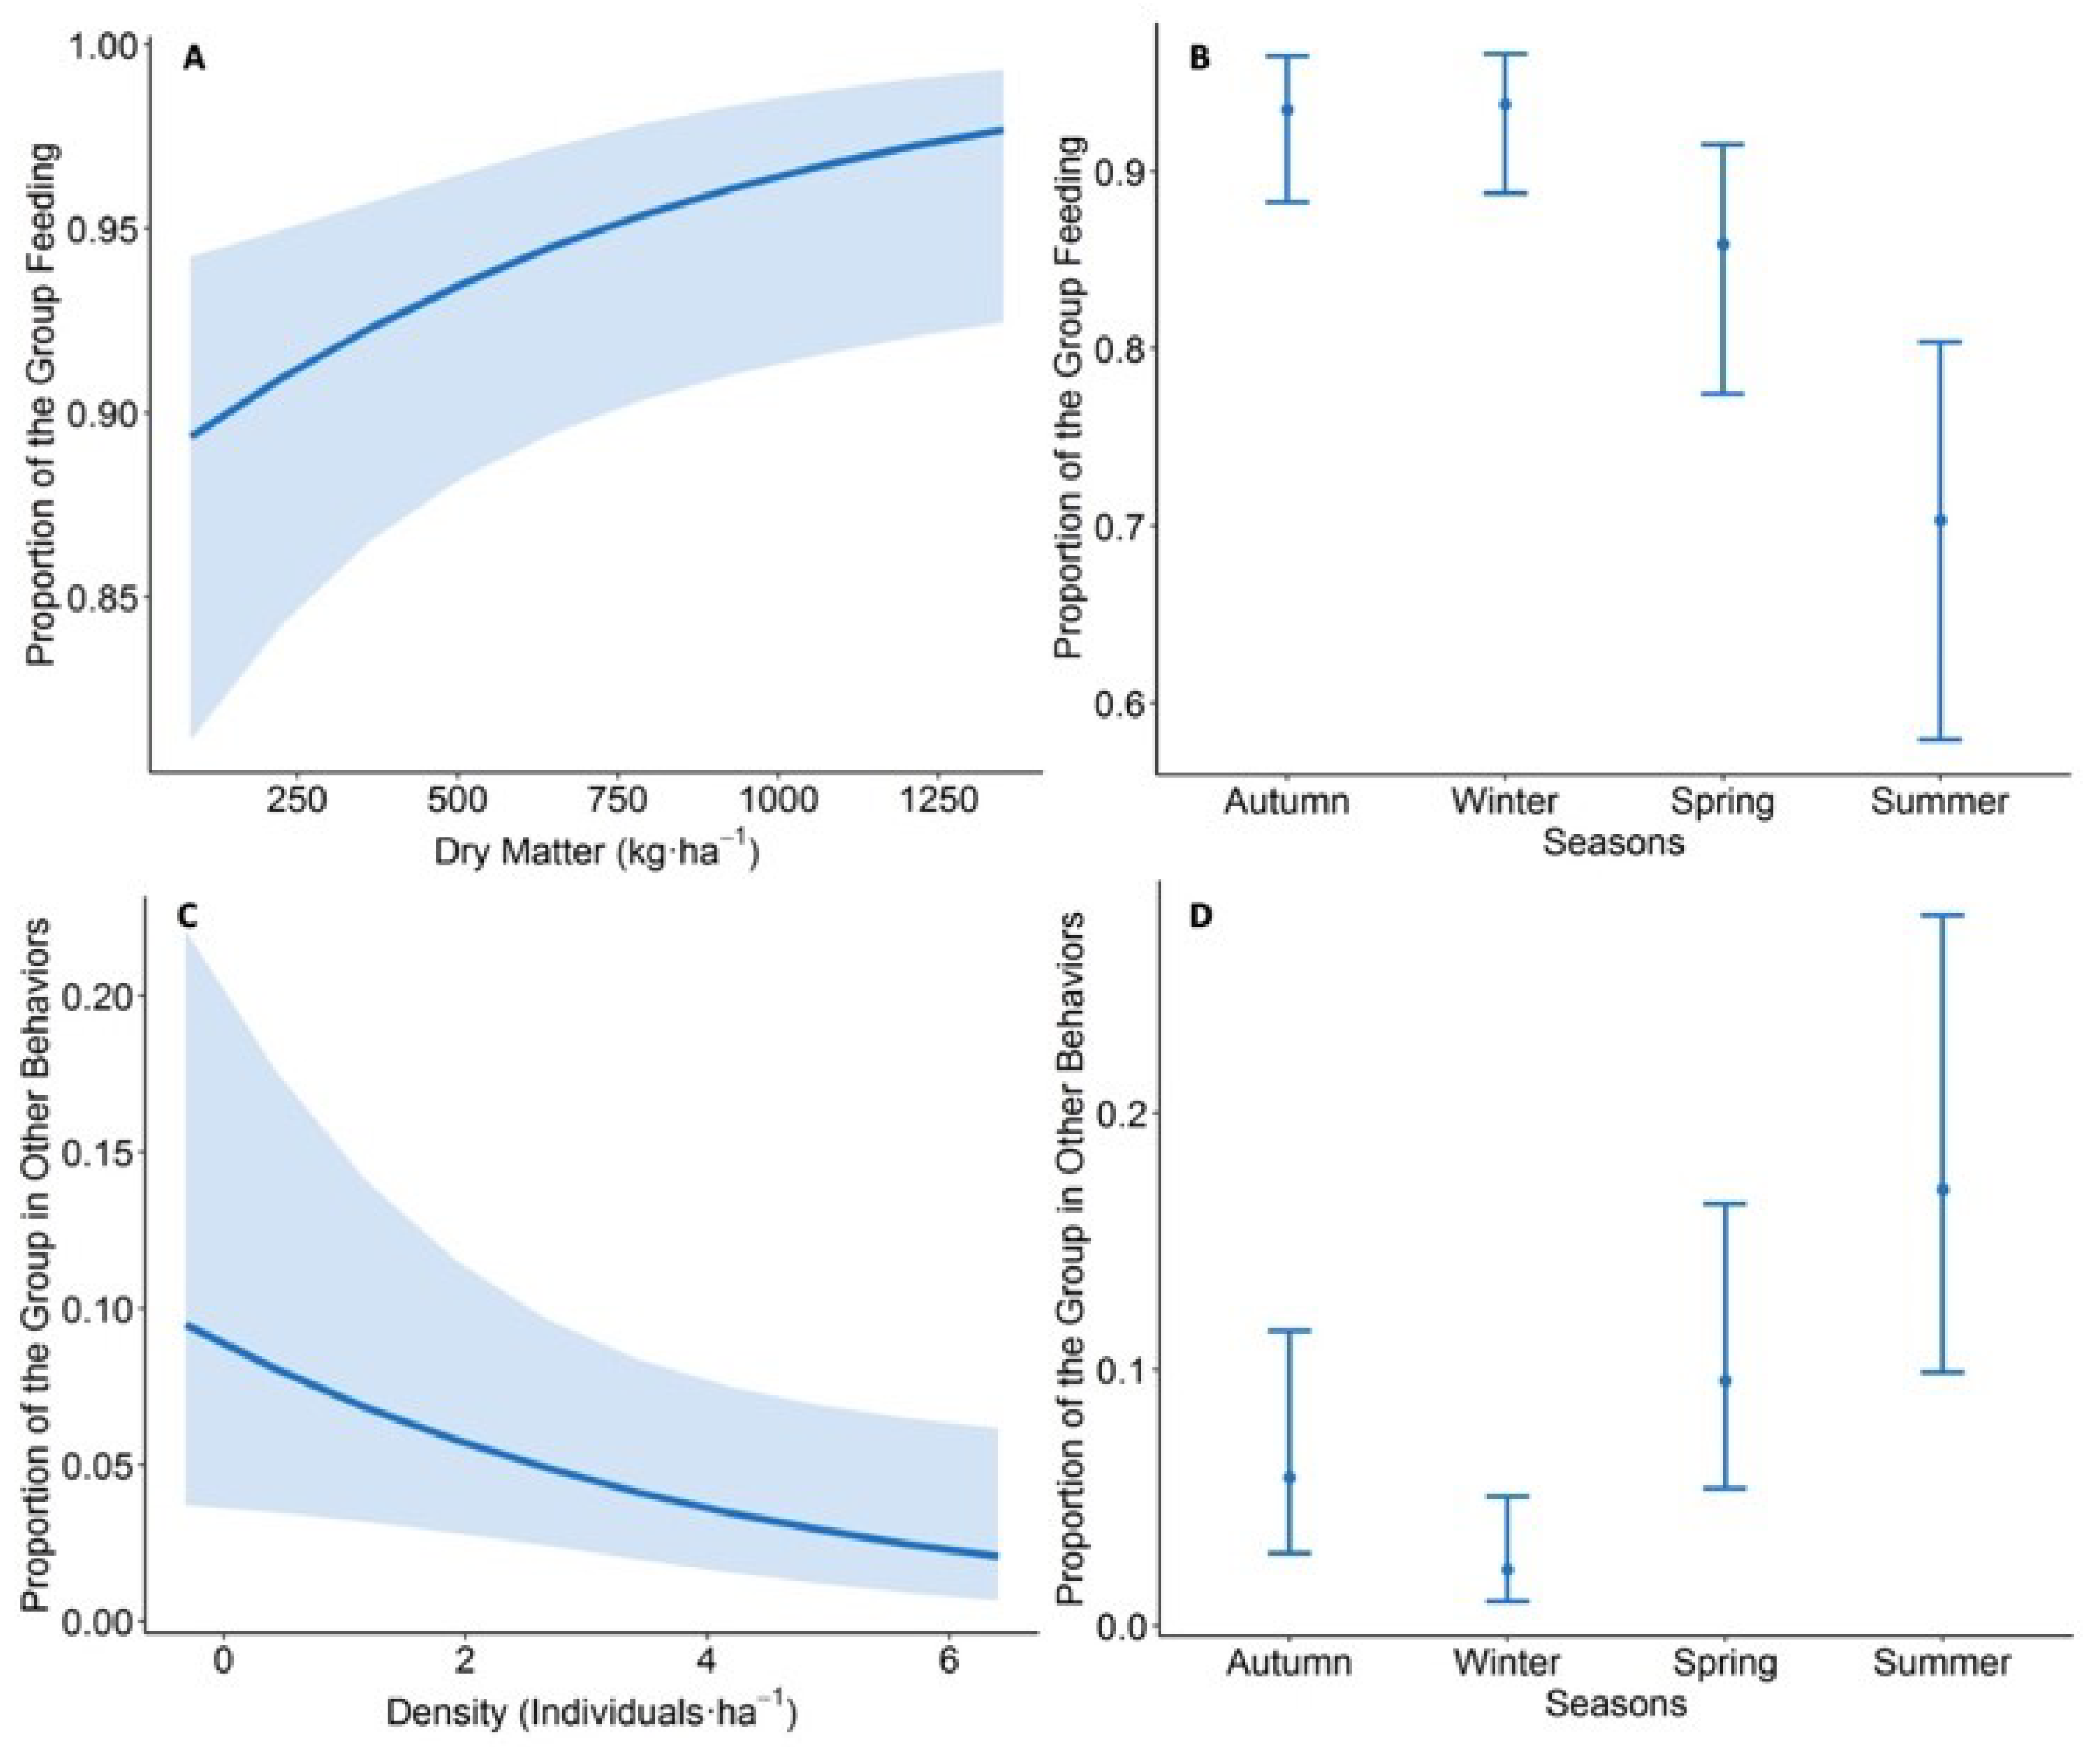
3.3.1. Groups’ Activity Budgets
3.3.2. Bite Rate
3.3.3. Movement Rate
4. Discussion
5. Conclusions
Author Contributions
Funding
Institutional Review Board Statement
Data Availability Statement
Acknowledgments
Conflicts of Interest
Appendix A

| Sheep | Season | Density | 95% CI | CV | DF | n |
| Site | ||||||
| Cañadón Grande (With guanaco) | Autumn 2018 | 0.84 | 0.15–4.66 | 74.28 | 4.90 | 1680 |
| Winter 2018 | 2.49 | 1.32–4.67 | 32.38 | 59.17 | 4975 | |
| Spring 2018 | 1.83 | 0.93–3.54 | 32.16 | 16.39 | 3653 | |
| Summer 2019 | 0.09 | 0.02–0.30 | 54.57 | 7.53 | 186 | |
| Autumn 2019 | 0.97 | 0.61–1.53 | 22.16 | 19.91 | 1950 | |
| Winter 2019 | 1.69 | 0.48–5.89 | 49.06 | 4.36 | 3387 | |
| Spring 2019 | 2.91 | 0.84–10.0 | 61.47 | 11.84 | 5819 | |
| Summer 2020 | 0.59 | 0.05–6.23 | 70.15 | 2.37 | 1187 | |
| Nevada (Without guanaco) | Autumn 2018 | 5.69 | 1.18–27.3 | 72.76 | 6.44 | 3953 |
| Winter 2018 | 3.02 | 0.99–9.14 | 54.74 | 12.73 | 2099 | |
| Spring 2018 | 2.29 | 0.26–19.4 | 125.77 | 11.13 | 1592 | |
| Summer 2019 | 2.85 | 1.03–7.81 | 52.12 | 25.59 | 1981 | |
| Autumn 2019 | 6.49 | 1.86–22.6 | 64.58 | 16.58 | 4512 | |
| Winter 2019 | 1.05 | 0.33–3.27 | 54.22 | 9.44 | 727 | |
| Spring 2019 | 0.24 | 0.07–0.77 | 54.59 | 8.51 | 168 | |
| Summer 2020 | 2.59 | 0.50–13.2 | 84.97 | 10.58 | 1799 | |
| Berna (Without guanaco) | Autumn 2018 | 2.30 | 1.10–4.76 | 31.13 | 6.54 | 6163 |
| Winter 2018 | 1.07 | 0.53–2.15 | 35.48 | 41.39 | 1788 | |
| Spring 2018 | 2.28 | 1.04–4.98 | 33.81 | 6.83 | 6125 | |
| Summer 2019 | 1.72 | 0.94–3.13 | 29.77 | 25.54 | 4615 | |
| Autumn 2019 | 1.08 | 0.19–6.15 | 80.63 | 5.94 | 1806 | |
| Winter 2019 | 2.31 | 0.85–6.22 | 48.35 | 12.57 | 3286 | |
| Spring 2019 | 1.93 | 1.34–2.77 | 17.98 | 35.68 | 2752 | |
| Summer 2020 | 1.67 | 0.81–3.39 | 33.60 | 12.40 | 4473 | |
| Serena (With guanaco) | Autumn 2018 | 3.38 | 1.06–10.6 | 55.42 | 10.06 | 6073 |
| Winter 2018 | 1.96 | 0.64–5.98 | 50.77 | 7.59 | 3527 | |
| Spring 2018 | 1.12 | 0.41–3.02 | 49.03 | 13.74 | 2006 | |
| Summer 2019 | 0.04 | 0.00–0.50 | 97.84 | 3.07 | 69 | |
| Autumn 2019 | 0.29 | 0.05–1.45 | 82.08 | 9.43 | 520 | |
| Winter 2019 | 0.24 | 0.06–0.92 | 56.70 | 5.22 | 434 | |
| Spring 2019 | 0.61 | 0.09–3.84 | 84.17 | 5.41 | 1098 | |
| Summer 2020 | 1.16 | 0.26–5.10 | 63.02 | 5.03 | 2081 | |
| Guanacos | Season | Density | 95% CI | CV | DF | n |
| Site | ||||||
| Cañadón Grande | Autumn 2018 | 0.12 | 0.03–0.41 | 50.25 | 4.61 | 316 |
| Winter 2018 | 0.19 | 0.04–0.78 | 57.57 | 4.33 | 310 | |
| Spring 2018 | 0.15 | 0.04–0.56 | 56.34 | 5.52 | 407 | |
| Summer 2019 | 0.02 | 0.00–0.03 | 26.86 | 6.07 | 43 | |
| Autumn 2019 | 0.71 | 0.14–3.53 | 65.37 | 4.37 | 1186 | |
| Winter 2019 | 0.33 | 0.15–0.67 | 29.12 | 5.33 | 467 | |
| Spring 2019 | 0.32 | 0.14–0.71 | 37.02 | 8.88 | 450 | |
| Summer 2020 | 0.05 | 0.01–0.15 | 43.60 | 4.96 | 141 | |
| Serena | Autumn 2018 | 0.09 | 0.03–0.21 | 40.56 | 9.65 | 161 |
| Winter 2018 | 0.09 | 0.04–0.18 | 33.52 | 18.35 | 166 | |
| Spring 2018 | 0.01 | 0.00–0.02 | 38.10 | 7.29 | 19 | |
| Summer 2019 | 0.06 | 0.01–0.16 | 52.81 | 9.07 | 99 | |
| Autumn 2019 | 0.03 | 0.00–0.11 | 55.95 | 6.11 | 58 | |
| Winter 2019 | 0.06 | 0.01–0.22 | 47.41 | 3.84 | 111 | |
| Spring 2019 | 0.05 | 0.02–0.12 | 35.16 | 5.32 | 96 | |
| Summer 2020 | 0.06 | 0.01–0.22 | 65.70 | 8.41 | 104 |
| Model | Estimate | Std. Error | z Value | Pr (>|z|) |
|---|---|---|---|---|
| Feeding | ||||
| (Intercept) | 2.665 | 0.332 | 8.031 | <0.0001 |
| biomass | 0.358 | 0.149 | 2.410 | 0.0159 |
| seasonsWinter | 0.046 | 0.317 | 0.145 | 0.8850 |
| seasonsSpring | −0.861 | 0.293 | −2.933 | 0.0034 |
| seasonsSummer | −1.802 | 0.343 | −5.261 | <0.0001 |
| siteSerena | −1.178 | 0.357 | −3.298 | 0.0010 |
| siteBerna | 0.029 | 0.303 | 0.095 | 0.9243 |
| siteNevada | −0.468 | 0.313 | −1.496 | 0.1346 |
| group.size:seasonsAutumn | 0.148 | 0.294 | 0.503 | 0.6151 |
| group.size:seasonsWinter | −0.043 | 0.201 | −0.211 | 0.8329 |
| group.size:seasonsSpring | −0.184 | 0.176 | −1.045 | 0.2960 |
| group.size:seasonsSummer | −0.930 | 0.208 | −4.468 | <0.0001 |
| Vigilance | ||||
| (Intercept) | −5.567 | 0.665 | −8.372 | <0.0001 |
| ds.oa | 0.953 | 0.298 | 3.203 | 0.0014 |
| group.size | −2.175 | 0.918 | −2.370 | 0.0178 |
| ds.oa:group.size | 1.011 | 0.477 | 2.120 | 0.0340 |
| Walking | ||||
| (Intercept) | −3.978 | 0.412 | −9.659 | <0.0001 |
| seasonsWinter | 0.987 | 0.485 | 2.034 | 0.0419 |
| seasonsSpring | −0.768 | 0.711 | −1.080 | 0.2802 |
| seasonsSummer | 0.196 | 0.562 | 0.348 | 0.7280 |
| Other Behaviours | ||||
| (Intercept) | −2.788 | 0.382 | −7.300 | <0.0001 |
| ds.oa | −0.354 | 0.175 | −2.025 | 0.0429 |
| seasonsWinter | −1.004 | 0.436 | −2.306 | 0.0211 |
| seasonsSpring | 0.541 | 0.361 | 1.499 | 0.1340 |
| seasonsSummer | 1.204 | 0.372 | 3.240 | 0.0013 |
| siteSerena | 0.5970 | 0.364 | 1.566 | 0.1174 |
| siteCañadón Grande | −0.225 | 0.362 | −0.621 | 0.5344 |
| siteNevada | −0.010 | 0.383 | −0.026 | 0.9790 |
| group.size:seasonsAutumn | −0.178 | 0.335 | −0.532 | 0.5944 |
| group.size:seasonsWinter | 0.378 | 0.252 | 1.496 | 0.1346 |
| group.size:seasonsSpring | 0.492 | 0.192 | 2.561 | 0.0104 |
| group.size:seasonsSummer | 1.147 | 0.232 | 4.952 | <0.0001 |
| Model | Estimate | Std. Error | t Value | Pr (>|t|) |
|---|---|---|---|---|
| Bite rate | ||||
| (Intercept) | 79.295 | 3.998 | 19.832 | <0.0001 |
| seasonsWinter | 8.450 | 4.402 | 1.920 | 0.0558 |
| seasonsSpring | 19.267 | 5.096 | 3.781 | 0.0002 |
| seasonsSummer | 11.63 | 6.013 | 1.934 | 0.0540 |
| siteSerena | −3.252 | 5.749 | −0.566 | 0.5720 |
| siteBerna | 21.244 | 4.784 | 4.440 | <0.0001 |
| siteNevada | 21.025 | 4.879 | 4.309 | <0.0001 |
| ds.oa:seasonsAutumn | −2.118 | 2.304 | −0.919 | 0.3587 |
| ds.oa:seasonsWinter | −10.834 | 4.978 | −2.176 | 0.0302 |
| ds.oa:seasonsSpring | 31.065 | 6.832 | 4.547 | <0.0001 |
| ds.oa:seasonsSummer | 7.375 | 7.279 | 1.013 | 0.3117 |
| seasonsAutumn:biomass | 7.375 | 5.062 | 1.457 | 0.1461 |
| seasonsWinter:biomass | 19.816 | 4.870 | 4.069 | <0.0001 |
| seasonsSpring:biomass | 21.632 | 6.217 | 3.479 | 0.0006 |
| seasonsSummer:biomass | −1.936 | 3.427 | −0.565 | 0.5726 |
| ds.oa:seasonsAutumn:biomass | 3.832 | 2.758 | 1.389 | 0.1657 |
| ds.oa:seasonsWinter:biomass | 14.918 | 6.181 | 2.414 | 0.0163 |
| ds.oa:seasonsSpring:biomass | 52.767 | 7.975 | 6.617 | <0.0001 |
| ds.oa:seasonsSummer:biomass | −6.892 | 4.319 | −1.596 | 0.1115 |
| Movement rate | ||||
| (Intercept) | 17.086 | 0.609 | 28.055 | <0.0001 |
| seasonsWinter | 0.417 | 0.873 | 0.478 | 0.6333 |
| seasonsSpring | 2.553 | 0.924 | 2.762 | 0.0061 |
| seasonsSummer | 2.767 | 0.945 | 2.929 | 0.0037 |
| biomass:seasonsAutumn | −0.589 | 0.792 | −0.743 | 0.4583 |
| biomass:seasonsWinter | 3.622 | 0.857 | 4.226 | <0.0001 |
| biomass:seasonsSpring | 0.165 | 1.038 | 0.159 | 0.8737 |
| biomass:seasonsSummer | −0.016 | 0.458 | −0.035 | 0.9722 |
References
- Bonenfant, C.; Gaillard, J.-M.; Coulson, T.; Festa-Bianchet, M.; Loison, A.; Garel, M.; Loe, L.E.; Blanchard, P.; Pettorelli, N.; Owen-Smith, N.; et al. Empirical evidence of density-dependence in populations of large herbivores. In Advances in Ecological Research; Caswell, H., Ed.; Academic Press: Burlington, MA, USA, 2009; Volume 41, pp. 313–357. [Google Scholar]
- Langvatn, R.; Albon, S.D.; Burkey, T.; Clutton-Brock, T.H. Climate, plant phenology and variation in age of first reproduction in a temperate herbivore. J. Anim. Ecol. 1996, 65, 653–670. [Google Scholar] [CrossRef]
- Clutton-Brock, T.H.; Price, O.F.; Albon, S.D.; Jewell, P.A. Early development and population fluctuations in Soay sheep. J. Anim. Ecol. 1992, 61, 381–396. [Google Scholar] [CrossRef]
- Festa-Bianchet, M.; Gaillard, J.-M.; Jorgenson, J.T. Mass- and density-dependent reproductive success and reproductive costs in a capital breeder. Am. Nat. 1998, 152, 367–379. [Google Scholar] [CrossRef]
- Larter, N.C.; Sinclair, A.R.E.; Ellsworth, T.; Nishi, J.; Gates, C.C. Dynamics of reintroduction in an indigenous large ungulate: The wood bison of northern Canada. Anim. Conserv. 2000, 3, 299–309. [Google Scholar] [CrossRef]
- DePerno, C.S.; Jenks, J.A.; Griffin, S.L.; Rice, L.A. Female survival rates in a declining white-tailed deer population. Wildlife. Soc. Bull. 2000, 28, 1030–1037. [Google Scholar]
- Gaillard, J.-M.; Festa-Bianchet, M.; Yoccoz, N.G.; Loison, A.; Toïgo, C. Temporal variation in fitness components and population dynamics of large herbivores. Annu. Rev. Ecol. Evol. Syst. 2000, 31, 367–393. [Google Scholar] [CrossRef]
- Coulson, T.; Ezard, T.H.G.; Pelletier, F.; Tavecchia, G.; Stenseth, N.C.; Childs, D.Z.; Pilkington, J.G.; Pemberton, J.M.; Kruuk, L.E.B.; Crawley, M.J. Estimating the functional form for the density dependence from life history data. Ecology 2008, 89, 1661–1674. [Google Scholar] [CrossRef] [Green Version]
- Newman, J. Herbivory. In Foraging Behavior and Ecology; Stephens, D.W., Brown, J.S., Ydenberg, R.C., Eds.; University of Chicago Press: Chicago, IL, USA, 2007; pp. 175–220. [Google Scholar]
- Davies, N.B.; Krebs, J.R.; West, S.A. An Introduction to Behavioural Ecology, 4th ed.; Wiley-Blackwell: Chichester, UK, 2012. [Google Scholar]
- Bergman, C.M.; Fryxell, J.M.; Gates, C.C.; Fortin, D. Ungulate foraging strategies: Energy maximizing or time minimizing? J. Anim. Ecol. 2008, 70, 289–300. [Google Scholar] [CrossRef]
- Fortin, D.; Fortin, M. Group-size-dependent association between food profitability, predation risk and distribution of free-ranging bison. Anim. Behav. 2009, 78, 887–892. [Google Scholar] [CrossRef]
- Robinson, B.G.; Merrill, E.H. The influence of snow on the functional response of grazing ungulates. Oikos 2012, 121, 28–34. [Google Scholar] [CrossRef]
- Brivio, F.; Grignolio, S.; Brambilla, A.; Apollonio, M. Intra-sexual variability in feeding behaviour of a mountain ungulate: Size matters. Behav. Ecol. Sociobiol. 2014, 68, 1649–1660. [Google Scholar] [CrossRef]
- Ruckstuhl, K.E.; Neuhaus, P. Activity budgets and sociality in a monomorphic ungulate: The African oryx (Oryx gazella). Can. J. Zool. 2009, 87, 165–174. [Google Scholar] [CrossRef]
- Brook, B.W.; Bradshaw, C.J.A. Strength of evidence for density dependence in abundance time series of 1198 species. Ecology 2006, 87, 1445–1451. [Google Scholar] [CrossRef]
- Estevez, I.; Andersen, I.; Nævdal, E. Group size, density, and social dynamics in farm animals. Appl. Anim. Behav. Sci. 2007, 103, 185–204. [Google Scholar] [CrossRef]
- Kraai, M.; Shrader, A.M. How do free-ranging domestic herbivores reduce competition within owner- determined herds? Appl. Anim. Behav. Sci. 2018, 205, 8–13. [Google Scholar] [CrossRef] [Green Version]
- Rind, M.I.; Phillips, C.J.C. The effects of group size on the ingestive and social behaviour of grazing dairy cows. Anim. Sci. 1999, 68, 589–596. [Google Scholar] [CrossRef]
- Shrader, A.M.; Kerley, G.I.H.; Kotler, B.P.; Brown, J.S. Social information, social feeding, and competition in group-living goats (Capra hircus). Behav. Ecol. 2007, 18, 103–107. [Google Scholar] [CrossRef]
- Wang, M.; Alves, J.; Tucker, M.; Yang, W.; Ruckstuhl, K.E. Effects of intrinsic and extrinsic factors on ruminating, grazing, and bedding time in bighorn sheep (Ovis canadensis). PLoS ONE 2018, 13, e0206664. [Google Scholar] [CrossRef] [PubMed]
- Lin, L.; Dickhoefer, U.; Müller, K.; Wurina; Susenbeth, A. Grazing behavior of sheep at different stocking rates in the Inner Mongolian steppe, China. Appl. Anim. Behav. Sci. 2011, 129, 36–42. [Google Scholar] [CrossRef]
- Mobæk, R.; Mysterud, A.; Loe, L.E.; Holand, Ø.; Austrheim, G. Experimental evidence of density dependent activity pattern of a large herbivore in an alpine ecosystem. Oikos 2012, 121, 1364–1369. [Google Scholar] [CrossRef]
- Chaikina, N.A.; Ruckstuhl, K.E. the effect of cattle grazing on native ungulates: The good, the bad, and the ugly. Rangelands 2006, 28, 8–14. [Google Scholar] [CrossRef] [Green Version]
- Odadi, W.O.; Young, T.P.; Okeyo-owuor, J.B. Effects of wildlife on cattle diets in Laikipia rangeland, Kenya. Rangel. Ecol. Manag. 2007, 60, 179–185. [Google Scholar] [CrossRef]
- Odadi, W.O.; Okeyo-owuor, J.B.; Young, T.P. Behavioural responses of cattle to shared foraging with wild herbivores in an east African rangeland. App. Anim. Behav. Sci. 2009, 116, 120–125. [Google Scholar] [CrossRef]
- Brown, N.A.; Ruckstuhl, K.E.; Donelon, S.; Corbett, C. Changes in vigilance, grazing behaviour and spatial distribution of bighorn sheep due to cattle presence in Sheep River Provincial Park, Alberta. Agric. Ecosyst. Environ. 2010, 135, 226–231. [Google Scholar] [CrossRef]
- Iranzo, E.C.; Acebes, P.; Estades, C.F.; González, B.A.; Mata, C.; Malo, J.E.; Traba, J. Diffusive dispersal in a growing ungulate population: Guanaco expansion beyond the limits of protected areas. Mammal Res. 2018, 6, 185–196. [Google Scholar] [CrossRef]
- Aagesen, D. Crisis and conservation at the end of the world: Sheep ranching in Argentine Patagonia. Environ. Conserv. 2000, 27, 208–215. [Google Scholar] [CrossRef]
- Puig, S.; Videla, F.; Cona, M.I.; Monge, S.A. Use of food availability by guanacos (Lama guanicoe) and livestock in northern Patagonia (Mendoza, Argentina). J. Arid Environ. 2001, 47, 291–308. [Google Scholar] [CrossRef]
- Baldi, R.; Pelliza-Sbriller, A.; Elston, D.; Albon, S. High potential for competition between guanacos and sheep in Patagonia. J. Wildlife Manag. 2004, 68, 924–938. [Google Scholar] [CrossRef]
- Pontigo, F.; Radic, S.; Moraga, C.A.; Pulido, R.; Corti, P. Midsummer trophic overlap between guanaco and sheep in Patagonian rangelands. Rangel. Ecol. Manag. 2020, 73, 394–402. [Google Scholar] [CrossRef]
- Traba, J.; Iranzo, E.C.; Carmona, C.P.; Malo, J.E. Realised niche changes in a native herbivore assemblage associated with the presence of livestock. Oikos 2017, 126, 1400–1409. [Google Scholar] [CrossRef]
- Hernández, F.; Corcoran, D.; Graells, G.; Rõos, C.; Downey, M.C. Rancher perspectives of a livestock-wildlife conflict in southern Chile. Rangelands 2017, 39, 56–63. [Google Scholar] [CrossRef]
- Oliva, G.; Paredes, P.; Ferrante, D.; Cepeda, C.; Rabinovich, J. Remotely sensed primary productivity shows that domestic and native herbivores combined are overgrazing Patagonia. J. Appl. Ecol. 2019, 56, 1575–1584. [Google Scholar] [CrossRef]
- Marino, A.; Rodríguez, V.; Schroeder, N.M. Wild guanacos as scapegoat for continued overgrazing by livestock across southern Patagonia. J. Appl. Ecol. 2020, 57, 2393–2398. [Google Scholar] [CrossRef]
- Castellaro, G.; Morales, L.; Ahumada, M.; Barozzi, A. Simulation of dry matter productivity and water dynamics in a Chilean Patagonian Range. Chil. J. Agric. Res. 2010, 70, 417–427. [Google Scholar] [CrossRef] [Green Version]
- von Thüngen, J.; Lanari, M.R. Profitability of sheep farming and wildlife management in Patagonia. Pastoralism 2010, 1, 274–290. [Google Scholar]
- Oliva, G.; Ferrante, D.; Puig, S.; Williams, M. Sustainable sheep management using continuous grazing and variable stocking rates in Patagonia: A case study. Rangel. J. 2012, 34, 285–295. [Google Scholar] [CrossRef]
- Coulson, T.; Catchpole, E.A.; Albon, S.D.; Morgan, B.J.T.; Pemberton, J.M.; Clutton-Brock, T.H.; Crawley, M.J.; Grenfell, B.T. Age, sex, density, winter weather, and population crashes in Soay sheep. Science 2001, 292, 1528–1531. [Google Scholar] [CrossRef]
- Schieltz, J.M.; Rubenstein, D.I. Evidence based review: Positive versus negative effects of livestock grazing on wildlife. What do we really know? Environ. Res. Lett. 2016, 11, 113003. [Google Scholar] [CrossRef] [Green Version]
- Martinic, M. Recordando a un imperio pastoril: La Sociedad Explotadora de Tierra del Fuego (1893–1973). Magallania 2011, 39, 5–32. [Google Scholar] [CrossRef] [Green Version]
- Bailey, D.W.; Brown, J.R. Rotational grazing systems and livestock grazing behavior in shrub-dominated semi-arid and arid rangelands. Rangel. Ecol. Manag. 2011, 64, 1–9. [Google Scholar] [CrossRef]
- Briske, D.D.; Derner, J.D.; Brown, J.R.; Fuhlendorf, S.D.; Teague, W.R.; Havstad, K.M.; Gillen, R.L.; Ash, A.J.; Willms, W.D. Rotational grazing on rangelands: Reconciliation of perception and experimental evidence. Rangel. Ecol. Manag. 2008, 61, 3–17. [Google Scholar] [CrossRef] [Green Version]
- Lira, R. Caracterización del sistema de producción ovina austral. In Bases Para la Producción Ovina en Magallanes; Strauch, O., Lira, R., Eds.; Boletín INIA 244; Centro Regional de Investigación Kampenaike: Punta Arenas, Chile, 2012; pp. 39–47. [Google Scholar]
- Llanos, R.; Andrade, A.; Travaini, A. Puma and livestock in central Patagonia (Argentina): From ranchers’ perceptions to predator management. Hum. Dimens. Wildl. 2020, 25, 1–16. [Google Scholar] [CrossRef]
- Novaro, A.J.; Moraga, C.A.; Briceño, C.; Funes, M.C.; Marino, A. First records of culpeo (Lycalopex culpaeus) attacks and cooperative defense by guanacos (Lama guanicoe). Mammalia 2009, 73, 148–150. [Google Scholar] [CrossRef]
- Bonacic, C.; Almuna, R.; Ibarra, J.T. Biodiversity conservation requires management of feral domestic animals. Trends Ecol. Evol. 2019, 34, 683–686. [Google Scholar] [CrossRef]
- Ballejo, F.; Plaza, P.I.; Lambertucci, S.A. The conflict between scavenging birds and farmers: Field observations do not support people’s perceptions. Biol. Conserv. 2020, 248, 108627. [Google Scholar] [CrossRef]
- Peel, M.C.; Finlayson, B.L.; Mcmahon, T.A. Updated world map of the Köppen-Geiger climate classification. Hydrol. Earth Syst. Sci. 2007, 11, 1633–1644. [Google Scholar] [CrossRef] [Green Version]
- Schneider, C.; Glaser, M.; Kilian, R.; Santana, A.; Casassa, G. Weather observations across the southern Andes at 53°s. Phys. Geogr. 2003, 24, 97–119. [Google Scholar] [CrossRef]
- Aceituno, P.; Boisier, J.P.; Garreaud, R.; Rondanelli, R.; Rutllant, J.A. Climate and weather in Chile. In Water Resources of Chile; Fernández, B., Gironás, J., Eds.; Springer Nature: Cham, Switzerland, 2021; Volume 8, pp. 7–31. [Google Scholar]
- Castellaro, G.; Morales, L.; Fuentes, G. Carga ganadera y capacidad de carga de los pastizales naturales de la Patagonia chilena: Estimación a nivel comunal. Agro. Sur. 2016, 44, 93–105. [Google Scholar] [CrossRef]
- SAG (Chile Agricultural Service). El pastizal de Tierra del Fuego: Guía de Uso, Condición Actual y Propuesta de Seguimiento Para Determinación de Tendencia; Gobierno Regional de Magallanes, Ministerio de Agricultura, Servicio Agrícola y Ganadero, Departamento de Protección de los Recursos Naturales Renovables; SAG: Punta Arenas, Chile, 2003.
- SAG (Chile Agricultural Service). El Pastizal de Magallanes: Guía de Uso, Condición Actual y Propuesta de Seguimiento Para Determinación de Tendencia; Gobierno Regional de Magallanes, Ministerio de Agricultura, Servicio Agrícola y Ganadero, Departamento de Protección de los Recursos Naturales Renovables; SAG: Punta Arenas, Chile, 2004.
- SAG (Chile Agricultural Service). El Pastizal de Última Esperanza y Navarino: Guía de Uso, Condición Actual y Propuesta de Seguimiento para Determinación de Tendencia; Gobierno Regional de Magallanes, Ministerio de Agricultura, Servicio y Agrícola y Ganadero, Departamento de Protección de los Recursos Naturales Renovables; SAG: Punta Arenas, Chile, 2004.
- Daubenmire, R. A canopy-coverage method of vegetational analysis. Northwest Sci. 1959, 33, 43–64. [Google Scholar]
- Oñatibia, G.R.; Aguiar, M.R. Continuous moderate grazing management promotes biomass production in Patagonian arid rangelands. J. Arid Environ. 2016, 125, 73–79. [Google Scholar] [CrossRef]
- Hao, J.; Dickhoefer, U.; Lin, L.; Müller, K.; Glindemann, T.; Schönbach, P.; Schiborra, A.; Wang, C.; Susenbeth, A. Effects of rotational and continuous grazing on herbage quality, feed intake and performance of sheep on a semi-arid grassland steppe. Arch. Anim. Nutr. 2013, 67, 62–76. [Google Scholar] [CrossRef]
- Molano, G.; Clark, H. The effect of level of intake and forage quality on methane production by sheep. Aust. J. Exp. Agric. 2008, 48, 219–222. [Google Scholar] [CrossRef]
- Bickell, S.L.; Revell, D.K.; Toovey, A.F.; Vercoe, P.E. Feed intake of sheep when allowed ad libitum access to feed in methane respiration chambers. J. Anim. Sci. 2014, 92, 2259–2264. [Google Scholar] [CrossRef]
- Garry, B.; McGovern, F.M.; Boland, T.M.; Baumont, R.; Lewis, E.; O’Donovan, M. Effects of perennial ryegrass variety and ploidy on voluntary dry matter intake and in vivo digestibility in sheep. Livest. Sci. 2020, 240, 104164. [Google Scholar] [CrossRef]
- Covacevich, N. Guía de manejo de coironales: Bases para el planteamiento de la estancia. Boletín INIA 2001, 47, 1–24. [Google Scholar]
- Müller, K.; Dickhoefer, U.; Lin, L.; Glindemann, T.; Wang, C.; Schönbach, P.; Wan, H.W.; Schiborra, A.; Tas, B.M.; Gierus, M.; et al. Impact of grazing intensity on herbage quality, feed intake and live weight gain of sheep grazing on the steppe of Inner Mongolia. J. Agric. Sci. 2014, 152, 153–165. [Google Scholar] [CrossRef]
- Golluscio, R.A.; Bottaro, H.S.; Oesterheld, M. Controls of carrying capacity: Degradation, primary production, and forage quality effects in a Patagonian steppe. Rangel. Ecol. Manag. 2015, 68, 266–275. [Google Scholar] [CrossRef]
- Hashemi, N. Recognizing the potential of sustainable use of pasture resources in south Khorasan Province with approach of carrying capacity. Environ. Ecosys. Sci. 2017, 1, 9–12. [Google Scholar] [CrossRef]
- Fuhlendorf, S.D.; Briske, D.D.; Smeins, F.E. Herbaceous vegetation change in variable rangeland environments: The relative contribution of grazing and climatic variability. Appl. Veg. Sci. 2001, 4, 177–188. [Google Scholar] [CrossRef]
- Oliva, G.; Collantes, M.; Humano, G. Demography of grazed tussock grass populations in Patagonia. Rangel. Ecol. Manag. 2005, 58, 466–473. [Google Scholar] [CrossRef]
- Briske, D.D.; Derner, J.D.; Milchunas, D.G.; Tate, K.W. An evidence-based assessment of prescribed grazing practices. In Conservation Benefits of Rangeland Practices: Assessment, Recommendations, and Knowledge Gaps; Briske, D.D., Ed.; Allen Press Inc.: Lawrence, KS, USA, 2011; pp. 21–74. [Google Scholar]
- Guevara, J.C.; Grünwaldt, E.G.; Estevez, O.R.; Bisigato, A.J.; Blanco, L.J.; Biurrun, F.N.; Ferrando, C.A.; Chirino, C.C.; Morici, E.; Fernández, B.; et al. Range and livestock production in the Monte Desert, Argentina. J. Arid Environ. 2009, 73, 228–237. [Google Scholar] [CrossRef]
- Buckland, S.T.; Anderson, D.R.; Burnham, K.P.; Laake, J.L.; Borchers, D.L.; Thomas, L. Advanced Distance Sampling. Estimating Abundance of Biological Populations; Oxford University Press: Oxford, UK, 2004. [Google Scholar]
- Thomas, L.; Buckland, S.T.; Rexstad, E.A.; Laake, J.L.; Strindberg, S.; Hedley, S.L.; Bishop, J.R.B.; Marques, T.A.; Burnham, K.P. Distance software: Design and analysis of distance sampling surveys for estimating population size. J. Appl. Ecol. 2010, 47, 5–14. [Google Scholar] [CrossRef] [Green Version]
- Buckland, S.T.; Rexstad, E.A.; Marques, T.A.; Oedekoven, C.S. Distance Sampling: Methods and Applications; Springer International: Cham, Switzerland, 2015. [Google Scholar]
- Oli, M.K.; Rogers, M.E. Seasonal pattern in group size and population composition of blue sheep in Manang, Nepal. J. Wildl. Manag. 1996, 60, 797–801. [Google Scholar] [CrossRef]
- Altmann, J. Observational study of behavior: Sampling methods. Behaviour 1974, 49, 227–266. [Google Scholar] [CrossRef] [PubMed] [Green Version]
- Martin, P.; Bateson, P. Measuring Behaviour: An Introduction Guide, 3rd ed.; Cambridge University Press: Cambridge, UK, 2007. [Google Scholar]
- Mason, T.H.E.; Stephens, P.A.; Apollonio, M.; Willis, S.G. Predicting potential responses to future climate in an Alpine ungulate: Interspecific interactions exceed climate effects. Glob. Chang. Biol. 2014, 20, 3872–3882. [Google Scholar] [CrossRef] [Green Version]
- Lian, X.; Zhang, T.; Cao, Y.; Su, J.; Thirgood, S. Group size effects on foraging and vigilance in migratory Tibetan antelope. Behav. Process. 2007, 76, 192–197. [Google Scholar] [CrossRef]
- Alvarenga, F.A.P.; Borges, I.; Palkovič, L.; Rodina, J.; Oddy, V.H.; Dobos, R.C. Using a three-axis accelerometer to identify and classify sheep behaviour at pasture. Appl. Anim. Behav. Sci. 2016, 181, 91–99. [Google Scholar] [CrossRef]
- Fisher, A.; Matthews, L. The social behaviour of sheep. In Social Behaviour in Farm Animals; Keeling, L.J., Gonyou, H.W., Eds.; CAB International: London, UK, 2001. [Google Scholar]
- Ruckstuhl, K.E.; Festa-Bianchet, M.; Jorgenson, J.T. Bite rates in Rocky Mountain bighorn sheep (Ovis canadensis): Effects of season, age, sex, and reproductive status. Behav. Ecol. Sociobiol. 2003, 54, 167–173. [Google Scholar] [CrossRef]
- Ferretti, F.; Corazza, M.; Campana, I.; Pietrocini, V.; Brunetti, C.; Scornavacca, D.; Lovari, S. Competition between wild herbivores: Reintroduced red deer and Apennine chamois. Behav. Ecol. 2015, 26, 550–559. [Google Scholar] [CrossRef] [Green Version]
- Caillaud, D. Animal Observer; Dian Fossey Gorilla Fund International. 2016. Available online: https://apps.apple.com/us/app/animal-observer/id991802313 (accessed on 1 November 2017).
- Schielzeth, H. Simple means to improve the interpretability of regression coefficients. Methods Ecol. Evol. 2010, 1, 103–113. [Google Scholar] [CrossRef]
- Bolker, B.M.; Brooks, M.E.; Clark, C.J.; Geange, S.W.; Poulsen, J.R.; Stevens, M.H.H.; White, J.S. Generalized linear mixed models: A practical guide for ecology and evolution. Trends Ecol. Evol. 2009, 24, 127–135. [Google Scholar] [CrossRef]
- Harrison, X.A.; Donaldson, L.; Correa-Cano, M.E.; Evans, J.; Fisher, D.N.; Goodwin, C.E.D.; Robinson, B.S.; Hodgson, D.J.; Inger, R. A brief introduction to mixed effects modelling and multi-model inference in ecology. PeerJ 2008, 6, e4794. [Google Scholar] [CrossRef] [PubMed] [Green Version]
- Warton, D.I.; Lyons, M.; Stoklosa, J.; Ives, A.R. Three points to consider when choosing a LM or GLM test for count data. Methods Ecol. Evol. 2016, 7, 882–890. [Google Scholar] [CrossRef] [Green Version]
- Courtney, M.G.R.; Chang, K.C. Dealing with non-normality: An introduction and step-by-step guide using R. Teach. Stat. 2018, 40, 51–59. [Google Scholar] [CrossRef]
- Akaike, H. A new look at the statistical model identification. IEEE Trans. Autom. Control. 1974, 19, 716–723. [Google Scholar] [CrossRef]
- Aho, K.; Derryberry, D.; Peterson, T. Model selection for ecologists: The worldviews of AIC and BIC. Ecology 2014, 95, 631–636. [Google Scholar] [CrossRef]
- Arnold, T.W. Uninformative parameters and model selection using Akaike’s Information Criterion. J. Wildl. Manag. 2010, 74, 1175–1178. [Google Scholar] [CrossRef]
- R Core Team. R: A Language and Environment for Statistical Computing; R Foundation for Statistical Computing: Vienna, Austria, 2020. [Google Scholar]
- Bates, D.; Mächler, M.; Bolker, B.M.; Walker, S.C. Fitting linear mixed-effects models using lme4. J. Stat. Softw. 2015, 67, 1–48. [Google Scholar] [CrossRef]
- Barton, K. Package ‘MuMIn’ Version 1.9.18. Available online: http://mumin.r-forge.r-project.org/MuMIn-manual.pdf (accessed on 1 August 2020).
- Chen, Y.; Luo, H.; Liu, X.; Wang, Z.; Zhang, Y.; Liu, K.; Jiao, L.; Chang, Y.; Zuo, Z. Effect of restricted grazing time on the foraging behavior and movement of tan sheep grazed on desert steppe. Asian Austral. J. Anim. Sci. 2013, 26, 711–715. [Google Scholar] [CrossRef] [Green Version]
- Odadi, W.O.; Rubenstein, D.I. Herd size-dependent effects of restricted foraging time allowance on cattle behavior, nutrition, and performance. Rangel. Ecol. Manag. 2015, 68, 341–348. [Google Scholar] [CrossRef]
- Murray, M.G.; Illius, A.W. Vegetation modification and resource competition in grazing ungulates. Oikos 2000, 89, 501–508. [Google Scholar] [CrossRef] [Green Version]
- Amarasekare, P. Interference competition and species coexistence. Proc. R. Soc. 2002, 269, 2541–2550. [Google Scholar] [CrossRef] [Green Version]
- Zhang, L.; Andersen, K.H.; Dieckmann, U.; Brännström, Å. Four types of interference competition and their impacts on the ecology and evolution of size-structured populations and communities. J. Theor. Biol. 2015, 380, 280–290. [Google Scholar] [CrossRef] [Green Version]
- Ferretti, F.; Mori, E. Displacement interference between wild ungulate species: Does it occur? Ethol. Ecol. Evol. 2019, 32, 2–15. [Google Scholar] [CrossRef]
- Valeix, M.; Chamaillé-Jammes, S.; Hervé, F. Interference competition and temporal niche shifts: Elephants and herbivore communities at waterholes. Oecologia 2007, 153, 739–748. [Google Scholar] [CrossRef] [PubMed]
- Shrader, A.M.; Owen-Smith, N.; Ogutu, J.O. How a mega-grazer copes with the dry season: Food and nutrient intake rates by white rhinoceros in the wild. Funct. Ecol. 2006, 20, 376–384. [Google Scholar] [CrossRef]
- Bergman, C.M.; Fryxell, J.M.; Gates, C.C. The effect of tissue complexity and sward height on the functional response of Wood Bison. Funct. Ecol. 2000, 14, 61–69. [Google Scholar] [CrossRef]
- Pauler, C.M.; Isselstein, J.; Berard, J.; Braunbeck, T.; Schneider, M.K. Grazing Allometry: Anatomy, movement, and foraging behavior of three cattle breeds of different productivity. Front. Vet. Sci. 2020, 7, 494. [Google Scholar] [CrossRef]
- Herfindal, I.; Lande, U.S.; Solberg, E.J.; Rolandsen, C.M.; Wam, H.K.; Herfindal, I.; Lande, U.S.; Solberg, E.J.; Rolandsen, C.M.; Roer, O.; et al. Weather affects temporal niche partitioning between moose and livestock. Wildl. Biol. 2017, 2017, 1–22. [Google Scholar] [CrossRef] [Green Version]
- Iason, G.R.; Mantecon, A.R.; Sim, D.A.; González, J.; Foreman, E.; Bermúdez, F.F.; Elston, D.A. Can grazing sheep compensate for a daily foraging time constraint? J. Anim. Ecol. 1999, 68, 87–93. [Google Scholar] [CrossRef]
- Zhang, X.Q.; Luo, H.L.; Hou, X.Y.; Badgery, W.B.; Zhang, Y.J.; Jiang, C. Effect of restricted time at pasture and indoor supplementation on ingestive behaviour, dry matter intake and weight gain of growing lambs. Livest. Sci. 2014, 167, 137–143. [Google Scholar] [CrossRef]
- Molle, G.; Decandia, M.; Giovanetti, V.; Manca, C.; Acciaro, M.; Epifani, G.; Salis, L.; Cabiddu, A.; Sitzia, M.; Cannas, A. Grazing behaviour, intake and performance of dairy ewes with restricted access time to berseem clover (Trifolium alexandrinum L.) pasture. Grass Forage Sci. 2017, 72, 194–210. [Google Scholar] [CrossRef]
- Posse, G.; Anchorena, J.; Collantes, M.B. Seasonal diets of sheep in the steppe region of Tierra del Fuego, Argentina. J. Range Manag. 1996, 49, 24–30. [Google Scholar] [CrossRef]
- Wagner, G.D.; Peek, J.M. Bighorn sheep diet selection and forage quality in central Idaho. Northwest Sci. 2006, 80, 246–258. [Google Scholar]
- Tilman, D. Resources: A graphical-mechanistic approach to competition and predation. Am. Nat. 1980, 116, 362–393. [Google Scholar] [CrossRef]
- Chesson, P. General theory of competitive coexistence in spatially-varying environments. Theor. Popul. Biol. 2000, 58, 211–237. [Google Scholar] [CrossRef] [PubMed]
- Hester, A.J.; Gordon, I.J.; Baillie, G.J.; Tappin, E. Foraging behaviour of sheep and red deer within natural heather/grass mosaics. J. Appl. Ecol. 1999, 36, 133–146. [Google Scholar] [CrossRef]
- La Morgia, V.; Bassano, B. Feeding habits, forage selection, and diet overlap in Alpine chamois (Rupicapra rupicapra L.) and domestic sheep. Ecol. Res. 2009, 24, 1043–1050. [Google Scholar] [CrossRef]
- Chesson, P. Mechanisms of Maintenance of Species Diversity. Ann. Rev. Ecol. Syst. 2000, 31, 343–366. [Google Scholar] [CrossRef] [Green Version]
- Schönbach, P.; Wan, H.; Gierus, M.; Loges, R.; Müller, K.; Lin, L.; Susenbeth, A.; Taube, F. Effects of grazing and precipitation on herbage production, herbage nutritive value and performance of sheep in continental steppe. Grass Forage Sci. 2012, 67, 535–545. [Google Scholar] [CrossRef]
- Briske, D.D.; Zhao, M.; Han, G.; Xiu, C.; Kemp, D.R.; Willms, W.; Havstad, K.; Kang, L.; Wang, Z.; Wu, J.; et al. Strategies to alleviate poverty and grassland degradation in Inner Mongolia: Intensification vs production efficiency of livestock systems. J. Environ. Manag. 2015, 152, 177–182. [Google Scholar] [CrossRef] [PubMed]

| Model | DF | AIC | ΔAIC | AICω | R2c |
|---|---|---|---|---|---|
| Feeding | |||||
| biomass + group.size *seasons + site + (1|scan.id) | 13 | 1261.10 | 0.00 | 0.413 | 0.382 |
| biomass + ds.oa + group.size *seasons + site + (1|scan.id) | 14 | 1261.88 | 0.78 | 0.280 | 0.383 |
| biomass *group.size + group.size *seasons + site + (1|scan.id) | 14 | 1263.10 | 2.00 | 0.152 | 0.382 |
| group.size *seasons + site + (1|scan.id) | 12 | 1264.95 | 3.85 | 0.060 | 0.379 |
| group.size *seasons + (1|scan.id) | 9 | 1265.82 | 4.72 | 0.039 | 0.375 |
| biomass *group.size + seasons + site + (1|scan.id) | 11 | 1265.88 | 4.78 | 0.038 | 0.378 |
| Vigilance | |||||
| ds.oa + group.size + ds.oa:group.size + (1|scan.id) | 5 | 165.42 | 0.00 | 0.379 | 0.685 |
| biomass + ds.oa + group.size + (1|scan.id) | 5 | 165.57 | 0.15 | 0.351 | 0.459 |
| ds.oa + group.size + (1|scan.id) | 4 | 167.56 | 2.14 | 0.130 | 0.412 |
| ds.oa + group.size + ds.lg + (1|scan.id) | 5 | 168.21 | 2.79 | 0.094 | 0.442 |
| biomass + ds.oa + group.size + seasons + (1|scan.id) | 8 | 170.34 | 4.93 | 0.032 | 0.491 |
| biomass + ds.oa + group.size + season + ds.lg + (1|scan.id) | 9 | 172.00 | 6.58 | 0.014 | 0.465 |
| Walking | |||||
| seasons + (1|scan.id) | 5 | 300.07 | 0.00 | 0.396 | 0.109 |
| biomass + seasons + (1|scan.id), | 6 | 300.38 | 0.31 | 0.338 | 0.123 |
| biomass + group.size + seasons + (1|scan.id), | 7 | 301.99 | 1.92 | 0.151 | 0.127 |
| biomass + group.size + ds.oa + seasons + (1|scan.id), | 8 | 303.65 | 3.58 | 0.066 | 0.130 |
| biomass + group.size + ds.oa + ds.lg + seasons + (1|scan.id), | 9 | 305.46 | 5.39 | 0.027 | 0.132 |
| biomass:seasons + seasons + (1|scan.id), | 9 | 305.93 | 5.86 | 0.021 | 0.129 |
| Other behaviours | |||||
| ds.oa + group.size:seasons + seasons + site + (1|scan.id) | 13 | 909.25 | 0.00 | 0.357 | 0.471 |
| ds.oa:seasons + group.size:seasons + seasons + site + (1|scan.id) | 16 | 910.58 | 1.32 | 0.184 | 0.473 |
| biomass + ds.oa + group.size:seasons + seasons + site + (1|scan.id) | 14 | 910.60 | 1.35 | 0.182 | 0.470 |
| group.size:seasons + seasons + site + (1|scan.id) | 12 | 911.40 | 2.14 | 0.122 | 0.469 |
| ds.lg + group.size:seasons + seasons + site + (1|scan.id) | 13 | 912.39 | 3.13 | 0.074 | 0.471 |
| biomass + group.size:seasons + seasons + site + (1|scan.id) | 13 | 912.68 | 3.43 | 0.064 | 0.468 |
| Model | DF | AIC | ΔAIC | R2 |
|---|---|---|---|---|
| Bite rate | ||||
| ds.oa:biomass + ds.oa:seasons + biomass:seasons + ds.oa:biomass:seasons + seasons + site | 18 | 3143.88 | 0 | 0.22 |
| ds.oa:biomass + ds.oa:seasons + biomass:seasons + ds.oa:biomass:seasons + seasons + site + ds.lg | 19 | 3145.04 | 1.16 | 0.22 |
| ds.oa:seasons + biomass:seasons + ds.oa:biomass:seasons + seasons + site | 20 | 3145.53 | 1.65 | 0.22 |
| ds.oa:seasons + biomass:seasons + ds.oa:biomass:seasons + seasons + site + ds.lg | 21 | 3147.29 | 3.41 | 0.28 |
| biomass:seasons + ds.oa:biomass:seasons + seasons + site | 16 | 3165.61 | 21.73 | 0.16 |
| ds.oa:biomass + ds.oa:seasons + biomass:seasons + ds.oa:biomass:seasons + seasons + ds.lg | 16 | 3167.37 | 23.49 | 0.16 |
| Movement rate | ||||
| biomass:seasons + seasons | 9 | 1994.57 | 0 | 0.10 |
| biomass:seasons + biomass:site + seasons | 12 | 1998.13 | 3.56 | 0.10 |
| biomass:seasons + site + seasons | 12 | 2000.43 | 5.86 | 0.09 |
| biomass:site + biomass:season | 9 | 2004.35 | 9.78 | 0.07 |
| biomass:site + biomass:seasons + site + seasons | 15 | 2002.48 | 7.91 | 0.09 |
| biomass:seasons + site | 9 | 2007.47 | 12.90 | 0.06 |
Publisher’s Note: MDPI stays neutral with regard to jurisdictional claims in published maps and institutional affiliations. |
© 2021 by the authors. Licensee MDPI, Basel, Switzerland. This article is an open access article distributed under the terms and conditions of the Creative Commons Attribution (CC BY) license (https://creativecommons.org/licenses/by/4.0/).
Share and Cite
Fernández, T.; Lancaster, A.; Moraga, C.A.; Radic-Schilling, S.; von Hardenberg, A.; Corti, P. Behavioural Indicators of Intra- and Inter-Specific Competition: Sheep Co-Grazing with Guanaco in the Patagonian Steppe. Animals 2021, 11, 3333. https://doi.org/10.3390/ani11113333
Fernández T, Lancaster A, Moraga CA, Radic-Schilling S, von Hardenberg A, Corti P. Behavioural Indicators of Intra- and Inter-Specific Competition: Sheep Co-Grazing with Guanaco in the Patagonian Steppe. Animals. 2021; 11(11):3333. https://doi.org/10.3390/ani11113333
Chicago/Turabian StyleFernández, Tomás, Alex Lancaster, Claudio A. Moraga, Sergio Radic-Schilling, Achaz von Hardenberg, and Paulo Corti. 2021. "Behavioural Indicators of Intra- and Inter-Specific Competition: Sheep Co-Grazing with Guanaco in the Patagonian Steppe" Animals 11, no. 11: 3333. https://doi.org/10.3390/ani11113333
APA StyleFernández, T., Lancaster, A., Moraga, C. A., Radic-Schilling, S., von Hardenberg, A., & Corti, P. (2021). Behavioural Indicators of Intra- and Inter-Specific Competition: Sheep Co-Grazing with Guanaco in the Patagonian Steppe. Animals, 11(11), 3333. https://doi.org/10.3390/ani11113333