1. Introduction
Selection for growth rate (with the aim to improve feed to gain ratio) has been done in paternal rabbit lines. However, some study suggests a loss in the effectiveness of this selection [
1] which could be related to protein nutrition. Thus, with a diet containing 179 g CP/kg DM, [
2] did not observed differences in relative growth, while when a diet with 161 g CP/kg DM was used, animals selected by growth rate had greater dissectible fat percentage and lower meat to bone ratio [
3]. The authors of [
4] showed that animals selected by growth rate had lower protein retention and higher energy retention than expected. On the other hand, as a consequence of the irruption of the epizootic rabbit enteropathy, dietary protein content has tended to be reduced nowadays [
5]. In this context, the presence of some limiting amino acids could be suggested to explain the above commented findings.
The most frequently limiting amino acids are lysine, sulphur amino acids (methionine and cystine) and threonine. The requirements in these amino acids for growing rabbits are considered to be well-known [
6]. However, these current recommendations have been established from dose-response studies, and in these studies the interaction between amino acids is not taken into account (i.e., it has been demonstrated in broilers that the requirements of glycine increases if dietary levels of methionine or arginine are low; [
7]). Independently, most studies on amino acid requirements in growing rabbits were performed more than 25 years ago, so a review of these requirements seems necessary [
8,
9,
10].
A large number of studies showed that low levels of plasmatic urea nitrogen (PUN), which correspond to the amount of nitrogen in form of urea circulating in the bloodstream, could be related with performance in pigs [
11,
12] or in broilers. Furthermore, [
13,
14] have demonstrated that PUN could be an indicator to detect amino acid deficiencies in diets for growing rabbits and have proposed an appropriate methodology to determine it. Furthermore, an oversupply is costly and leads to an excessive nitrogen excretion with a potentially negative environmental impact [
15]. Knowing precise amino acid requirements could make it possible to develop different nutrition strategies with the aim to increase the biological value of the diet and reduce nitrogen excretion, improving the limitation of commonly use and non-environmentally friendly protein compounds in the rabbit diets.
The aim of this work was to evaluate PUN induced by the different dietary combinations of the three main limiting amino acids (using the current recommendations and increasing or decreasing them by 15%), in order to search for the combination minimizing PUN and, hypothetically, improving performance of rabbits with high growth rates.
2. Material and Methods
The experimental procedure was approved by the Animal Welfare Ethics Committee of the Universitat Politècnica de València and carried out following the recommendations of the European Group on Rabbit Nutrition [
16]. The experimental protocols followed the Spanish Royal Decree 53/2013 on the protection of animals used for scientific purposes [
17].
2.1. Experimenal Diets
Twenty-seven experimental diets were formulated starting from the same basal mixture (
Table 1). This basal mixture was formulated following the recommendations of all nutrients for growing rabbits [
6], with a moderate content of CP (155 g/kg DM) and DE (9.86 MJ/kg DM). The contents of lysine, sulphur amino acids and threonine were variable (in a previous work, [
4]) from the linear regression between protein retention and growth rate, we observed that protein retention in rabbit having very high growth rate was lower than expected, what would indicate some deficiency in amino acid supply. Then, we decided to compare PUN (a marker of the efficiency in the amino acid use) in rabbits with high growth rate fed with diets close to the current recommendations of the 3 main amino acids (medium), or having levels 15% higher (high) or 15% lower (low) of each. Thus, the main aim of this experiment is indicated in the title and expressed at the end of introduction section: “The aim of this work was to evaluate PUN induced by the different dietary combinations of the three main limiting amino acids (using the current recommendations and increasing or decreasing them by 15%), in order to search for the combination minimizing PUN and, hypothetically, improving performance of rabbits with high growth rates”, and three different levels were established for each of them (
Table 2). The first was close to the current recommendations (Medium, M), and two other levels were on average 15% higher (High, H) or lower (Low, L). Diets were named with three letters, with the first, second and third letters indicating lysine, sulphur amino acids and threonine levels, respectively.
2.2. Animals and Experimental Procedures
One thousand one hundred and thirty-four weaned rabbits (28 days old) were allocated in 162 cages (6 batches, 27 cages/batch) of 7 animals. Among the animals that remained healthy at 46 days of age, 918 (34/diet) were selected and used for the experiment. Animals were from two different genetic lines in order to obtain a great variability in growth rate. These lines were line H (founded following a criterion of hyper-prolificacy at birth [
18] and then selected by litter size at weaning over 17 generations, characterized by a large litter size at weaning but a standard growth rate) and line R [obtained after two generations of randomly mating from a pool of animals of three commercial paternal lines [
19] and then selected by average daily gain during the growing period over 38 generations, characterized by a high growth rate].
Throughout the experimental period (April to December), animals were kept at 15 °C to 22 °C, with a photoperiod of 16 h of light and 8 h of darkness. At weaning, animals were identified, weighed and allocated to a collective cage of 7 animals (by distributing animals from every mother and line among different cages). Then, animals were fed ad libitum with a commercial feed (added with 35 ppm valnemulin and 250 ppm neomycin) for growing rabbits until 46 days old. At 08:00h on day 47, each collective cage was randomly switched to one of the 27 experimental diets, which was provided ad libitum. Following the methodology described by [
14], at 08:00h on day 48 (after 24 h receiving the experimental diet), blood samples were taken from the central ear artery (1 mL in EDTA vials). Subsequently, the animals were subjected to 10 h of fasting and a second blood sample was extracted at 21:00h (3 h after refeeding). Blood samples were immediately centrifuged for 5 min at 700 G, and the supernatant plasma was frozen at −20 °C until further analysis. From this moment, animals were switched again to commercial feed provided ad libitum until 63 days old and then weighed to calculate the average daily gain during the growing period.
2.3. Chemical Analysis
The determination of PUN was performed using a commercial kit (Urea/BUN-Color, BioSystems S.A., Barcelona, Spain). The samples were defrosted and tempered, after which 1 μL was pipetted into test tubes (in each batch a standard and a blank were included). Later, 1 mL of reagent A (sodium salicylate 62 mmol/L, sodium nitroprusside 3.4 mmol/L, phosphate buffer 20 mmol/L and urease 500 U/mL) was added to each sample, mixed thoroughly and incubated for 5 min at 37 °C. Subsequently, 1 mL of reactant B (sodium hypochlorite 7 mmol/L and sodium hydroxide 150 mmol/L) was added, mixed thoroughly and incubated for other 5 min at 37 °C. Finally, the absorbance of each sample was read at 600 nm against the blank.
The amino acid content in diets was determined after acid hydrolysis with HCl 6N at 110 °C for 23 h as previously described [
20] using a Waters HPLC system (Milford, MA, USA) consisting of two pumps (Mod. 515, Waters, Milford, MA, USA), an autosampler (Mod. 717, Waters, Milford, MA, USA), a fluorescence detector (Mod. 474, Waters, Milford, MA, USA) and a temperature control module. Aminobutyric acid was added as an internal standard after hydrolysis. The amino acids were derivatised with 6-aminoquinolyl-N-hydroxysuccinimidyl carbamate and separated with a C-18 reverse-phase column Waters Acc. Tag (150 mm × 3.9 mm). Methionine and cystine were determined separately as methionine sulphone and cysteic acid, respectively, after performic acid oxidation followed by acid hydrolysis.
2.4. Statistical Analysis
Data of PUN were fitted to a normal distribution. Although the samples were obtained by the same animals in both moments (08:00h and 21:00h), two independent analyses (separately for each sampling time: 08:00h and 21:00h) were performed (the main reasons for this separation are that the different feeding conditions, ad libitum vs. restriction, and caecotrophy’s interference provoked different physiological conditions and led to high variability both in the means and on standard errors, and a lack of homoscedasticity). In both cases, PUN (obtained of 918 animals) was analyzed as a variable dependent using a GLM model from the Statistical Analysis System [
21], including the level of lysine, sulphur amino acid and threonine, all possible interactions (27 experimental diets) of these main effects, the batch effect and the average daily gain from 28 to 63 days old as covariates. Least square mean comparisons were performed by t-test. Furthermore, the representation of PUN obtained with each amino acid combination was fitted by linear regression using average daily gain as an independent variable with a regression (REG) procedure of SAS (SAS, 2009).
3. Results
Table 3 shows PUN values according to sampling time and the levels of the studied amino acids. The average PUN was highly dependent on the sampling conditions (mean ± standard error of mean of 11.47 ± 0.088 and 18.29 ± 0.152 mg/dL at 08:00 and 21:00h, respectively,
p < 0.001).
At 08:00h, PUN was higher with the L level of lysine (+1.08 ± 0.165 mg/dL, +9.7%, p < 0.001), unaffected by the level of sulphur amino acids and increased with the level of threonine. No significant effects of double or triple interactions and covariate (average daily gain) were detected (p > 0.2).
At 21:00h, PUN was higher with the H level of lysine (+1.05 ± 0.262 mg/dL, +6%,
p < 0.001) and no significant effects of the levels of sulphur amino acids and threonine were observed. Nevertheless, interactions sulphur amino acids*threonine and lysine*sulphur amino acids*threonine as well as covariate (average daily gain) were significant (
p < 0.001).
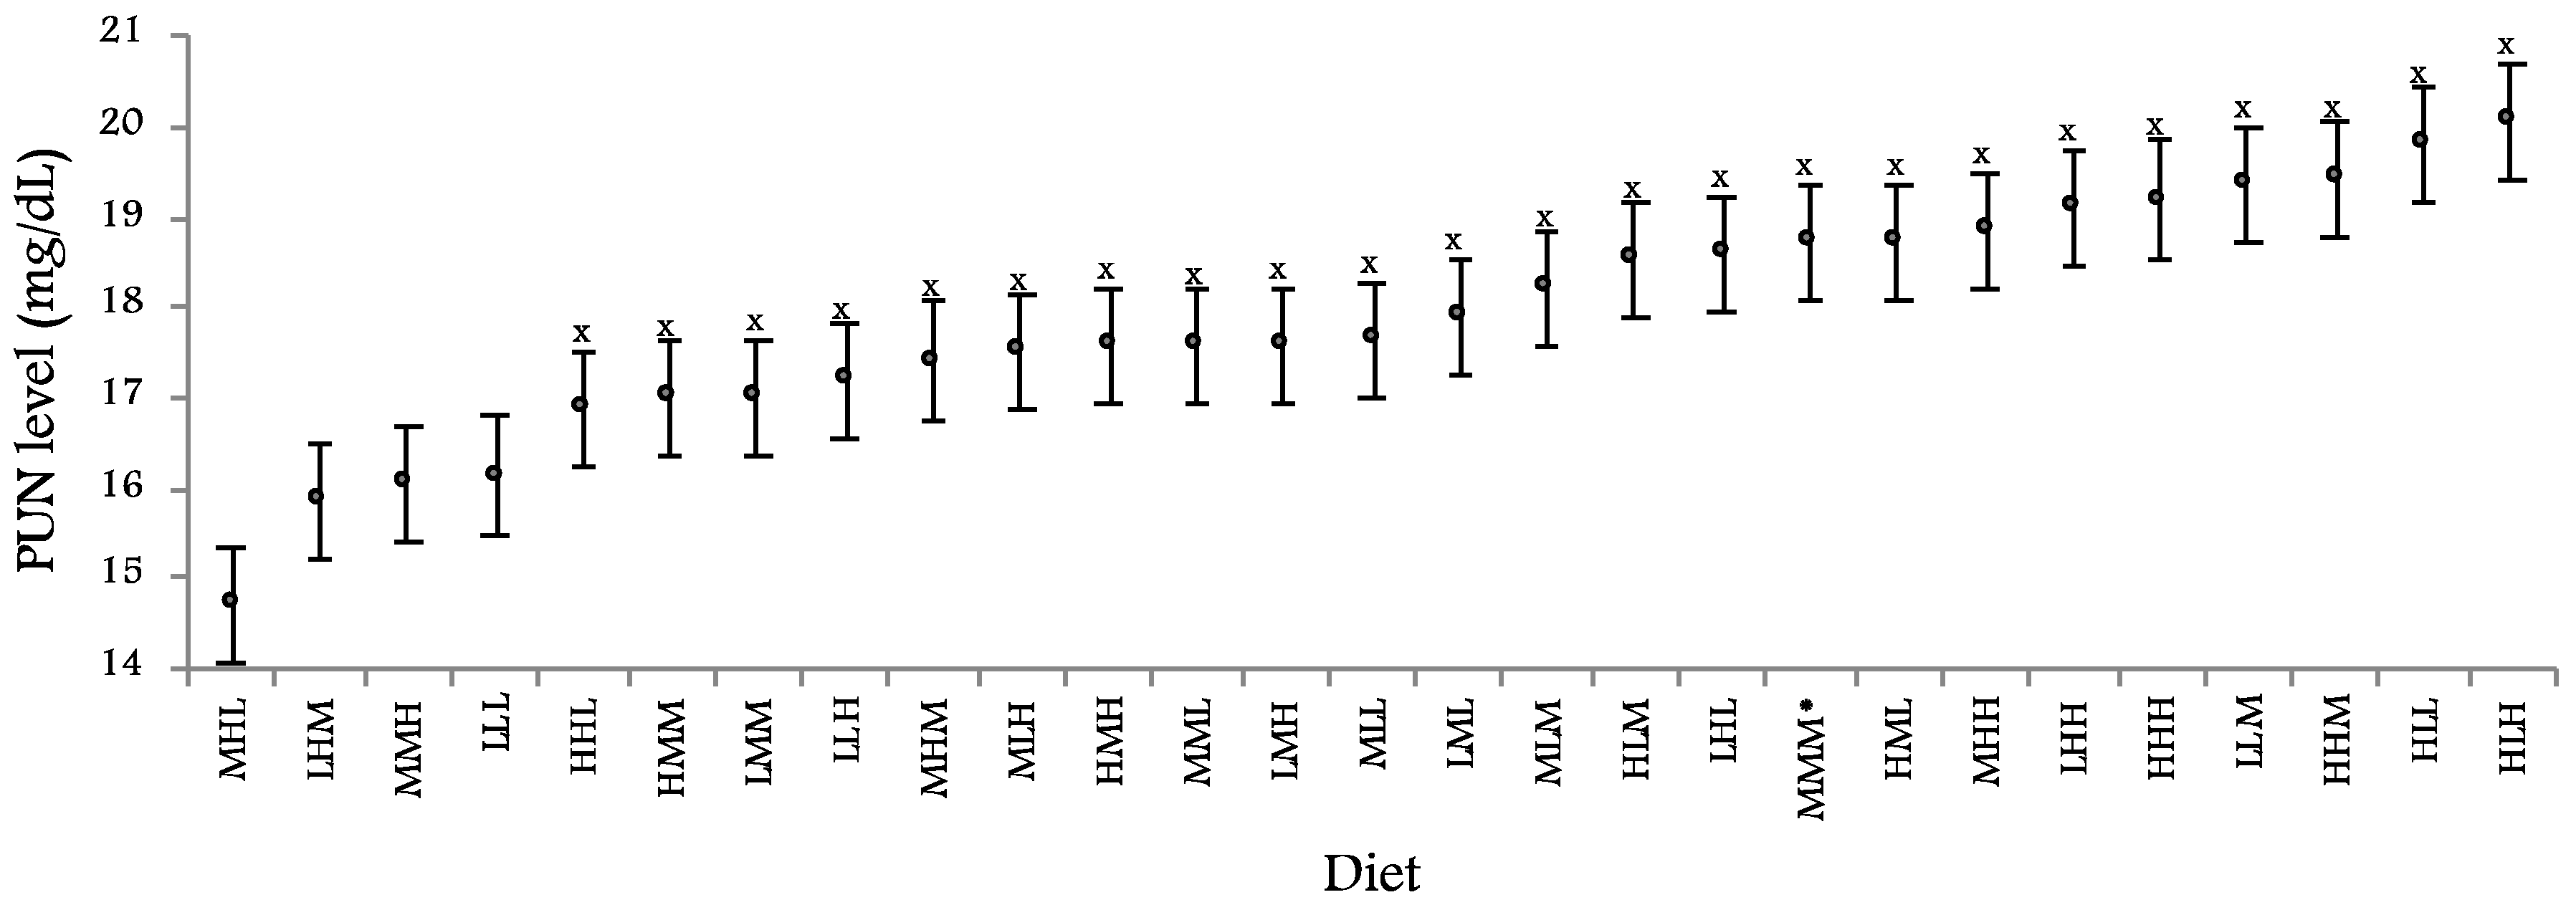
Figure 1 shows PUN values obtained with the 27 experimental diets. Minimum PUN (14.72 ± 0.661 mg/dL) was observed with the MHL diet, although its difference with the 3 nearest values (LHM, MMH and LLL diets) was not significant (−1.29 ± 0.759 mg/dL,
p = 0.090).
The overall average daily gain was 44.1 ± 0.28 g/d (mean ± standard error).
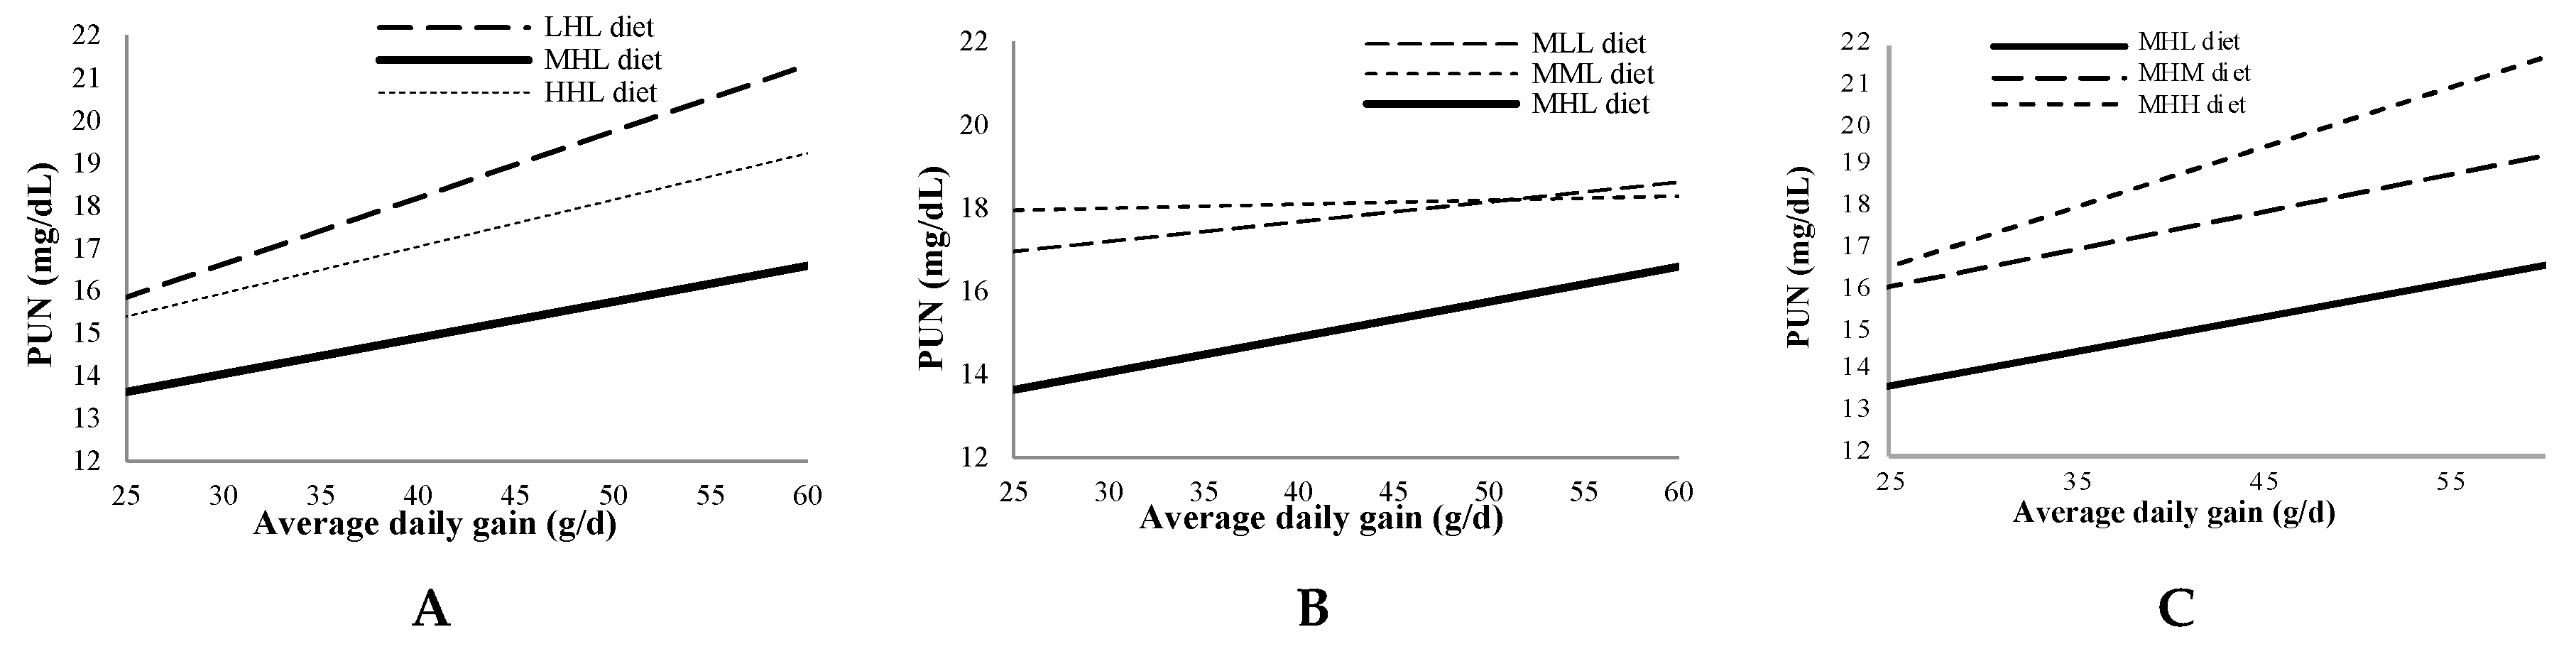
Figure 2 shows the relationship between PUN at 21:00h with the average daily gain for the MHL diet compared with diets varying only in the level of one amino acid. The average daily gain widely varied because two genetic lines were used, with lower values (25–35 g/d) being usual in healthy animals from maternal lines selected by litter size at weaning, as demonstrated in line H. PUN tended to increase systematically, with average daily gain being regularly lower with MHL diet.
4. Discussion
In the current study, PUN varied depending on the sampling conditions, being widely higher when blood samples were taken at 21:00h—i.e., 3 h after refeeding following a 10-h fasting period—than at 8:00h under ad libitum feeding. These results closely agree with those obtained by [
14] for the same times and feeding managements, as a result of low feed intake during morning (when rabbits are practicing caecotrophy) and the overeating at evening after a fasting period—since the higher the protein intake, the higher the PUN [
22], because of the catabolism of a greater amount of leftover amino acids. Additionally, the essential amino acid content in microbial proteins recycled through soft feces could improve the quality of dietary protein and reduce protein catabolism, although the amino acid supply from soft feces does not seem to be enough to alter the amino acid pattern of conventional diets [
23].
From the results at 21:00h, when there is no caecotrophy interference, the MHL diet seemed to be the candidate to be the best-balanced diet in order to minimize PUN. Although the other three diets (LHM, MMH and LLL diets) induced PUN values that were not significantly higher than the MHL diet, there are some indications in the results obtained at 08:00h that these diets would be suboptimal. Thus, L lysine diets (as LHM and LLL diets) caused higher PUN values at 08:00h; probably because of a lysine deficiency that was not compensated with a supply from soft feces; according to the literature [
24,
25,
26] lysine content in soft feces averages 4.9% of CP, although with some diets this value is lower than in L lysine diets (4.3% of CP). Moreover, increasing threonine level (as in LHM and MMH diet) provoked higher PUN values at 08:00h compared to L threonine diets, which could be interpreted as a result of an excess of threonine; in fact, soft feces are particularly rich in threonine, the only essential amino acid to whose supply they contribute significantly more than to CP supply [
22], averaging 5.5% of CP according the above cited literature, and usually being higher than in H threonine diets (5.3% of CP).
In an experiment combining 5 levels of lysine with 3 levels of sulphur amino acids, the minimum urinary nitrogen excretion in rabbits was estimated to be 7.9 and 6.4 g/kg DM for lysine and sulphur amino acids, respectively [
27].
On the other hand, PUN at 21:00h increased with average daily gain, probably as a consequence of increasing feed intake. Interestingly, the MHL diet minimized PUN throughout the entire average daily gain range, compared with diets varying only in the level of one amino acid, suggesting that the requirements in the studied amino acids, expressed as a proportion of DM, would not be dependent on growth rate.
Taking the usual recommendations (established for a diet containing 11.3 MJ DE/kg DM, and then being 0.72, 0.51 and 0.61 g/MJ DE for lysine, sulphur amino acids and threonine, respectively) into account, these results suggest that a diet containing more lysine and sulphur amino acids per energy unit (around 0.82 and 0.67 g/MJ DE) could better fit the growing rabbit requirements, although studies on the effects of such a diet on performance and protein retention are necessary.
5. Conclusions
As PUN is a marker of the efficiency of amino acid use, the combination of the three main limiting amino acids minimizing it found in the current study is a good candidate to be tested in order to improve performance and reduce pollution in growing rabbits.
Author Contributions
Conceptualization, P.J.M.-G., E.B., J.J.P.; methodology, P.J.M-G., L.R., E.M.M.-P., M.C.L.-L., E.B., J.J.P.; software, P.J.M.-G., E.B., J.J.P.; validation, P.J.M.-G., B.E., J.J.P.; formal analysis, P.J.M-G., E.B., J.J.P.; investigation, P.J.M.-G., E.B., J.J.P.; resources, E.B., J.J.P.; data curation, P.J.M-G., writing—original draft preparation, P.J.M.-G., E.B., J.J.P.; writing—review and editing, P.J.M.-G., E.B., J.J.P.; visualization, P.J.M.-G., E.B., J.J.P.; supervision, E.B., J.J.P.; project administration, E.B., J.J.P.; funding acquisition, E.B., J.J.P. All authors have read and agreed to the published version of the manuscript.
Funding
This research was funded by Spanish Government (AGL2017-85162-C2-1-R) and a grant for Marín-García P.J. (FPU-2014-01203).
Acknowledgments
This study was supported by the Interministerial Commission for Science and Technology (CICYT) from the Spanish Government (AGL2017-85162-C2-1-R). The grant for Pablo Marín from the Ministry of Education, Culture and Sports (FPU-2014-01203) is also gratefully acknowledged.
Conflicts of Interest
The authors declare no conflict of interest.
Abbreviations
| ADG | Average daily gain |
| CP | Crude protein |
| DE | Digestible Energy |
| DM | Dry matter |
| H | High |
| L | Low |
| M | Medium |
| PUN | Plasmatic urea nitrogen |
| SAS | Statistical analysis system |
References
- Quevedo, F.; Cervera, C.; Blas, E.; Baselga, M.; Pascual, J.J. Long-term effect of selection for litter size and feeding programme on the performance of reproductive rabbit does 2. Lactation and growing period. J. Anim. Sci. 2006, 82, 751–762. [Google Scholar] [CrossRef]
- Pascual, M.; Pla, M.; Blasco, A. Effect of selection for growth rate on relative growth in rabbits. J. Anim. Sci. 2008, 89, 3409–3417. [Google Scholar] [CrossRef] [PubMed]
- Pascual, M.; Pla, M. Changes in carcass composition and meat quality when selecting rabbits for growth rate. Meat Sci. 2007, 77, 474–481. [Google Scholar] [CrossRef] [PubMed]
- Marín-García, P.J.; Ródenas LMartínez-Paredes, E.; Cambra-López, M.; Blas, E.; Pascual, J.J. A moderate protein diet does not cover the requirements of growing rabbits with high growth rate. J. Anim. Sci. 2020, 264. [Google Scholar] [CrossRef]
- Carabaño, R.; Villamide, M.J.; García, J.; Nicodemus, N.; Llorente, A.; Chamorro, S.; Menoyo, D.; García-Rebollar, P.; García-Ruiz, A.I.; de Blas, J.C. New concepts and objectives for protein-amino acid nutrition in rabbits: A review. World Rabbit Sci. 2009, 17, 1–14. [Google Scholar] [CrossRef]
- de Blas, J.C.; Gonzalez-Mateos, G. Feed Formulation. In Nutrition of the Rabbit, 2nd ed.; de Blas, C., Wiseman, J., Eds.; CABI International: Wallingford, UK, 2010; pp. 222–232. [Google Scholar]
- McDonald, P.; Edwards, R.A.; Greenhalgh, J.F.D. (Eds.) Nutrient requirements. In Animal Nutrition, 4th ed.; Pearson: London, UK, 1988; p. 337. [Google Scholar]
- Taboada, E.; Méndez, J.; de Blas, C. The response of highly productive rabbits to dietary sulphur amino acid content for reproduction and growth. Reprod. Nutr. Develop. 1996, 36, 191–203. [Google Scholar] [CrossRef]
- Taboada, E.; Méndez, J.; Mateos, G.G.; de Blas, C. The response of highly productive rabbits to dietary lysine content. Livest. Prod. Sci. 1994, 40, 329–337. [Google Scholar] [CrossRef]
- de Blas, C.; Taboada, E.; Nicodemus, N.; Campos, R.; Piquer, J.; Méndez, J. Performance response of lactating and growing rabbits to dietary threonine content. Anim. Feed Sci. Technol. 1998, 70, 151–160. [Google Scholar] [CrossRef]
- Roth-Maier, D.A.; Orr, H.; Roth, F.X.; Paulicks, B.R. Effects of the level of dietary valine supply on amino acids and urea concentration in milk and blood plasma of lactating sows. J. Anim. Physiol. Anim. Nutr. 2004, 88, 39–45. [Google Scholar] [CrossRef]
- Nieto, T.; Barea, R.; Lara, L.; Palma-Granados, P.; Aguilera, J.F. Lysine requeriment relative to total dietary protein for optimum performance and carcass protein deposition of Iberian piglets. J. Anim. Sci. 2015, 206, 48–56. [Google Scholar]
- Donsbough, A.L.; Powell, S.; Waguespack, A.; Bidner, T.D.; Southern, L. Uric acid, urea, and ammonia concentrations in serum and uric acid concentration in excreta as indicators of amino acid utilization in diets for broilers. Poult. Sci. 2010, 89, 287–294. [Google Scholar] [CrossRef] [PubMed]
- Marín-García, P.J.; Ródenas LMartínez-Paredes, E.; Blas, E.; Pascual, J.J. Plasma urea nitrogen as an indicator of amino acid imbalance in rabbit diets. World Rabbit Sci. 2020. (In press)
- Van Milgen, J.; Dourmad, J.Y. Concept and application of ideal protein for pigs. J. Anim. Sci. Biotechnol. 2015, 6, 15. [Google Scholar] [CrossRef] [PubMed]
- Fernández-Carmona, J.; Blas, E.; Pascual, J.J.; Maertens, L.; Gidenne, T.; Xicatto, G.; García, J. Recommendations and guidelines for applied nutrition experiments in rabbits. World Rabbit Sci. 2005, 13, 209–228. [Google Scholar] [CrossRef]
- del Estad, B.O.o. Real Decreto 53/2013, Por el Que se Establecen las Normas Básicas Aplicables Para la Protección de los Animales Utilizados en Experimentación y Otros Fines Científicos, Incluyendo la Docencia. BOE 34. 2013, pp. 11370–11421. Available online: https://www.boe.es/diario_boe/txt.php?id=BOE-A-2013-1337 (accessed on 25 May 2020).
- Cifre, J.; Baselga, M.; García-Ximénez, F.; Vicente, J.S. Performance of a hyperprolific rabbit line I. Litter size traits. J. Anim. Breed. Genet. 1998, 115, 131–138. [Google Scholar] [CrossRef]
- Estany, J.; Camacho, J.; Baselga, M.; Blasco, A. Selection response of growth rate in rabbits for meat production. Genet. Sel. Evol. 1992, 24, 527–537. [Google Scholar] [CrossRef]
- Bosch, L.; Alegría, A.; Farré, R. Application of the 6-aminoquinolyl-N-hydroxysccinimidyl carbamate (AQC) reagent to the RP-HPLC determination of amino acids in infant foods. J. Chromatogr. 2006, 831, 176–183. [Google Scholar] [CrossRef]
- SAS. SAS/STAT ® 9.2 User’s Guide Version 9; SAS Institute Inc.: Cary, NC, USA, 2009. [Google Scholar]
- Eggum, B.O. Blood urea measurement as a technique for assessing protein quality. Br. J. Nutr. 1970, 24, 983–988. [Google Scholar] [CrossRef]
- Villamide, M.J.; Nicodemus, N.; Fraga, M.J.; Carabaño, R. Protein digestion. In Nutrition of the Rabbit, 2nd ed.; de Blas, C., Wiseman, J., Eds.; CABI International: Wallingford, UK, 2010; pp. 39–55. [Google Scholar]
- Nicodemus, N.; Mateos, J.; de Blas, J.C.; Carabaño, R.; Fraga, M. Effect of diet on amino acid composition of soft faeces and the contribution of soft faeces to total amino acid intake, through caecotrophy in lactating doe rabbits. J. Anim. Sci. 1999, 69, 167–170. [Google Scholar] [CrossRef]
- García, A.I.; de Bias, J.C.; Carabaño, R. Effect of type of diet (casein-based or protein-free) and caecotrophy on ileal endogenous nitrogen and amino acid flow in rabbits. Animal Sci. 2004, 79, 231–240. [Google Scholar] [CrossRef]
- García, A.I.; de Blas, J.C.; Carabaño, R. Comparison of different methods for nitrogen and amino acid evaluation in rabbit diets. Animal Sci. 2005, 80, 169–178. [Google Scholar]
- Monteiro-Motta, A.C.; Scapinello, C.; Oliveira, A.F.G.; Figueira, J.L.; Catelan, D.; Sato, J.; Stanquevis, C.E. Levels of lysine and methionine+cystine for growing New Zealand White rabbits. Rev. Bras. Zootec. 2013, 42, 862–868. [Google Scholar] [CrossRef]
© 2020 by the authors. Licensee MDPI, Basel, Switzerland. This article is an open access article distributed under the terms and conditions of the Creative Commons Attribution (CC BY) license (http://creativecommons.org/licenses/by/4.0/).

 ,
, 


