Article

A Novel System for Real-Time, In Situ Monitoring of CO2 Sequestration in Photoautotrophic Biofilms

1
Department of Chemistry and Biology, Ryerson University, 350 Victoria St., Toronto, ON M5B 2K3, Canada
2
Department of Microbiology, Stellenbosch University, Private Bag X1, Matieland 7602, South Africa
*
Author to whom correspondence should be addressed.
Microorganisms 2020, 8(8), 1163; https://doi.org/10.3390/microorganisms8081163
Submission received: 16 June 2020 / Revised: 9 July 2020 / Accepted: 24 July 2020 / Published: 31 July 2020
(This article belongs to the Special Issue Mono- and Multi-Species Biofilms in Bioprocesses)

Abstract

:
Climate change brought about by anthropogenic CO2 emissions has created a critical need for effective CO2 management solutions. Microalgae are well suited to contribute to efforts aimed at addressing this challenge, given their ability to rapidly sequester CO2 coupled with the commercial value of their biomass. Recently, microalgal biofilms have garnered significant attention over the more conventional suspended algal growth systems, since they allow for easier and cheaper biomass harvesting, among other key benefits. However, the path to cost-effectiveness and scaling up is hindered by a need for new tools and methodologies which can help evaluate, and in turn optimize, algal biofilm growth. Presented here is a novel system which facilitates the real-time in situ monitoring of algal biofilm CO2 sequestration. Utilizing a CO2-permeable membrane and a tube-within-a-tube design, the CO2 sequestration monitoring system (CSMS) was able to reliably detect slight changes in algal biofilm CO2 uptake brought about by light–dark cycling, light intensity shifts, and varying amounts of phototrophic biomass. This work presents an approach to advance our understanding of carbon flux in algal biofilms, and a base for potentially useful innovations to optimize, and eventually realize, algae biofilm-based CO2 sequestration.

1. Introduction

Over the past two centuries, human activity has had a pronounced effect on the natural environment [1]. Anthropogenic CO2 emissions have led to a range of detrimental environmental impacts, including the acidification of ocean waters, rising sea levels, and increasing global temperatures [2,3]. Accordingly, climate change mitigation and CO2 management have become a top priority globally, which is increasingly reflected in our political, social, and economic realms.
Engineered bio-sequestration systems which exploit the natural CO2-capturing ability of photosynthetic plants and algae potentially represent a viable and valuable compliment to current CO2 management strategies [4]. Microalgae are particularly well suited for this, given their superior growth and CO2-fixation rates compared to terrestrial plants [5], as well as the commercial value of their biomass. For example, microalgal biomass can be used as animal feed and fertilizer with minimal downstream processing required [6]. It is also a source of numerous valuable compounds such as pigments, cosmetic products, and nutraceuticals like omega-3 fatty acids [5,7,8], and the lipid-rich nature of algal cells makes them an attractive biodiesel feedstock [9,10,11].
The commercial value of microalgal biomass enables a direct link between CO2 sequestration and the generation of value-added products which can be used to subsidize the overall process [7]. Despite the benefits of such an approach, there is a need for further research focusing on developing new tools, growth systems, and methodologies to make this an economically viable, large-scale option [3,12]. Notably, the ability to track and measure the culture’s CO2 uptake rate and efficiency in real time is crucial in order to allow for process monitoring, assessment, and optimization.
To date, studies exploring microalgal CO2 sequestration and biomass production have focused predominantly on suspended cultures [13,14]. In nature, however, microalgae, like most microorganisms, commonly grow as aggregates in suspension, or attached to solid surfaces as biofilms. The cells within these aggregates are encased in a matrix of extracellular polymeric substances (EPSs) and exhibit markedly different physiological and metabolic characteristics compared to single planktonic cells of the same species [15]. From an algae cultivation perspective, biofilm growth systems offer several key advantages over the more conventional suspended growth systems. For example, the time, energy, and financial costs associated with biomass harvesting and dewatering are lessened significantly [14]. Immobilization of the cells in biofilm growth systems creates the potential for more efficient use of light through the positioning of concentrated biomass for optimum light harvesting [16,17].
Conventionally, CO2 uptake is assessed by weighing the algal biomass produced and, using an approximate algal cell carbon content of 40–50%, stoichiometrically calculating the amount of carbon sequestered [18,19]. However, since this is a destructive measurement, it provides little insight about a biofilm’s performance during active growth. Furthermore, the fact that many algal strains are also able to metabolize organic carbon through mixotrophic growth can make such calculations problematic [20]. Another means of quantifying algal CO2 sequestration is by measuring effluent pH. As dissolved CO2 is taken up and fixed, the resulting effluent pH rise can be measured and used as an indirect indicator of changes in CO2 concentration. However, since other factors such as nitrogen assimilation can also influence effluent pH, CO2 quantification on this basis alone may be inaccurate [21]. Lastly, CO2 electrodes exist which can be used to monitor dissolved CO2 concentrations. However, such probes can be prohibitively expensive, become fouled, and are often not adequately sterilizable [21]. Therefore, a system which can accomplish non-destructive monitoring of CO2 sequestration by photoautotrophic biofilms in real time is strongly desirable.
Presented here is a novel system for the real-time in situ monitoring of biofilm bio-sequestration. Building upon the CO2 evolution measurement system (CEMS) first described by Kroukamp and Wolfaardt [22], the present CO2 sequestration monitoring system (CSMS) was used to quantify the CO2 uptake rate of photoautotrophic biofilms under various conditions. The data presented demonstrates the ability of the CSMS to detect and monitor CO2 flux during (i). light–dark cycling, (ii). long- and short-duration light intensity shifts, and (iii). changing amounts of photoautotrophic biomass in the system. This work presents an approach to advance our understanding of carbon flux in algal biofilms, carbon exchange between autotrophic and heterotrophic biofilms, as well as a base for potentially useful innovations to optimize, and eventually realize, algae biofilm-based CO2 sequestration.

2. Materials and Methods

2.1. System Configuration

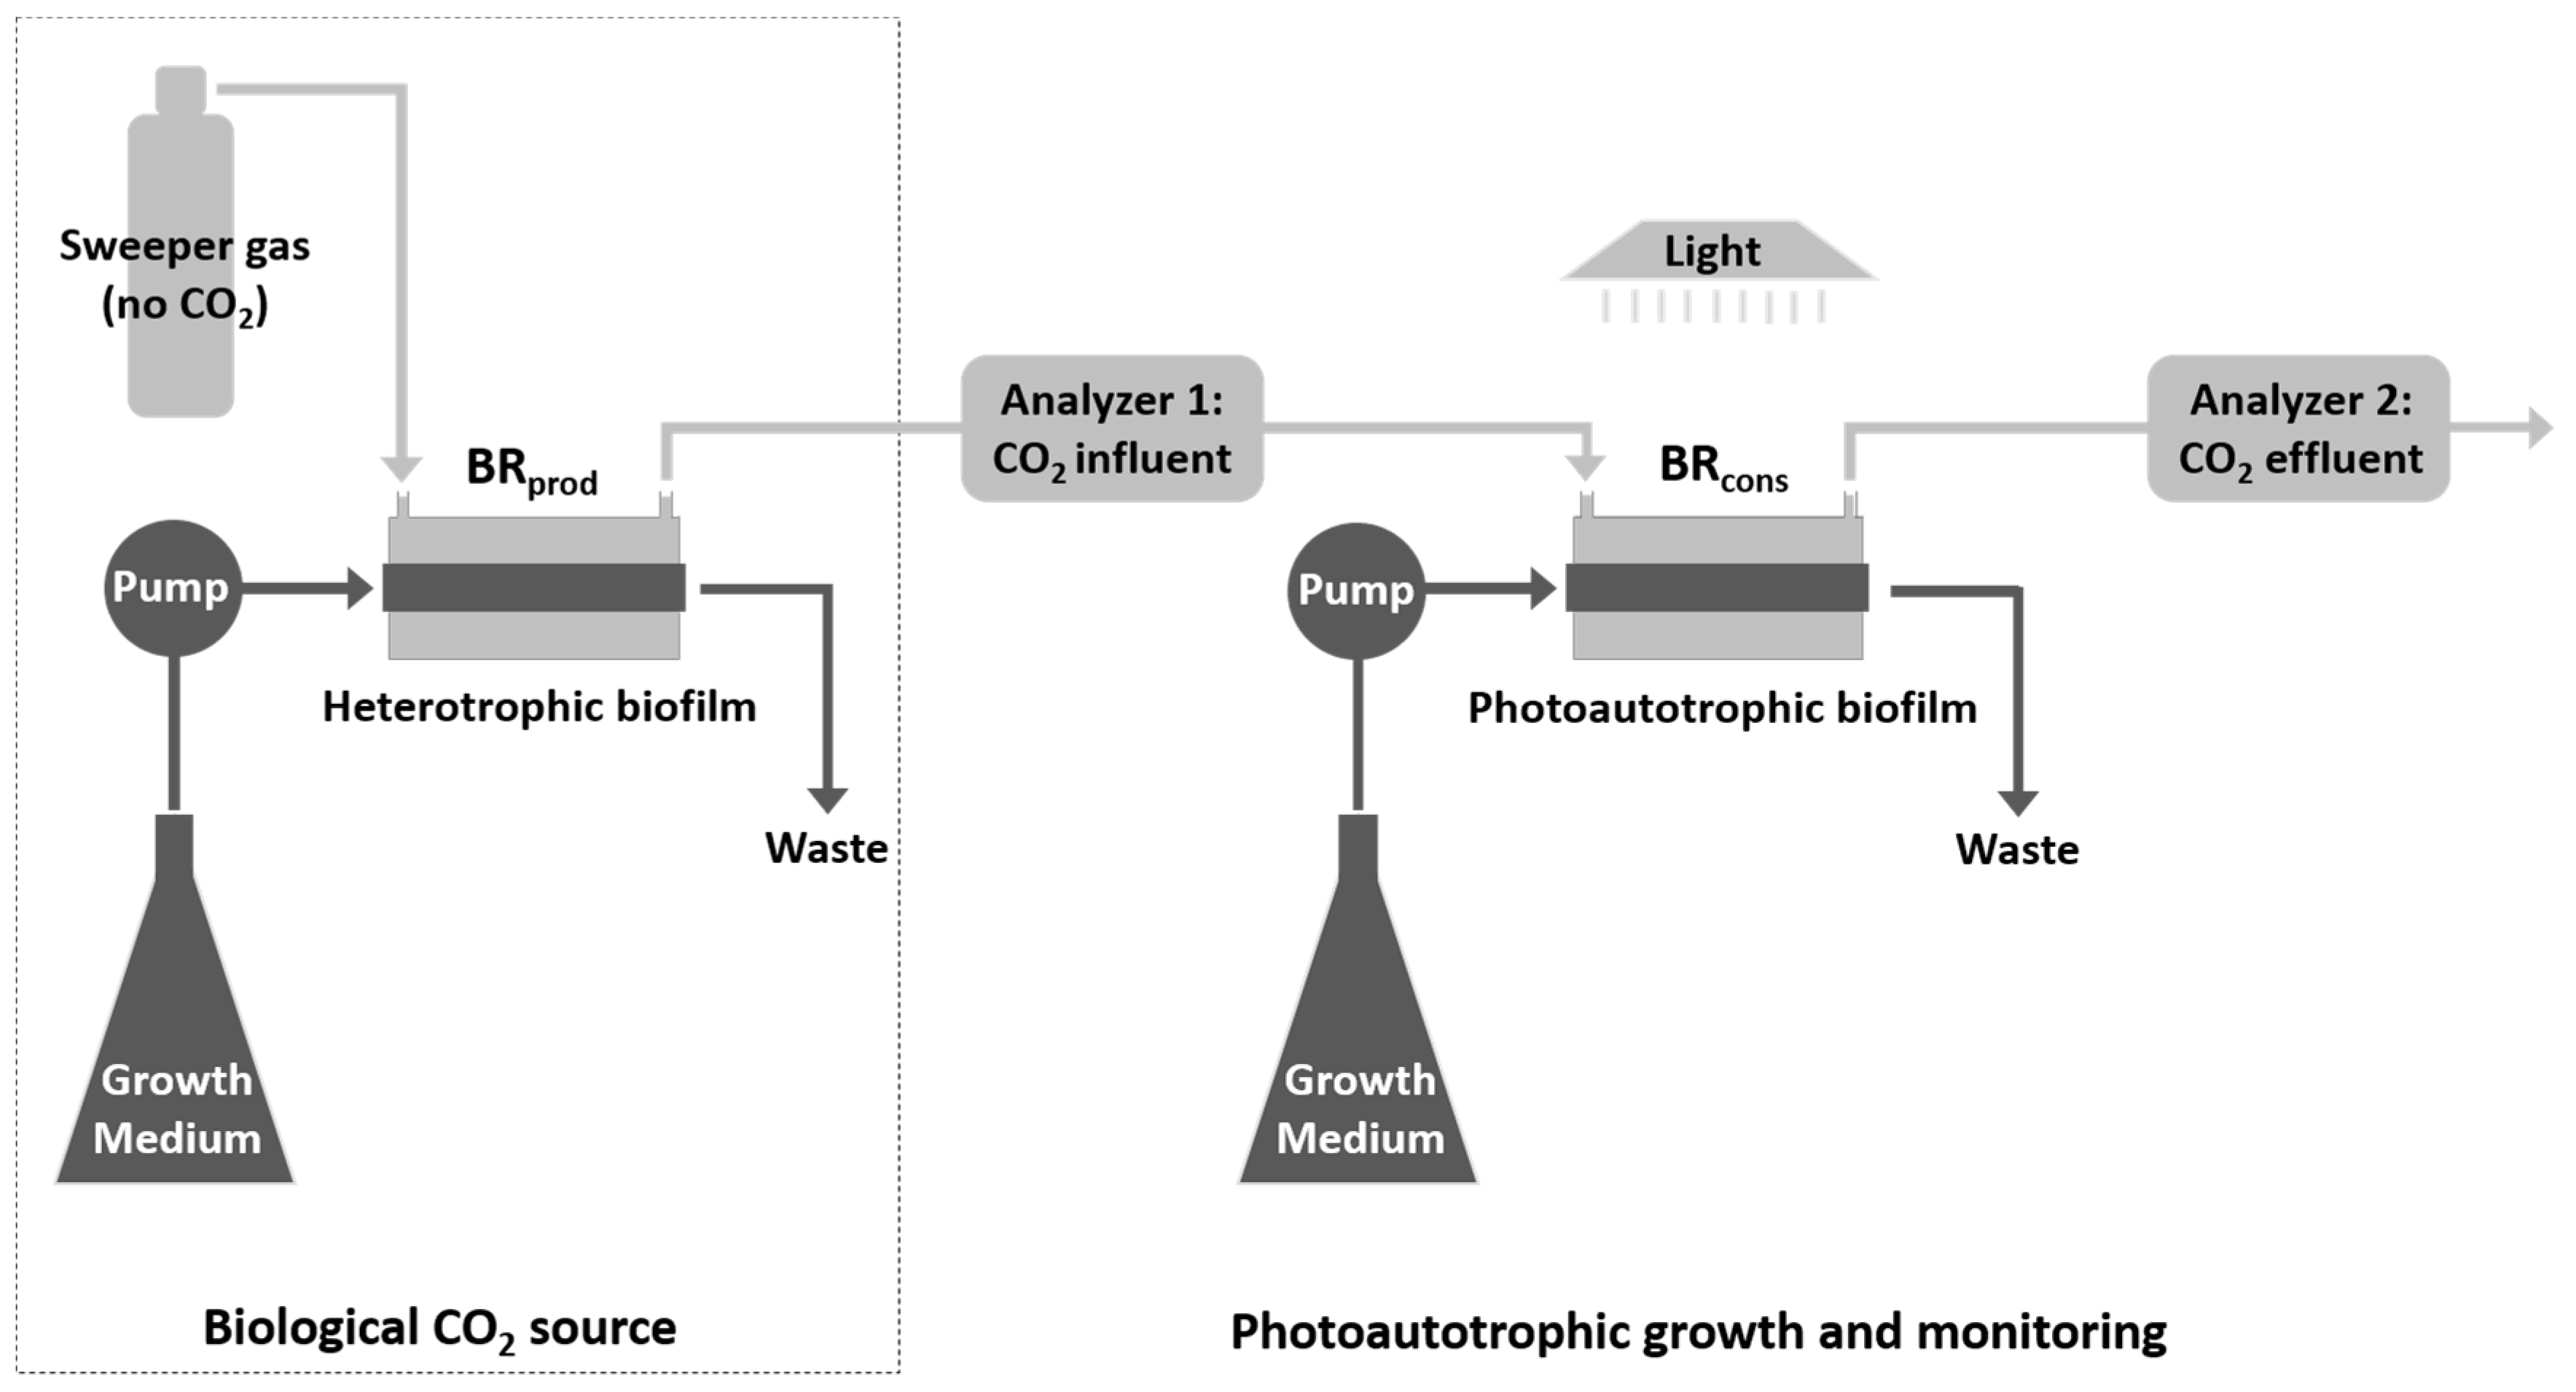
The CSMS used in this study comprises two distinct biofilm reactor (BR) modules. The first, referred to as BRprod (CO2 producer), is used to grow a heterotrophic bacterial biofilm, which serves as a biotic source of concentrated CO2. The second, BRcons (CO2 consumer), is used to grow the photoautotrophic biofilm of interest. Each BR consists of a tube-within-a-tube design (Figure 1).
Biofilms were grown inside a CO2-permeable silicone tube (1.57 mm ID, 2.41 mm OD, 0.41 mm wall thickness; VWR International, Mississauga, ON, Canada) 150 cm in length, with a volume of 2.9 mL and approximately 74 cm2 of colonizable surface area. Housing this tube was a larger diameter CO2-impermeable Tygon™ tube also 150 cm in length (4.76 mm ID, 7.94 mm OD, 1.58 mm wall thickness, E-3603 formulation; VWR International, Mississauga, ON, Canada). The total volume of this tube, accounting for the volume occupied by the inner silicone tube, was 19.85 mL (Table 1). Protruding near the influent and effluent end of the outer Tygon™ tube was smaller diameter Tygon™ tubing (1.59 mm ID, 3.18 mm OD, 0.79 mm wall thickness, E-3603 formulation; VWR International, Mississauga, ON, Canada). Sealant was used to ensure the connections were airtight.
Liquid growth medium pumped through the inner silicone tube provided nutrients to the biofilm. The silicone membrane has a high CO2 permeability (2013.2 Barrer), which allowed CO2 molecules to readily pass between the aqueous environment inside this tube, and the dry, gaseous environment in the annular space. BRprod and BRcons were separately supplied with sterile growth medium to grow heterotrophic bacterial, and photoautotrophic biofilms, respectively. In contrast, the gas flow in the annular space was continuous through both BRs (Figure 2), allowing the heterotrophic biofilm in BRprod to serve as a biotic source of CO2 to the photoautotrophic biofilm growing inside BRcons.

2.2. Gas Channeling and Monitoring

A sweeper gas of CO2-free air (TOC grade, 24001980; Linde Canada Limited, Concord, ON, Canada) was channeled into the annular space of the system at a constant flow rate of 2.5 mL/min using a mass flow controller (GFC17 mass flow controller; Aalborg Instruments & Controls, Inc., Orangeburg, NY, USA). This carried CO2 produced by the heterotrophic biofilm in BRprod to BRcons via a non-dispersive infrared CO2 analyzer (Analyzer 1) (LI-820; LI-COR Biosciences, Lincoln, NE, USA). The analyzer has a precision in the range of ~1 ppm and was used to measure and log the CO2 concentration at one-minute intervals.
As the photoautotrophic biofilm inside BRcons developed, its rate of CO2 uptake increased, as reflected by the consequent decrease in the amount of gaseous CO2 reaching Analyzer 2, positioned downstream of BRcons (Figure 2). The difference in CO2 concentration logged by Analyzers 1 and 2 (BRcons CO2 influent and effluent, respectively) thus provided a real-time measure of CO2 uptake by the photoautotrophic biofilm. By default, the analyzers record CO2 concentration in parts per million (ppm). However, given a gas flow rate of 2.5 mL/min and the fact that the temperature and pressure inside the CO2 analyzers are also recorded (typically 50 °C and 100 kPa, respectively), the ideal gas law can be applied to convert these raw ppm values to rates of CO2 uptake, provided in units of µmol/h.

2.3. Light Exposure and Intensity

The photoautotrophic biofilm in BRcons was illuminated with a fluorescent plant-growth light (JSV2 Jump Start T5 Grow Light System; Hydrofarm Inc., Petaluma, CA, USA). The bulb provided simulated sunlight with a 6400 K color temperature. This lighting system affords the ability to raise and lower the light as desired. Unless otherwise stated, illumination was provided 5 cm above the biofilm, resulting in a photosynthetic photon flux density (PPFD) of approximately 141.79 µmol/m2/s.

2.4. Growth Media

The heterotrophic biofilm in BRprod was fed a tryptic soy broth at a flow rate of 0.25 mL/min using a Watson Marlow 205S peristaltic pump. This medium was prepared as a 0.6 g/L solution, which is a 2% concentration relative to the manufacturer’s directions for typical batch experiments. The resulting composition was 0.34 g/L casein peptone, 0.06 g/L soya peptone, 0.1 g/L sodium chloride, 0.05 g/L dipotassium hydrogen phosphate, and 0.05 g/L glucose. Media were prepared in distilled water and autoclaved at 121 °C for 20 min prior to use.
The photoautotrophic biofilm in BRcons was fed a modified Bold’s Basal Medium (M-BBM) (also at 0.25 mL/min) with a composition of 0.22 g/L (NH4)2SO4, 0.025 g/L NaCl, 0.025 g/L CaCl2 · 2H2O, 0.075 g/L MgSO4 · 7H2O, 0.175 g/L KH2PO4, 0.075 g/L K2HPO4, 8.34 mg/L FeSO4. It should be noted that no carbon was provided in the liquid medium. All medium components were maintained in filter-sterilized 100× stock solutions, which were combined and diluted in distilled water and autoclave sterilized at 121 °C for 20 min prior to use. The CSMS represents a plug flow reactor, with the BR module having a retention time of 11.6 min and a dilution rate of 5.17 h−1. This greatly exceeds the maximum specific growth rate values of microalgal and bacterial strains [23,24,25], which ensures that non-biofilm-bound cells are readily washed out the system.

2.5. Test Cultures and System Inoculation

BRprod and BRcons were inoculated with a heterotrophic and photoautotrophic culture, respectively. The heterotrophic culture used was Pseudomonas aeruginosa (PA01) [26], previously labelled with GFP via a mini-Tn7 transposon system [27]. For each CSMS experiment, PA01 was inoculated as an overnight culture, prepared by transferring one colony from a tryptic soy agar plate into 10 mL of 0.6 g/L tryptic soy broth and incubated overnight on a rotary shaker at 30 °C.
BRcons was the “test module” in which the photoautotrophic biofilm of interest was grown and studied. The culture used was initially enriched from an aerated wastewater lagoon in Dundalk, Ontario, Canada. A 5 mL sample was inoculated into 145 mL of M-BBM and illuminated continuously with the fluorescent plant growth light. Filtered ambient air was bubbled into the culture to provide mixing and dissolved CO2. When the culture was sufficiently dense (qualitatively green and turbid), a 10 mL aliquot was transferred to 90 mL of fresh medium and placed under the same conditions. This transferring procedure was repeated biweekly, ensuring that the photoautotrophic culture inoculated into BRcons was not more than 14 days old.
Sterile syringes were used to inoculate reactors by injecting 3 mL of the appropriate culture into the respective BRs through the silicone tubing just upstream of the reactor. A 22-gauge hypodermic syringe needle was used to pierce the tubing, and a dollop of silicone glue was used to seal this puncture as the needle was removed. Liquid medium flow was paused during inoculation and for a period of one hour following this to allow for some cell adherence.
The BRs were inoculated concurrently, with the exception of the first experiment. In that case, BRcons was inoculated with the photoautotrophic culture approximately 24 h after the inoculation of PA01 into BRprod, once the CO2 output of the heterotrophic biofilm had plateaued. This allowed for the assessment of CO2 uptake during early stage photoautotrophic biofilm development, which was not possible when the BRs were inoculated concurrently. In subsequent experiments, the CO2 uptake data is presented for mature photoautotrophic biofilms of at least 20 h old.

2.6. Assessing CO2 Uptake during Photoautotrophic Biofilm Development

A photoautotrophic culture was inoculated into BRcons approximately 24 h after BRprod was inoculated with PA01. This ensured that a relatively steady concentration of CO2 was achieved at the time of BRcons inoculation and allowed for the visualization of CO2 uptake during photoautotrophic biofilm development. Taking the difference in CO2 concentration measured by Analyzer 1 and 2 at each time point gave a raw concentration in parts per million, which, using the ideal gas law, was converted to a rate of CO2 uptake and plotted against time.
To confirm the presence and photosynthetic activity of the photoautotrophic biofilm, a procedure similar to the light–dark shift method described by Revsbech et al. [28] was performed, in which a steady state biofilm in BRcons was covered with an opaque sheet for approximately four hours and the resulting shift in CO2 flux was recorded.
A series of abiotic control experiments were also conducted to confirm that any difference in BRcons influent and effluent CO2 concentration in CSMS experiments was in fact due to the photoautotrophic activity of the biofilm, and not leakage or passive diffusion out of the system. This was achieved by channeling concentrated CO2 (1800 ppm, 24081376, Linde Canada Limited, Concord, ON, Canada) through a sterile, un-inoculated CSMS at two different flow rates (2.5 mL/min and 20 mL/min) for a period of 0.25 h.

2.7. Light Manipulations

2.7.1. CO2 Uptake during Light–Dark Cycling

A series of tests were performed to demonstrate the ability of the CSMS to detect real-time changes in CO2 uptake by the photoautotrophic biofilm, brought about by manipulations of light illumination. First, the system was operated on a diurnal cycle (12 h light, 12 h dark), with the photoautotrophic biofilm’s CO2 uptake rate assessed and measured as µmol/h. The system was covered in such a way as to ensure that no light could reach the biofilm during the dark periods, and that only light from the fluorescent growth light could illuminate the biofilm during light periods. The light/dark switching was accomplished using a programmable plug-in timer. This experiment lasted for 120 h, representing a total of five light–dark cycles.

2.7.2. CO2 Uptake during Changes in Light Intensity

To investigate the CSMS’s ability to detect changes in CO2 uptake brought about by changes in light intensity, the biofilm was first grown under constant illumination with the light source suspended 45 cm above the biofilm. This light intensity resulted in a relatively low PPFD of 25.57 µmol/m2/s. After 2 days of growth, the light source was lowered to 5 cm above the biofilm for a period of 20 h, resulting in an increased PPFD of approximately 141.79 µmol/m2/s. The light source was then returned to its original height for an additional 12 h.
A similar experiment was conducted in which the light intensity illuminating an actively growing, mature biofilm was manipulated on a significantly shorter time scale. A mature photoautotrophic biofilm was initially illuminated from a height of 5 cm. The light was then raised to 45 cm, corresponding to a nearly ten-fold decrease in PPFD, for approximately 90 min. Following this, the biofilm was kept in complete darkness for 90 min, before being illuminated again for 90 min from 45 and 5 cm, respectively.

2.8. Variation in Biofilm Biomass

2.8.1. Assessing CO2 Uptake with Supplementary Photoautotrophic Biofilm

To demonstrate the modular nature of the CSMS, a third BR (BRcons2) was added to the system immediately downstream of Analyzer 2. The same photoautotrophic culture that was inoculated into BRcons was also inoculated into BRcons2. BRcons2 received its own feed of fresh M-BBM. The gas stream in the system however was sequential, with the sweeper gas flowing from Analyzer 2, through the annular space of BRcons2 to a third CO2 analyzer (Analyzer 3).

2.8.2. Assessing CO2 Uptake with Increased Photoautotrophic Biofilm Length

A similar experiment utilizing a third BR was conducted with sweeper gas flowing directly from BRcons via Analyzer 2 to BRcons2 and finally Analyzer 3. However, this time, the medium flow was also setup in sequence, such that the effluent of BRcons served as growth medium for BRcons2. Six mL of the photoautotrophic culture was injected into the silicone tubing just upstream of BRcons, which was enough to ensure that the inoculum reached the end of BRcons2. In this orientation, BRcons and BRcons2 represented two halves of one biofilm approximately 300 cm in length, with the positioning of Analyzer 2 between BRcons and BRcons2 allowing for the measurement of CO2 flux by each half of the biofilm separately.

3. Results and Discussion

3.1. Development of Algal Biofilms

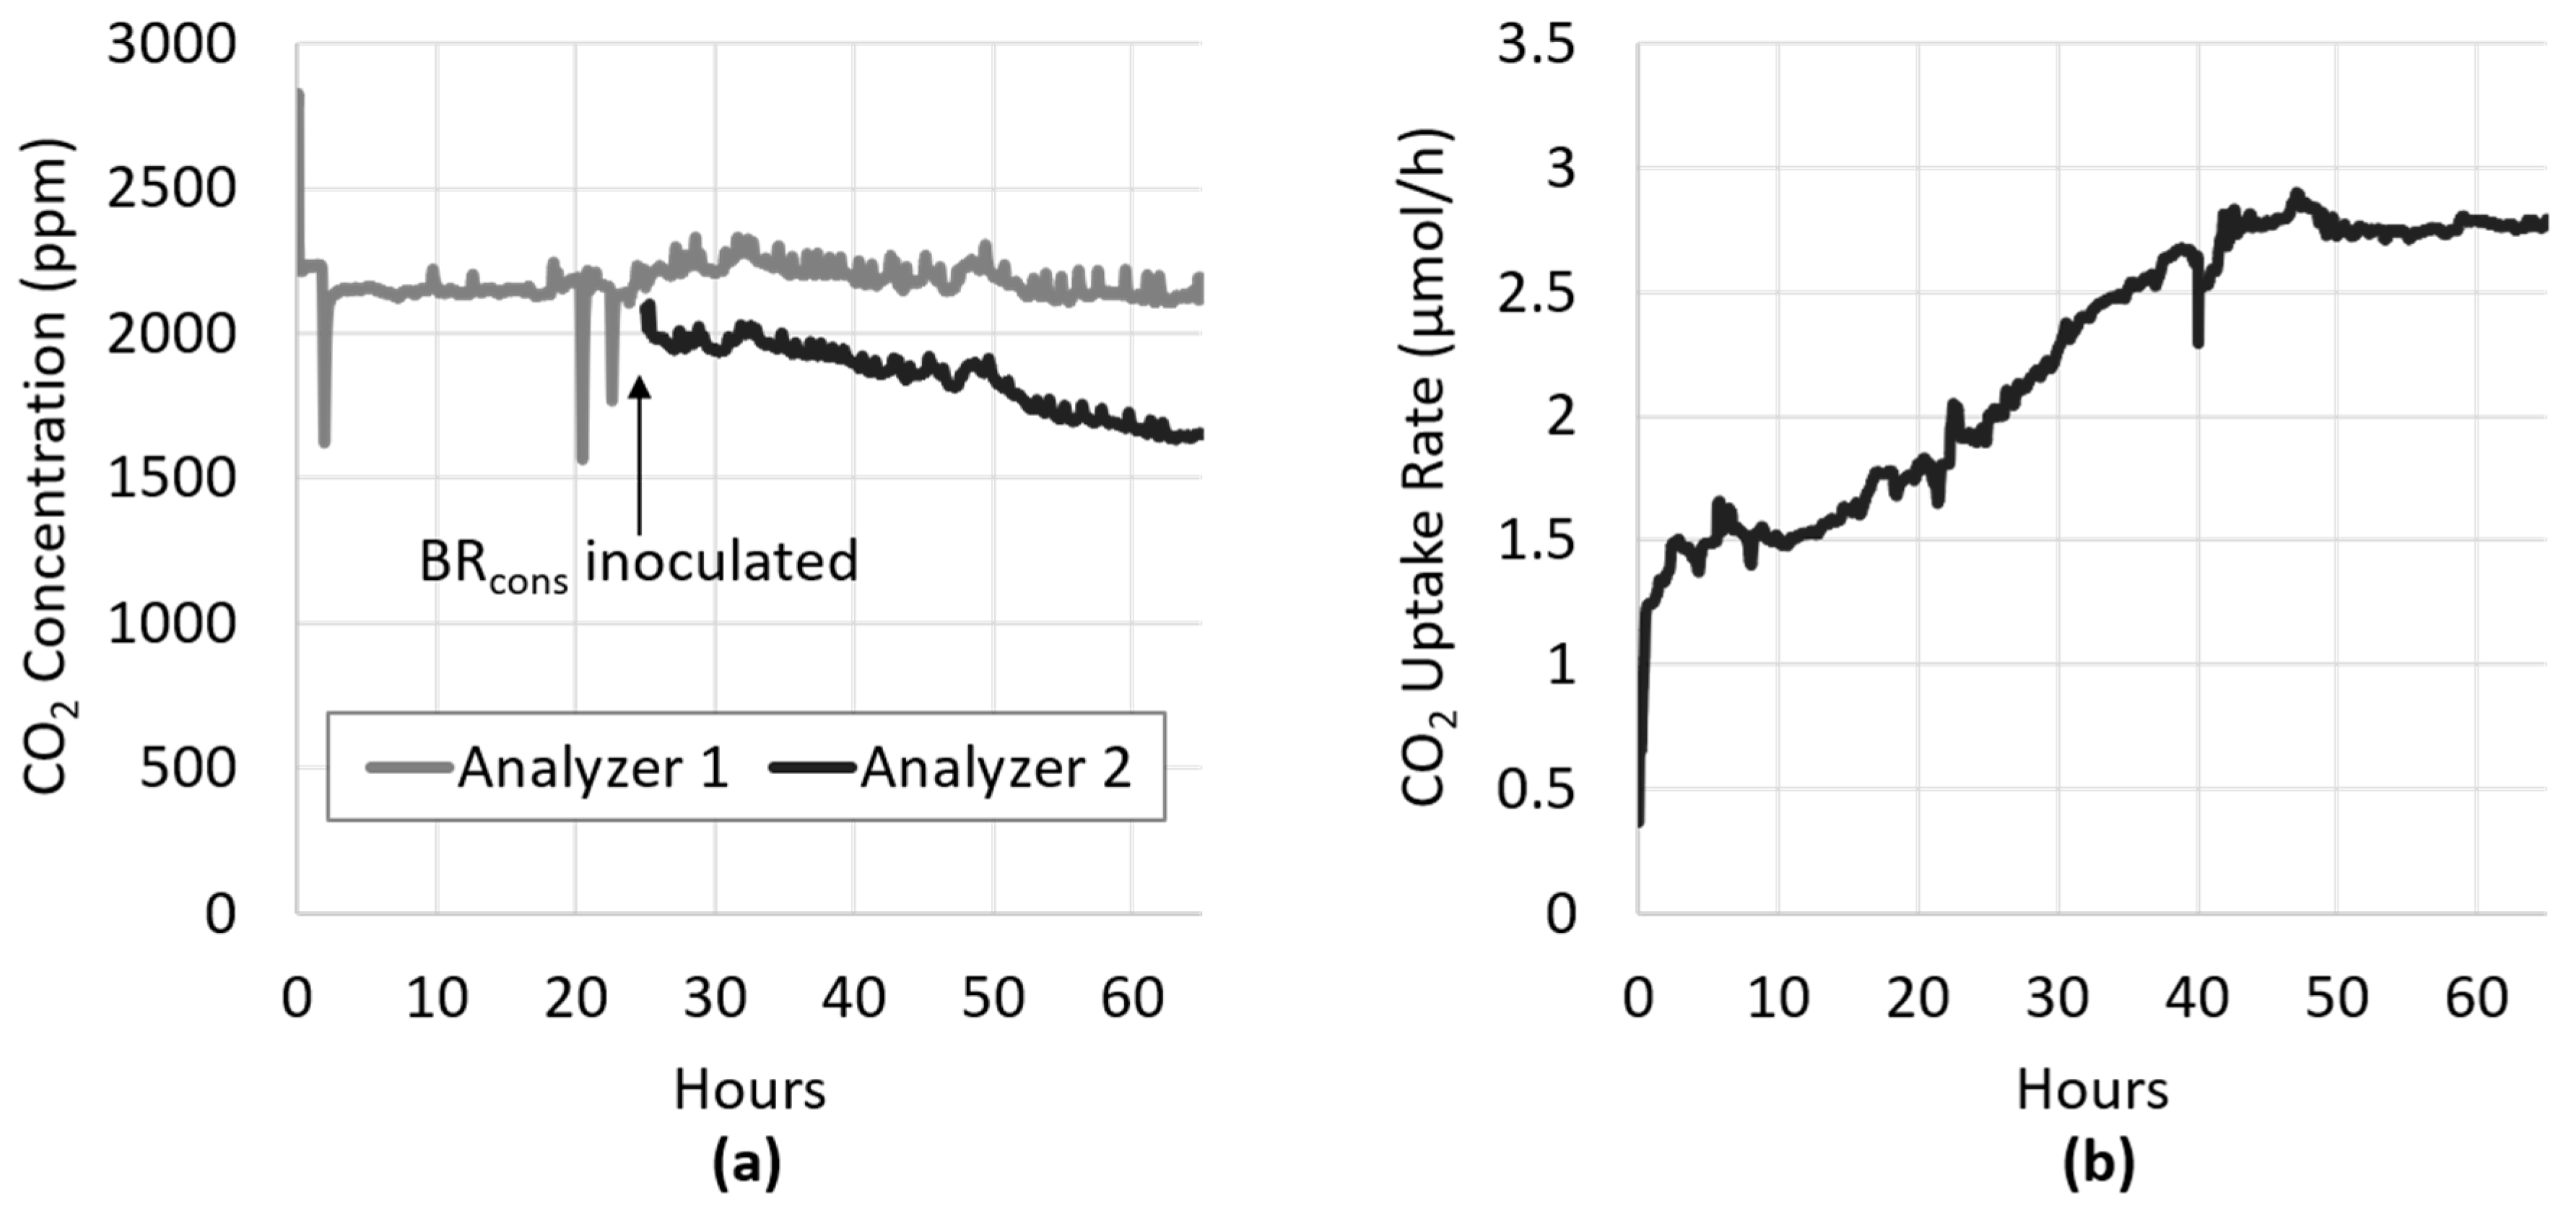
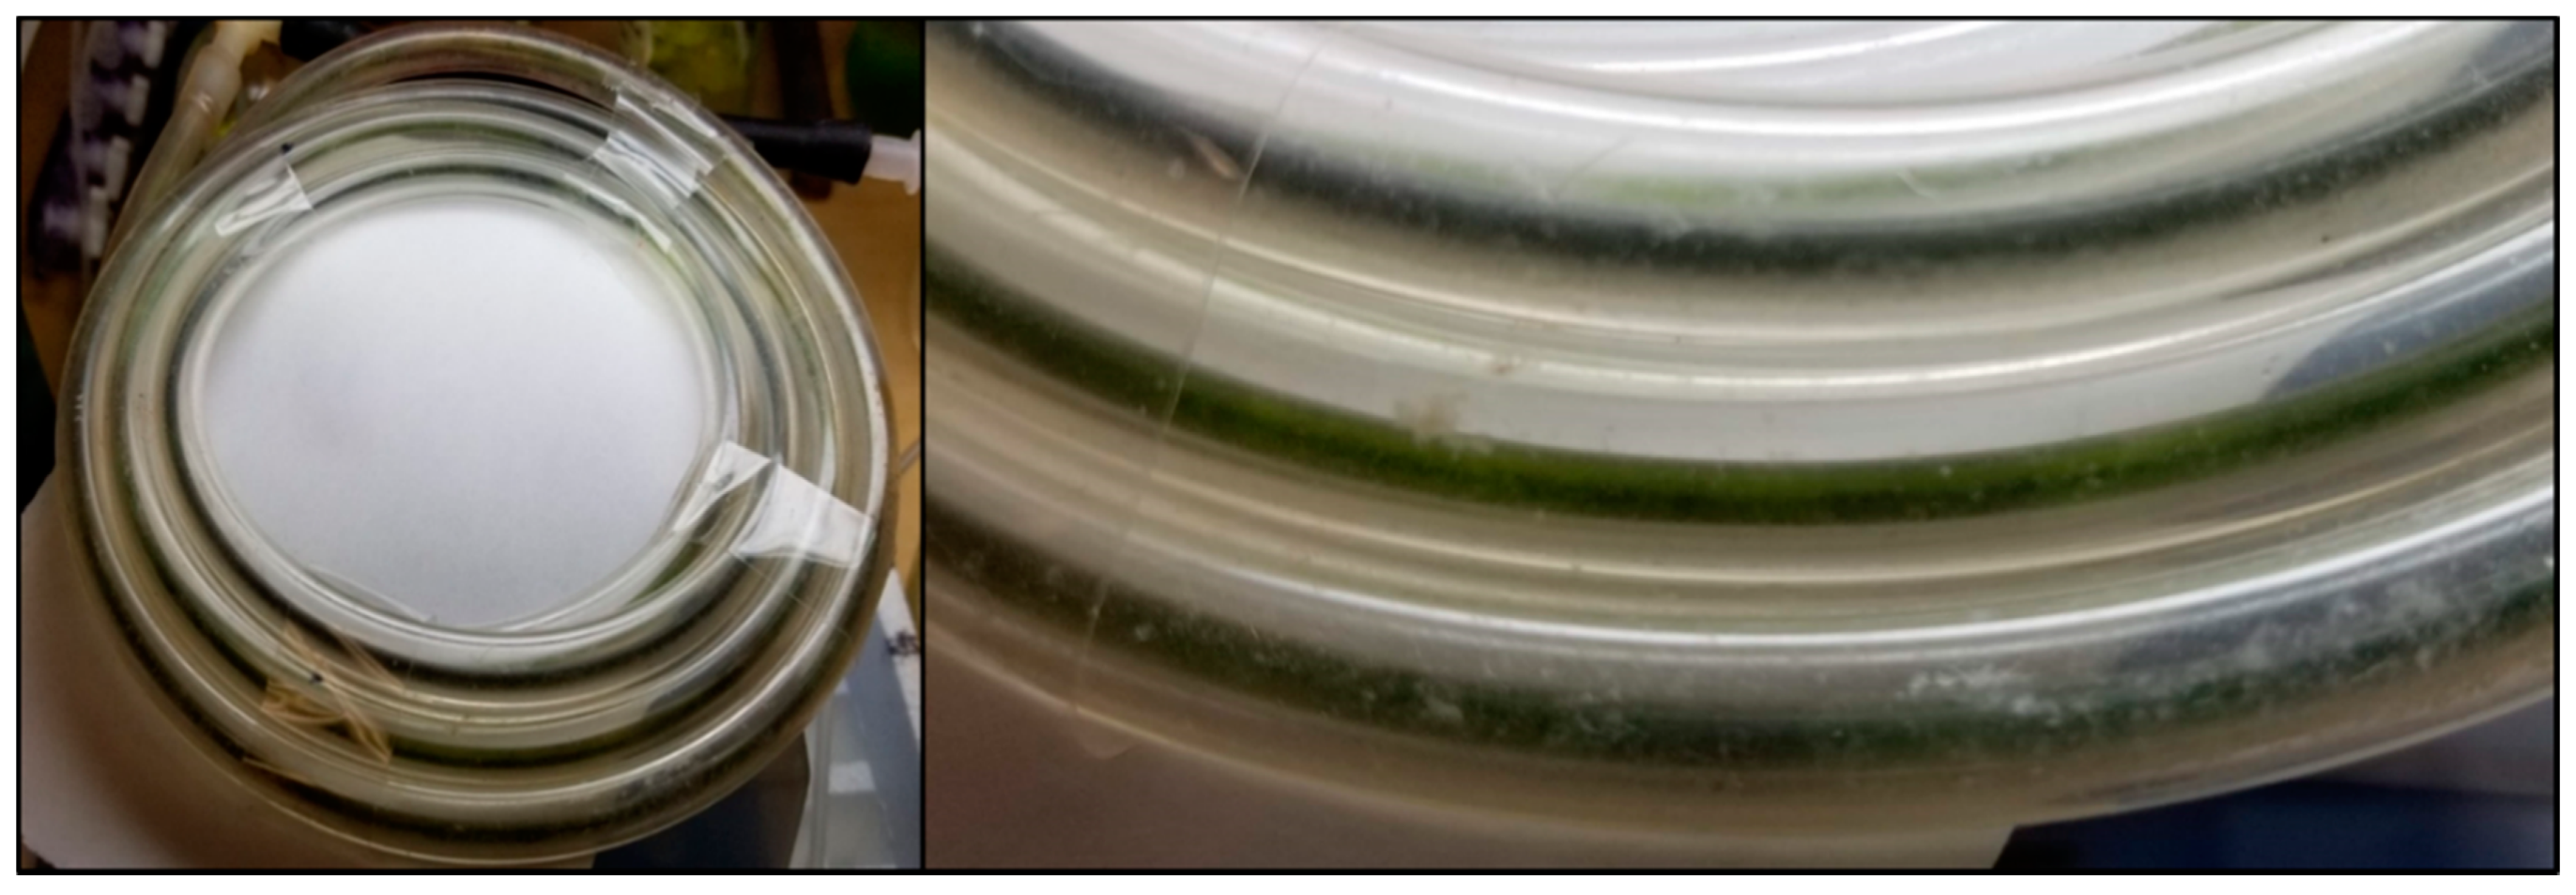
Algal biofilm growth became evident in BRcons within several hours after inoculation. The inflow and outflow CO2 concentrations over the reactor began to diverge due to increased capture by the developing photosynthetic biofilm (Figure 3a). Conversion of concentration data into CO2 uptake rate resembles a typical microbial growth curve (Figure 3b), with a green biofilm visible (Figure 4) when the uptake rate levelled off at approximately 2.8 µmol/h (378 µmol/h/m2).
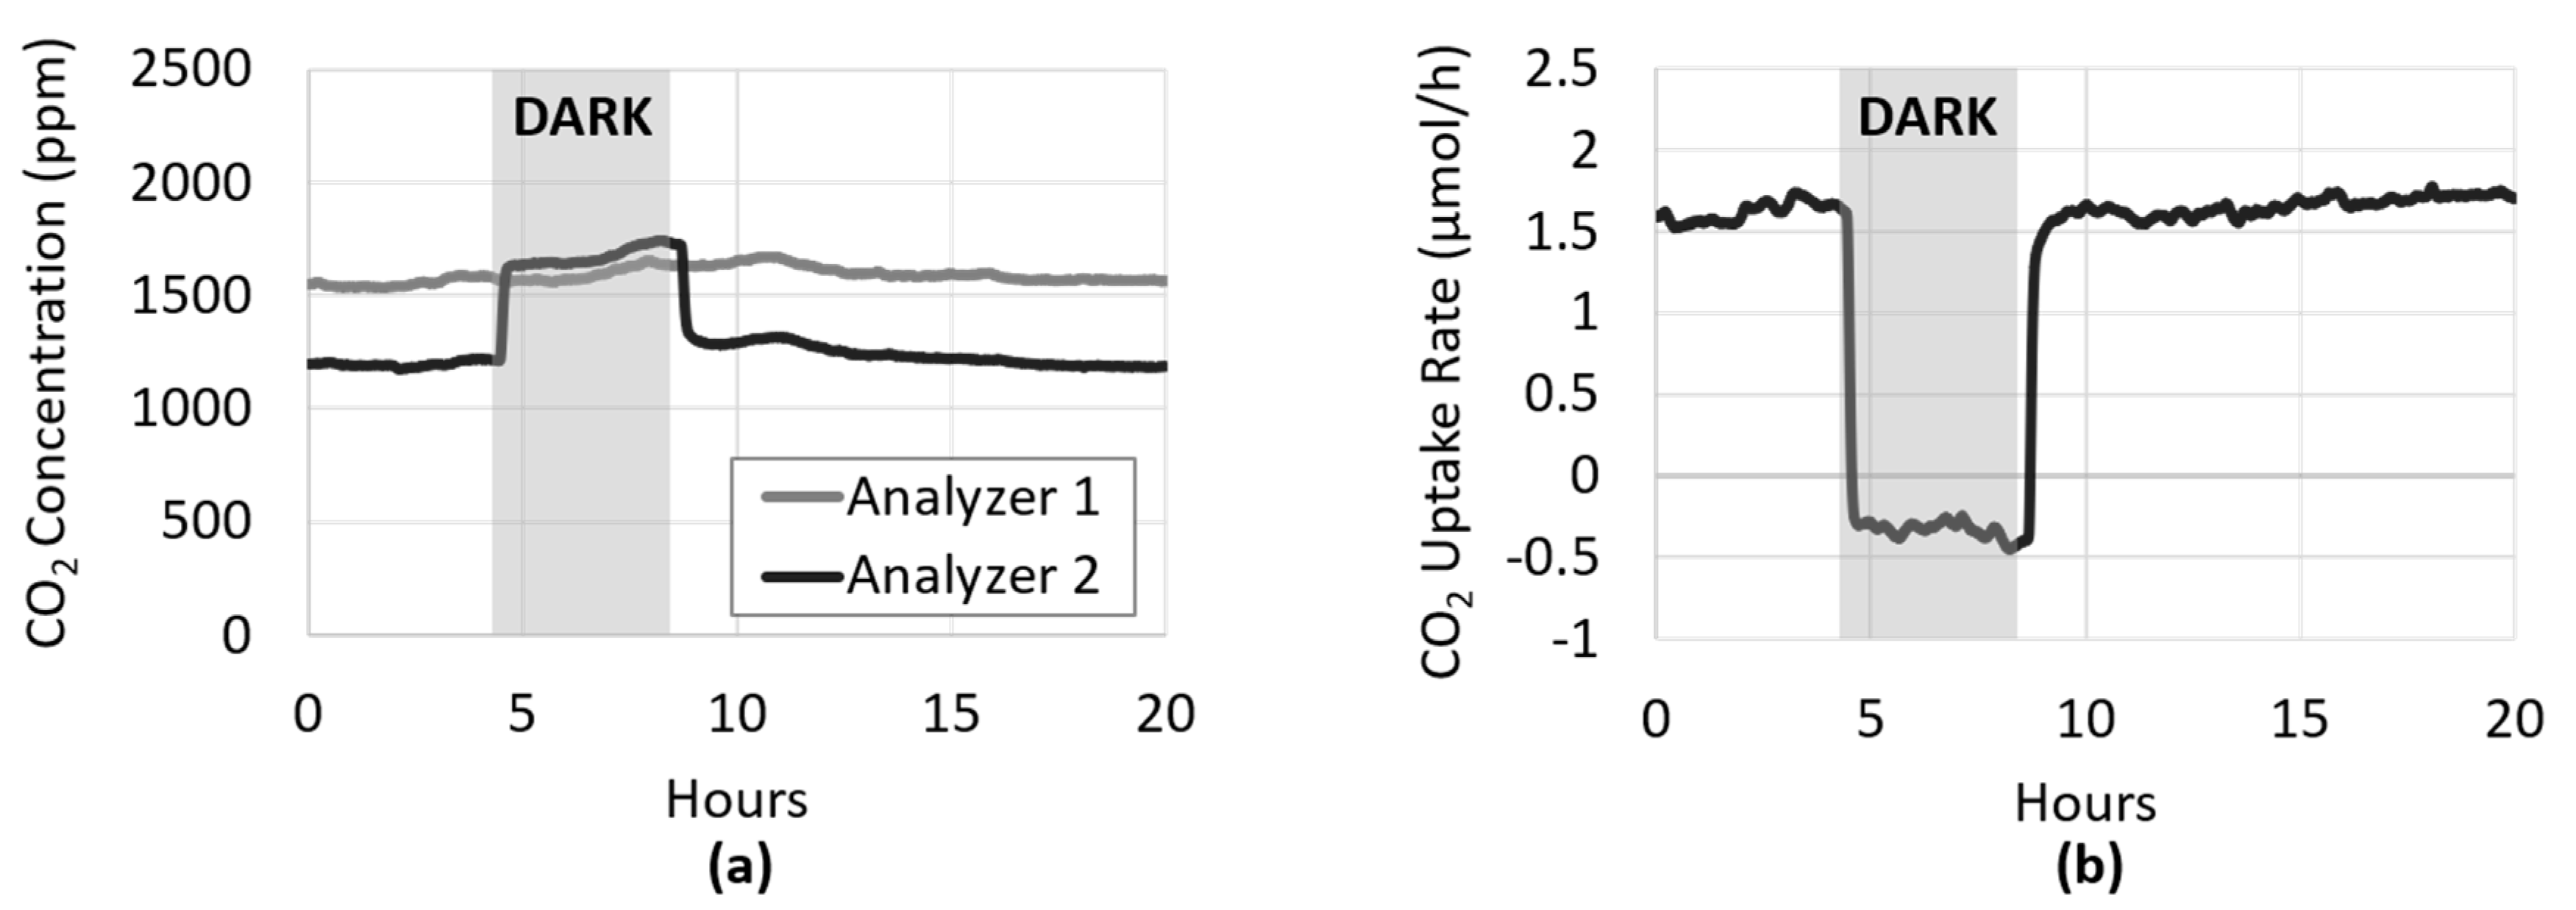
In order to confirm that the divergence depicted in Figure 3a between Analyzer 1 (BRcons gas influent) and Analyzer 2 (BRcons gas effluent) was attributable to the activity of the photoautotrophic biofilm in BRcons, a procedure similar to the “light–dark shift method” [28] was performed. Briefly, this well-established method provides an assessment of photosynthetic activity by measuring the decrease in dissolved oxygen concentration that occurs when the specimen is placed in the dark after prolonged light exposure [28]. Originally described in the early 1980s, this method was developed to measure primary production in benthic sediments. Here, a similar procedure was used, whereby a photoautotrophic biofilm in BRcons was placed in the dark and the change in CO2 flux within it was observed and recorded.
As shown in Figure 5a, the dark response was rapid, with the CO2 concentration in BRcons effluent increasing sharply to the same level as the influent, and ultimately surpassing it in less than 10 min. This higher CO2 concentration was likely due to some baseline respiration by the algae that proceeded in the dark. When plotted as the rate of CO2 uptake (Figure 5b), the effect of darkness on the biofilm’s activity was clearly apparent, demonstrating a complete cessation of photosynthesis. This provided evidence that the divergence observed between BRcons influent and effluent CO2 concentration was in fact due to CO2 fixation by the growing photoautotrophic biofilm. When the flow of photons to the biofilm is halted, the light-dependent photosynthetic reaction stops, and the ATP and NADPH needed to power the Calvin–Benson cycle and CO2 fixation is depleted, which happens rapidly as demonstrated by the data.
The rapid dark response observed in the CSMS coincides with previous results using the light–dark shift method, where dramatic changes in photosynthetic rate were detected in a matter of seconds after switching to dark conditions [29]. Given that the CSMS is a closed, continuous flow system, one can expect a small lag in measurement time related to the length of tubing linking BRcons to Analyzer 2. This, however, can be mitigated by reducing this distance, such that the time needed for the gas to travel from the biofilm to the CO2 analyzer is minimized.
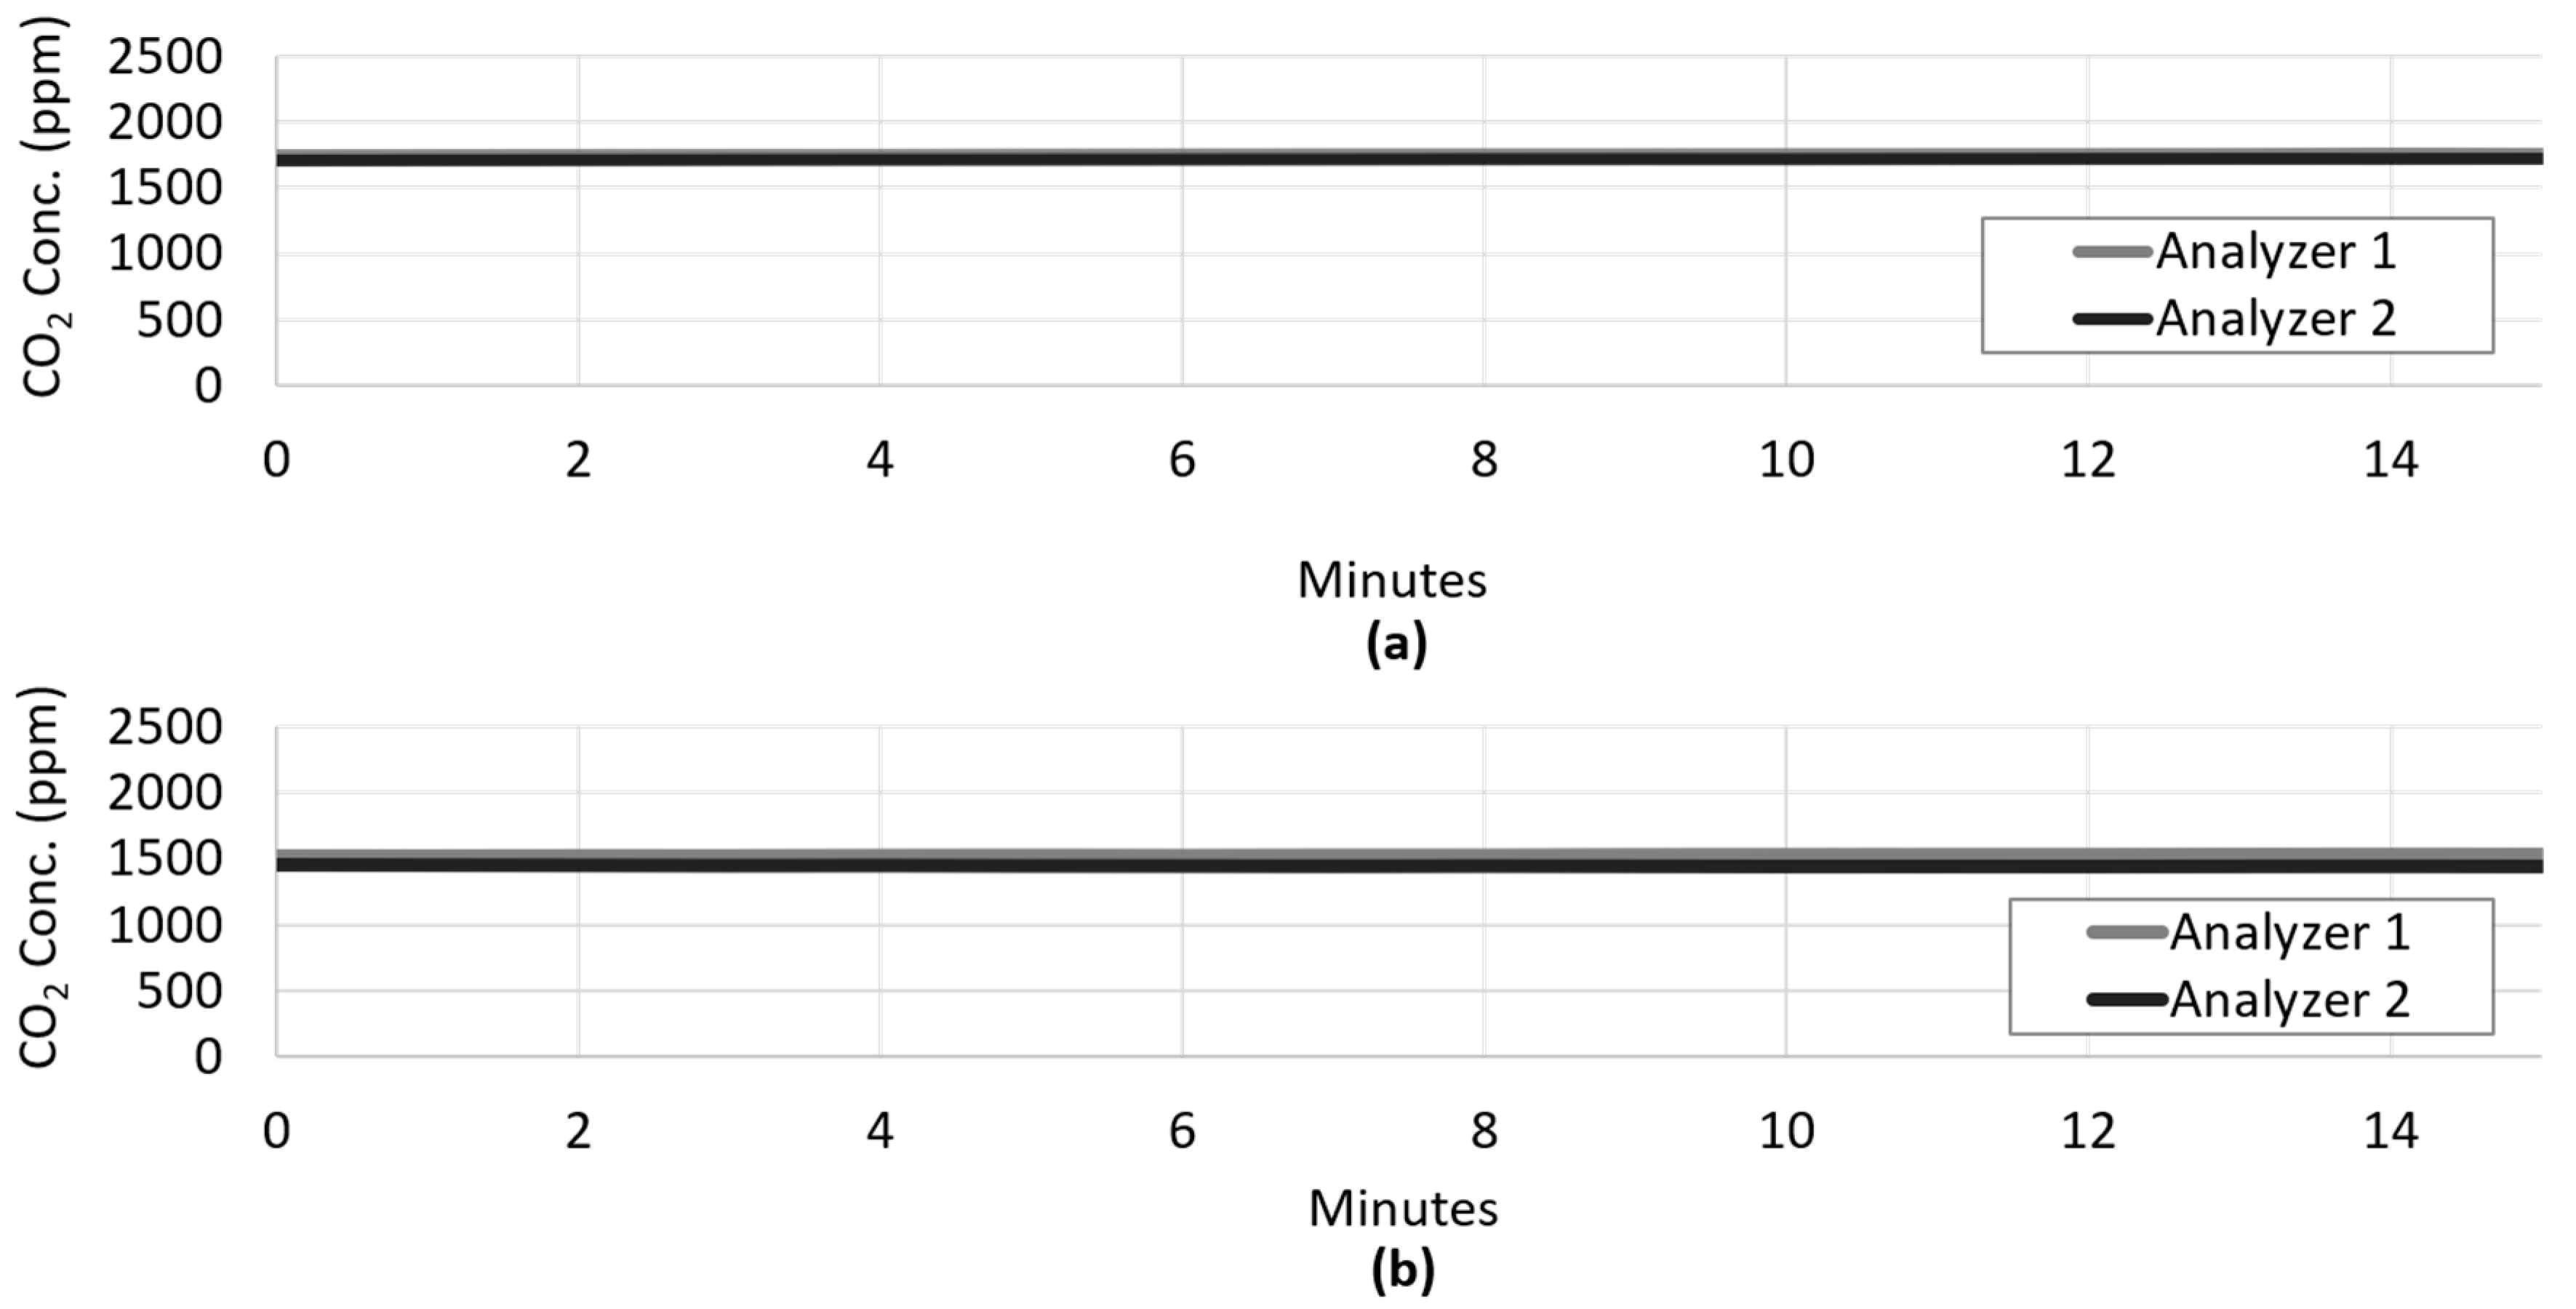
To further confirm that the divergence between influent and effluent CO2 concentration is due to the presence of the photoautotrophic biofilm, a set of abiotic control experiments were conducted. When concentrated CO2 was channeled through the uninoculated system at two flow rates, the influent and effluent CO2 concentration remained virtually unchanged, demonstrating that without assimilation by the photoautotrophic biofilm, CO2 loss was minimal (Figure 6).
The system described here may allow more efficient capture of CO2 than conventional bioreactor configurations, since its bulk supply is in the gas phase and therefore not limited to its solubility in water. Gas transport across the silicone wall was described in detail in [22] when the bulk solutions on the opposite sides are water and air, respectively, which was followed by experiments that showed high linearity (R2 = 0.999) between CO2 measured in the gas phase and various dissolved CO2 concentrations. In the present study, CO2 transport in the opposite direction was measured. Gas permeability of silicon has found applications such as gas exchange in blood [30] as well as membrane gills for submarines and underwater stations [31]. Here, we explored the potential utility of such permeability in microbial systems with biotechnological relevance.

3.2. Light Manipulation

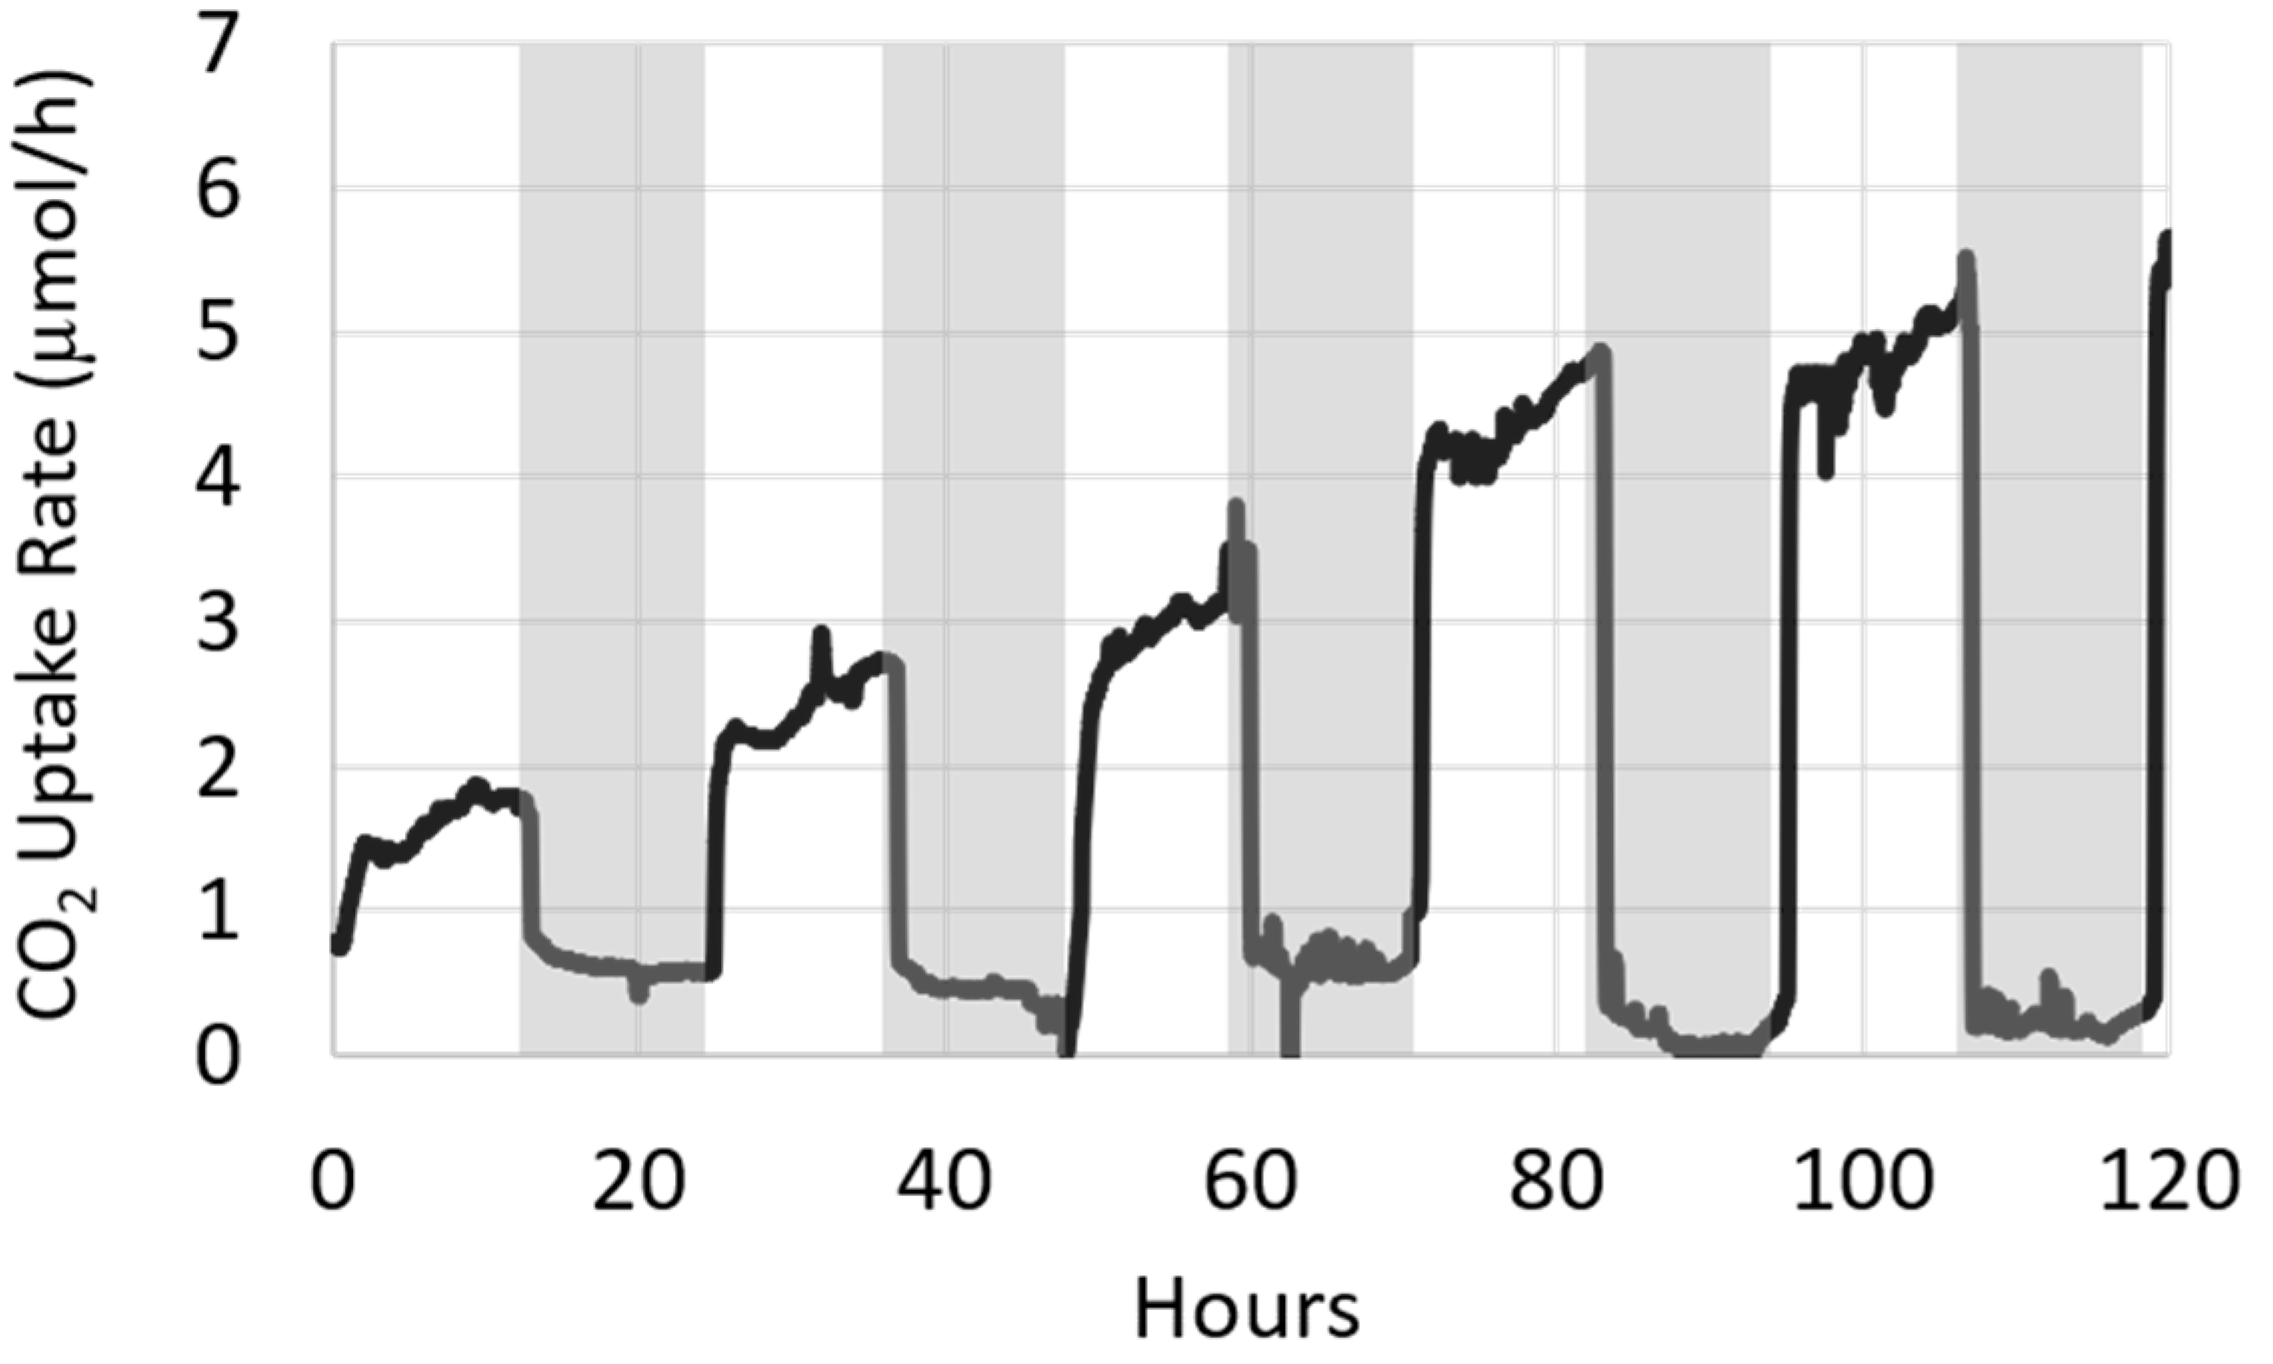
Figure 7 depicts the CO2 uptake rate of the photoautotrophic biofilm grown under alternating 12 h light and dark periods, demonstrating the biofilm’s photosynthesis on–off toggling during light–dark cycling. The data shows a net increase in CO2 consumption during the light phases with increasing biofilm age. At the end of each dark period, the biofilm’s CO2 uptake rate rapidly rebounded to approximately the rate reached at the end of the previous light period, ultimately achieving a rate of approximately 5.5 µmol/h (743 µmol/h/m2) by the last light period. There was also a small, decreasing rate of CO2 uptake in each sequential dark phase. Although we do not expect CO2 consumption by direct biologically related reactions during periods of darkness, this may be the result of other biotic or abiotic processes (e.g., changes in pH) which would have affected the CO2-bicarbonate equilibrium.
Since the overarching industrial goal of bio-sequestration is to maximize the amount of CO2 captured, it may be tempting to provide the sequestering culture with continuous 24 h illumination. This would prevent the cessation of CO2 fixation which occurs in the dark and promote higher biomass accumulation rates. However, dark periods are important in allowing for the repair of photosynthetic machinery and proteins, which may benefit the culture’s long-term performance [5]. A key operational decision in bio-sequestration systems, therefore, is how to achieve maximum CO2 capture while maintaining the long-term health of the sequestering culture. Biofilm accumulation is not an infinite process, and ultimately slows down to a quasi-steady state as dictated by factors such as flow regimes and gas exchange/transport through the biofilm matrix, which will lead to a simultaneous lowering of CO2 uptake. By enabling real-time in situ monitoring of the biofilm’s CO2 uptake rates, the CSMS may offer an approach to manage reactor performance, such as timing of harvesting, while real-time CO2 uptake rates may be useful in setting an optimal light–dark cycling regimen.
Photosynthesis is driven by photon energy that excites electrons in the chloroplasts’ photosynthetic pigments. Through a cascade of redox reactions, this electron energy is transiently stored as ATP and NADPH, which in turn are used in the Calvin–Benson cycle to fix CO2 and generate glucose. Generally, a higher density of photons irradiating the cell will lead to a higher rate of CO2 fixation. That is, however, before an upper light intensity threshold is reached and photoinhibition occurs. This critical threshold is a product of numerous abiotic and biotic factors including light wavelength(s) and color temperature, growth system configuration and material properties, as well as culture cell density [5]. As such, it is extremely difficult to accurately predict the onset of photoinhibition of a culture in a given system without some degree of real-time monitoring of culture performance.
The next series of tests was conducted to assess the ability to detect changes in the biofilm’s CO2 uptake rate brought about by fluctuations in light intensity. This was done on both long (Figure 8a) and short (Figure 8b) timescales. Figure 8a shows the CO2 uptake rate of a photoautotrophic biofilm growing in the system with the fluorescent growth light initially placed at a height of 45 cm above the biofilm, corresponding to a relatively low PPFD of 25.57 µmol/m2/s. During this period, the CO2 uptake rate gradually increased from approximately 0.8 to 2 µmol/h (108 to 270 µmol/h/m2). After 24 h, the light was lowered to 5 cm above the biofilm, resulting in an increased light intensity and PPFD of 141.79 µmol/m2/s. Within minutes, the biofilm’s CO2 uptake rate increased sharply by approximately 40%, before continuing to gradually increase at roughly the same trajectory as before the light intensity shift. After 20 h, the growth light was returned to a height of 45 cm, and the biofilm once again exhibited a near immediate response with its CO2 uptake rate rapidly falling by approximately 40% to 2.2 µmol/h (297 µmol/h/m2). Similarly, when the light intensity was adjusted on a much shorter time scale (Figure 8b), the same rapid responses were observed. After 100 min in the dark, it took only 20 min for the biofilm’s CO2 uptake rate to return to its pre-dark level.
Phototrophic biofilms typically consist of a photosynthetically active zone, which is closest to the light-source, and a photosynthetically inactive zone where cells are shaded by the cells of the active layer. With increasing light intensities, photon flux penetrates deeper into the biofilm and the thickness of the photosynthetically active layer increases [14]. Therefore, at higher light intensities, a larger proportion of the biofilm is photosynthetically active, and its gross CO2 uptake increases, as depicted in Figure 8. Collectively, these results coincide with the notion that increasing light intensity leads to a higher rate of CO2 fixation, and demonstrates the ability of the CSMS to detect real-time changes in CO2 uptake caused by small fluctuations in light intensity. This system therefore also has utility in its ability to monitor and alert when light intensities are above the critical threshold, which would otherwise cause photoinhibition and consequent diminished productivity.

3.3. Variation in Biofilm Biomass

Amongst the main objectives of bio-sequestration is to maximize the amount of CO2 capture and to valorize the biomass produced. This study utilized the CSMS at bench-scale to develop an experimental approach that may be combined with bioprocess modeling to optimize conversion rates of the algal biomass, and ultimately techno-economic analysis. First, an additional biofilm reactor (BRcons2) inoculated with the same photoautotrophic culture was added to the system. In this configuration the biofilms in BRcons and BRcons2 each received fresh growth medium, while the gas flowed sequentially through BRcons and Analyzer 2, to BRcons2 and Analyzer 3. The addition of Analyzer 3 allows for a direct comparison of the CO2 uptake rates in BRcons and BRcons2, respectively. As expected, both biofilms consumed CO2 at approximately the same rate for the duration of the experiment. The addition of a second photoautotrophic biofilm therefore appeared to double the system’s overall CO2-sequestering capacity (Figure 9a). In scenarios with a finite source of CO2, as is the case in this experiment, the CSMS provides a means to determine optimal reactor length or number of modular reactors. This may be relevant to applications aimed at CO2 capture downstream from industrial processes where space and cost savings become a factor.
In a subsequent experiment, the system was configured such that both medium and gas passed sequentially from BRcons to BRcons2. That is, the medium effluent from BRcons was the medium influent of BRcons2. As such, BRcons and BRcons2 each represented half of one long biofilm which was approximately 300 cm in length. In this case, CO2 and nutrients are finite. Interestingly, when comparing the first half of the biofilm (BRcons) to the second half of the biofilm (BRcons2), the latter exhibited a diminished rate of CO2 uptake (Figure 9b). In this case, more than half of the observed CO2 uptake was occurring in the first half of the biofilm. It is possible that some key nutrient(s) had been depleted by the time the growth medium reached the second half of the biofilm, resulting in an overall lower rate of CO2 uptake. There is also the potential that the waste effluent from BRcons is in equilibrium with the CO2 in the gas phase, causing a subsequent reduction in CO2 flux across the silicone membrane in BRcons2.

3.4. System Utility and Future Considerations

The system described here utilizes a heterotrophic biofilm as a source of concentrated CO2. Once this biofilm reaches steady state, its CO2 output remains relatively consistent and provides an inexpensive and renewable source of carbon with which to study bio-sequestration by photoautotrophic biofilms. In this sense, the heterotrophic biofilm in BRprod can be viewed as a stand in for any real-world, CO2-emitting biological process, such as wastewater treatment or various types of fermentation. When algal systems are installed to capture CO2 from flue gas emitted from large industrial point sources, the overarching goal would be to maximize the ratio of CO2 captured to CO2 released to the atmosphere. While it is possible to increase this ratio by optimizing light exposure (Figure 8a,b) and increasing the biofilm surface area (Figure 9a,b), there is also the potential to re-circulate the gas in a closed loop to achieve near 100% CO2 removal.
In algal biodiesel production, lipid accumulation is advantageous and can be induced by starving the algal culture of nitrogen as well as other key nutrients [32]. Cells respond to this stress by directing a higher proportion of their energy and carbon toward neutral lipids, the feedstock for biodiesel production. However, this stress response is also accompanied by a decrease in growth rate, photosynthesis, and CO2 fixation [33,34,35]. Hence, a delicate balance must be struck between inducing lipid accumulation through starvation and maintaining a robust biofilm with an adequate growth rate. By depicting a culture’s photosynthetic activity in real time, a system like the CSMS would have significant utility in algal biodiesel production by helping to optimize the balance between starvation, desired product yield through photosynthesis, and collapse of the culture.
In conventional algae culturing, CO2 is typically delivered via sparging into the liquid growth medium. This, however, causes a significant amount of CO2 to be lost to the atmosphere, a pervasive issue with negative economic and environmental implications [36,37]. This problem could potentially be addressed by mimicking the CSMS’s configuration, where concentrated CO2 remains in a closed environment and is delivered to the culture across a permeable silicone membrane. While previous studies have discussed the use of membranes for this purpose [36,38,39], none to our knowledge have applied this specifically in the context of photoautotrophic biofilm CO2 sequestration monitoring and optimization. From the data presented, it can be concluded that the system described here is capable of the reliable, real-time detection and quantification of CO2 uptake by phototrophic biofilms. This information is critical in understanding how these industrially relevant biofilms respond to changes in their environments (e.g., light intensity), information which is necessary in order to optimize growth and maximize energy- and cost-efficiency. It may also have significant utility in examining the interplay between inorganic and organic carbon utilization in mixotrophic or mixed species phototrophic biofilms, which would be relevant in biofilm systems using a wastewater medium with variable composition.
The fact that the CSMS provides a non-destructive, in situ quantification of CO2 uptake makes it a more attractive option than conventional stoichiometric analysis, in which at least a portion of the biofilm must be sacrificed for dry weight measurements [18,19]. The CSMS also allows for a more direct CO2 flux analysis than can be obtained from simply monitoring effluent pH, since this is influenced by numerous other factors (e.g., nitrogen assimilation) and in buffered systems pH changes may not adequately reflect CO2 dynamics [21]. Some studies have utilized microelectrodes integrated inside the biofilm itself to monitor gas flux and photosynthetic activity [29]. While this approach provides a spatial resolution and resolving power not possible with the CSMS, these electrodes often require frequent calibration and are vulnerable to interference from fouling and gas bubbles [29].
As the effects of climate change continue to increase in severity, there is a critical need for solutions which can slow or prevent the increase in CO2 in our atmosphere. Bio-sequestration by photoautotrophic biofilms represents one promising solution which may be a valuable complement to existing CO2 management strategies. The biomass generated has inherent commercial value, which can be used to subsidize the process and improve its economic viability [7]. However, process optimization under different environmental and operating conditions remains a major challenge [12]. Technologies like the CO2 sequestration monitoring system (CSMS) introduced here can significantly aid in this endeavor and will become increasingly important if we are to effectively mitigate the effects of CO2 on climate change.

Author Contributions

Project conceptualizing and planning was by P.R., O.K., S.N.L. and G.W. The project was executed was by P.R., who also wrote and assembled the manuscript. G.W. also wrote several passages. O.K., G.W. and S.N.L. each provided supervision, contributed to the analysis of collected data, and conducted numerous revisions of the manuscript. All authors have read and agreed to the published version of the manuscript.

Funding

This work was supported by the Natural Sciences and Engineering Research Council of Canada (NSERC) in the form of a Postgraduate Doctoral Scholarship.

Acknowledgments

The authors would like to acknowledge Jamie Nguyen for her help with lab work that contributed to this article.

Conflicts of Interest

The authors declare no conflict of interest.

References

  1. Steffen, W.; Broadgate, W.; Deutsch, L.; Gaffney, O.; Ludwig, C. The trajectory of the Anthropocene: The Great Acceleration. Anthr. Rev. 2015, 2, 81–98. [Google Scholar] [CrossRef]
  2. Solomon, K.; Plattner, G.-K.; Knutti, R.; Friedlingstein, P. Irreversible climate change due to carbon dioxide emissions. Proc. Natl. Acad. Sci. USA 2009, 106, 1704–1709. [Google Scholar] [CrossRef] [Green Version]
  3. Hosseini, N.S.; Shang, H.; Scott, J.A. Biosequestration of industrial off-gas CO2 for enhanced lipid productivity in open microalgae cultivation systems. Renew. Sustain. Energy Rev. 2018, 92, 458–469. [Google Scholar] [CrossRef]
  4. Zhou, W.; Wang, J.; Chen, P.; Ji, C.; Kang, Q.; Lu, B.; Li, K.; Liu, J.; Ruan, R. Bio-mitigation of carbon dioxide using microalgal systems: Advances and perspectives. Renew. Sustain. Energy Rev. 2017, 76, 1163–1175. [Google Scholar] [CrossRef]
  5. Bhola, V.; Swalaha, F.M.; Kumar, R.R.; Singh, M.; Bux, F. Overview of the potential of microalgae for CO2 sequestration. Int. J. Environ. Sci. Technol. 2014, 11, 2103–2118. [Google Scholar] [CrossRef] [Green Version]
  6. Gouveia, L.; Batista, A.P.; Sousa, I.; Raymundo, A.; Bandarra, N.M. Microalgae in novel food products. In Food Chemistry Research Developments; Papadopoulos, K.N., Ed.; Nova Science Publishers, Inc.: New York, NY, USA, 2008; Chapter 2; pp. 75–111. [Google Scholar]
  7. Judd, S.; Broeke, L.J.V.D.; Shurair, M.; Kuti, Y.; Znad, H. Algal remediation of CO2 and nutrient discharges: A review. Water Res. 2015, 87, 356–366. [Google Scholar] [CrossRef] [Green Version]
  8. Jais, N.M.B.; Mohamed, R.; Al-Gheethi, A.; Hashim, M.K.A. The dual roles of phycoremediation of wet market wastewater for nutrients and heavy metals removal and microalgae biomass production. Clean Technol. Environ. Policy 2016, 19, 37–52. [Google Scholar] [CrossRef]
  9. Deshmukh, S.; Kumar, R.; Bala, K. Microalgae biodiesel: A review on oil extraction, fatty acid composition, properties and effect on engine performance and emissions. Fuel Process. Technol. 2019, 191, 232–247. [Google Scholar] [CrossRef]
  10. Goh, B.H.H.; Ong, H.C.; Cheah, M.Y.; Chen, W.-H.; Yu, K.L.; Mahlia, T.M.I. Sustainability of direct biodiesel synthesis from microalgae biomass: A critical review. Renew. Sustain. Energy Rev. 2019, 107, 59–74. [Google Scholar] [CrossRef]
  11. Nagappan, S.; Devendran, S.; Tsai, P.-C.; Dahms, H.-U.; Ponnusamy, V.K. Potential of two-stage cultivation in microalgae biofuel production. Fuel 2019, 252, 339–349. [Google Scholar] [CrossRef]
  12. Kesaano, M.; Sims, R.C. Algal biofilm based technology for wastewater treatment. Algal Res. 2014, 5, 231–240. [Google Scholar] [CrossRef]
  13. Hoffmann, J.P. Wastewater Treatment with Suspended and Nonsuspended Algae. J. Phycol. 1998, 34, 757–763. [Google Scholar] [CrossRef]
  14. Schnurr, P.J.; Allen, D.G. Factors affecting algae biofilm growth and lipid production: A review. Renew. Sustain. Energy Rev. 2015, 52, 418–429. [Google Scholar] [CrossRef]
  15. Donlan, R.M. Biofilms: Microbial Life on Surfaces. Emerg. Infect. Dis. 2002, 8, 881–890. [Google Scholar] [CrossRef]
  16. Choudhary, P.; Prajapati, S.K.; Kumar, P.; Malik, A.; Pant, K.K. Development and performance evaluation of an algal biofilm reactor for treatment of multiple wastewaters and characterization of biomass for diverse applications. Bioresour. Technol. 2017, 224, 276–284. [Google Scholar] [CrossRef]
  17. Katarzyna, L.; Sai, G.; Singh, O.A. Non-enclosure methods for non-suspended microalgae cultivation: Literature review and research needs. Renew. Sustain. Energy Rev. 2015, 42, 1418–1427. [Google Scholar] [CrossRef] [Green Version]
  18. Salih, F.M. Microalgae Tolerance to High Concentrations of Carbon Dioxide: A Review. J. Environ. Prot. 2011, 2, 648–654. [Google Scholar] [CrossRef] [Green Version]
  19. Chisti, Y. Constraints to commercialization of algal fuels. J. Biotechnol. 2013, 167, 201–214. [Google Scholar] [CrossRef]
  20. El-Sheekh, M.; Bedaiwy, M.Y.; E Osman, M.; Ismail, M.M. Mixotrophic and heterotrophic growth of some microalgae using extract of fungal-treated wheat bran. Int. J. Recycl. Org. Waste Agric. 2012, 1, 12. [Google Scholar] [CrossRef] [Green Version]
  21. Padmanabhan, P. Technical insight on the requirements for CO2-saturated growth of microalgae in photobioreactors. 3 Biotech 2017, 7, 119. [Google Scholar] [CrossRef] [Green Version]
  22. Kroukamp, O.; Wolfaardt, G.M. CO2 Production as an Indicator of Biofilm Metabolism. Appl. Environ. Microbiol. 2009, 75, 4391–4397. [Google Scholar] [CrossRef] [Green Version]
  23. Krzemińska, I.; Pawlik-Skowrońska, B.; Trzcińska, M.; Tys, J. Influence of photoperiods on the growth rate and biomass productivity of green microalgae. Bioprocess Biosyst. Eng. 2013, 37, 735–741. [Google Scholar] [CrossRef] [PubMed] [Green Version]
  24. Yu, J.; Liberton, M.; Cliften, P.F.; Head, R.D.; Jacobs, J.M.; Smith, R.D.; Koppenaal, D.W.; Brand, J.J.; Pakrasi, H.B. Synechococcus elongatus UTEX 2973, a fast growing cyanobacterial chassis for biosynthesis using light and CO2. Sci. Rep. 2015, 5, 8132. [Google Scholar] [CrossRef]
  25. Chang, H.-X.; Huang, Y.; Fu, Q.; Liao, Q.; Zhu, X. Kinetic characteristics and modeling of microalgae Chlorella vulgaris growth and CO2 biofixation considering the coupled effects of light intensity and dissolved inorganic carbon. Bioresour. Technol. 2016, 206, 231–238. [Google Scholar] [CrossRef]
  26. Ghadakpour, M.; Bester, E.; Liss, S.N.; Gardam, M.; Droppo, I.; Hota, S.; Wolfaardt, G.M. Integration and Proliferation of Pseudomonas aeruginosa PA01 in Multispecies Biofilms. Microb. Ecol. 2014, 68, 121–131. [Google Scholar] [CrossRef]
  27. Lambertsen, L.; Sternberg, C.; Molin, S. Mini-Tn7 transposons for site-specific tagging of bacteria with fluorescent proteins. Environ. Microbiol. 2004, 6, 726–732. [Google Scholar] [CrossRef] [Green Version]
  28. Revsbech, N.P.; Jørgensen, B.B.; Brix, O. Primary production of microalgae in sediments measured by oxygen microprofile, H14CO3- fixation, and oxygen exchange methods. Limnol. Oceanogr. 1981, 26, 717–730. [Google Scholar] [CrossRef]
  29. Revsbech, N.P.; Jørgensen, B.B. Photosynthesis of benthic microflora measured with high spatial resolution by the oxygen microprofile method: Capabilities and limitations of the method. Limnol. Oceanogr. 1983, 28, 749–756. [Google Scholar] [CrossRef]
  30. Spaeth, E.E.; Friedlander, S.K. The Diffusion of Oxygen, Carbon Dioxide, and Inert Gas in Flowing Blood. Biophys. J. 1967, 7, 827–851. [Google Scholar] [CrossRef] [Green Version]
  31. Robb, W.L. Thin Silicone Membranes-Their Permeation Properties and some Applications. Ann. N. Y. Acad. Sci. 1968, 146, 119–137. [Google Scholar] [CrossRef]
  32. Hu, Q.; Sommerfield, M.; Jarvis, E.; Ghirardi, M.; Posewitz, M.; Seibert, M.; Darzins, A. Microalgal triaceylglycerols as feedstocks for biofuel production: Perspectives and advances. Plant J. 2008, 54, 621–639. [Google Scholar] [CrossRef] [PubMed]
  33. Zhao, L.-S.; Li, K.; Wang, Q.-M.; Song, X.-Y.; Su, H.-N.; Xie, B.-B.; Zhang, X.-Y.; Huang, F.; Chen, X.-L.; Zhou, B.-C.; et al. Nitrogen Starvation Impacts the Photosynthetic Performance of Porphyridium cruentum as Revealed by Chlorophyll a Fluorescence. Sci. Rep. 2017, 7, 1–11. [Google Scholar] [CrossRef]
  34. Liefer, J.; Garg, A.; Campbell, D.A.; Irwin, A.J.; Finkel, Z.V. Nitrogen starvation induces distinct photosynthetic responses and recovery dynamics in diatoms and prasinophytes. PLoS ONE 2018, 13, e0195705. [Google Scholar] [CrossRef] [PubMed] [Green Version]
  35. Yang, L.; Chen, J.; Qin, S.; Zeng, M.; Jiang, Y.; Hu, L.; Xiao, P.; Hao, W.; Hu, Z.; Lei, A.; et al. Growth and lipid accumulation by different nutrients in the microalga Chlamydomonas reinhardtii. Biotechnol. Biofuels 2018, 11, 40. [Google Scholar] [CrossRef]
  36. Carvalho, A.; Malcata, F. Transfer of Carbon Dioxide within Cultures of Microalgae: Plain Bubbling versus Hollow-Fiber Modules. Biotechnol. Prog. 2001, 17, 265–272. [Google Scholar] [CrossRef]
  37. Blanken, W.; Schaap, S.; Theobald, S.; Rinzema, A.; Wijffels, R.H.; Janssen, M. Optimizing carbon dioxide utilization for microalgae biofilm cultivation. Biotechnol. Bioeng. 2016, 114, 769–776. [Google Scholar] [CrossRef]
  38. Lee, Y.-K.; Hing, H.-K. Supplying CO2 to photosynthetic algal cultures by diffusion through gas-permeable membranes. Appl. Microbiol. Biotechnol. 1989, 31, 298–301. [Google Scholar] [CrossRef]
  39. Xu, Z.; Wang, Y.; Chen, Y.; Spalding, M.H.; Dong, L. Microfluidic chip for automated screening of carbon dioxide conditions for microbial cell growth. Biomicrofluidics 2017, 11, 1–9. [Google Scholar] [CrossRef]
Figure 1. Schematic of the biofilm reactor (BR) module. Liquid medium is pumped into the silicone tube where inoculation and subsequent biofilm growth occur. The annular space created by the Tygon™ tube is used for gas channeling (dark arrows). CO2 molecules can readily pass between the dry, gaseous environment in the annular space and the aqueous environment inside the silicone tube (white arrows). The CO2 analyzer downstream continuously monitors the CO2 concentration in the gas stream.
Microorganisms 08 01163 g001
Figure 2. Configuration of the CSMS. CO2 produced by the heterotrophic biofilm in BRprod (CO2 producer) enters the annular space where it is carried by the sweeper gas to BRcons (CO2 consumer) via Analyzer 1. As the photoautotrophic biofilm inside BRcons develops, its rate of CO2 uptake increases, causing a subsequent decrease in the amount of gaseous CO2 reaching Analyzer 2. The difference in CO2 concentration logged by Analyzer 1 and 2 provides a real-time measure of the biofilm’s CO2 uptake.
Microorganisms 08 01163 g002
Figure 3. BRcons was inoculated with the photoautotrophic culture approximately 24 h after inoculation of the heterotrophic culture into BR1. (a) Divergence between BRcons influent and effluent CO2 concentration (Analyzer 1 and 2, respectively) was apparent within several hours of inoculation. (b) Using the ideal gas law, the difference between the influent and effluent concentration was converted to the rate of CO2 uptake, which resembled a typical microbial growth curve.
Microorganisms 08 01163 g003
Figure 4. Image and close up of BRcons colonized by a mature photoautotrophic biofilm. Green biomass is apparent within the inner silicone tube.
Microorganisms 08 01163 g004
Figure 5. A steady state photoautotrophic biofilm was placed in the dark by covering BRcons with an opaque sheet for approximately 4 h. Time zero refers to twenty hours post inoculation. (a) Within minutes, the CO2 concentration in the BRcons gas effluent (Analyzer 2) increased rapidly and remained elevated for the duration of the dark period. After illumination resumed, the effluent concentration quickly returned to its pre-dark level. (b) When converted and plotted as the rate of CO2 uptake, the plot depicts a complete cessation of photosynthesis and CO2 fixation in the dark, demonstrating the presence and activity of the photoautotrophic biofilm in BRcons.
Microorganisms 08 01163 g005
Figure 6. Abiotic control tests were performed in which concentrated CO2 was channeled through the uninoculated system for 0.25 h at a flow rate of 20 mL/min (a), and 2.5 mL/min (b). In both cases, the influent and effluent CO2 concentration remained virtually unchanged, demonstrating that without assimilation by the photoautotrophic biofilm, CO2 loss was minimal.
Microorganisms 08 01163 g006
Figure 7. The photoautotrophic biofilm in BRcons was illuminated on a cycle of alternating 12 h light and dark periods. On–off toggling of biofilm photosynthesis and CO2 uptake is readily apparent. Following each dark period, CO2 uptake rebounded to approximately the same level reached at the end of the previous light period. Time zero refers to twenty hours post inoculation.
Microorganisms 08 01163 g007
Figure 8. To assess whether the CSMS can detect changes in the biofilm’s CO2 uptake rate brought about by small fluctuations in light intensity, the height of light source illuminating BRcons was adjusted on both long (a) and short (b) timescales. Heights of 5 and 45 cm refer to PPFDs of approximately µmol/m2/s and 25.57 µmol/m2/s, respectively.
Microorganisms 08 01163 g008
Figure 9. The CSMS was amended with an additional biofilm reactor (BRcons2) downstream of BRcons. The gas stream in the system was sequential, with the sweeper gas flowing from Analyzer 2, through the annular space of BRcons2 to a third CO2 analyzer (Analyzer 3). (a) Initially, BRcons and BRcons2 were each inoculated with the photoautotrophic culture separately and received its own fresh feed of growth medium. In this configuration, the CO2 uptake rate within BRcons and BRcons2 were approximately the same, meaning that the presence of a second photoautotrophic biofilm roughly doubled the system’s overall CO2-sequestering capacity. (b) Subsequently, the system was configured such that both medium and gas passed sequentially from BRcons to BRcons2, producing a biofilm the length of two BRs. In this case, the CO2 uptake rate in the first half of the biofilm (BRcons) is higher than the second half of the biofilm (BRcons2), likely due to the depletion of some key nutrient(s) by the time the growth medium reached BRcons2.
Microorganisms 08 01163 g009
Table 1. CO2 sequestration monitoring system (CSMS) properties and operating conditions.
Inner Silicone TubeOuter Tygon™ Tube
Colonizable surface area74 cm2n/a
Volume2.90 mL19.85 mL
Flow rate0.25 mL/min2.5 mL/min
Retention time11.6 min7.9 min