Article

Digestive Ability, Physiological Characteristics, and Rumen Bacterial Community of Holstein Finishing Steers in Response to Three Nutrient Density Diets as Fattening Phases Advanced

1
State Key Laboratory of Animal Nutrition, College of Animal Science and Technology, China Agricultural University, Beijing 100193, China
2
Institute of Animal and Dairy Sciences, University of Agriculture, Faisalabad 35200, Pakistan
*
Authors to whom correspondence should be addressed.
Microorganisms 2020, 8(3), 335; https://doi.org/10.3390/microorganisms8030335
Submission received: 5 February 2020 / Revised: 19 February 2020 / Accepted: 24 February 2020 / Published: 27 February 2020
(This article belongs to the Special Issue Recent Advances in Applied Microbiology)

Abstract

:
The aim of this study is to track the dynamic alterations in nutrient intake and digestion, rumen fermentation and plasma metabolic characteristics, and rumen bacterial community of Holstein finishing steers in response to three nutrient density diets as fattening phases advanced. A total of eighteen Holstein steers were randomly allocated into three nutrient density groups and steers in each group were fed under a three-phase fattening strategy, with nutrient density increased in each group when fattening phase advanced. Results showed that both fattening phase and dietary nutrient density significantly influenced the nutrient digestion, most of the rumen fermentation parameters, and part of bacteria at phylum and genus levels. Individually, dietary nutrient density affected the concentrations of plasma alanine aminotransferase and urea N, bacterial richness and evenness. All determined nutrient intake and plasma biochemical parameters, except for alanine aminotransferase and triglyceride, differed among fattening phases. Spearman correlation analysis revealed strong correlations between fiber intake and bacterial richness and evenness, rumen fermentation characteristics and certain bacteria. Moreover, Patescibacteria abundance was positively correlated with ambient temperature and plasma total protein. These results indicate that rumen fermentation and nutrient digestion were influenced by both dietary nutrient density and fattening phase, and these influences were regulated by certain rumen bacterial community and ruminal bacteria may be affected simultaneously by ambient temperature. This study may provide insights into diet optimization and potentially adaptive mechanism of rumen bacterial community in response to fattening phases and gradually climatic change.

1. Introduction

The rumen is of peculiarity to ruminants and harbors complex microbiota, including bacteria, protozoa, archaea, and fungi, which together play pivotal roles in transforming plant material into exploitable nutrients. Among these ruminal microorganisms, bacteria are the most diverse population and have been investigated intensively in recent years [1,2,3]. Many studies have revealed the correlations between bacterial community and host productivity [1,4]. Therefore, a better understanding of rumen bacterial community will be beneficial in improving the productivity of ruminants.
It is proverbial that both diet and age impact the composition of the rumen bacteria [3,5]. Numerous studies have revealed that cattle fed grain-based diet had lower bacterial diversity as compared to forage-rich diet and these two typical diets possessed distinct communities [3,6,7]. Jami et al. [5] characterized the dynamic bacterial compositions at five representative stages from birth to adulthood and observed convergent bacterial community as age advanced. Additionally, our previous studies in finishing steers revealed monthly temporal dynamics in composition of rumen bacteria even fed the same diet [8] and time-dependent alterations of fecal bacterial community in fattening stage [9]. However, information about the responses of ruminal bacteria to fattening diets in various nutrient densities, fattening stage, and their possible interaction is limited.
Ambient environment also influences bacterial composition and the dynamic trends of bacterial community [10]. The predominant microbiota was quite different in seasons and opposite variation trend of Bacteroidetes abundance was observed in summer and winter [10]. Previous report revealed that both Succinivibrionaceae_UCG-002 and Ruminobacter abundances in rumen were positively associated with ambient temperature [8]. Yadav et al. [11] found that low ambient temperature reduced the mean retention time of ruminal contents, thus low digestibility of digesta may appear. Niu et al. [12] observed strong correlations between certain genera and apparent digestibility of fiber. However, the potential associations among ambient temperature, rumen bacteria, and nutrient digestibility are still limited.
A typical beef cattle production system in China involves two or more fattening stages, with each stage lasts three or more months. Tracking the same animals across different fattening stages can provide the possibility to capture the variations of the bacterial composition and physiological or digestive characteristics under production conditions, and further provide decision-making for practical cattle production. Therefore, the aim of this study is to track the dynamics in nutrient intake and digestion, rumen fermentation and plasma metabolic characteristics, and rumen bacterial community in three nutrient density diets as fattening phases advanced, and further to characterize the potential relationships between them.

2. Materials and Methods

2.1. Ethics Statement

Animal care and experimental procedures were approved by the Animal Care and Use Committee of China Agricultural University (Permit No. AW09059102-2).

2.2. Experiment Design and Sample Collection

Animal care and experimental design were according to our previous study [9]. Briefly, a total of eighteen Holstein steers, with average weight of 467 kg and average age of 14 months, were equally assigned to one of the three dietary treatments: high energy and high protein diet (H), moderate energy and moderate protein diet (C), and low energy and low protein diet (L). Steers in each treatment were fed with three-step strategy to meet or exceed the requirement of NRC [13], with the first three months named as phase 1, the second three months named as phase 2, and the last five months named phase 3. Dietary density in each dietary treatment increased as fattening phases advanced, which is commonly seen in practice in China. In addition, diets in each phase were designed to keep similar metabolizable energy to metabolizable protein ratio to minimize the possible effects due to protein balance. A detailed description of ingredients and nutrient composition is provided in Table 1.
Feed intake and refusal were recorded daily, and the temperature and humidity were collected a quarter of an hour during the 334-day trail. Plasma samples were collected from the coccygeal vein into evacuated tubes with heparin sodium two hours before morning feeding on last day of each month, and then centrifuged at 4000 rpm/min for 20 min to obtain the plasma. Plasma samples were aliquoted into 1.5-mL centrifuge tubes and stored at −80 °C before determination by an automatic biochemical analyzer (Hitachi 7020; Hitachi Co., Tokyo, Japan).
Ruminal content was obtained three hours after morning feeding every month as described by Paz et al. [14], wherein both solid and liquid fractions were collected using esophageal tubing. Fecal samples were collected on three consecutive days every month, with sampling interval of six hours on each day. Feces from three days in each month of each steer were equally mixed into one sample for chemical analysis.

2.3. DNA Extraction and Volatile Fatty Acids (VFA) Determination

One hundred and twenty-six ruminal samples (42 samples from each fattening phase, with 4, 5, and 5 in H, C, and L diets, respectively) were extracted using a DNA Kit (OMEGA, Omega Bio-Tek, Norcross, GA, USA) as described by Qiu et al. [8]. Purity and quality of genomic DNA were checked on 1% agarose gels and quantified using a spectrophotometer (NanoDrop 2000 Technologies Inc., Wilmington, DE, USA).
Ruminal pH was immediately determined by a portable pH meter (Testo 205, Testo AG, Schwarzwald, Germany) after collecting digesta from rumen. Ruminal contents were centrifuged at 20,000× g for 20 min at 4 °C, and the supernatants were the original samples for subsequent VFA and ammonia nitrogen (NH3-N) determination. VFA measurement was according to our previous report [9]. Briefly, 800 μL separated ruminal fluid was mixed evenly with 200 μL internal standard solution (filling 25 g metaphosphoric acid and 217 μL 2-ethylbutyric acid with sterile water to 100 mL) and the determination was by means of a gas chromatograph (GC-2014 Shimadzu Corporation, Kyoto, Japan) with a 30-m capillary column (Rtx-Wax, 0.25 mm ID × 0.25 μm film, Restek, Evry, France) and nitrogen as the carrier gas. The oven program was well optimized as follows: initial 110 °C for 30 s, up to 120 °C at a constant rate of 10 °C/min, 120 °C hold for 4 min, and gradually rise to 150 °C in 3 min. The split ratio and flow rate were controlled at 20:1 and 2.5 mL/min, respectively. NH3-N was determined according to Broderick and Kang [15] using the phenol-sodium hypochlorite colorimetry.

2.4. PCR Amplification, Sequencing, and Analysis

The primers and PCR reaction system used in the current study were according to our previous report [8]. Briefly, the V3 to V4 was selected as the target hypervariable region, which was amplified with the following primers: 338F (5′-ACTCCTACGGGAGGCAGCAG-3′) and 806R (5′-GGACTACHVGGGTWTCTAAT-3′). A well-constructed 25-μL reaction system was performed as 12.5 μL of KAPA 2G Robust Hot Start Ready Mix, 2 μL equal amount of forward and reverse primers (5 μM), 5 μL of ruminal DNA, and 5.5 μL of sterile double distilled water. The well-mixed reaction was amplified under the following program: 95 °C for 5 min; followed by 32 cycles of 95 °C for 45 s, 55 °C for 50 s, and 72 °C for 45 s; and 72 °C for 10 min. Each sample was performed in triplicate, and PCR products were evaluated on 2% agarose gels and purified using an DNA Gel Extraction kit (AxyPrep, Axygen Biosciences, Union City, CA, USA). Paired-end sequences were obtained via the Illumina MiSeq platform (San Diego, CA, USA).
The raw data were analyzed using QIIME (version 1.9.1, https://qiime.org/). Paired end reads were merged by FLASH (version 1.2.11, http://ccb.jhu.edu/software/FLASH/). The length of the sequences was controlled at minimum of 260 bp and maximum of 500 bp. Sequences that contain any ambiguous base or chimera, with quality score of below 20 or mismatching to primer sequences were out of consideration. Filtered sequences were clustered into operational taxonomic units (OTUs) at a similarity level of 0.97 using UPARSE method (USEARCH v11.0.667, http://www.drive5.com/usearch/). OTUs across all samples were rarefied to the lowest sample depth (38,708 reads) based on the pseudo-random number generator of QIIME. Alpha diversity metrics were calculated using Mothur (version 1.39.5, Patrick Schloss, Ann Arbor, USA) [16]. The Ribosomal Database Project (RDP) classifier (http://sourceforge.net/projects/rdp-classifier/) was selected to taxonomy classifications by assigning against the SILVA bacterial alignment database version 132 [17]. Spearman correlation coefficients (r) and FDR corrected values (q) were calculated using the Psych packages version 1.8.12 to show correlations between ambient temperature, nutrient intake and apparent digestibility, plasma biochemical parameters, rumen fermentation characteristics, and bacterial composition. The graph was finished by means of GraphPad Prism (version 8.0.2, GraphPad Software, Inc., San Diego, CA, USA).
The raw sequences involved in this study were deposited in the Sequence Read Archive (SRA) of NCBI, and the SRA accession number is PRJNA 573499. It should be noted especially that 30 ruminal samples from phase 1 had been taken to explore the sampling frequency regarding rumen bacterial community composition in our previous study [8], but the analysis methods and purposes were different from the current study.

2.5. Chemical Analysis and Apparent Digestibility Calculation

The dry matter (DM, method 934.01), crude protein (CP, method 990.03), ether extract (EE, method 920.39) and ash (method 942.05) of feeds, orts and feces were analyzed according to the methods of the Association of Official Analytical Chemists [18]. Neutral detergent fiber (NDF) and acid detergent fiber (ADF) were measured according to Van Soest et al. [19], with the former assayed with alpha amylase. Acid-insoluble ash was selected as a natural marker to estimate the total feces, and the apparent digestibility of nutrient was calculated using the method described by Niu et al. [12].

2.6. Statistical Analysis

The average daily temperature-humidity index (THI) was calculated according to Vitali et al. (2009), which is expressed as (1.8 × T + 32) – (0.55 – 0.55 × H/100) × [(1.8 × T + 32) – 58], where T denotes temperature (°C) and H indicates relative humidity (%); THI greater than 74 implied that cattle suffered from heat stress [20]. All three samples from the same steer in each fattening phase were averaged as one value to show a better presentation, because our previous study [8] showed that ruminal bacteria were in dynamic variation before an adaptation period of three months. Therefore, each fattening phase had 18 average values for each parameter, except for the bacterial community. All averaged data were analyzed as a repeated measures design in Mixed Models procedure of SPSS (version 21, IBM Corporation, Armonk, New York, United States) with first-order autoregressive covariance structure after comparing compound symmetry, first-order ante dependence and unstructured covariance structure based on the minimum Akaike information criterion (AIC) values. The statistical model used for this analysis is expressed as follows: yijt = μ + αi + γt + cj(i) + (αγ)it + eijt, where yijt is the parameter measured at fattening phase t on the jth cattle allotted to the ith diet, μ is the overall mean, αi is the ith fixed diet effect, γt is the fixed tth fattening phase effect, cj(i) is the random effect of the jth cattle within the ith diet, (αγ)it is the fixed interaction effect between diet and fattening phase, and eijt is the random error in the jth cattle allotted to the ith diet in fattening phase t. Multiple comparison was conducted using Tukey tests and significance was declared at 0.05 (p < 0.05).

3. Results

3.1. Temperature-Humidity Index, Nutrient Intake, and Apparent Digestibility

The average semimonthly temperature and humidity are presented in Figure S1. Days with THI over 74 were 0, 4, and 69 in phase 1, phase 2 and phase 3, respectively. Additionally, the proportion of days with THI over 74 to all days (69/154) in last phase was 44.81%. The nutrient intake and apparent digestibility of nutrient are shown in Table 2. All determined nutrient intake differed significantly (p < 0.001) in three fattening phases, with the highest in phase 2, followed by phase 1 and phase 3. The intakes of CP and EE increased as dietary nutrient density increased, whereas intakes of NDF and ADF decreased as dietary nutrient density increased (p < 0.05), with no differences (p > 0.10) in intakes of DM and OM due to dietary treatments. No interaction effects (p > 0.10) were found in nutrient intakes between fattening phase and dietary treatment.
Both fattening phase and dietary treatment influenced the apparent digestibility of measured nutrients. The apparent digestibility of DM, OM, CP, and EE were higher (p < 0.001) in phase 3 as compared to phase 1 and phase 2, whereas apparent digestibility of NDF and ADF were higher (p < 0.001) in phase 1 when compared with phase 2 and phase 3. The apparent digestibility of DM, OM, CP, and EE were higher (p < 0.05) in steers fed H diet than steers fed C and L diets, and opposite results were observed in the apparent digestibility of NDF and ADF. Interaction effects were observed in the apparent digestibility of ADF and EE between fattening phase and dietary treatment.

3.2. Plasma Metabolic Parameters

The plasma metabolic parameters are summarized in Table 3. Fattening phase significantly influenced (p < 0.05) the detected metabolic parameters, except for alanine aminotransferase (ALT) and triglyceride. The concentration of ALT was higher (p = 0.005) in steers fed L diet than that in steers fed H and C diets, and opposite result was observed in concentration of urea N (p < 0.001). Interaction effects were observed in concentrations of glucose, triglyceride, and urea N between fattening phase and dietary treatment.

3.3. Rumen Fermentation Characteristics

The rumen fermentation characteristics are shown in Table 4. Rumen pH, VFA, and total VFA (TVFA) significantly differed (p < 0.05) in three fattening phases, whereas no differences (p > 0.05) were observed in concentration of NH3-N and ratio of acetate to propionate (A/P). Dietary nutrient density altered (p < 0.05) most of the rumen fermentation profiles, except for concentrations of NH3-N and TVFA. Interaction effects, except for concentrations of NH3-N and acetate, were observed between fattening phase and dietary treatment.

3.4. Rumen Bacterial Community

A total of 16, 340, 654 sequencing reads were obtained after filtering low-quality data, with 99.99% of high-quality sequences between the lengths of 380 bp and 440 bp. After clustering high-quality sequences, an average of 1446 OTUs was obtained for each sample. The converged and slow-growing Shannon-Wiener curves (Figure S2) indicated that the sequencing depth in the current study was adequate to evaluate the vast composition of ruminal bacteria.
The estimation of alpha diversity is listed in Table 5. No differences (p > 0.05) in richness and evenness were observed among fattening phases. Chao 1, observed species, PD whole tree, and Shannon index increased as dietary nutrient density decreased. An interaction was observed in Shannon index between fattening phase and dietary treatment.
As is shown in Table 6, ten phyla were observed with relative abundance over 0.5%, and Bacteroidetes and Firmicutes dominated the most two. Fattening phase affected (p < 0.05) abundances of Bacteroidetes, Firmicutes, Proteobacteria, Fibrobacteres, and Patescibacteria, whereas dietary treatment had significant effects (p < 0.05) on eight out of ten phyla, except for Bacteroidetes and Actinobacteria. Besides, no interactions (p > 0.05) were observed between fattening phase and dietary treatment regarding phyla with relative abundance greater than 0.5%.
The taxonomic analysis with average abundance over 0.5% at the genus level is shown in Table 7. Twenty-six genera were observed with relative abundance greater than 0.5%, with Prevotella predominated 32.78%, 29.29%, and 26.86% in H, C, and L diets, respectively. Eight and ten out of twelve with relative abundance over 1% were affected (p < 0.05) by fattening phase and dietary treatment, respectively. Of these, no interactions (p > 0.05) were observed between fattening phase and dietary treatment. However, interactions were found in Veillonellaceae UCG-001, Prevotellaceae NK3B31 group, and Saccharofermentans between fattening phase and dietary treatment, whose relative abundances were below 1%.

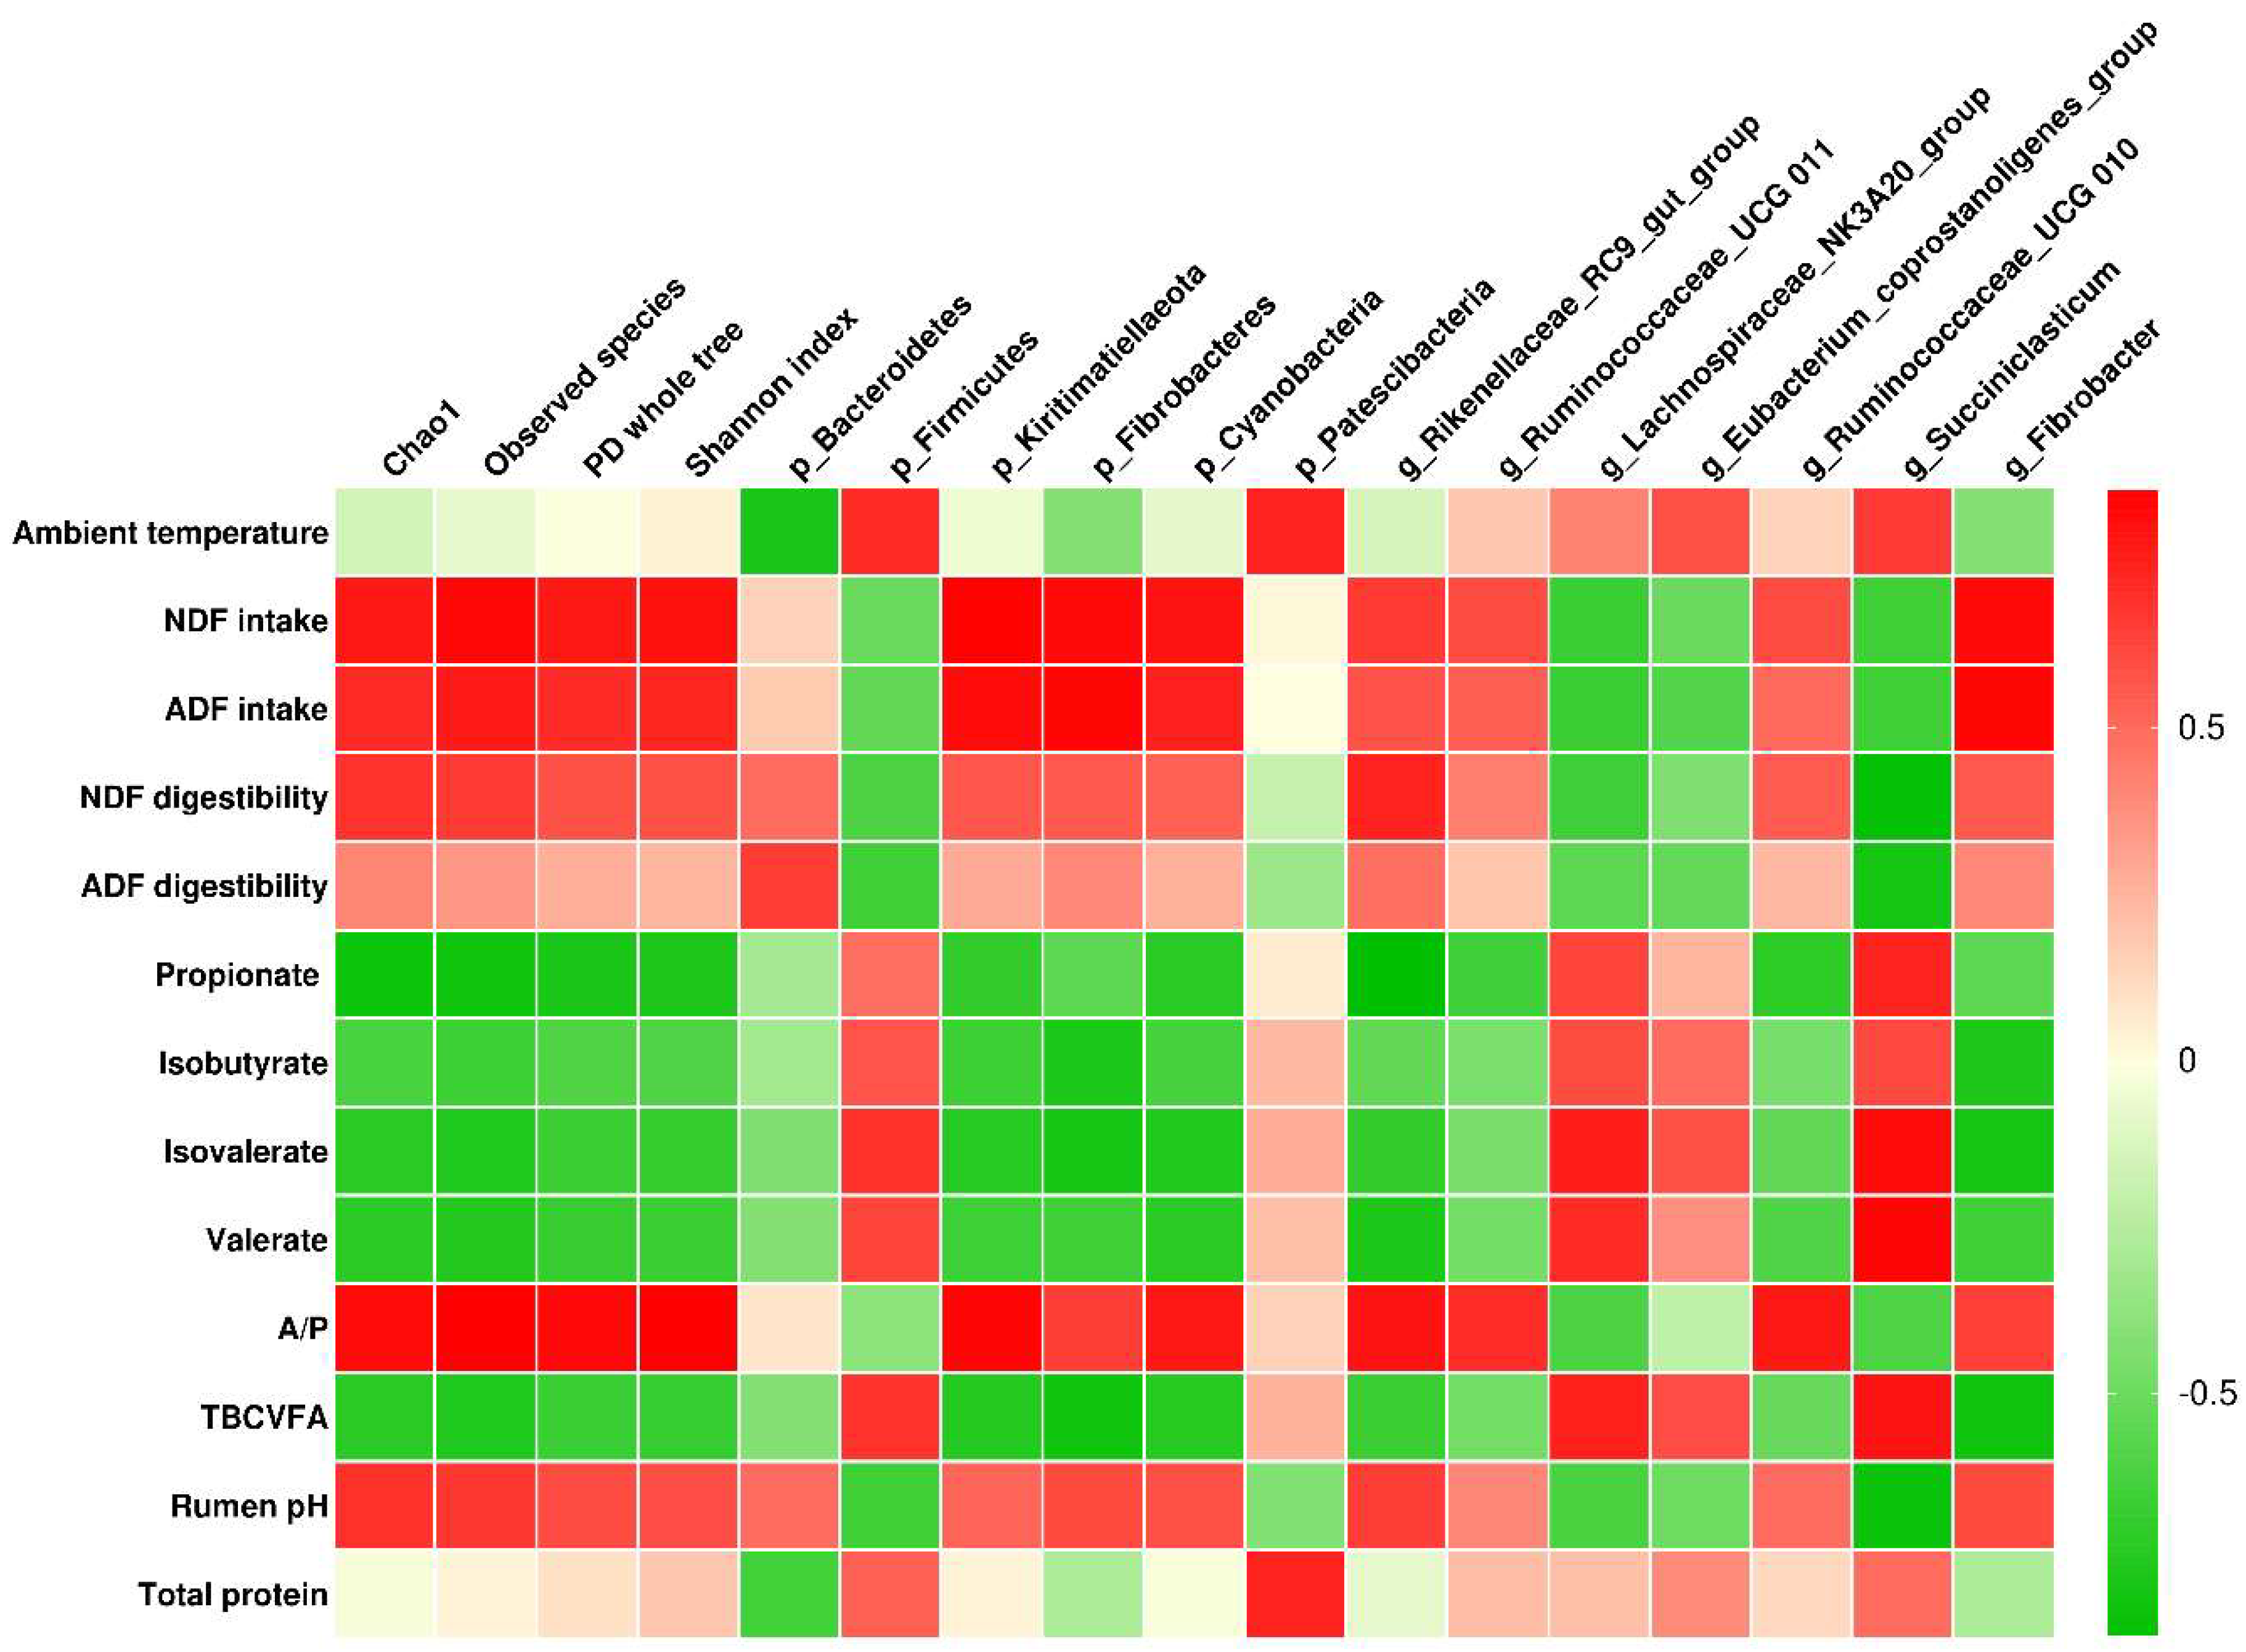
3.5. Correlation Analysis

Correlations between ambient temperature, nutrient intake and apparent digestibility, plasma metabolic and rumen fermentation characteristics, and rumen bacterial composition are shown in Figure 1. Ambient temperature was positively associated with the phyla Firmicutes and Patescibacteria (r > 0.7 and q < 0.01), and it also correlated negatively with the phylum Bacteroidetes (r = −0.770 and q < 0.001). The estimated alpha diversity (both richness and evenness) was negatively associated with propionate (r < −0.7 and q < 0.01) and positively associated with intakes of NDF and ADF and A/P (r > 0.7 and q < 0.01); richness (Chao 1 and observed species) correlated negatively with isovalerate, valerate, and total branched-chain VFA (BCVFA) (r < −0.7 and q < 0.01).
The intakes of NDF and ADF were positively correlated with phyla Kiritimatiellaeota, Cyanobacteria, and Fibrobacteres (r > 0.7 and q < 0.01). The apparent digestibility of NDF and ADF and rumen pH were negatively associated with the genus Succiniclasticum (r < −0.7 and q < 0.01), whereas the relative abundance of Succiniclasticum was positively correlated with propionate, isovalerate, valerate, and total BCVFA (r > 0.7 and q < 0.01). The plasma total protein correlated positively with the phylum Patescibacteria (r = 0.734 and q < 0.01). The concentration of propionate was negatively correlated with the genus Rikenellaceae RC9 gut group (r = −0.865 and q < 0.01). The A/P was positively associated with the relative abundance of Kiritimatiellaeota (r = 0.837 and q < 0.01).

4. Discussion

4.1. Digestive and Physiological Characteristics

It is generally accepted that nutrient intake increases as animals grow, so as to meet the requirement of maintenance and weight gain [13]. However, nutrient intake is affected by both feed intake and dietary nutrient density. In this study, nutrient intake decreased in phase 3 because of low feed intake because steers suffered from heat stress at over 40% of time in phase 3. Besides, nutrient intake increased as dietary nutrient density improved as a result of similar feed intake in each phase (Table 2).
Steers in phase 3 had higher apparent digestibility of DM, OM, CP, and EE, which is similar to the reports of Yadav et al. [11], and these differences could be due to longer retention time of digesta in phase 3 because previous study revealed digesta retention time increased as ambient temperature increased when temperature was below 35 °C [11]. However, this effect was quite different in the apparent digestibility of NDF and ADF. Previous study reported that the activity of cellulolytic bacteria was partly inhibited by low ruminal pH and further reduced the digestibility of NDF and ADF [21]. In this study, ruminal pH values were lower in phase 3 as compared to that in phase 1 and phase 2, thereby a lower digestibility of NDF and ADF was observed. Steers fed H diet improved the apparent digestibility of DM, OM, and EE, which could be attributed to the high starch content in H diet, a digestible nutrient for ruminants. The higher apparent digestibility of CP in H diet was similar to the result of Menezes et al. [22], who suggested a positive association between apparent digestibility of CP and protein level. Dietary nutrient density decreased the apparent digestibility of NDF and ADF, which is in accordance with the results of Tjardes et al. [23], who suggested that high-fiber diet increased the apparent total-tract digestibility of both NDF and ADF. These differences could be explained by the longer rumen retention time and more cellulolytic bacteria induced by higher content of fiber [21].
Previous study [24] reported that most blood biochemical characteristics changed with ages. In this study, albumin, cholesterol, glucose, total protein and urea N differed among fattening phases because of generally physiological reasons, which are consistent with the reports of Mohri et al. [24]. The urea N is the main end-product of protein hydrolysis and amino acid metabolism [25], and its concentration has shown to be positively associated with intake of CP [12]. Therefore, it was reasonable that plasma urea N increased as dietary nutrient density increased as a result of increased CP intake.
The ruminal pH is a vital ruminal characteristic because of its direct influence on microbial growth, and the adaptable pH for microbiota ranges from 5.5 to 7.0 [26]. In the current study, the ruminal pH values were in the tolerable range and decreased as dietary nutrient density improved and fattening phase advanced. High-density diet decreased the saliva production and chewing activities [27], and subsequently diminished the buffering capacity of suddenly increased VFA because of the high intake of fermentable carbohydrates. In addition, these differences among diets were more obvious in the last fattening phase, indicating that long-term stimulation would enlarge the effect of diets on ruminal pH, as seen by the interaction effect between fattening phase and diet regarding ruminal pH values. Generally, structural carbohydrates are mainly fermented into acetate and nonstructural carbohydrates produce more propionate [13], which was also mirrored in L and H diets in the present study, respectively. The A/P increased as dietary nutrient density decreased in the current study, which is in accordance with the fact that the A/P increased as the forage to concentrate ratio increased [28]. BCVFA usually derives from degradation of crude protein and has been used as an indicator of ruminal protein fermentation [29]. Higher concentrations of isobutyrate and isovalerate, as well as total BCVFA, were observed in H and C diets because of higher CP intake in these two diets. Our results showed high concentration of butyrate in H diet, which was similar to the report of Xia et al. [28] wherein bulls fed diet with high concentrate to forage ratio yielded high concentration of butyrate. Previous study [30] reported an elevated valerate concentration as the proportion of dietary concentrate increased. In this study, similar results in valerate concentration were obtained in terms of both diet and fattening phase, because higher dietary nutrient density, as well as later fattening phases, contained more fermentable nonstructural carbohydrates.

4.2. Rumen Bacterial Community Profiles

Alpha diversity metrics are used to estimate the species richness and evenness in a certain sample or a single community [31]. In this study, rumen samples from steers fed C and L diets showed higher diversity as compared to H diet, which is in line with many reports [3,6,7] in which grain-based diet decreased alpha diversity. These differences may be explained by the well-established theory that ruminal pH has a large impact on the rumen bacterial diversity [32].
Bacteroidetes and Firmicutes dominated about 90% of the bacterial composition, with 62.88% and 27.15%, respectively. The higher abundance of Firmicutes in steers fed H and C diets was due to lower ruminal pH in these two diets because previous study reported that lower ruminal pH increased the proportion of Firmicutes in bacterial composition [32]. Proteobacteria plays an important role in the rumen metabolism despite of the relative low abundance, and was frequently observed in starch-rich diet [3,33]. However, present study showed the opposite result wherein high abundance of Proteobacteria was observed in fiber-rich diet. It is tempting to assume that certain species in the phylum Proteobacteria may also actively take part in the digestion of fiber, but further studies are needed to confirm this assumption and certain species. Kiritimatiellaeota, a novel phylum previously assigned to the Verrucomicrobia subdivision 5, occupied niches mainly characterized by anaerobic environment [34]. The relative abundance of Kiritimatiellaeota increased as dietary nutrient density decreased, indicating that this phylum may be involved in fiber degradation. Fibrobacteres, as well as Fibrobacter, is well-known for its vital role in degrading cellulose, and they are commonly detected in fiber-rich diet [3]. Therefore, it is obvious to expect a decreasing abundance as dietary nutrient density increased in the present study.
Significant difference in Prevotella abundance was observed between steers fed H and L diets because of its function in starch fermenting and protein metabolism [35]. Similar result was observed in relative abundance of Prevotellaceae UCG-001, a genus belongs to the same family Prevotellaceae. However, Prevotellaceae UCG-003 showed the opposite results, which increased as dietary nutrient density decreased. These results regarding Prevotellaceae UCG-003 were similar to the report of Liu et al. [6] wherein higher proportion of Prevotellaceae UCG-003 was found in forage-based feeding group, indicating that different genera in the same family may involve in diverse metabolic function. Rikenellaceae RC9 gut group was previously regarded to be involved in the degradation of carbohydrates [36] and recent study in Holstein bulls has revealed the negative association between propionate concentration and Rikenellaceae RC9 gut group abundance [33]. In this study, the relative abundance of Rikenellaceae RC9 gut group decreased as dietary nutrient density increased which resembled to our previous research in feces [9], indicating that this genus may also be involved in degrading fiber in the rumen. The present study emerged a cumulative increase in Succiniclasticum abundance as dietary nutrient density increased, which is similar to previous report wherein high proportion of this genus was found in high-grain feeding pattern [6]. Previous study observed that Yak fed with more concentrate harbored higher abundance of Ruminococcaceae NK4A214 group and Ruminococcus 2 [6], which applied equally to Holstein steers fed with high density diet in the present study, indicating these two genera had the potential to degrade nonfibrous material. Ruminococcaceae UCG-011, a genus belonging to the family Ruminococcaceae, has been reported to be cellulose utilizer in rumen of beef cattle and higher proportion of this genus was observed in forage-based diet as compared to grain-rich diet [6], this is similar to our findings wherein relative abundance of Ruminococcaceae UCG-011 increased as the dietary nutrient density decreased.

4.3. Correlations between Ambient Temperature, Physiological and Digestive Characteristics, and Ruminal Bacterial Community

In this study, correlation analysis revealed the relationships between ambient temperature and rumen bacterial abundances. The superphylum Patescibacteria was commonly detected in anoxic environments and potentially involves anaerobic fermentative metabolisms [37]. Therefore, it is possible that Patescibacteria did exist in rumen because of anaerobic environment in rumen. In this study, Patescibacteria abundance was positively correlated with ambient temperature, indicating that Patescibacteria abundance in rumen could be influenced by ambient temperature, which could also be seen from higher abundance of this superphylum in phase 3 than in phase 1 and phase 2 (Table 6). Previous study reported opposite variation trend in relative abundances of Bacteroidetes and Firmicutes from winter to summer [10], and similar results were also observed in the present study, with negative correlation between ambient temperature and Bacteroidetes and positive correlation between ambient temperature and Firmicutes. Interestingly, one of the plasma metabolic parameters, total protein, was observed to be positively associated with the abundance of the superphylum Patescibacteria. The concentration of total protein depends on the absorption of globulin and albumin [38]. The present results indicate that Patescibacteria may indirectly accelerate the absorption of total protein. To our knowledge, this is the first time to observe association between plasma total protein concentration and Patescibacteria abundance.
The intake of fiber (NDF and ADF) correlated positively with alpha diversity indexes. This could be explained from two aspects. On the one hand, more intake of fiber indicates greater degradable fiber and fiber digestibility (Table 2), and greater fiber degradation indicates greater substrate and metabolite releases [39], thus the microbial populations have greater concentration of substrates for their living. On the other hand, greater intake of fiber carbohydrates keeps optimal ruminal acidity by stimulating rumination and saliva production [27], thus provides a favorable environment for the microbiota to grow. In addition, positive correlations were observed between NDF and ADF intake and Fibrobacteres, Kiritimatiellaeota, and Cyanobacteria. Among these phyla, Fibrobacteres is a typically cellulolytic phylum; Kiritimatiellaeota is potentially involved in fiber degradation; and Cyanobacteria was found to participate in degrading plant polysaccharides [1]. Succiniclasticum plays vital roles in degrading starch and transforming succinate into propionate [40], which explained the positive association between Succiniclasticum and propionate concentration. As described previously, propionate is the main product fermenting from nonstructural carbohydrates, and this type of carbohydrates are fermented rapidly and may restrict fiber fermentation [27], resulting in quite low ruminal pH which is unsuitable for microbial growth. Therefore, it is reasonable to see negative correlations between propionate concentration and bacterial diversity, as well as negative correlations between bacterial diversity and digestibility of NDF and ADF, and between bacterial diversity and rumen pH value. Moreover, propionate concentration correlated negatively with Rikenellaceae RC9 gut group abundance, which is very similar to the report of Wang et al. [33], indicating potential function of this genus in impeding propionate fermentation. A/P represents the ratio of structural carbohydrates to nonstructural carbohydrates in diet because of their main end product are acetate and propionate, respectively [13]. As described above, nonstructural carbohydrates generally ferment rapidly and result in low bacterial diversity due to lower ruminal pH, thus positive associations were observed between A/P and alpha diversity indexes. A/P was also positively correlated with Kiritimatiellaeota, proving again the involvement of this phylum in degradation of structural carbohydrates. Valerate is one of the products resulting from the degradation of branched amino acids and itself serves as an important precursor for synthesizing odd branched-chain fatty acids [6]. It has also been suggested that odd branched-chain fatty acids could be synthesized by elongating propionate [41]. Hence, it is reasonable to observe positive correlation between Succiniclasticum abundance and concentrations of propionate, isovalerate, valerate, and total BCVFA due to vital roles of this genus in fermenting succinate to propionate and degradation of protein [12,40].

5. Conclusions

In summary, both dietary nutrient density and fattening phase significantly impacted nutrient intake and digestion, rumen fermentation characteristics and rumen bacterial community. Besides, dietary nutrient density affected concentrations of ALT and urea N in plasma, rumen bacterial richness and evenness, while fattening phase influenced most of metabolic characteristics, except for ALT and triglyceride. The interaction effects between dietary treatment and fattening phase throughout the investigation indicate that continuous stimulations deepen the effect of dietary nutrient density on physiological and digestive characteristics, and bacterial community. Furthermore, correlation analysis indicates that diet and fattening phase, as well as ambient temperature, play crucial role in regulating digestive and physiological metabolisms and rumen bacteria.

Supplementary Materials

The following are available online at https://www.mdpi.com/2076-2607/8/3/335/s1, Figure S1: Dynamic changes in ambient temperature (°C) and relative humidity (%) and temperature-humidity index semimonthly as fattening phases advanced. Figure S2: Shannon-Wiener curves based on Shannon index for high energy and high protein diet (H), moderate energy and moderate protein diet (C), and low energy and low protein diet (L).

Author Contributions

Conceptualization, Q.Q., B.C., and H.S.; formal analysis, Q.Q., and C.G.; investigation, Q.Q. and C.G.; data curation, Q.Q. and M.A.u.R.; writing—original draft preparation, Q.Q.; writing—review and editing, Q.Q., H.S., and M.A.R.; visualization, Q.Q. and C.G.; supervision, B.C and H.S.; funding acquisition, B.C. and H.S. All authors have read and agreed to the published version of the manuscript.

Funding

This research was funded by National Key R&D Program of China (2018YFD0501800), Key Technology R&D Program of Ningxia (2017BY078 & 2018BFF02001), National Natural Science Foundation of China (31802084), China Agriculture Research System (CARS-37) and Chinese Universities Scientific Fund (2019TC001 & 2019TC156). The APC was funded by the same funds described above.

Acknowledgments

We are grateful for the help of workers from the Beijing Sanyuan Dairy Group. We thank Xinglong Zhang for his selfless support in accommodation. We also thank Yangxiang Zhu and Jingjing Wang for their assistance in samples collection.

Conflicts of Interest

The authors declare no conflict of interest.

References

  1. McGovern, E.; Kenny, D.A.; McCabe, M.S.; Fitzsimons, C.; McGee, M.; Kelly, A.K.; Waters, S.M. 16S rRNA sequencing reveals relationship between potent cellulolytic genera and feed efficiency in the rumen of bulls. Front. Microbiol. 2018, 9, 1842. [Google Scholar] [CrossRef] [PubMed]
  2. Liu, J.; Zhang, M.; Xue, C.; Zhu, W.; Mao, S. Characterization and comparison of the temporal dynamics of ruminal bacterial microbiota colonizing rice straw and alfalfa hay within ruminants. J. Dairy Sci. 2016, 99, 9668–9681. [Google Scholar] [CrossRef] [PubMed] [Green Version]
  3. Fernando, S.C.; Purvis, H.T.; Najar, F.Z.; Sukharnikov, L.O.; Krehbiel, C.R.; Nagaraja, T.G.; Roe, B.A.; DeSilva, U. Rumen microbial population dynamics during adaptation to a high-grain diet. Appl. Environ. Microbiol. 2010, 76, 7482–7490. [Google Scholar] [CrossRef] [PubMed] [Green Version]
  4. Weimer, P.J.; Cox, M.S.; de Paula, T.V.; Lin, M.; Hall, M.B.; Suen, G. Transient changes in milk production efficiency and bacterial community composition resulting from near-total exchange of ruminal contents between high- and low-efficiency Holstein cows. J. Dairy Sci. 2017, 100, 7165–7182. [Google Scholar] [CrossRef]
  5. Jami, E.; Israel, A.; Kotser, A.; Mizrahi, I. Exploring the bovine rumen bacterial community from birth to adulthood. ISME J. 2013, 7, 1069–1079. [Google Scholar] [CrossRef] [Green Version]
  6. Liu, C.; Wu, H.; Liu, S.J.; Chai, S.T.; Meng, Q.X.; Zhou, Z.M. Dynamic alterations in yak rumen bacteria community and metabolome characteristics in response to feed type. Front. Microbiol. 2019, 10, 1116. [Google Scholar] [CrossRef] [Green Version]
  7. Plaizier, J.C.; Li, S.C.; Danscher, A.M.; Derakshani, H.; Andersen, P.H.; Khafipour, E. Changes in microbiota in rumen digesta and feces due to a grain-based subacute ruminal acidosis (SARA) challenge. Microb. Ecol. 2017, 74, 485–495. [Google Scholar] [CrossRef]
  8. Qiu, Q.; Gao, C.; Gao, Z.; Muhammad Aziz ur, R.; He, Y.; Cao, B.; Su, H. Temporal dynamics in rumen bacterial community composition of finishing steers during an adaptation period of three months. Microorganisms 2019, 7, 410. [Google Scholar] [CrossRef] [Green Version]
  9. Qiu, Q.; Zhu, Y.; Qiu, X.; Gao, C.; Wang, J.; Wang, H.; He, Y.; Muhammad Aziz ur, R.; Cao, B.; Su, H. Dynamic variations in fecal bacterial community and fermentation profile of Holstein steers in response to three stepwise density diets. Animals 2019, 9, 560. [Google Scholar] [CrossRef] [Green Version]
  10. Resende, J.A.; Godon, J.J.; Bonnafous, A.; Arcuri, P.B.; Silva, V.L.; Otenio, M.H.; Diniz, C.G. Seasonal variation on microbial community and methane production during anaerobic digestion of cattle manure in Brazil. Microb. Ecol. 2016, 71, 735–746. [Google Scholar] [CrossRef]
  11. Yadav, B.; Singh, G.; Wankar, A.; Dutta, N.; Chaturvedi, V.B.; Verma, M.R. Effect of simulated heat stress on digestibility, methane emission and metabolic adaptability in crossbred cattle. Asian-Australas. J. Anim. Sci. 2016, 29, 1585–1592. [Google Scholar] [CrossRef] [PubMed]
  12. Niu, W.J.; He, Y.; Xia, C.Q.; Rahman, M.A.U.; Qiu, Q.H.; Shao, T.Q.; Liang, Y.X.; Ji, L.B.; Wang, H.B.; Cao, B.H. Effects of replacing Leymus chinensis with whole-crop wheat hay on Holstein bull apparent digestibility, plasma parameters, rumen fermentation, and microbiota. Sci. Rep. 2017, 7, 2114. [Google Scholar] [CrossRef] [PubMed]
  13. NASEM. Nutrient Requirements of Beef Cattle, 8th ed.; The National Academies Press: Washington, DC, USA, 2016. [Google Scholar] [CrossRef]
  14. Paz, H.A.; Anderson, C.L.; Muller, M.J.; Kononoff, P.J.; Fernando, S.C. Rumen bacterial community composition in Holstein and Jersey cows is different under same dietary condition and is not affected by sampling method. Front. Microbiol. 2016, 7, 1206. [Google Scholar] [CrossRef] [PubMed]
  15. Broderick, G.A.; Kang, J.H. Automated simultaneous determination of ammonia and total amino acids in ruminal fluid and invitro media. J. Dairy Sci. 1980, 63, 64–75. [Google Scholar] [CrossRef]
  16. Schloss, P.D.; Westcott, S.L.; Ryabin, T.; Hall, J.R.; Hartmann, M.; Hollister, E.B.; Lesniewski, R.A.; Oakley, B.B.; Parks, D.H.; Robinson, C.J.; et al. Introducing mothur: Open-source, platform-independent, community-supported software for describing and comparing microbial communities. Appl. Environ. Microbiol. 2009, 75, 7537–7541. [Google Scholar] [CrossRef] [PubMed] [Green Version]
  17. Quast, C.; Pruesse, E.; Yilmaz, P.; Gerken, J.; Schweer, T.; Yarza, P.; Peplies, J.; Glockner, F.O. The SILVA ribosomal RNA gene database project: Improved data processing and web-based tools. Nucleic Acids Res. 2013, 41, D590–D596. [Google Scholar] [CrossRef]
  18. Horwitz, W. Official Methods of Analysis of AOAC International, 17th ed.; AOAC International: Arlington, VA, USA, 2000. [Google Scholar]
  19. Van Soest, P.J.; Robertson, J.B.; Lewis, B.A. Methods for dietary fiber, neutral detergent fiber, and nonstarch polysaccharides in relation to animal nutrition. J. Dairy Sci. 1991, 74, 3583–3597. [Google Scholar] [CrossRef]
  20. Vitali, A.; Segnalini, M.; Bertocchi, L.; Bernabucci, U.; Nardone, A.; Lacetera, N. Seasonal pattern of mortality and relationships between mortality and temperature-humidity index in dairy cows. J. Dairy Sci. 2009, 92, 3781–3790. [Google Scholar] [CrossRef] [Green Version]
  21. Walsh, K.; O’Kiely, P.; Taweel, H.Z.; McGee, M.; Moloney, A.P.; Boland, T.M. Intake, digestibility and rumen characteristics in cattle offered whole-crop wheat or barley silages of contrasting grain to straw ratios. Anim. Feed Sci. Technol. 2009, 148, 192–213. [Google Scholar] [CrossRef]
  22. Menezes, A.C.B.; Valadares, S.C.; Silva, L.; Pacheco, M.V.C.; Pereira, J.M.V.; Rotta, P.P.; Zanetti, D.; Detmann, E.; Silva, F.A.S.; Godoi, L.A.; et al. Does a reduction in dietary crude protein content affect performance nutrient requirements, nitrogen losses, and methane emissions in finishing Nellore bulls? Agric. Ecosyst. Environ. 2016, 223, 239–249. [Google Scholar] [CrossRef]
  23. Tjardes, K.E.; Buskirk, D.D.; Allen, M.S.; Tempelman, R.J.; Bourquin, L.D.; Rust, S.R. Neutral detergent fiber concentration in corn silage influences dry matter intake, diet digestibility, and performance of Angus and Holstein steers. J. Anim. Sci. 2002, 80, 841–846. [Google Scholar] [CrossRef] [PubMed] [Green Version]
  24. Mohri, M.; Sharifi, K.; Eidi, S. Hematology and serum biochemistry of Holstein dairy calves: Age related changes and comparison with blood composition in adults. Res. Vet. Sci. 2007, 83, 30–39. [Google Scholar] [CrossRef] [PubMed]
  25. He, Y.; Yu, Z.T.; Qiu, Q.H.; Shao, T.Q.; Niu, W.J.; Xia, C.Q.; Wang, H.B.; Su, H.W.; Cao, B.H. Effects of dietary protein levels and calcium salts of long-chain fatty acids on nitrogen mobilization, rumen microbiota and plasma fatty acid composition in Holstein bulls. Anim. Feed Sci. Technol. 2018, 246, 1–10. [Google Scholar] [CrossRef]
  26. Pereira, D.H.; Pereira, O.G.; da Silva, B.C.; Leao, M.I.; Valadares, S.D.; Chizzotti, F.H.M.; Garcia, R. Intake and total and partial digestibility of nutrients, ruminal pH and ammonia concentration and microbial efficiency in beef cattle fed with diets containing sorghum (Sorghum bicolor (L.) Moench) silage and concentrate in different ratios. Livest. Sci. 2007, 107, 53–61. [Google Scholar] [CrossRef]
  27. Maekawa, M.; Beauchemin, K.A.; Christensen, D.A. Effect of concentrate level and feeding management on chewing activities, saliva production, and ruminal pH of lactating dairy cows. J. Dairy Sci. 2002, 85, 1165–1175. [Google Scholar] [CrossRef]
  28. Xia, C.Q.; Muhammad, A.U.R.; Niu, W.J.; Shao, T.Q.; Qiu, Q.H.; Su, H.W.; Cao, B.H. Effects of dietary forage to concentrate ratio and wildrye length on nutrient intake, digestibility, plasma metabolites, ruminal fermentation and fecal microflora of male Chinese Holstein calves. J. Integr. Agric. 2018, 17, 415–427. [Google Scholar] [CrossRef]
  29. Yang, C.M.J. Response of forage fiber degradation by ruminal microorganisms to branched-chain volatile fatty acids, amino acids, and dipeptides. J. Dairy Sci. 2002, 85, 1183–1190. [Google Scholar] [CrossRef]
  30. Owens, D.; McGee, M.; Boland, T.; O’Kiely, P. Intake, rumen fermentation and nutrient flow to the omasum in beef cattle fed grass silage fortified with sucrose and/or supplemented with concentrate. Anim. Feed Sci. Technol. 2008, 144, 23–43. [Google Scholar] [CrossRef]
  31. Tucker, C.M.; Cadotte, M.W.; Carvalho, S.B.; Davies, T.J.; Ferrier, S.; Fritz, S.A.; Grenyer, R.; Helmus, M.R.; Jin, L.S.; Mooers, A.O.; et al. A guide to phylogenetic metrics for conservation, community ecology and macroecology. Biol. Rev. 2017, 92, 698–715. [Google Scholar] [CrossRef]
  32. Hook, S.E.; Steele, M.A.; Northwood, K.S.; Dijkstra, J.; France, J.; Wright, A.D.G.; McBride, B.W. Impact of subacute ruminal acidosis (SARA) adaptation and recovery on the density and diversity of bacteria in the rumen of dairy cows. FEMS Microbiol. Ecol. 2011, 78, 275–284. [Google Scholar] [CrossRef] [Green Version]
  33. Wang, H.; He, Y.; Li, H.; Wu, F.; Qiu, Q.; Niu, W.; Gao, Z.; Su, H.; Cao, B. Rumen fermentation, intramuscular fat fatty acid profiles and related rumen bacterial populations of Holstein bulls fed diets with different energy levels. Appl. Microbiol. Biotechnol. 2019, 103, 4931–4942. [Google Scholar] [CrossRef] [PubMed]
  34. Spring, S.; Bunk, B.; Sproer, C.; Schumann, P.; Rohde, M.; Tindall, B.J.; Klenk, H.P. Characterization of the first cultured representative of Verrucomicrobia subdivision 5 indicates the proposal of a novel phylum. ISME J. 2016, 10, 2801–2816. [Google Scholar] [CrossRef] [PubMed] [Green Version]
  35. Purushe, J.; Fouts, D.E.; Morrison, M.; White, B.A.; Mackie, R.I.; Coutinho, P.M.; Henrissat, B.; Nelson, K.E. Comparative genome analysis of prevotella ruminicola and prevotella bryantii: Insights into their environmental niche. Microb. Ecol. 2010, 60, 721–729. [Google Scholar] [CrossRef] [PubMed]
  36. Pitta, D.W.; Pinchak, W.E.; Dowd, S.E.; Osterstock, J.; Gontcharova, V.; Youn, E.; Dorton, K.; Yoon, I.; Min, B.R.; Fulford, J.D.; et al. Rumen bacterial diversity dynamics associated with changing from bermudagrass hay to grazed winter wheat diets. Microb. Ecol. 2010, 59, 511–522. [Google Scholar] [CrossRef]
  37. Herrmann, M.; Wegner, C.E.; Taubert, M.; Geesink, P.; Lehmann, K.; Yan, L.J.; Lehmann, R.; Totsche, K.U.; Kusel, K. Predominance of Cand. Patescibacteria in groundwater is caused by their preferential mobilization from soils and flourishing under oligotrophic conditions. Front. Microbiol. 2019, 10, 1407. [Google Scholar] [CrossRef] [Green Version]
  38. Rauprich, A.B.E.; Hammon, H.M.; Blum, J.W. Effects of feeding colostrum and a formula with nutrient contents as colostrum on metabolic and endocrine traits in neonatal calves. Biol. Neonate 2000, 78, 53–64. [Google Scholar] [CrossRef]
  39. Reis, W.L.S.; Detmann, E.; Batista, E.D.; Rufino, L.M.A.; Gomes, D.I.; Bento, C.B.P.; Mantovani, H.C.; Valadares, S.C. Effects of ruminal and post-ruminal protein supplementation in cattle fed tropical forages on insoluble fiber degradation, activity of fibrolytic enzymes, and the ruminal microbial community profile. Anim. Feed Sci. Technol. 2016, 218, 1–16. [Google Scholar] [CrossRef]
  40. Vangylswyk, N.O. Succiniclasticum Ruminis Gen-Nov, Sp-Nov, a ruminal bacterium converting succinate to propionate as the sole energy-yielding mechanism. Int. J. Syst. Bacteriol. 1995, 45, 297–300. [Google Scholar] [CrossRef] [Green Version]
  41. Bainbridge, M.L.; Saldinger, L.K.; Barlow, J.W.; Alvez, J.P.; Roman, J.; Kraft, J. Alteration of rumen bacteria and protozoa through grazing regime as a tool to enhance the bioactive fatty acid content of bovine milk. Front. Microbiol. 2018, 9, 904. [Google Scholar] [CrossRef]
Figure 1. Correlations between ambient temperature, physiological and digestive characteristics, and bacterial abundances of Holstein finishing steers fed three nutrient density diets. Only significant correlations (r > 0.70 or r < −0.70 and q-value < 0.05) and bacteria abundances greater than 0.5% are shown. The colors indicate positive (red, closer to 1) or negative (green, closer to −1) correlations between investigated characteristics and bacterial abundances. A/P, acetate to propionate ratio; TBCVFA, total branched-chain volatile fatty acids.
Microorganisms 08 00335 g001
Table 1. Ingredients and nutrient compositions of the diets.
Item 1Phase 1Phase 2Phase 3
HCLHCLHCL
Ingredients, g/kg of DM
Corn grain529414299588468348620501382
Wheat grain73.257.341.471.757.142.587.870.954.0
Soybean meal94.173.753.293.774.655.589.772.555.3
Leymus chinensis282438594216376536169329489
Limestone7.205.604.107.806.204.608.306.705.10
NaHCO30.000.000.007.806.204.608.306.705.10
NaCl7.105.604.007.806.204.608.306.705.10
Premix 27.205.604.107.806.204.608.306.705.10
Nutrient composition 3, g/kg of DM
ME, Mcal/kg2.712.532.352.772.582.402.822.642.46
MP, g/kg82.973.964.883.975.266.484.376.067.7
ME/MP, Mcal/g0.0330.0340.0360.0330.0340.0360.0340.0350.036
NDF277371464236332428208304400
ADF146202258121179237104162219
Ether extract34.632.530.535.633.431.336.134.031.9
Main fatty acid profile 4 (mg/g feed, DM)
C16:03.873.533.193.333.122.924.063.733.39
C18:1n9c3.642.922.213.252.662.074.253.502.75
C18:2n64.273.472.673.372.802.243.552.982.41
SFA6.015.615.204.854.714.565.885.555.21
UFA8.757.536.317.336.485.628.487.466.43
1 H = high energy and high protein diet group; C = moderate energy and moderate protein diet group; L = low energy and low protein diet group. The ingredients and nutrient composition were in accordance with our previous study (Qiu, et al. 2019). 2 Manufactured by Tangshan Mahanen Feed Co., Ltd., Tangshan, China; premix provided the following per kg of dry matter (DM): 5000 IU of vitamin A, 3000 IU of vitamin D3, 45 mg of vitamin E, 60 mg of Fe, 63 mg of Zn, 99 mg of Mn, 200 mg of Cu, 0.5 mg of Se, 1.1 mg of I, 0.45 mg of Co, 877 g of rice bran. 3 DM, dry matter; ME, metabolizable energy; MP, metabolizable protein, predicted according to NRC (2016) using average values for RUP and RDP; NDF, neutral detergent fiber; ADF, acid detergent fiber. 4 SFA, saturated fatty acids; UFA, unsaturated fatty acids.
Table 2. Effects of dietary nutrient density on nutrient intake and apparent digestibility in the whole fattening phases of Holstein steers.
Item 1Phase 1Phase 2Phase 3SEM 2p-Value 3
HCLHCLHCLPhaseDietP × D
Nutrient intake, kg/d
Dry matter10.711.310.613.513.412.911.912.512.80.41<0.0010.4910.401
OM10.210.710.012.412.412.011.311.812.10.39<0.0010.4890.445
Crude protein1.411.331.101.691.471.211.411.301.160.05<0.001<0.0010.168
Ether extract0.400.390.340.510.470.410.450.440.420.02<0.001<0.0010.448
NDF2.924.114.793.034.285.292.163.314.440.11<0.001<0.0010.231
ADF1.502.202.631.532.282.901.001.632.250.06<0.001<0.0010.242
Apparent digestibility of nutrient, %
Dry matter69.868.668.271.065.166.578.975.574.11.42<0.0010.0040.477
OM71.470.870.572.466.868.780.577.576.51.45<0.0010.0190.469
Crude protein71.567.867.970.462.661.676.772.269.51.79<0.001<0.0010.574
Ether extract71.8 bcd69.9 cd64.0 d69.7 cd66.4 d71.5 cd84.9 a79.7 ab75.5 bc1.73<0.0010.0030.006
NDF64.768.774.355.060.867.559.464.266.31.65<0.001<0.0010.486
ADF65.2 bc68.2 ab73.6 a55.2 e58.1 de62.4 bcd56.0 de61.0 cde57.3 de1.46<0.001<0.0010.023
1 OM, organic matter; NDF, neutral detergent fiber; ADF, acid detergent fiber. Phase 1 indicates fattening phase 1 (1–3 month), phase 2 indicates fattening phase 2 (4–6 month), and phase 3 indicates fattening phase 3 (7–11 month). H = high energy and high protein diet, C = moderate energy and moderate protein diet, and L = low energy and low protein diet. 2 SEM, standard error of means. 3 P × D indicates interaction effect between fattening phase and dietary treatment, lowercase letters are marked only when the interaction effect was significant.
Table 3. Effects of dietary nutrient density on plasma biochemical parameters in the whole fattening phases of Holstein steers.
Item 1Phase 1Phase 2Phase 3SEM 2p – Value 3
HCLHCLHCLPhaseDietP × D
Albumin, g/L34.0333.7032.8933.7034.6233.9835.8534.5935.260.440.0010.4760.139
ALT, U/L20.620.824.120.224.425.823.519.725.71.190.2320.0050.091
AST, U/L47.245.841.950.153.047.046.648.647.63.240.0930.2060.253
AST/ALT2.362.241.682.492.211.812.162.551.860.210.6210.0750.208
Cholesterol, mmol/L2.752.842.462.893.182.752.282.382.480.12<0.0010.2110.072
Glucose, mmol/L4.27 a4.13 ab3.95 abc3.74 bcd3.78 bcd3.49 d3.63 cd3.50 d3.86 bcd0.09<0.0010.3690.007
Total protein, g/L58.656.253.758.761.460.262.565.868.01.77<0.0010.7010.116
Triglyceride, mmol/L0.20 b0.22 ab0.29 a0.21 ab0.24 ab0.24 ab0.24 ab0.23 ab0.24 ab0.020.6630.0020.018
Urea N, mmol/L4.07 a3.52 abc2.27 d3.77 ab3.61 abc2.59 d2.82 cd3.04 bcd2.78 cd0.180.008<0.0010.001
1 ALT, alanine aminotransferase; AST, aspartate aminotransferase; AST/ALT denotes AST to ALT ratio. Phase 1 indicates fattening phase 1 (1-–3 month), phase 2 indicates fattening phase 2 (4–6 month), and phase 3 indicates fattening phase 3 (7–11 month). H = high energy and high protein diet, C = moderate energy and moderate protein diet and L = low energy and low protein diet. 2 SEM, standard error of means. 3 P × D indicates interaction effect between fattening phase and dietary treatment, lowercase letters are marked only when the interaction effect was significant.
Table 4. Effects of dietary nutrient density on rumen fermentation characteristics in the whole fattening phases of Holstein steers.
Item 1Phase 1Phase 2Phase 3SEM 2p – Value 3
HCLHCLHCLPhaseDietP × D
NH3-N, mg/dL4.413.662.564.654.233.045.014.313.161.1560.6790.3130.998
Rumen pH6.56 abc6.65 ab6.78 a6.26 de6.33 cde6.71 ab5.86 f6.25 e6.52 bcd0.054<0.001<0.0010.002
Acetate, mM39.146.548.346.853.256.547.050.856.11.570<0.001<0.0010.620
Propionate, mM13.5 b12.0 b10.3 b18.8 a13.7 b12.1 b21.0 a13.8 b10.7 b0.738<0.001<0.001<0.001
Isobutyrate, mM0.64 bc0.65 bc0.52 d0.62 cd0.66 bc0.52 d0.81 a0.74 ab0.57 cd0.022<0.001<0.0010.013
Butyrate, mM7.23 cde6.62 de6.29 e9.03 abc10.0 a8.20 abcd9.67 ab8.90 abc7.79 bcde0.401<0.0010.0350.030
Isovalerate, mM0.92 cde0.88 cde0.60 e1.16 c1.09 cd0.62 e2.17 a1.67 b0.78 de0.076<0.001<0.001<0.001
Valerate, mM0.78 cde0.68 ef0.58 f0.98 b0.85 bcd0.70 def1.40 a0.90 bc0.66 ef0.033<0.001<0.001<0.001
TVFA, mM62.2 b67.3 b66.7 b77.4 a79.6 a78.6 a82.1 a76.8 a76.5 a1.861<0.0010.9370.008
A/P2.98 de3.92 bc4.71 ab2.58 e3.93 bc4.67 ab2.41 e3.81 cd5.38 a0.1710.380<0.0010.007
TBCVFA, mM1.56 cde1.53 cdef1.12 f1.78 c1.74 cd1.14 ef2.98 a2.41 b1.35 def0.087<0.001<0.001<0.001
1 NH3-N, ammonia nitrogen; TVFA, total volatile fatty acids; A/P, acetate to propionate ratio; TBCVFA, total branched-chain volatile fatty acids, equal to the sum of isobutyrate and isovalerate. Phase 1 indicates fattening phase 1 (1–3 month), phase 2 indicates fattening phase 2 (4–6 month), and phase 3 indicates fattening phase 3 (7–11 month). H = high energy and high protein diet, C = moderate energy and moderate protein diet, and L = low energy and low protein diet. 2 SEM, standard error of means. 3 P × D indicates interaction effect between fattening phase and dietary treatment, lowercase letters are marked only when the interaction effect was significant.
Table 5. Effects of dietary nutrient density on alpha diversity metrics in the whole fattening phases of Holstein steers.
Item 1Phase 1Phase 2Phase 3SEM 2p – Value 3
HCLHCLHCLPhaseDietP × D
Chao118522221240716852116228816011970242590.780.053<0.0010.265
Observed species11951440158611121428156710491305166053.800.179<0.0010.064
PD whole tree100.0117.4124.8100.1117.6123.196.25110.6132.53.6540.929<0.0010.093
Shannon index7.456 d8.084 bc8.323 abc7.385 d8.167 bc8.445 ab7.364 d7.858 cd8.718 a0.1130.855<0.0010.029
1 PD, phylogenetic diversity. Phase 1 indicates fattening phase 1 (1–3 month), phase 2 indicates fattening phase 2 (4–6 month), and phase 3 indicates fattening phase 3 (7–11 month). H = high energy and high protein diet, C = moderate energy and moderate protein diet, and L = low energy and low protein diet. 2 SEM, standard error of means. 3 P × D indicates interaction effect between fattening phase and dietary treatment, lowercase letters are marked only when the interaction effect was significant.
Table 6. Effects of dietary nutrient density on rumen bacterial composition at phylum level (relative abundance > 0.5%) in the whole fattening phases of Holstein steers.
Phylum Name 1Phase 1Phase 2Phase 3SEM 2p - Value 3
HCLHCLHCLPhaseDietP × D
Bacteroidetes72.1566.5267.6661.2161.1463.5556.7058.4958.821.73<0.0010.4820.269
Firmicutes21.4825.0821.0730.1526.6421.3637.1833.6229.251.60<0.0010.0010.135
Proteobacteria1.752.582.462.404.453.621.242.143.000.540.0220.0080.579
Kiritimatiellaeota0.481.171.900.491.303.490.460.792.120.320.096<0.0010.187
Fibrobacteres0.861.122.391.041.513.010.380.451.270.20<0.001<0.0010.122
Spirochaetes0.640.851.070.790.961.270.800.660.900.120.1010.0370.431
Cyanobacteria0.490.581.330.490.851.240.230.521.470.150.604<0.0010.362
Patescibacteria0.380.580.530.330.800.640.981.090.900.08<0.0010.0080.272
Actinobacteria0.800.250.200.960.640.300.680.800.410.240.3490.1720.557
Tenericutes0.410.660.590.440.660.520.280.420.720.080.4260.0130.078
1 Phase 1 indicates fattening phase 1 (1–3 month), phase 2 indicates fattening phase 2 (4–6 month), and phase 3 indicates fattening phase 3 (7–11 month). H = high energy and high protein diet, C = moderate energy and moderate protein diet, and L = low energy and low protein diet. 2 SEM, standard error of means. 3 P × D indicates interaction effect between fattening phase and dietary treatment.
Table 7. Effects of dietary nutrient density on rumen bacterial composition at genus level (relative abundance > 0.5%) in the whole fattening phases of Holstein steers.
Genus Name 1Phase 1Phase 2Phase 3SEM 2p - Value 3
HCLHCLHCLPhaseDietP × D
Prevotella38.9331.5329.4831.2030.5728.5628.2025.7822.532.490.0050.0420.651
Uncultured rumen bacterium14.1414.7614.6314.8514.8115.8915.3316.0415.641.170.4340.8330.920
Rikenellaceae RC9 gut group4.637.9610.832.805.347.854.356.2910.060.830.001<0.0010.629
Succiniclasticum3.602.961.746.684.252.758.745.983.940.48<0.001<0.0010.111
Prevotellaceae UCG-0033.533.094.631.693.134.371.372.923.360.470.0260.0030.246
Ruminococcaceae NK4A214 group1.542.151.372.581.911.613.643.112.270.23<0.0010.0030.069
Prevotellaceae UCG-0013.382.221.734.951.501.662.081.261.440.560.0950.0170.186
Ruminococcus 22.161.710.792.501.700.721.892.380.850.360.7710.0030.412
Fibrobacter0.861.122.381.041.513.010.380.451.260.20<0.001<0.0010.117
Christensenellaceae R-7_group0.821.271.010.821.001.181.711.761.810.16<0.0010.2470.538
Ruminococcaceae UCG-0110.561.281.170.601.101.510.411.551.900.190.1090.0010.099
Lachnospiraceae NK3A20 group0.850.820.531.900.890.582.011.290.750.200.0030.0030.066
Prevotellaceae UCG-0041.361.221.010.691.051.270.470.740.900.140.0090.1040.112
Succinivibrionaceae UCG-0020.561.020.810.791.721.220.490.960.810.320.1600.0890.929
Moryella0.990.870.380.911.300.551.181.240.850.150.0540.0030.484
Ruminococcaceae UCG-0140.610.900.930.921.180.560.931.120.880.140.3020.0870.103
Eubacterium coprostanoligenes group0.720.800.620.960.690.551.321.171.000.09<0.0010.0250.440
Veillonellaceae UCG-0010.44 b0.66 b0.71 b0.61 b0.67 b0.76 b1.96 a1.01 ab0.96 b0.170.0020.5410.031
Treponema 20.600.770.950.770.891.130.770.610.780.120.0970.1210.441
Prevotellaceae NK3B31 group0.71 ab0.98 ab0.59 ab0.60 ab0.74 ab0.94 ab0.32 b0.70 ab1.27 a0.160.9990.1000.011
Selenomonas 10.770.680.610.880.980.520.910.700.510.110.3520.0450.247
Candidatus_Saccharimonas0.370.560.500.320.740.630.830.970.800.08<0.0010.0210.393
Ruminococcus 10.460.660.690.740.690.660.360.450.720.080.0310.0630.072
CAG-3520.370.630.450.931.040.490.330.680.460.130.0030.0570.153
Ruminococcaceae UCG-0100.340.590.680.300.430.660.330.600.950.070.018<0.0010.118
Saccharofermentans0.56 abc0.68 ab0.60 abc0.37 cd0.40 cd0.41 bcd0.28 d0.56 abc0.70 a0.060.0020.0040.043
1 Phase 1 indicates fattening phase 1 (1–3 month), phase 2 indicates fattening phase 2 (4–6 month), and phase 3 indicates fattening phase 3 (7–11 month). H = high energy and high protein diet, C = moderate energy and moderate protein diet, and L = low energy and low protein diet. 2 SEM, standard error of means. 3 P × D indicates interaction effect between fattening phase and dietary treatment, lowercase letters are marked only when the interaction effect was significant.

