Changes of Quality of Minimally-Processed Pineapple (Ananas comosus, var. ‘Queen Victoria’) during Cold Storage: Fungi in the Leading Role


Abstract
1. Introduction
2. Materials and Methods
2.1. Fruits Preparation
2.2. Fruit Quality Determination
2.2.1. Microbiology
2.2.2. Physicochemical
2.3. Spoilage Assays
2.4. Sensory Quality Characteristics
2.5. Molecular Biology Methods
2.5.1. DNA Extraction
2.5.2. PCR-Denaturing Gradient Gel Electrophoresis (DGGE)
2.5.3. Identification
2.6. Statistical Analysis
3. Results
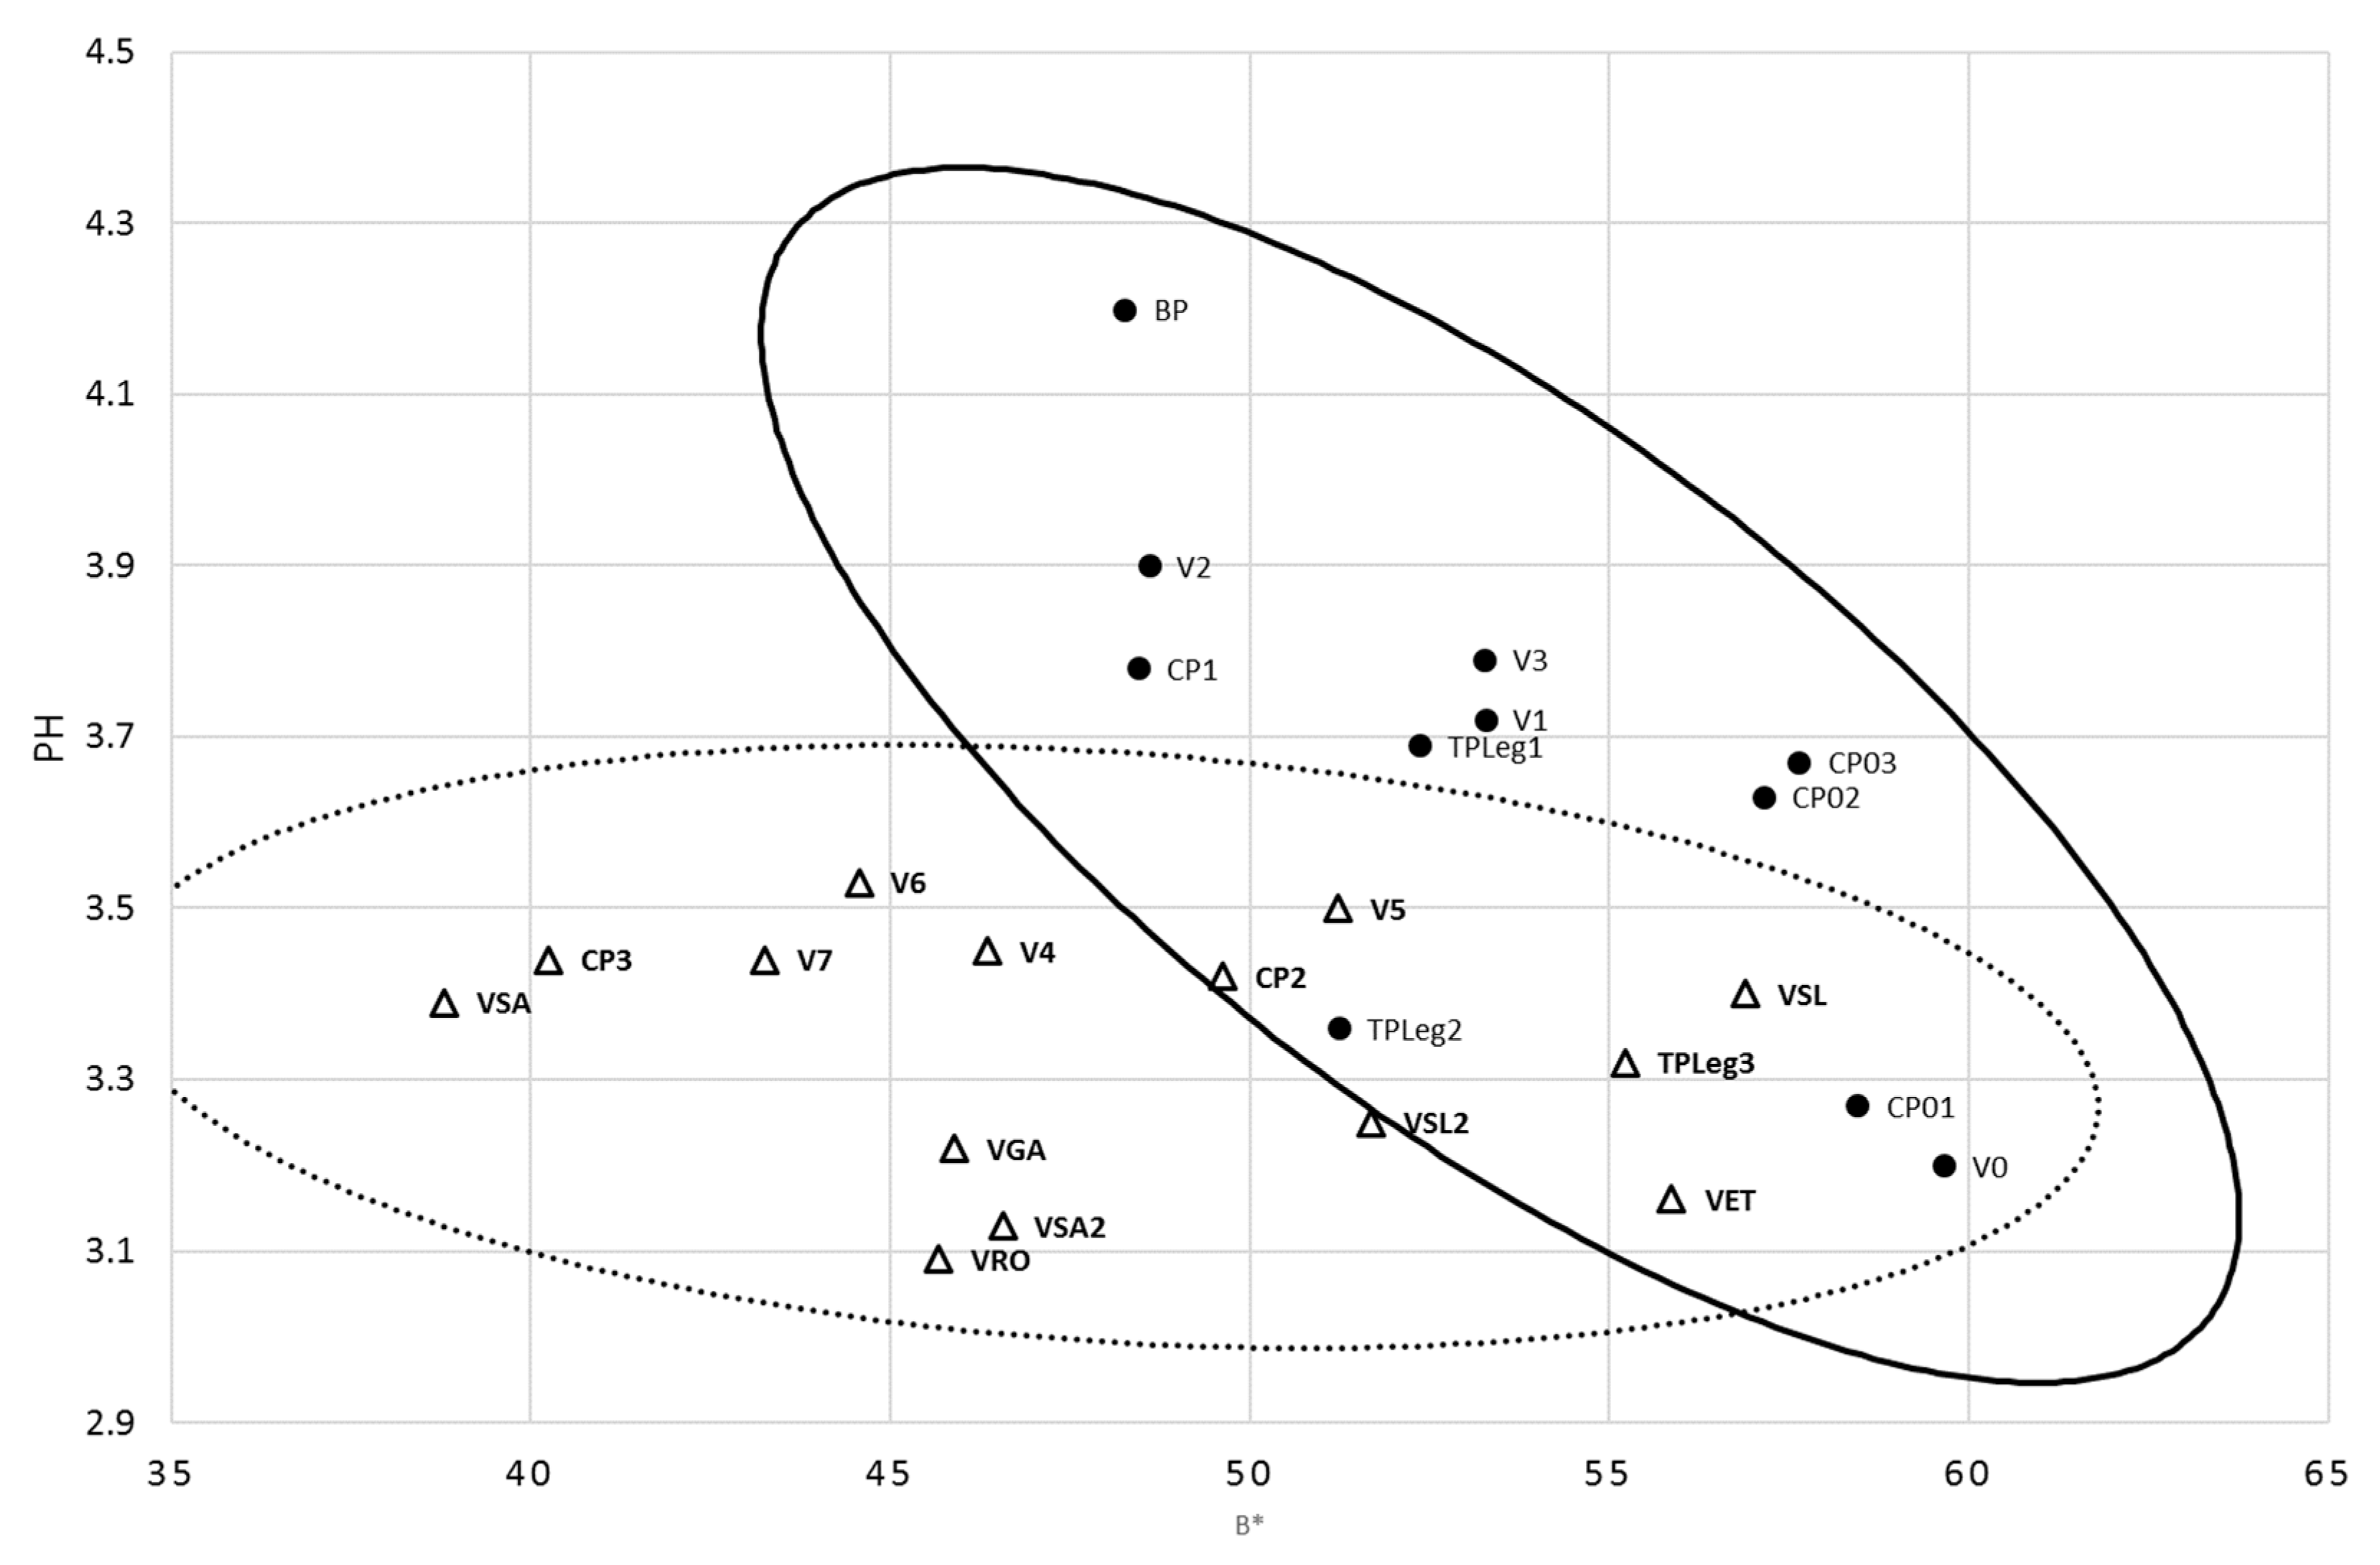
3.1. Freshly Prepared Minimally-Processed Pineapple Characteristics
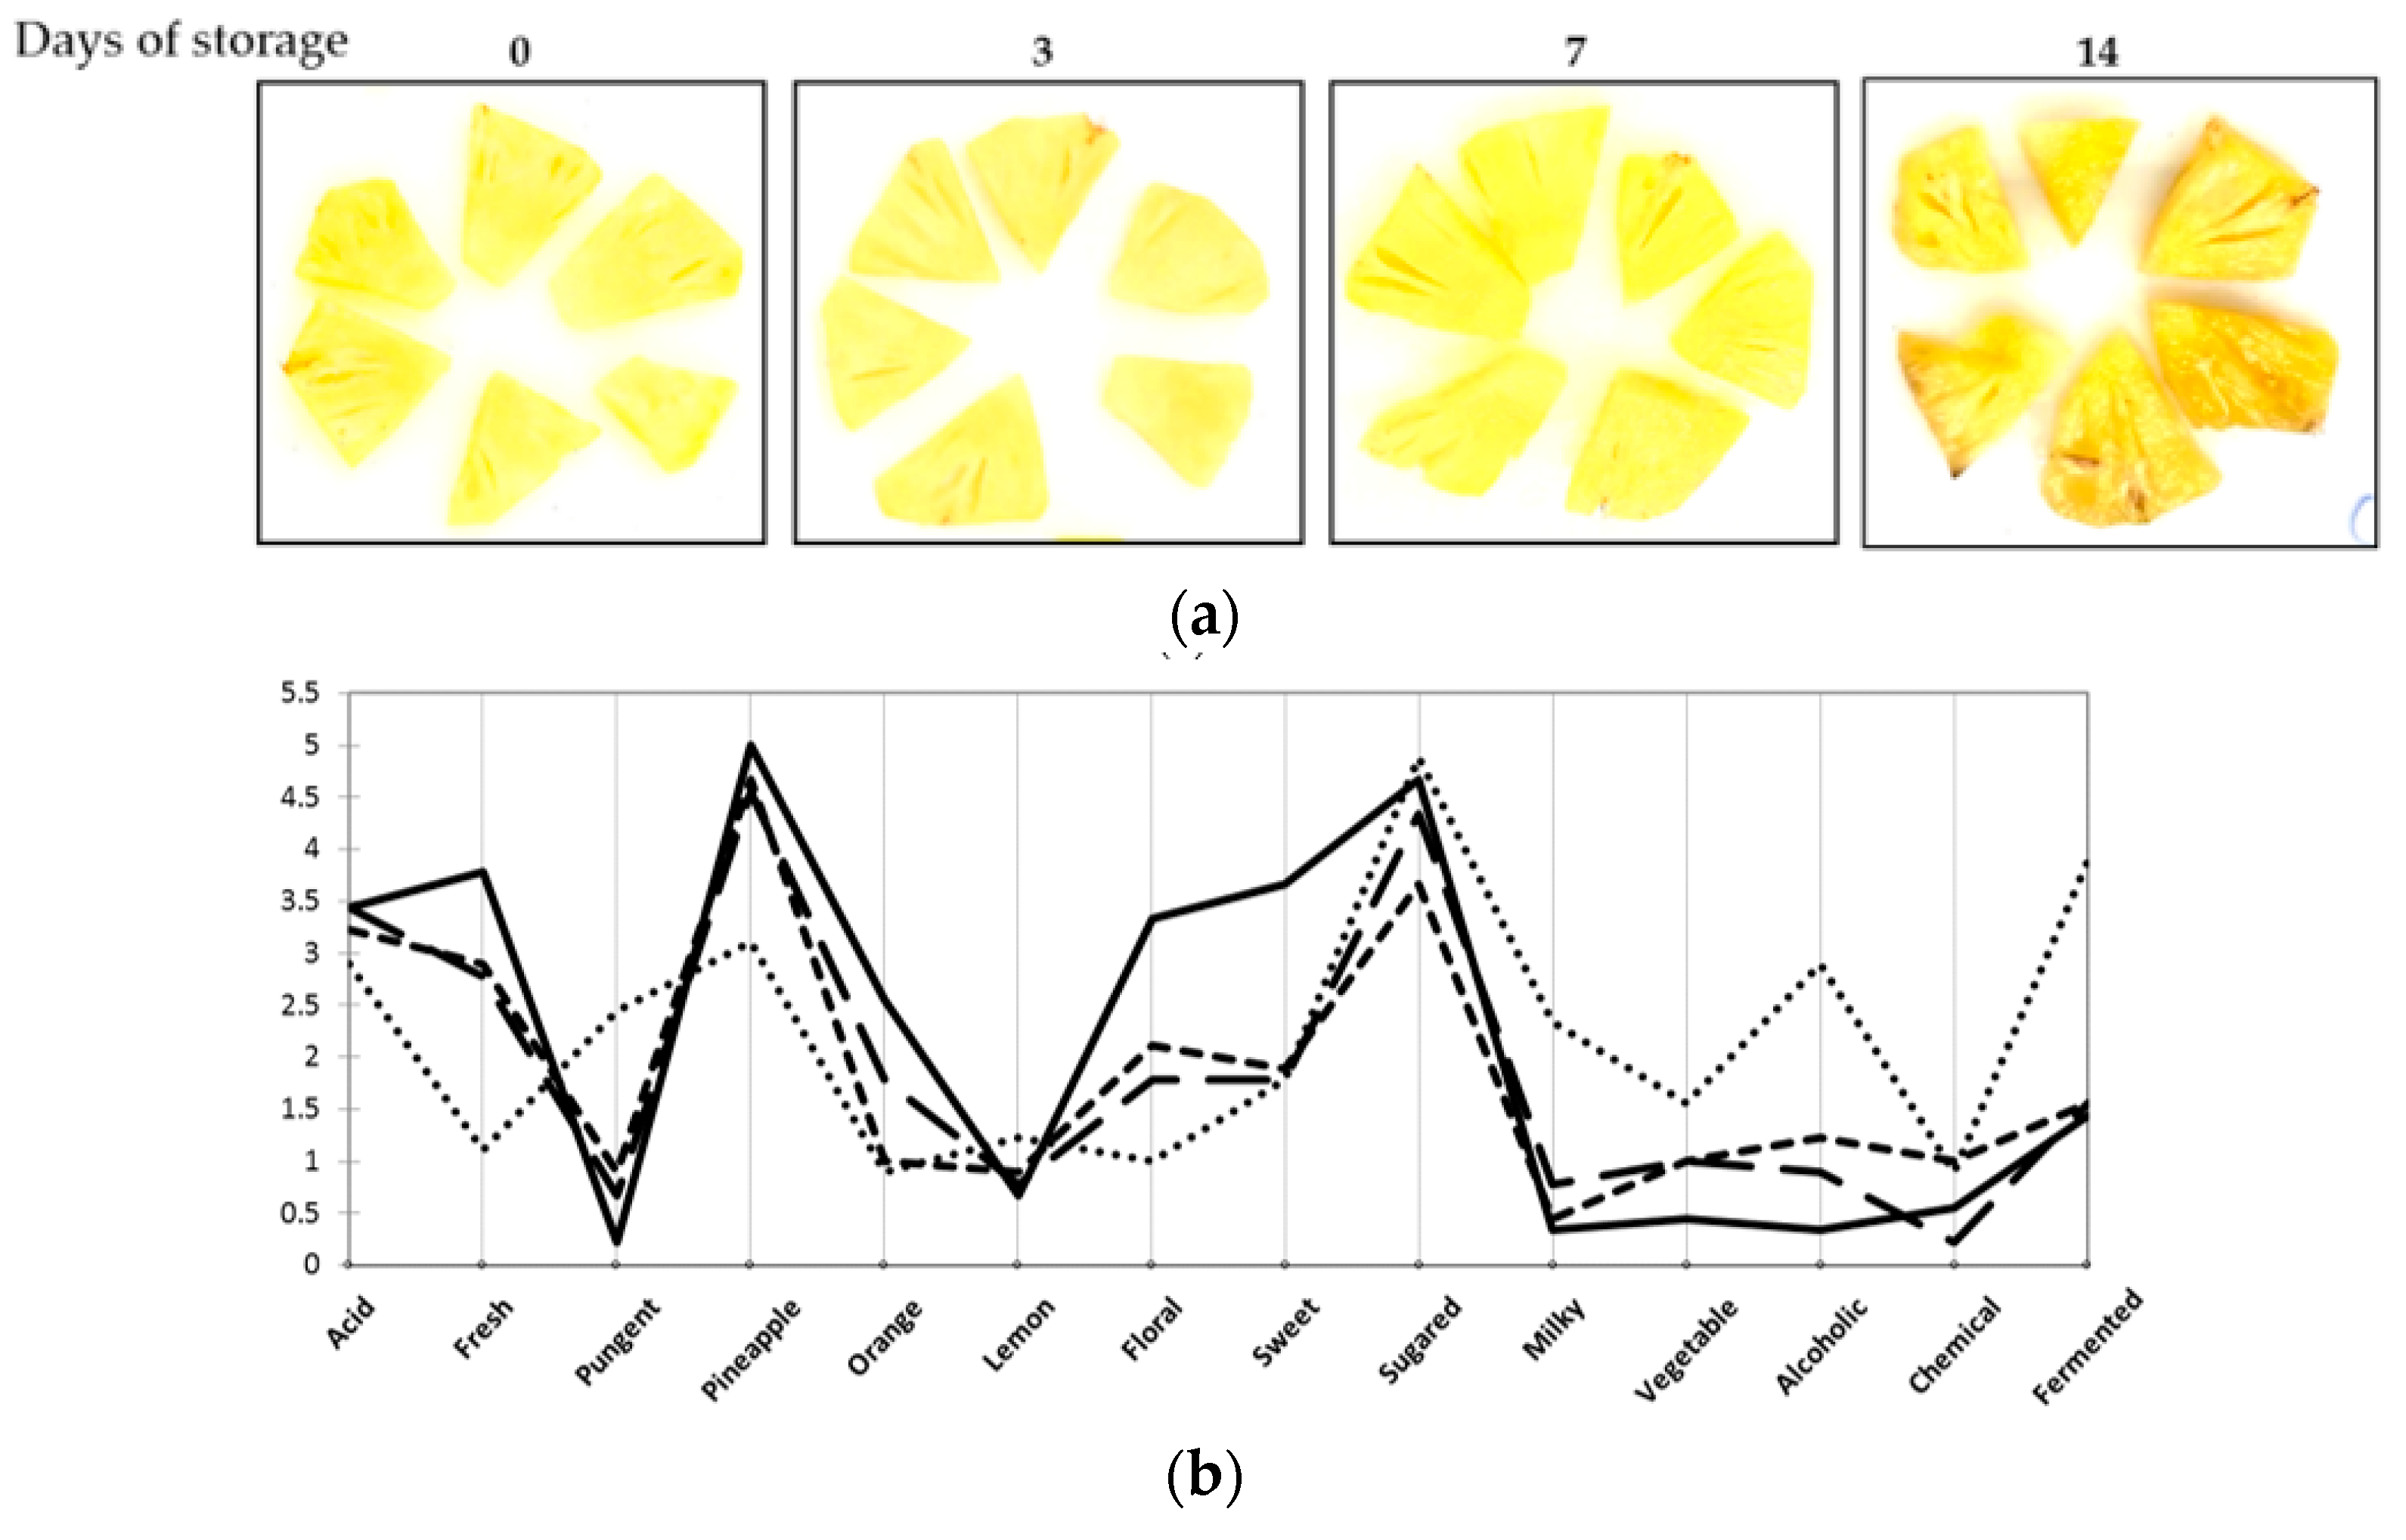
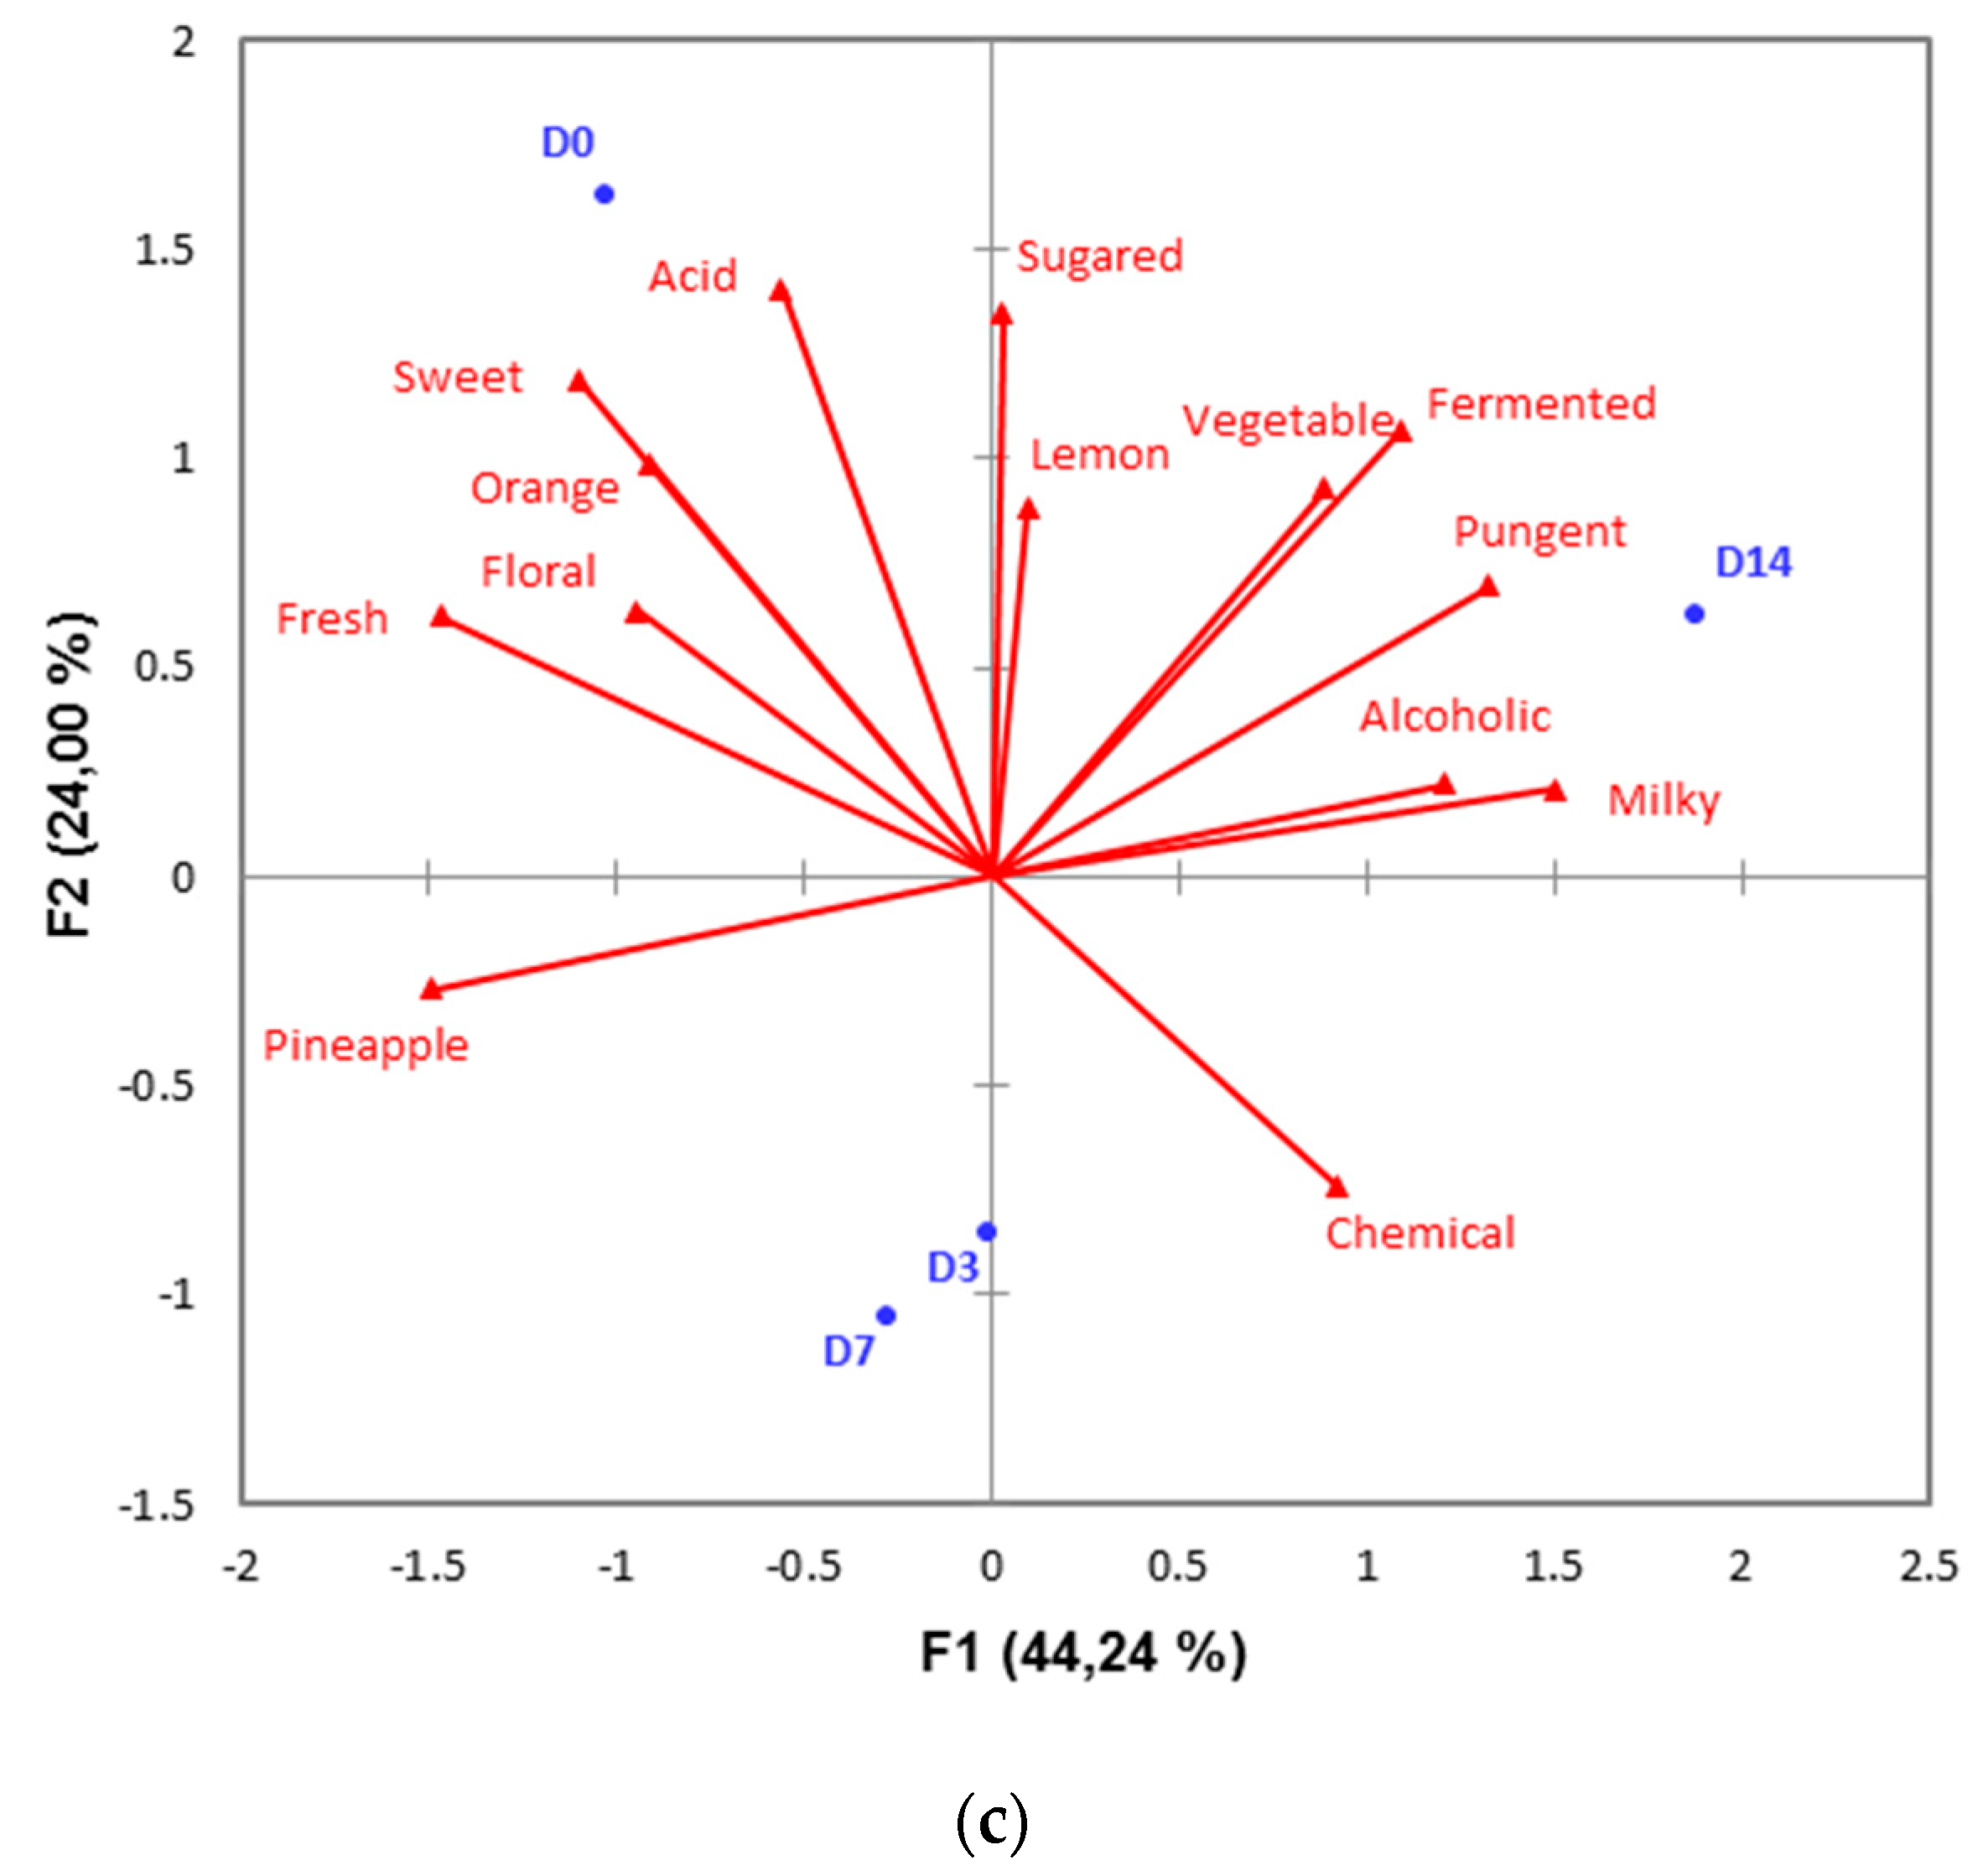
3.2. Minimally-Processed Pineapple Changes over Refrigerated Storage
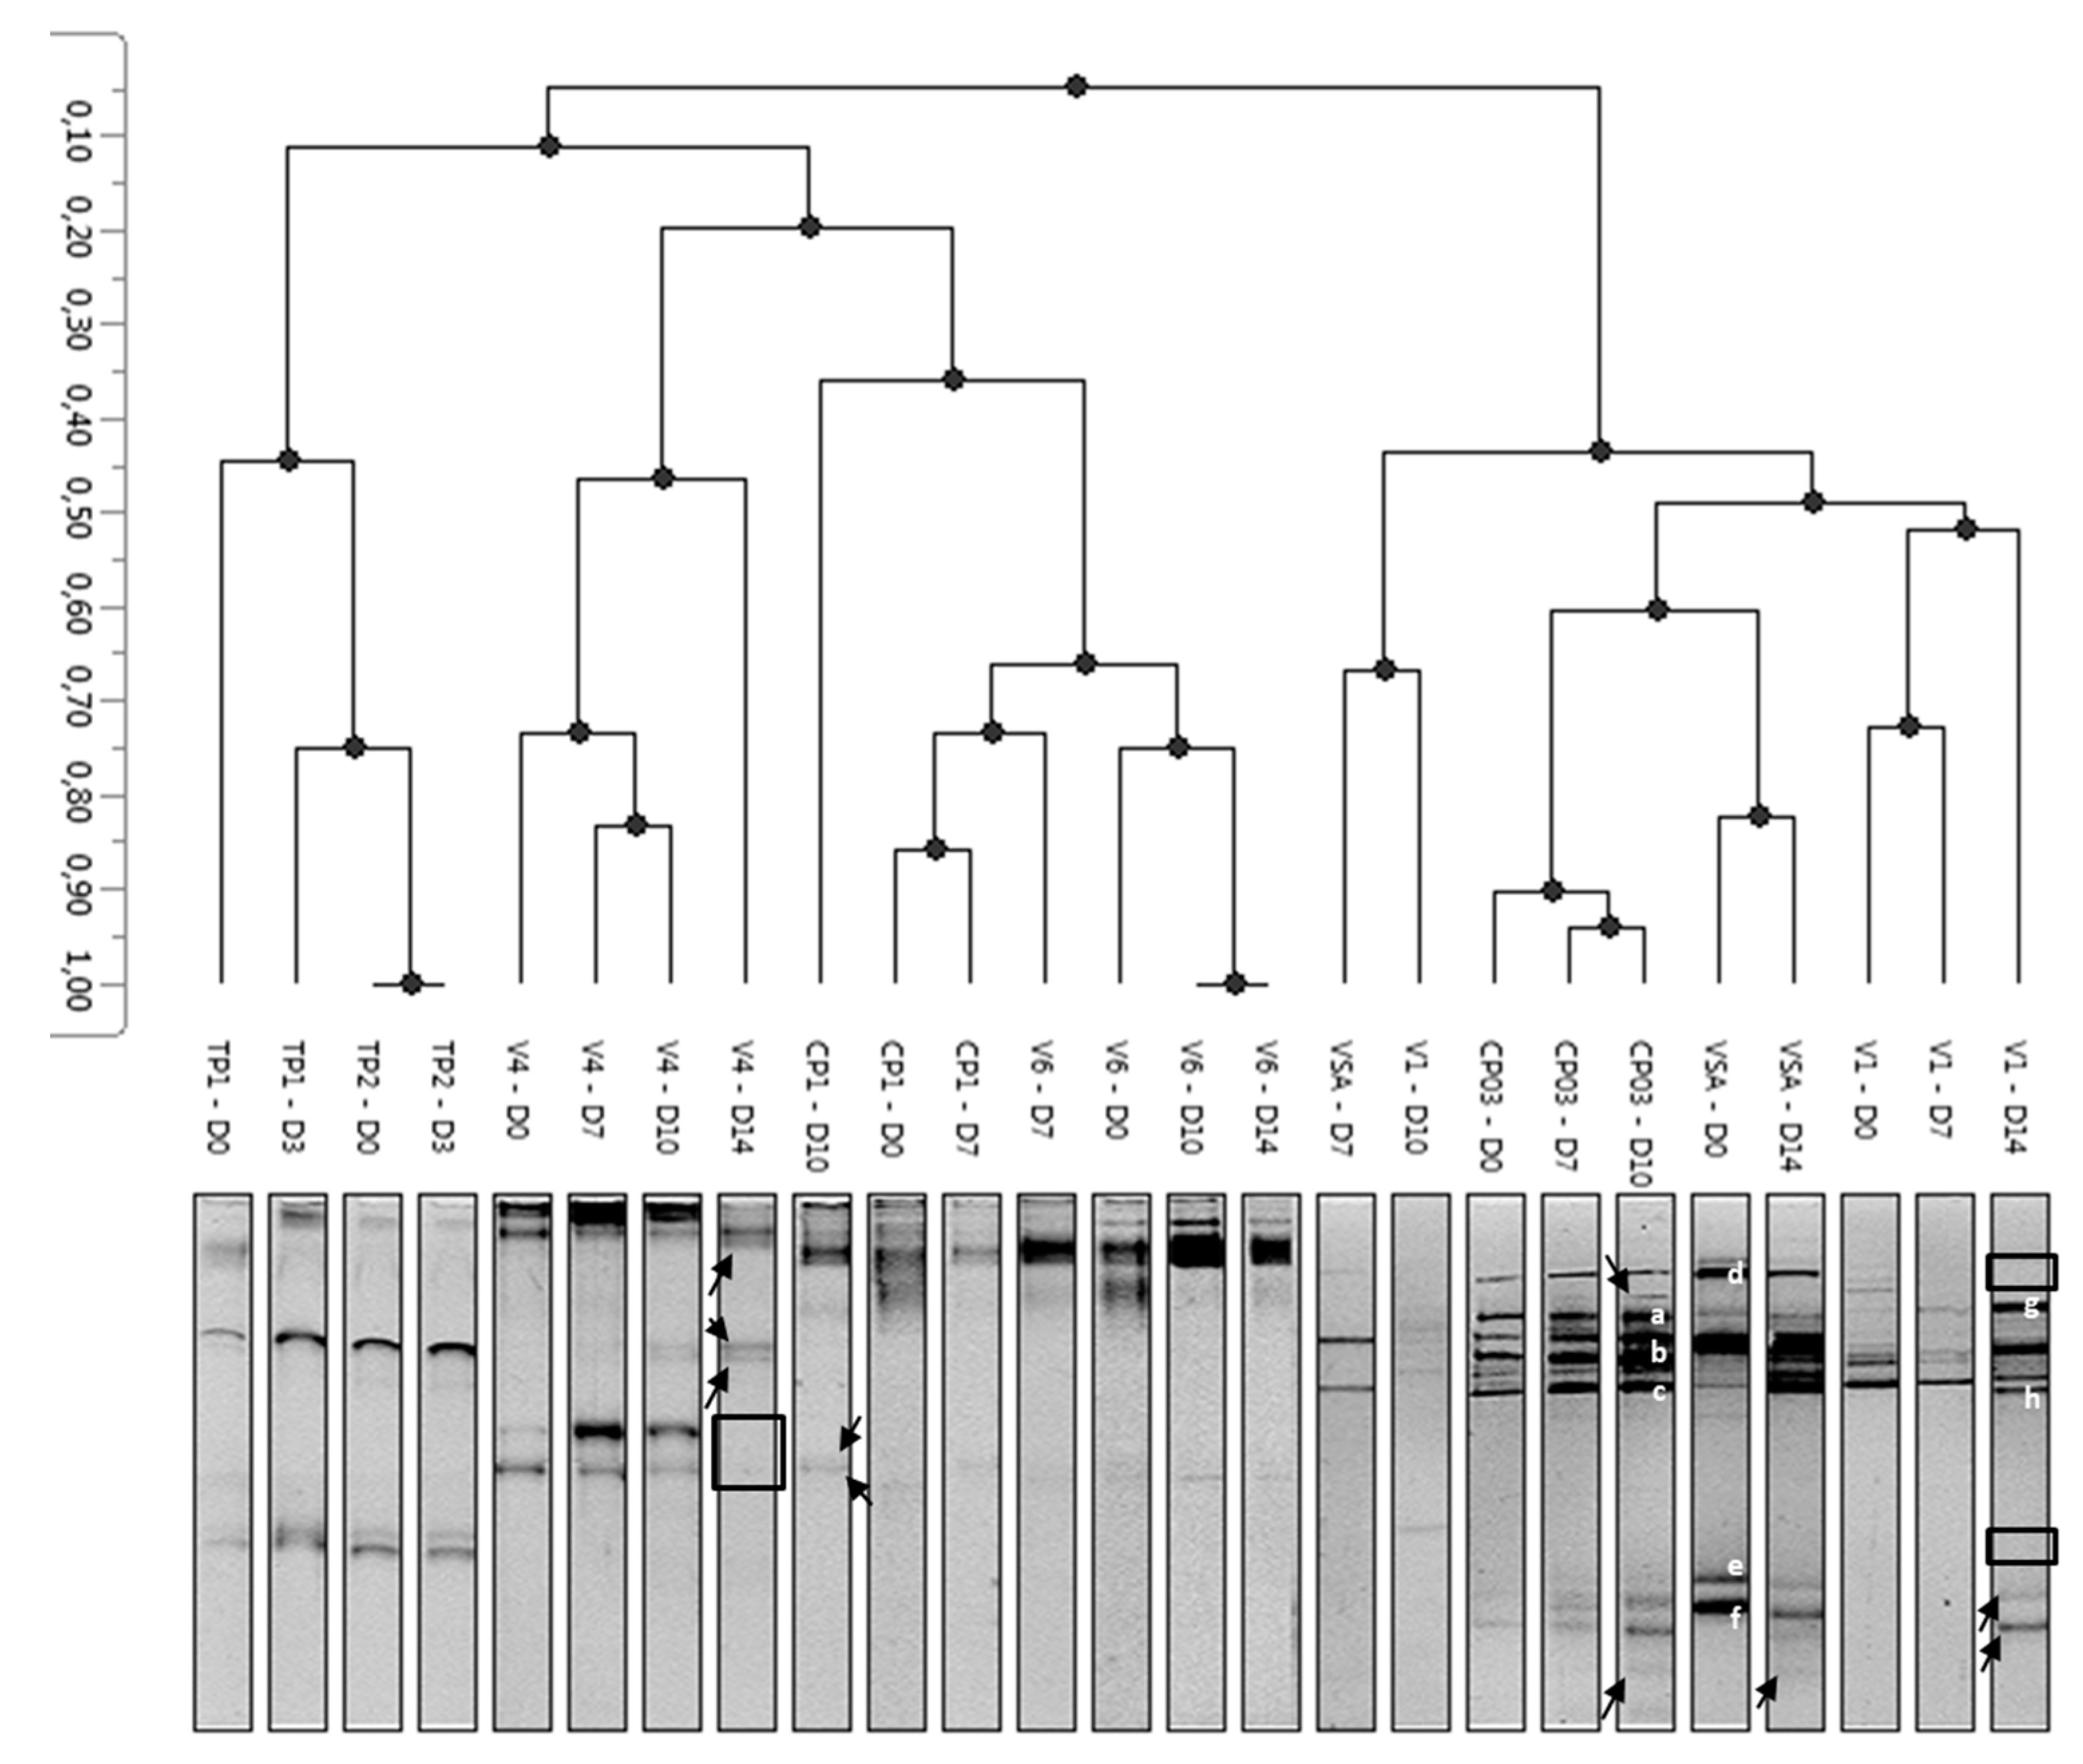
3.3. Diversity of Yeasts and Molds and Modulation during Storage
3.4. Identification of Fungal Isolates Involved in Spoilage of Minimally-Processed Pineapple
4. Conclusions
Supplementary Materials
Author Contributions
Funding
Acknowledgments
Conflicts of Interest
References
- Septembre-Malaterre, A.; Remize, F.; Poucheret, P. Fruits and vegetables, as a source of nutritional compounds and phytochemicals: Changes in bioactive compounds during lactic fermentation. Food Res. Int. 2018, 104, 86–99. [Google Scholar] [CrossRef] [PubMed]
- Sun, G.M.; Zhang, X.M.; Soler, A.; Marie-Alphonsine, P.A. Nutritional composition of pineapple (Ananas comosus (L.) Merr.). In Nutritional Composition of Fruit Cultivars; Elsevier Inc.: Amsterdam, The Netherlands, 2015; ISBN 9780124081178. [Google Scholar]
- Ragaert, P.; Verbeke, W.; Devlieghere, F.; Debevere, J. Consumer perception and choice of minimally processed vegetables and packaged fruits. Food Qual. Prefer. 2004, 15, 259–270. [Google Scholar] [CrossRef]
- Leneveu-Jenvrin, C.; Charles, F.; Barba, F.J.; Remize, F. Role of biological control agents and physical treatments in maintaining the quality of fresh and minimally-processed fruit and vegetables. Crit. Rev. Food Sci. Nutr. 2019, 24, 1–19. [Google Scholar] [CrossRef]
- Benítez, S.; Chiumenti, M.; Sepulcre, F.; Achaerandio, I.; Pujolá, M. Modeling the effect of storage temperature on the respiration rate and texture of fresh cut pineapple. J. Food Eng. 2012, 113, 527–533. [Google Scholar] [CrossRef]
- Zhang, B.-Y.; Samapundo, S.; Pothakos, V.; de Baenst, I.; Sürengil, G.; Noseda, B.; Devlieghere, F. Effect of atmospheres combining high oxygen and carbon dioxide levels on microbial spoilage and sensory quality of fresh-cut pineapple. Postharvest Biol. Technol. 2013, 86, 73–84. [Google Scholar] [CrossRef]
- Montero-Calderón, M.; Rojas-Graü, M.A.; Martín-Belloso, O. Effect of packaging conditions on quality and shelf-life of fresh-cut pineapple (Ananas comosus). Postharvest Biol. Technol. 2008, 50, 182–189. [Google Scholar] [CrossRef]
- Montero-Calderón, M.; Rojas-Graü, M.A.; Aguiló-Aguayo, I.; Soliva-Fortuny, R.; Martín-Belloso, O. Influence of modified atmosphere packaging on volatile compounds and physicochemical and antioxidant attributes of fresh-cut pineapple (Ananas comosus). J. Agr. Food Chem. 2010, 58, 5042–5049. [Google Scholar] [CrossRef]
- Jiang, Z.; Zheng, H.; Mantri, N.; Qi, Z.; Zhang, X.; Hou, Z.; Chang, J.; Lu, H.; Liang, Z. Prediction of relationship between surface area, temperature, storage time and ascorbic acid retention of fresh-cut pineapple using adaptive neuro-fuzzy inference system (ANFIS). Postharvest Biol. Technol. 2016, 113, 1–7. [Google Scholar] [CrossRef]
- Treviño-Garza, M.Z.; García, S.; Heredia, N.; Alanís-Guzmán, M.G.; Arévalo-Niño, K. Layer-by-layer edible coatings based on mucilages, pullulan and chitosan and its effect on quality and preservation of fresh-cut pineapple (Ananas comosus). Postharvest Biol. Technol. 2017, 128, 63–75. [Google Scholar] [CrossRef]
- Wu, Z.; Zhang, M.; Adhikari, B. Application of high pressure argon treatment to maintain quality of fresh-cut pineapples during cold storage. J. Food Eng. 2012, 110, 395–404. [Google Scholar] [CrossRef]
- Wu, Z.; Zhang, M.; Wang, S. Effects of high-pressure argon and nitrogen treatments on respiration, browning and antioxidant potential of minimally processed pineapples during shelf life. J. Sci. Food Agr. 2012, 92, 2250–2259. [Google Scholar] [CrossRef]
- George, D.S.; Razali, Z.; Santhirasegaram, V.; Somasundram, C. Effects of ultraviolet light (UV-C) and heat treatment on the quality of fresh-cut Chokanan mango and Josephine pineapple. J. Food Sci. 2015, 80, S426–S434. [Google Scholar] [CrossRef] [PubMed]
- Yeoh, W.K.; Ali, A. Ultrasound treatment on phenolic metabolism and antioxidant capacity of fresh-cut pineapple during cold storage. Food Chem. 2017, 216, 247–253. [Google Scholar] [CrossRef] [PubMed]
- Turazzi, F.C.; Mores, L.; Merib, J.; Carasek, E.; Narain, N.; de Lima, L.K.; Nunes, M.L. Evaluation of volatile profiles obtained for minimally-processed pineapple fruit samples during storage by headspace-solid phase microextraction gas chromatography-mass spectrometry. Food Sci. Technol. 2017, 37, 663–672. [Google Scholar] [CrossRef]
- Gardes, M.; Bruns, T.D. ITS primers with enhanced specificity for basidiomycetes - application to the identification of mycorrhizae and rusts. Mol. Ecol. 1993, 2, 113–118. [Google Scholar] [CrossRef]
- Sheffield, V.C.; Cox, D.R.; Lerman, L.S.; Myers, R.M. Attachment of a 40-base-pair G + C-rich sequence (GC-clamp) to genomic DNA fragments by the polymerase chain reaction results in improved detection of single-base changes. Proc. Nat. Acad. Sci. USA 1989, 86, 232–236. [Google Scholar] [CrossRef]
- Hamdouche, Y.; Meile, J.C.; Nganou, D.N.; Durand, N.; Teyssier, C.; Montet, D. Discrimination of post-harvest coffee processing methods by microbial ecology analyses. Food Control. 2016, 65, 112–120. [Google Scholar] [CrossRef]
- Sukporn, S.; Sirimuangmoon, C.; Kondo, S.; Setha, S. Effect of harvesting season, maturity stage and storage temperature on internal browning and postharvest quality of “Phulae” pineapple. J. Food Sci. Agr. Technol. 2019, 5, 212–219. [Google Scholar]
- Elss, S.; Preston, C.; Hertzig, C.; Heckel, F.; Richling, E.; Schreier, P. Aroma profiles of pineapple fruit (Ananas comosus [L.] Merr.) and pineapple products. LWT-Food Sci. Technol. 2005, 38, 263–274. [Google Scholar] [CrossRef]
- Dorey, E.; Fournier, P.; Léchaudel, M.; Tixier, P. Modeling sugar content of pineapple under agro-climatic conditions on Reunion Island. Eur. J. Agron. 2016, 73, 64–72. [Google Scholar] [CrossRef]
- Salinas-Hernández, R.M.; González-Aguilar, G.A.; Tiznado-Hernández, M.E. Utilization of physicochemical variables developed from changes in sensory attributes and consumer acceptability to predict the shelf life of fresh-cut mango fruit. J. Food Sci. Technol. 2015, 52, 63–77. [Google Scholar] [CrossRef] [PubMed]
- Joomwong, A. Impact of cropping season in Northern Thailand on the quality of Smooth Cayenne pineapple. II. Influence on physicochemical attributes. Int. J. Agr. Biol. 2006, 8, 329–336. [Google Scholar]
- Chen, N.J.; Paulla, R.E.; Chen, C.C.; Saradhuldhat, P. Pineapple production for quality and postharvest handling. In Proceedings of the Acta Horticulturae; International Society for Horticultural Science: Leuven, Belgium, 2009; Volume 822, pp. 253–260. [Google Scholar]
- Septembre-Malaterre, A.; Hatia, S.; Lallemand, L.; Césari, M.; Douraguia, E.; Libelle, T.; Gonthier, M.-P. Characterization of french Victoria pineapple antioxidant micronutrients and polyphenol protective effect on preadipose cells exposed to oxidative stress. Int. J. Food Nutrit. Sci. 2015, 4, 1–10. [Google Scholar]
- Zhang, B.-Y.; Samapundo, S.; Rademaker, M.; Noseda, B.; Denon, Q.; de Baenst, I.; Sürengil, G.; De Baets, B.; Devlieghere, F. Effect of initial headspace oxygen level on growth and volatile metabolite production by the specific spoilage microorganisms of fresh-cut pineapple. LWT-Food Sci. Technol. 2014, 55, 224–231. [Google Scholar] [CrossRef]
- Di Egidio, V.; Sinelli, N.; Limbo, S.; Torri, L.; Franzetti, L.; Casiraghi, E. Evaluation of shelf-life of fresh-cut pineapple using FT-NIR and FT-IR spectroscopy. Postharvest Biol. Technol. 2009, 54, 87–92. [Google Scholar] [CrossRef]
- Troyo, R.D.; Acedo, A.L. Effects of calcium ascorbate and calcium lactate on quality of fresh-cut pineapple (Ananas comosus). IJAFLS 2019, 3, 143–150. [Google Scholar]
- Antoniolli, L.R.; Benedetti, B.C.; Filho, M.D.S.M.; Garruti, D.D.S.; Borges, M.D.F. Shelf life of minimally processed pineapples treated with ascorbic and citric acids. Bragantia 2012, 71, 447–453. [Google Scholar] [CrossRef]
- González-Aguilar, G.A.; Ruiz-Cruz, S.; Cruz-Valenzuela, R.; Rodríguez-Félix, A.; Wang, C.Y. Physiological and quality changes of fresh-cut pineapple treated with antibrowning agents. LWT-Food Sci. Technol. 2004, 37, 369–376. [Google Scholar] [CrossRef]
- Tournas, V.H.; Heeres, J.; Burgess, L. Moulds and yeasts in fruit salads and fruit juices. Food Microbiol. 2006, 23, 684–688. [Google Scholar] [CrossRef]
- Almeida, E.T.d.C.; Barbosa, I.d.M.; Tavares, J.F.; Barbosa-Filho, J.M.; Magnani, M.; de Souza, E.L. Inactivation of spoilage yeasts by Mentha spicata L. and M. × villosa Huds. essential oils in cashew, guava, mango, and pineapple juices. Front. Microbiol. 2018, 9. [Google Scholar]
- Nakasone, K.K.N.; Nakasone, K.K. Reexamination of Odontia sacchari, O. saccharicola, and Corticium granulare. Karstenia 2000, 40, 111–116. [Google Scholar] [CrossRef][Green Version]
- Bensch, K.; Braun, U.; Groenewald, J.Z.; Crous, P.W. The genus Cladosporium. Stud. Mycol. 2012, 72, 1–401. [Google Scholar] [CrossRef] [PubMed]
- Beneke, E.S.; White, L.S.; Fabian, F.W. The incidence and pectolytic activity of fungi isolated from Michigan Strawberry fruits. J. Appl. Microbiol. 1954, 2, 253–258. [Google Scholar]
- Dennis, C.; Davis, R.P.; Harris, J.E. The relative importance of fungi in the breakdown of commercial samples of sulphited strawberries. J. Sci. Food Agr. 1979, 30, 959–973. [Google Scholar] [CrossRef]
- Harwig, J.; Scott, P.M.; Stoltz, D.R.; Blanchfield, B.J. Toxins of molds from decaying tomato fruit. Appl. Environ. Microbiol. 1979, 38, 267–274. [Google Scholar] [CrossRef] [PubMed]
- Wyatt, M.K.; Parish, M.E.; Widmer, W.W.; Kimbrough, J. Characterization of mould growth in orange juice. Food Microbiol. 1995, 12, 347–355. [Google Scholar] [CrossRef]
- Comtat, J. Isolation, properties, and postulated role of some of the xylanases from the basidiomycete Sporotrichum dimorphosphorum. Carbohydr. Res. 1983, 118, 215–231. [Google Scholar] [CrossRef]
- Kvesitadze, E.; Adeishvili, E.; Gomarteli, M.; Kvachadze, L.; Kvesitadze, G. Cellulase end xylanase activity of fungi in a collection isolated from the southern Caucasus. Int. Biodeter. Biodegr. 1999, 43, 189–196. [Google Scholar] [CrossRef]
- Farr, D.F.; Miller, M.E.; Bruton, B.D. Rhizopycnis vagum gen. et sp. nov., a new coelomycetous fungus from roots of melons and sugarcane. Mycologia 1998, 90, 290–296. [Google Scholar] [CrossRef]
- Porta-Puglia, A.; Pucci, N.; Di Giambattista, G.; Infantino, A. First report of Rhizopycnis vagum associated with tomato roots in Italy. Plant Dis. 2001, 85, 1210. [Google Scholar] [CrossRef]
- Armengol, J.; Vicent, A.; Martinez-Culebras, P.; Bruton, B.D.; Garcia-Jimenez, J. Identification, occurrence and pathogenicity of Rhizopycnis vagum on muskmelon in Spain. Plant Pathol. 2003, 52, 68–73. [Google Scholar] [CrossRef]
- Banjara, N.; Suhr, M.J.; Hallen-Adams, H.E. Diversity of yeast and mold species from a variety of cheese types. Curr. Microbiol. 2015, 70, 792–800. [Google Scholar] [CrossRef] [PubMed]
- Vadkertiová, R.; Molnárová, J.; Vránová, D.; Sláviková, E. Yeasts and yeast-like organisms associated with fruits and blossoms of different fruit trees. Can. J. Microbiol. 2012, 58, 1344–1352. [Google Scholar] [CrossRef] [PubMed]
- Koffi, Y.F.; Diguta, C.; Alloue-Boraud, M.; Koffi, L.B.; Dje, M.; Gherghina, E.; Matei, F. PCR-ITS-RFLP identification of pineapple spoilage fungi. Rom. Biotech. Lett. 2019, 24, 418–424. [Google Scholar] [CrossRef]
- Maciel, N.O.P.; Piló, F.B.; Freitas, L.F.D.; Gomes, F.C.O.; Johann, S.; Nardi, R.M.D.; Lachance, M.A.; Rosa, C.A. The diversity and antifungal susceptibility of the yeasts isolated from coconut water and reconstituted fruit juices in Brazil. Int. J. Food Microbiol. 2013, 160, 201–205. [Google Scholar] [CrossRef]
- Deak, T.; Beuchat, L.R. Yeasts associated with fruit juice concentrates. J. Food Protect. 1993, 56, 777–782. [Google Scholar] [CrossRef]
- Rao, R.S.; Bhadra, B.; Shivaji, S. Isolation and characterization of ethanol-producing yeasts from fruits and tree barks. Lett. Appl. Microbiol. 2008, 47, 19–24. [Google Scholar] [CrossRef]
- Restuccia, C.; Randazzo, C.; Caggia, C. Influence of packaging on spoilage yeast population in minimally processed orange slices. Int. J. Food Microbiol. 2006, 109, 146–150. [Google Scholar] [CrossRef]
- Shearer, A.E.H.; Mazzotta, A.S.; Chuyate, R.; Gombas, D.E. Heat resistance of juice spoilage microorganisms. J. Food Protect. 2002, 65, 1271–1275. [Google Scholar] [CrossRef]
- Singh, Y.P.; Sumbali, G. Preharvest mycobial population of Indian jujube fruits (Ziziphus mauritiana Lamk.) and their implications in postharvest pathogenesis. Mycopathologia 1998, 142, 77–80. [Google Scholar] [CrossRef]
- Ardhana, M. The microbial ecology of cocoa bean fermentations in Indonesia. Int. J. Food Microbiol. 2003, 86, 87–99. [Google Scholar] [CrossRef]
- Houbraken, J.A.M.P.; Frisvad, J.C.; Samson, R.A. Taxonomy of Penicillium citrinum and related species. Fungal Divers. 2010, 44, 117–133. [Google Scholar] [CrossRef]
- Enigl, D.C.; King Jnr, A.D.; Torok, T. Talaromyces trachyspermus, a heat-resistant mold isolated from fruit juice. J. Food Protect. 1993, 56, 1039–1042. [Google Scholar] [CrossRef] [PubMed]
- Snyder, A.B.; Churey, J.J.; Worobo, R.W. Association of fungal genera from spoiled processed foods with physicochemical food properties and processing conditions. Food Microbiol. 2019, 83, 211–218. [Google Scholar] [CrossRef] [PubMed]
- Aneja, K.R.; Dhiman, R.; Aggarwal, N.K.; Kumar, V.; Kaur, M. Microbes associated with freshly prepared juices of citrus and carrots. Int. J. Food Sci. 2014, 2014. [Google Scholar] [CrossRef] [PubMed]
- Wang, H.; Hu, Z.; Long, F.; Guo, C.; Niu, C.; Yuan, Y.; Yue, T. The effects of stress factors on the growth of spoilage yeasts isolated from apple-related environments in apple juice. J. Food Saf. 2016, 36, 162–171. [Google Scholar] [CrossRef]
- Kurtzman, C.P. Chapter 47 - Meyerozyma Kurtzman & M. Suzuki (2010). In The Yeasts, 5th ed.; Kurtzman, C.P., Fell, J.W., Boekhout, T., Eds.; Elsevier: London, UK, 2011; pp. 621–624. ISBN 978-0-444-52149-1. [Google Scholar]


| Samples | Location | Date |
|---|---|---|
| V0 | East | October 2017 (summer) |
| CP1 | East | March 2018 (summer) |
| VSA | East | May 2018 (winter) |
| CP3 | East | June 2018 (winter) |
| VSA2 | East | June 2018 (winter) |
| VET | East | July 2018 (winter) |
| VRO | East | July 2018 (winter) |
| VGA | East | July 2018 (winter) |
| CP01 | West | October 2017 (summer) |
| CP02 | West | October 2017 (summer) |
| V3 | West | March 2018 (summer) |
| CP2 | West | April 2018 (winter) |
| V5 | West | April 2018 (winter) |
| VSL | West | May 2018 (winter) |
| V7 | West | May 2018 (winter) |
| VSL2 | West | June 2018 (winter) |
| CP03 | North | December 2017 (summer) |
| BP | South | March 2018 (summer) |
| V1 | South | March 2018 (summer) |
| V2 | South | March 2018 (summer) |
| V4 | South | April 2018 (winter) |
| V6 | South | May 2018 (winter) |
| TP1 | Any | January 2019 (summer) |
| TP2 | Any | February 2019 (summer) |
| TP3 | Any | May 2019 (winter) |
| Name | Identification | Sampling Source | Fragment (pb) | Identity (%) | E-Value | Accession Number |
|---|---|---|---|---|---|---|
| R | Penicillium citrinum | VSL-D14 | 339 | 98 | 6.0 × 10−134 | MN046972.1 |
| S | Penicillium citrinum | VSA-D14 | 426 | 100 | 0.0 | MN653150.1 |
| A | Rhodotorula mucilaginosa | CP1-D7 | 234 | 100 | 2.0 × 10−117 | MN535021.1 |
| C | Saccharomyces cerevisiae | BP-D3 | 507 | 99 | 1.0 × 10−161 | MN244399.1 |
| D | Meyerozyma caribbica | V2-D7 | 330 | 100 | 1.0 × 10−170 | MN658754.1 |
| F | Meyerozyma caribbica | VSL-D3 | 268 | 99 | 6.0 × 10−133 | MN658754.1 |
| H | Meyerozyma caribbica | CP1-D3 | 320 | 100 | 4.0 × 10−165 | MN416286.1 |
| I | Meyerozyma caribbica | BP-D3 | 274 | 100 | 1.0 × 10−139 | MN658754.1 |
| 20 | Talaromyces amestolkiae | TP1-D3 | 159 | 95.6 | 4.0 × 10−64 | MN549518.1 |
| Parameter | Mean | ± | Standard Deviation | Minimum Value | Maximum Value |
|---|---|---|---|---|---|
| pH | 3.44 | ± | 0.27 | 3.09 | 4.20 |
| TA (g/100 mL) | 0.87 | ± | 0.20 | 0.68 | 1.33 |
| TSS (°Brix) | 14.6 | ± | 1.5 | 11.1 | 17.8 |
| L* | 36.7 | ± | 6.6 | 32.1 | 65.3 |
| a* | 10.3 | ± | 2.1 | 6.3 | 13.3 |
| b* | 50.4 | ± | 5.7 | 38.8 | 59.7 |
| Chroma | 51.5 | ± | 5.6 | 39.6 | 60.2 |
| Hue angle | 11.6 | ± | 2.5 | 6.3 | 15.3 |
| Firmness (N) | 3.8 | ± | 1.2 | 2.0 | 6.7 |
| Psychrotrophic bacteria (log CFU/g) | 3.7 | ± | 0.6 | 3.3 1 | 5.4 |
| Enterobacteria (log CFU/g) | 3.8 | ± | 0.6 | 3.0 2 | 5.3 |
| Yeasts & Molds (log CFU/g) | 4.4 | ± | 0.7 | 3.0 | 5.8 |
| Days of storage | 0 | 3 | 7 | 10 | 14 |
| Number of samples | 25 | 25 | 22 | 22 | 13 |
| Microbial counts in log CF/g: mean (minimum value; maximum value] | |||||
| Psychrotrophic bacteria | 3.7 [3.3; 5.4] | 3.7 [3.3; 5.1] | 3.6 [3.3; 6.3] | 3.9 [3.3; 6.9] | 3.7 [3.3; 5.3] |
| Enterobacteria | 3.9 [3.0; 5.3] | 3.9 [3.0; 6.1] | 3.9 [3.0; 6.1] | 4.2 [3.0; 7.0] | 4.5 [3.0; 7.8] |
| Yeasts and molds | 4.4 [3.0; 5.6] A | 4.9 [3.5; 6.0] AB | 5.1 [3.3;7.4] B | 5.5 [4.0; 7.6] BC | 6.0 [5.0; 7.9] C |
| Band | Origin | Identification | %Identity | E-Value |
|---|---|---|---|---|
| a | CP03–D10 | Resinicium saccharicola | 98 | 0 |
| b | CP03–D10 | Cladosporium sphaerospermum | 96.1 | 0 |
| c | CP03–D10 | Cladosporium cladosporioides | 93.9 | 4.0 × 10−143 |
| d | VSA–D0 | Disporotrichum dimorphosporum | 85 | 6.0 × 10⁻⁸ |
| e | VSA–D0 | Galactomyces candidus | 98.8 | 4.0 × 10−163 |
| f | VSA–D0 | Clavispora lusitaniae | 96.4 | 3.0 × 10−137 |
| g | V1–D14 | Rhizopycnis vagum | 95.7 | 4.0 × 10−146 |
| h | V1–D14 | Rhodotorula glutinis | 99 | 2.0 × 10−86 |
| Parameter | Control—D0 | Control—D7 | Treated—D7 |
|---|---|---|---|
| pH | 3.6 ± 0.1 A | 3.6 ± 0.1 A | 3.5 ± 0.1 A |
| TA (g/100 mL) | 6.1 ± 0.1 B | 5.4 ± 0.2 A | 6.6 ± 0.2 C |
| TSS (°Brix) | 17.1 ± 0.4 A | 17.5 ± 0.5 A | 16.0 ± 0.2 A |
| L* | 39.5 ± 0.4 | 39.2 ± 0.8 b | 34.6 ± 0.4 b |
| a* | 10.1 ± 0.3 A | 10.7 ± 0.4 A | 14.2 ± 0.6 B |
| b* | 64.8 ± 0.7 | 64.0 ± 1.4 b | 58.0 ± 0.5 a |
| Chroma | 65.6 ± 0.7 | 64.9 ± 1.3 b | 59.8 ± 0.5 a |
| Hue angle | 8.8 ± 0.3 A | 9.5 ± 0.5 A | 13.8 ± 0.6 B |
| Color difference | - * | 1.2 ± 1.1 b | 9.4 ± 1.4 a |
| Yeasts & Molds (log CFU/g) | 4.8 ± 0.2 A | 6.1 ± 0.1 AB | 10.0 ± 0.1 B |
© 2020 by the authors. Licensee MDPI, Basel, Switzerland. This article is an open access article distributed under the terms and conditions of the Creative Commons Attribution (CC BY) license (http://creativecommons.org/licenses/by/4.0/).
Share and Cite
Leneveu-Jenvrin, C.; Quentin, B.; Assemat, S.; Hoarau, M.; Meile, J.-C.; Remize, F. Changes of Quality of Minimally-Processed Pineapple (Ananas comosus, var. ‘Queen Victoria’) during Cold Storage: Fungi in the Leading Role. Microorganisms 2020, 8, 185. https://doi.org/10.3390/microorganisms8020185
Leneveu-Jenvrin C, Quentin B, Assemat S, Hoarau M, Meile J-C, Remize F. Changes of Quality of Minimally-Processed Pineapple (Ananas comosus, var. ‘Queen Victoria’) during Cold Storage: Fungi in the Leading Role. Microorganisms. 2020; 8(2):185. https://doi.org/10.3390/microorganisms8020185
Chicago/Turabian StyleLeneveu-Jenvrin, Charlène, Baptiste Quentin, Sophie Assemat, Mathilde Hoarau, Jean-Christophe Meile, and Fabienne Remize. 2020. "Changes of Quality of Minimally-Processed Pineapple (Ananas comosus, var. ‘Queen Victoria’) during Cold Storage: Fungi in the Leading Role" Microorganisms 8, no. 2: 185. https://doi.org/10.3390/microorganisms8020185
APA StyleLeneveu-Jenvrin, C., Quentin, B., Assemat, S., Hoarau, M., Meile, J.-C., & Remize, F. (2020). Changes of Quality of Minimally-Processed Pineapple (Ananas comosus, var. ‘Queen Victoria’) during Cold Storage: Fungi in the Leading Role. Microorganisms, 8(2), 185. https://doi.org/10.3390/microorganisms8020185