Evolutionary Engineering of an Iron-Resistant Saccharomyces cerevisiae Mutant and Its Physiological and Molecular Characterization


Abstract
:
1. Introduction
2. Materials and Methods
2.1. Strain, Media, Cultivation Conditions, Stress Factors
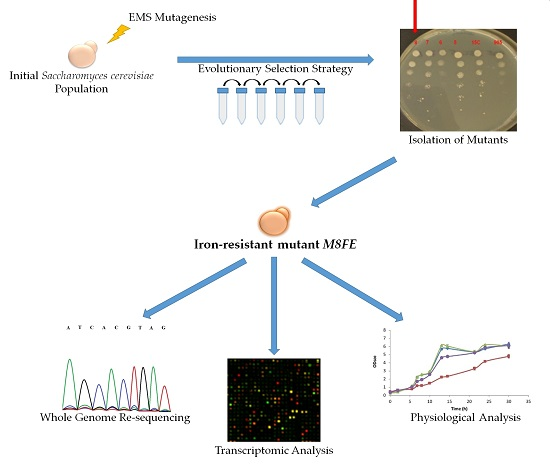
2.2. Evolutionary Engineering Protocol
2.3. Cross-Resistance Determination
2.3.1. Most Probable Number (MPN) Method
2.3.2. Spot Assays
2.4. Physiological Analysis
2.4.1. Determination of Cellular Iron and Cobalt Contents
2.4.2. Extracellular Metabolite (Glucose, Ethanol, Acetate, Glycerol) Determination
2.4.3. Reserve Carbohydrate (Glycogen, Trehalose) Determination
2.4.4. Oxidative Level Determination
Determination of the Intracellular ROS Amounts by Fluorescent Intensity Measurements
Lipid Peroxidation Assay
2.4.5. Lyticase Susceptibility Assay
2.5. Transcriptomic Analysis
2.5.1. One Colour DNA-Microarray Analysis
2.5.2. Microarray Validation by Quantitative RT-PCR (qRT-PCR) Analysis
2.6. Whole Genome Re-Sequencing
3. Results
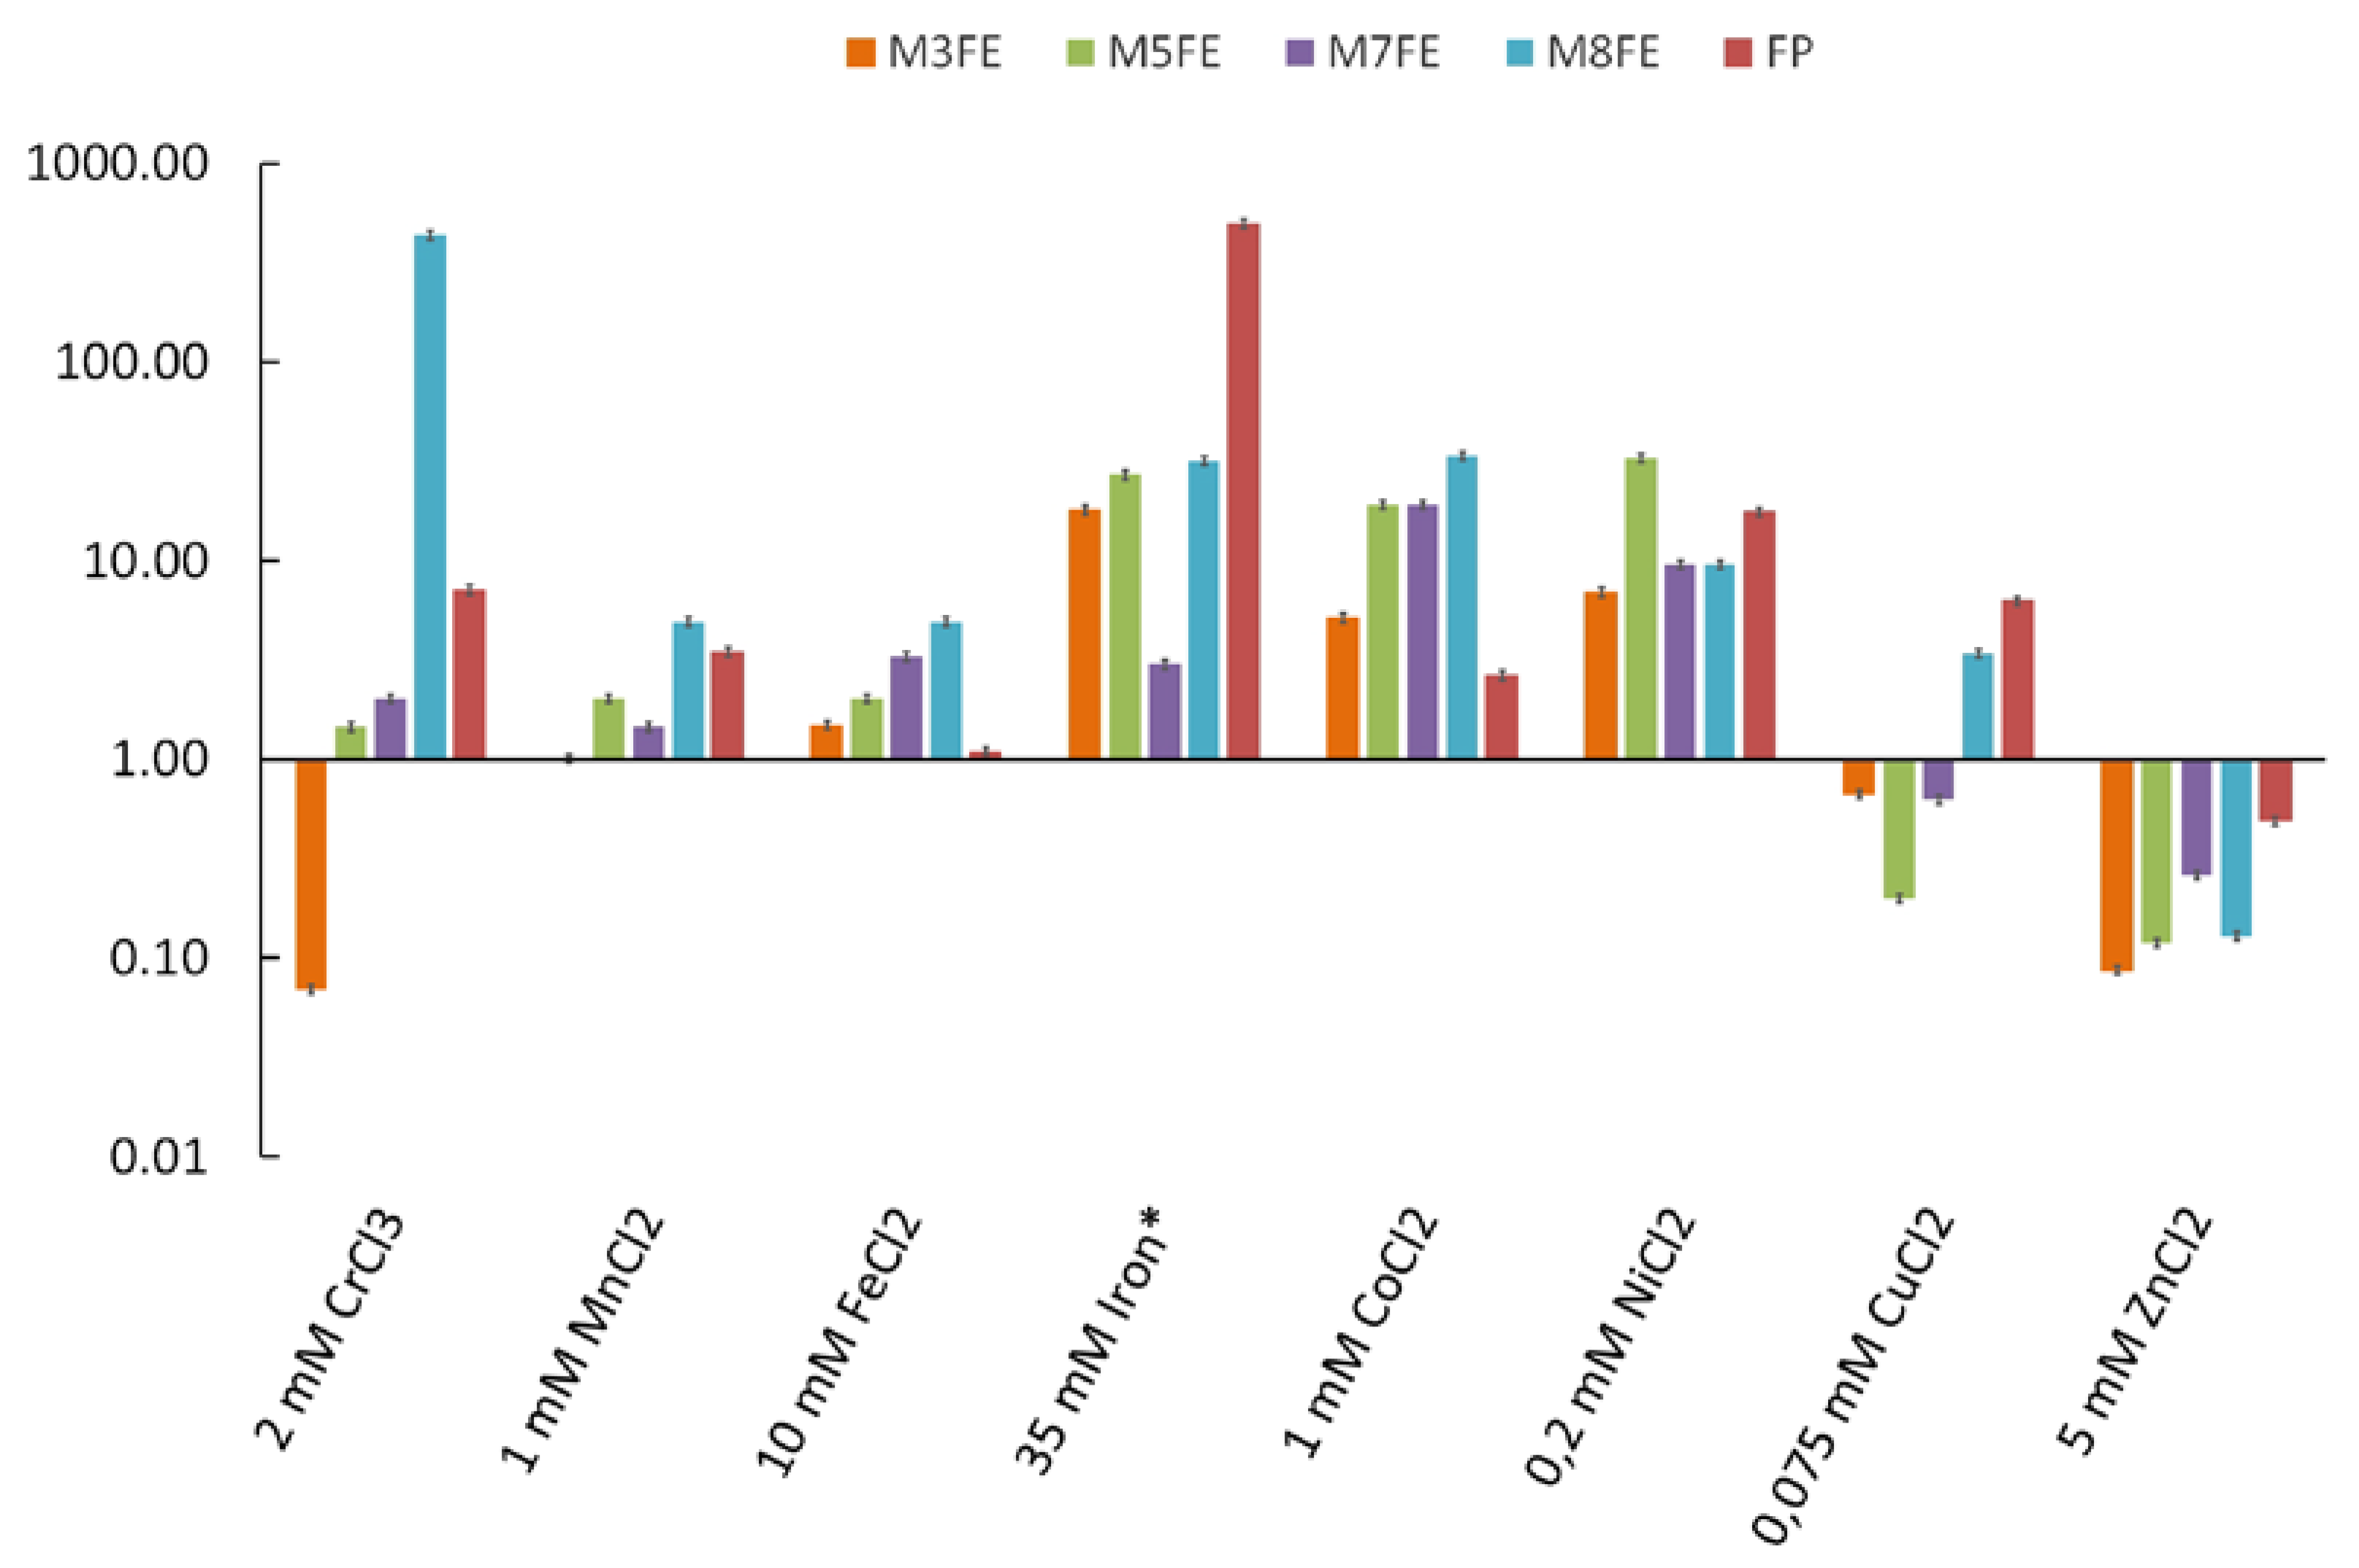
3.1. Iron Resistance and Cross-Resistance of the Evolved Mutants to Other Transition Metals
3.1.1. Selection of the Evolved Mutants from the Final Population and Their Metal-Stress Resistance Determination Using the MPN Method
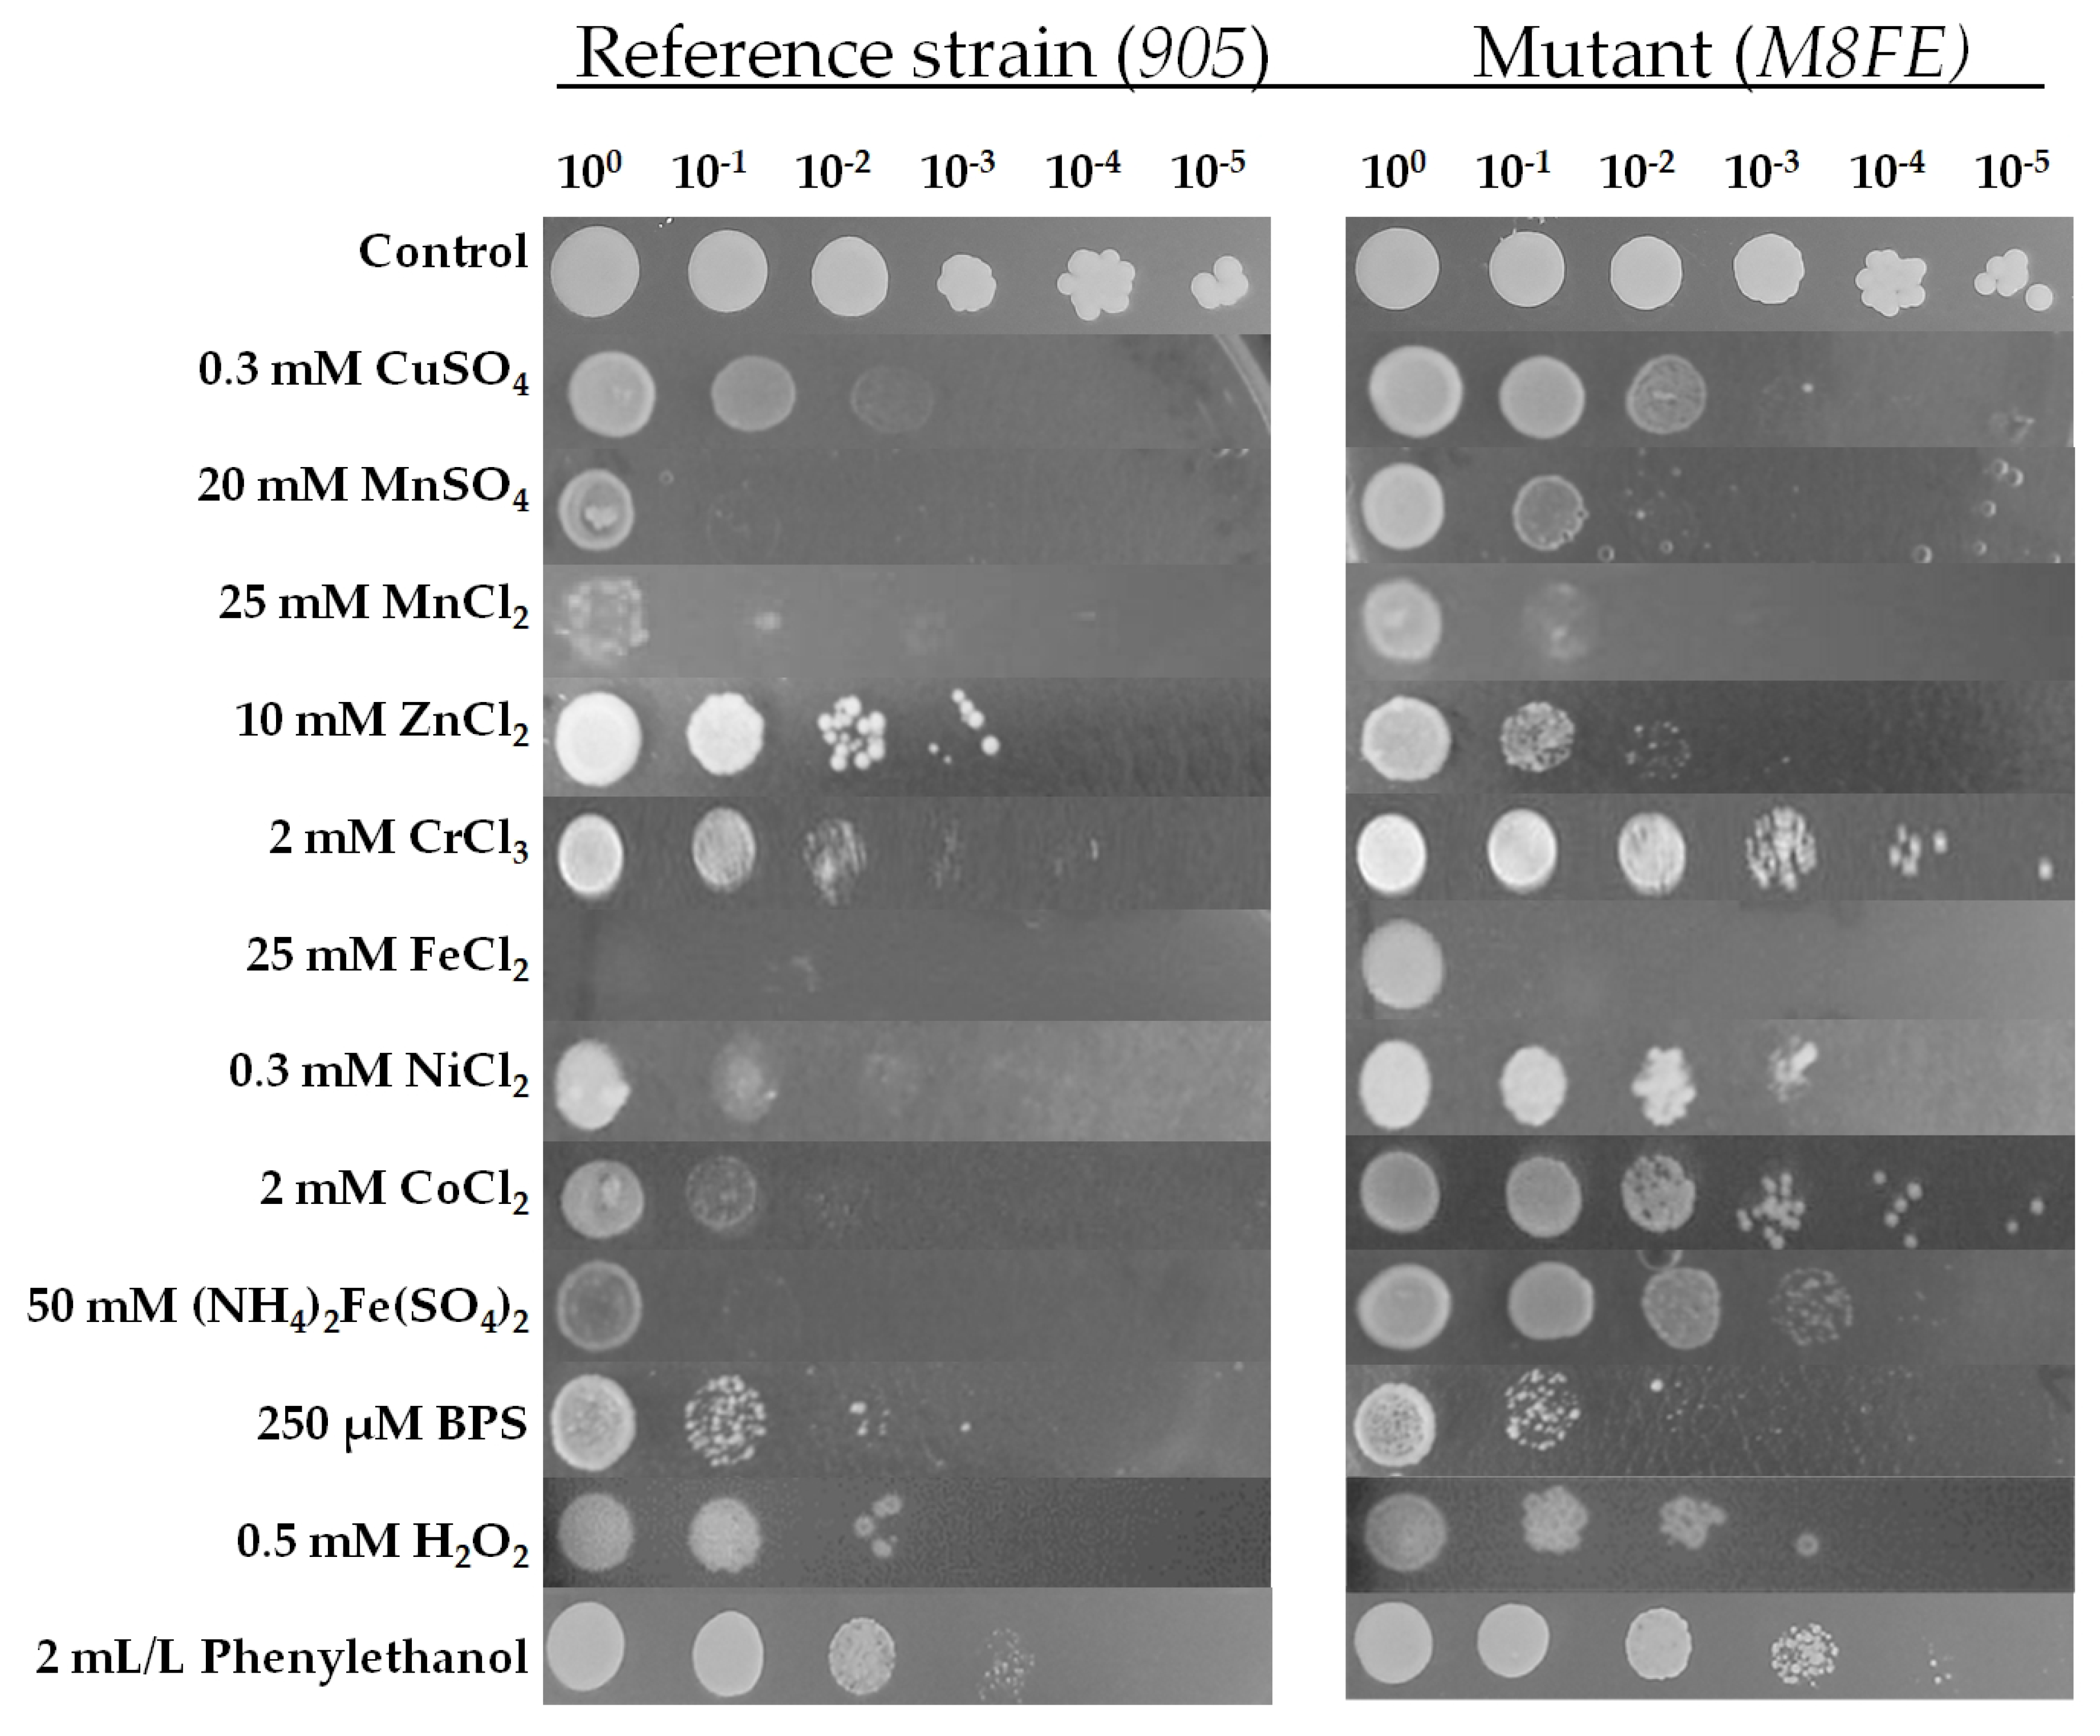
3.1.2. Determination of Cross-Resistance to Metal and Non-Metal Stresses by Spot Assay
3.2. Physiological Analysis
3.2.1. Iron and Cobalt Contents Determined by Flame–Atomic Absorption Spectrometry (F-AAS) Measurements
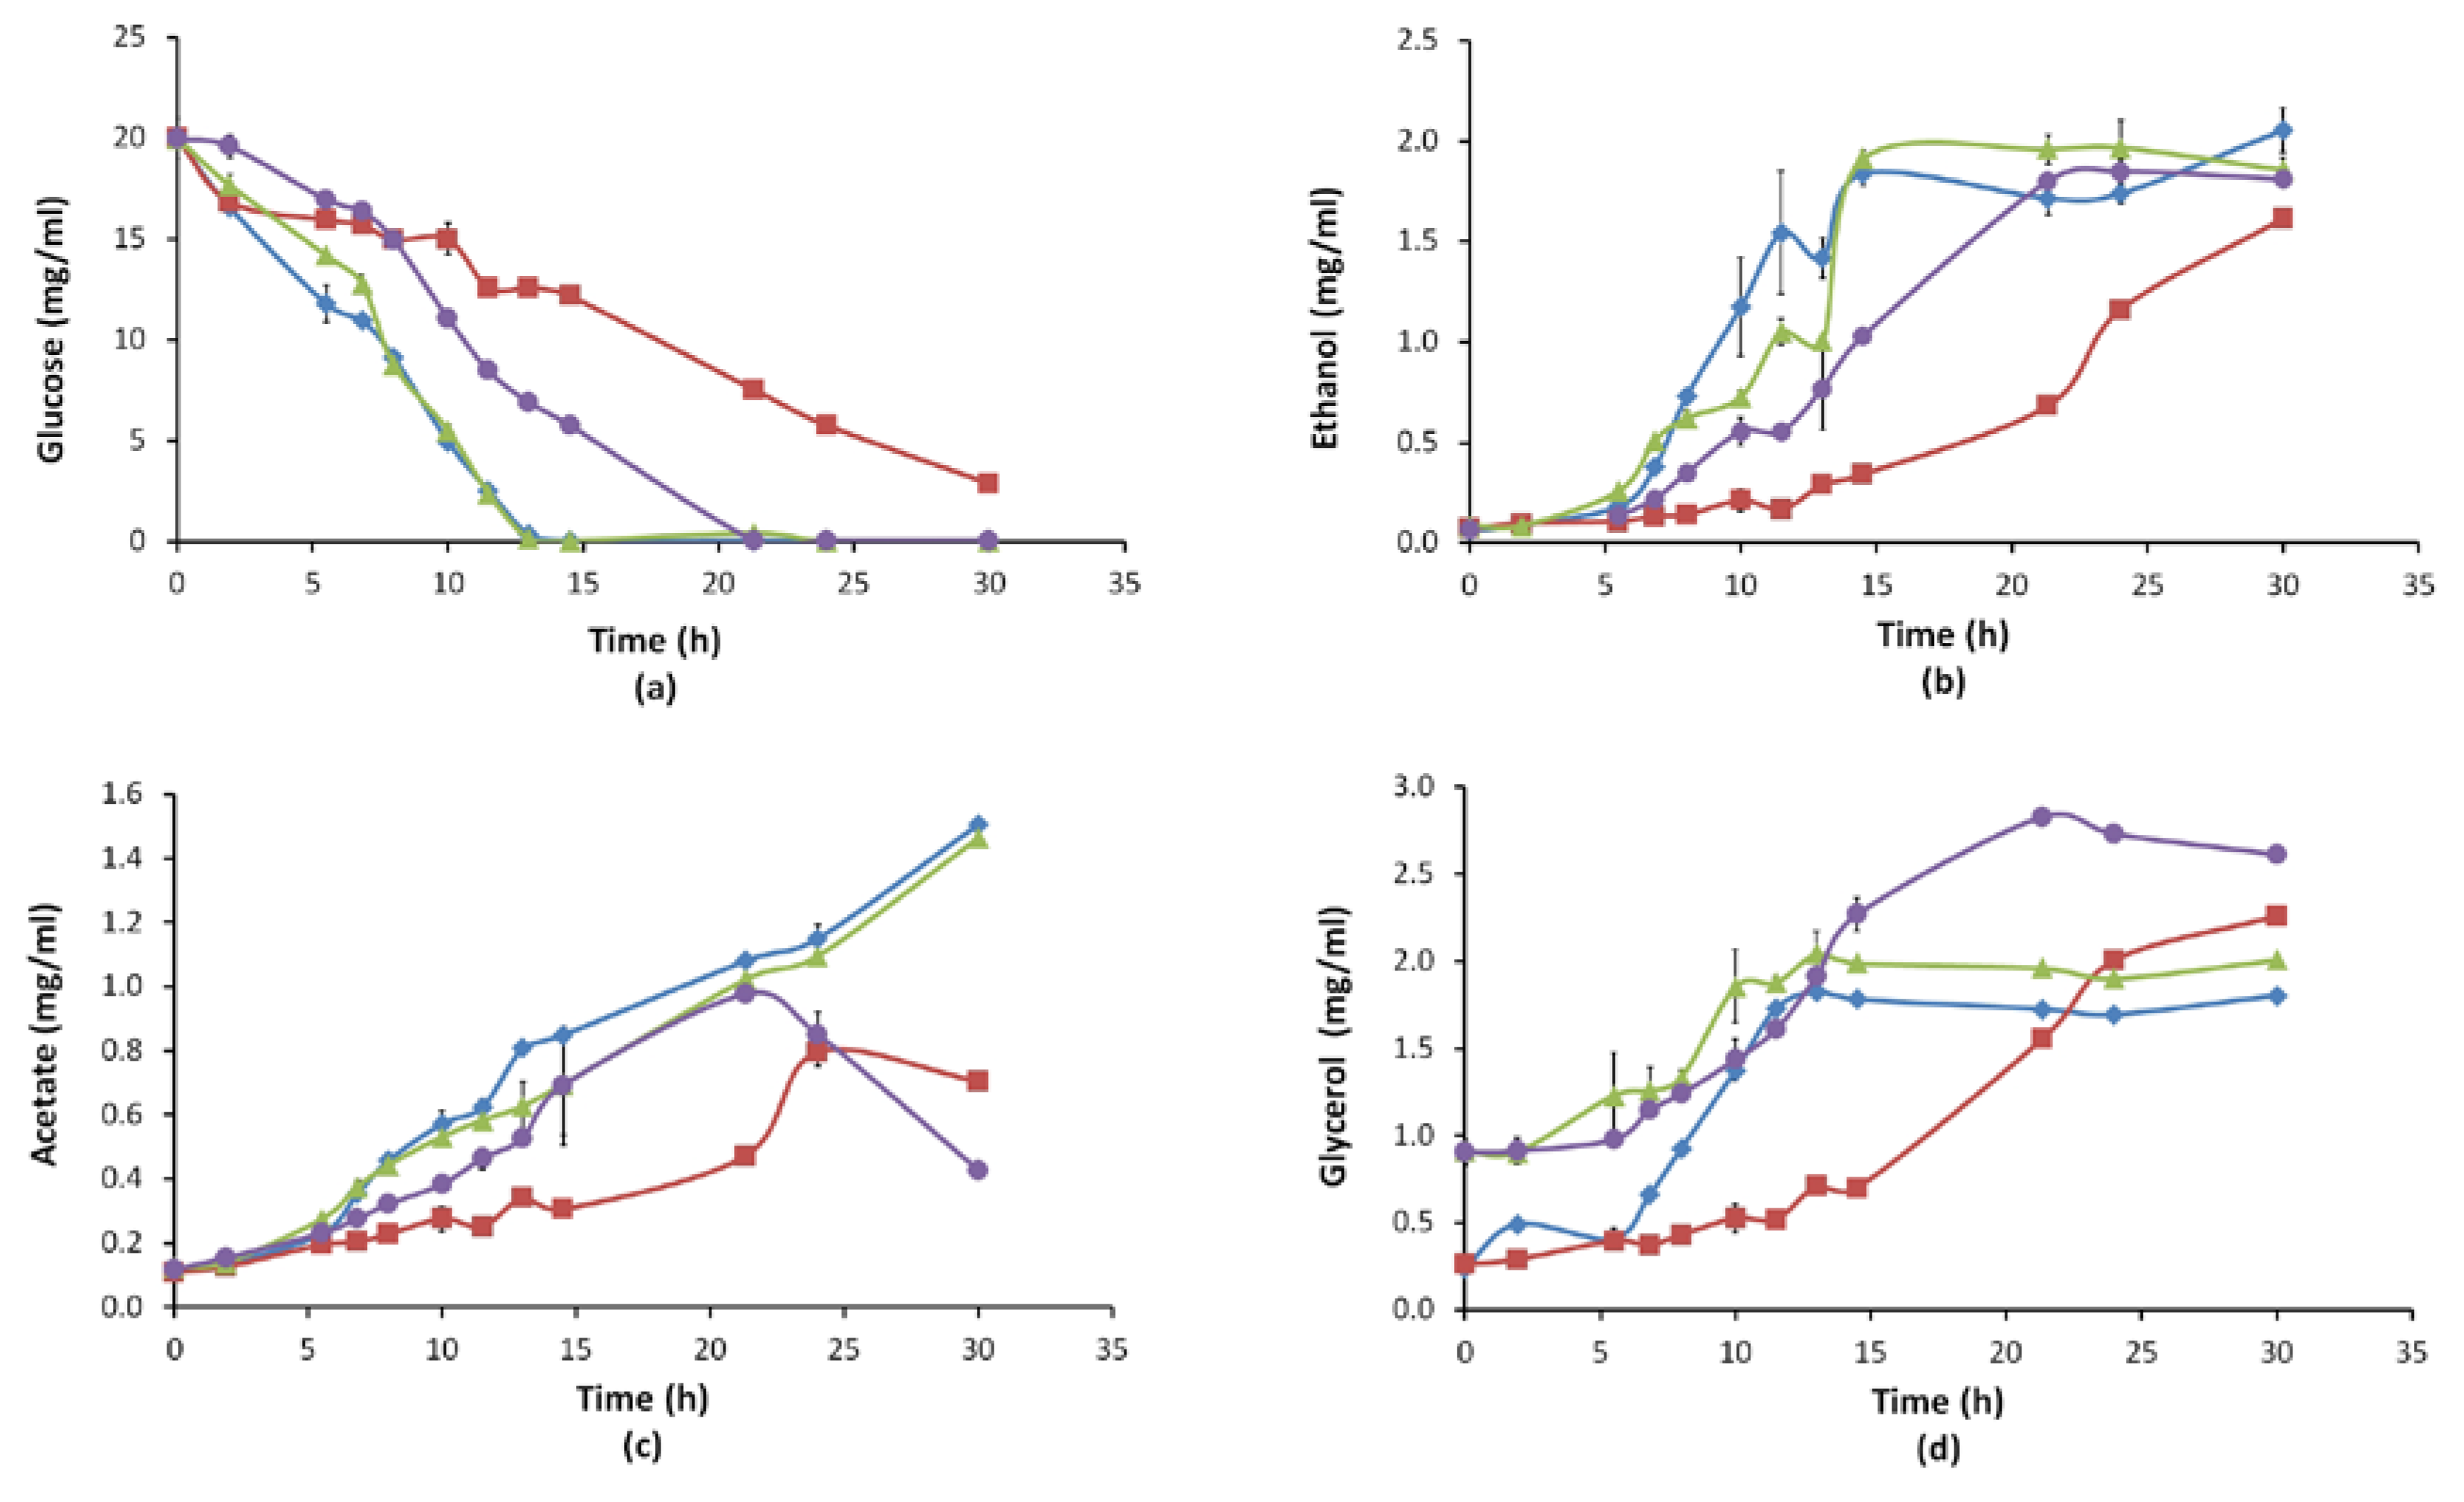
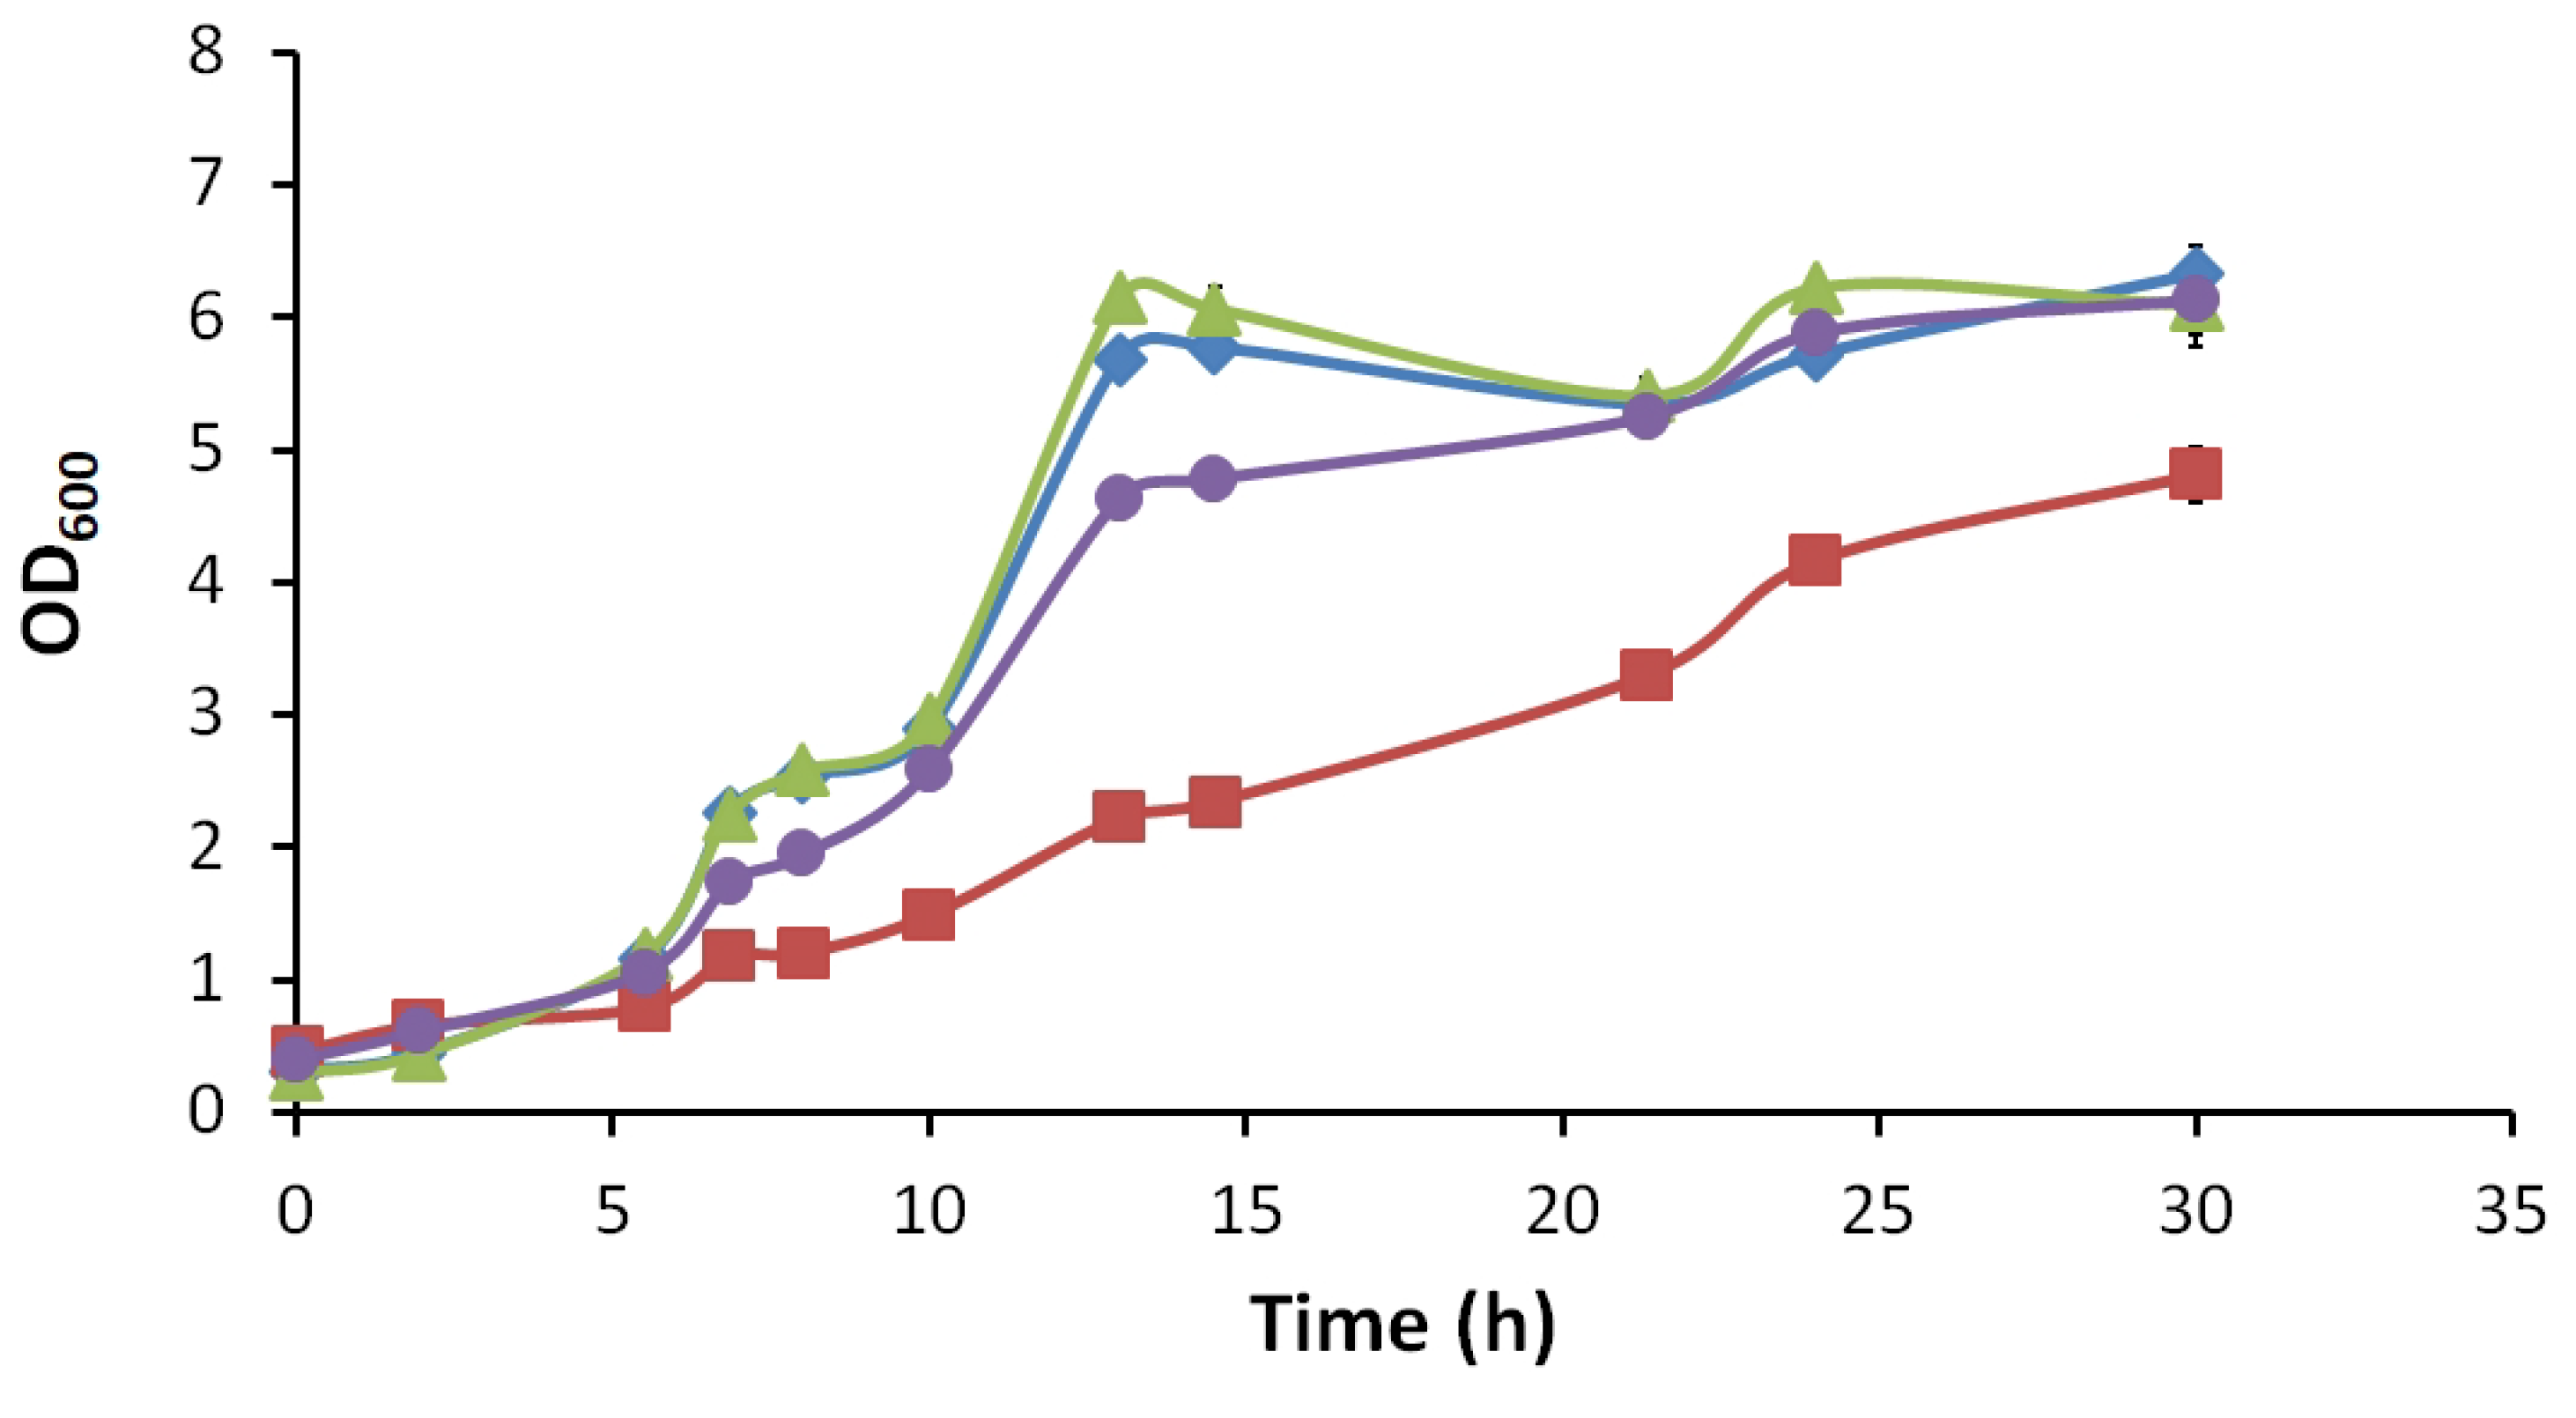
3.2.2. Growth Behaviour and Extracellular Metabolite Profiles (Glucose, Ethanol, Acetate, Glycerol)
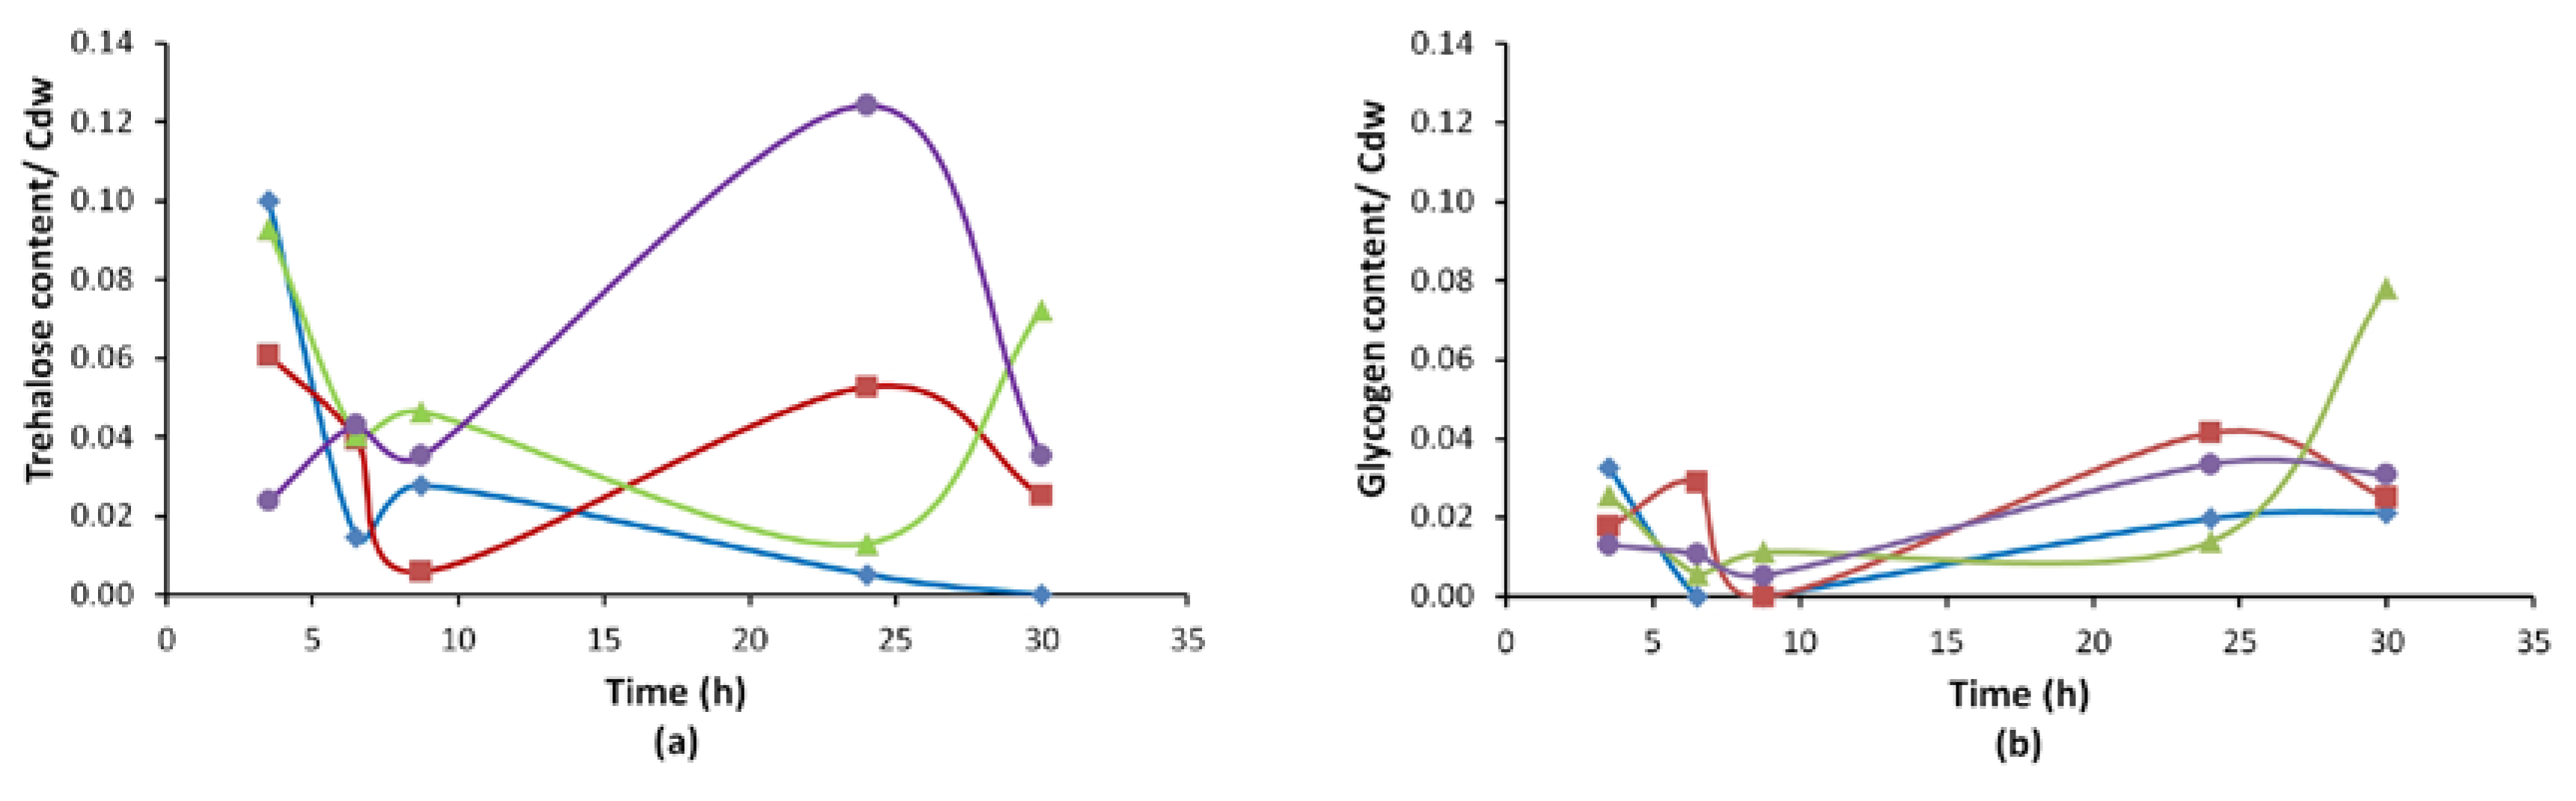
3.2.3. Reserve Carbohydrate (Trehalose, Glycogen) Profiles
3.2.4. Oxidative Level Determination
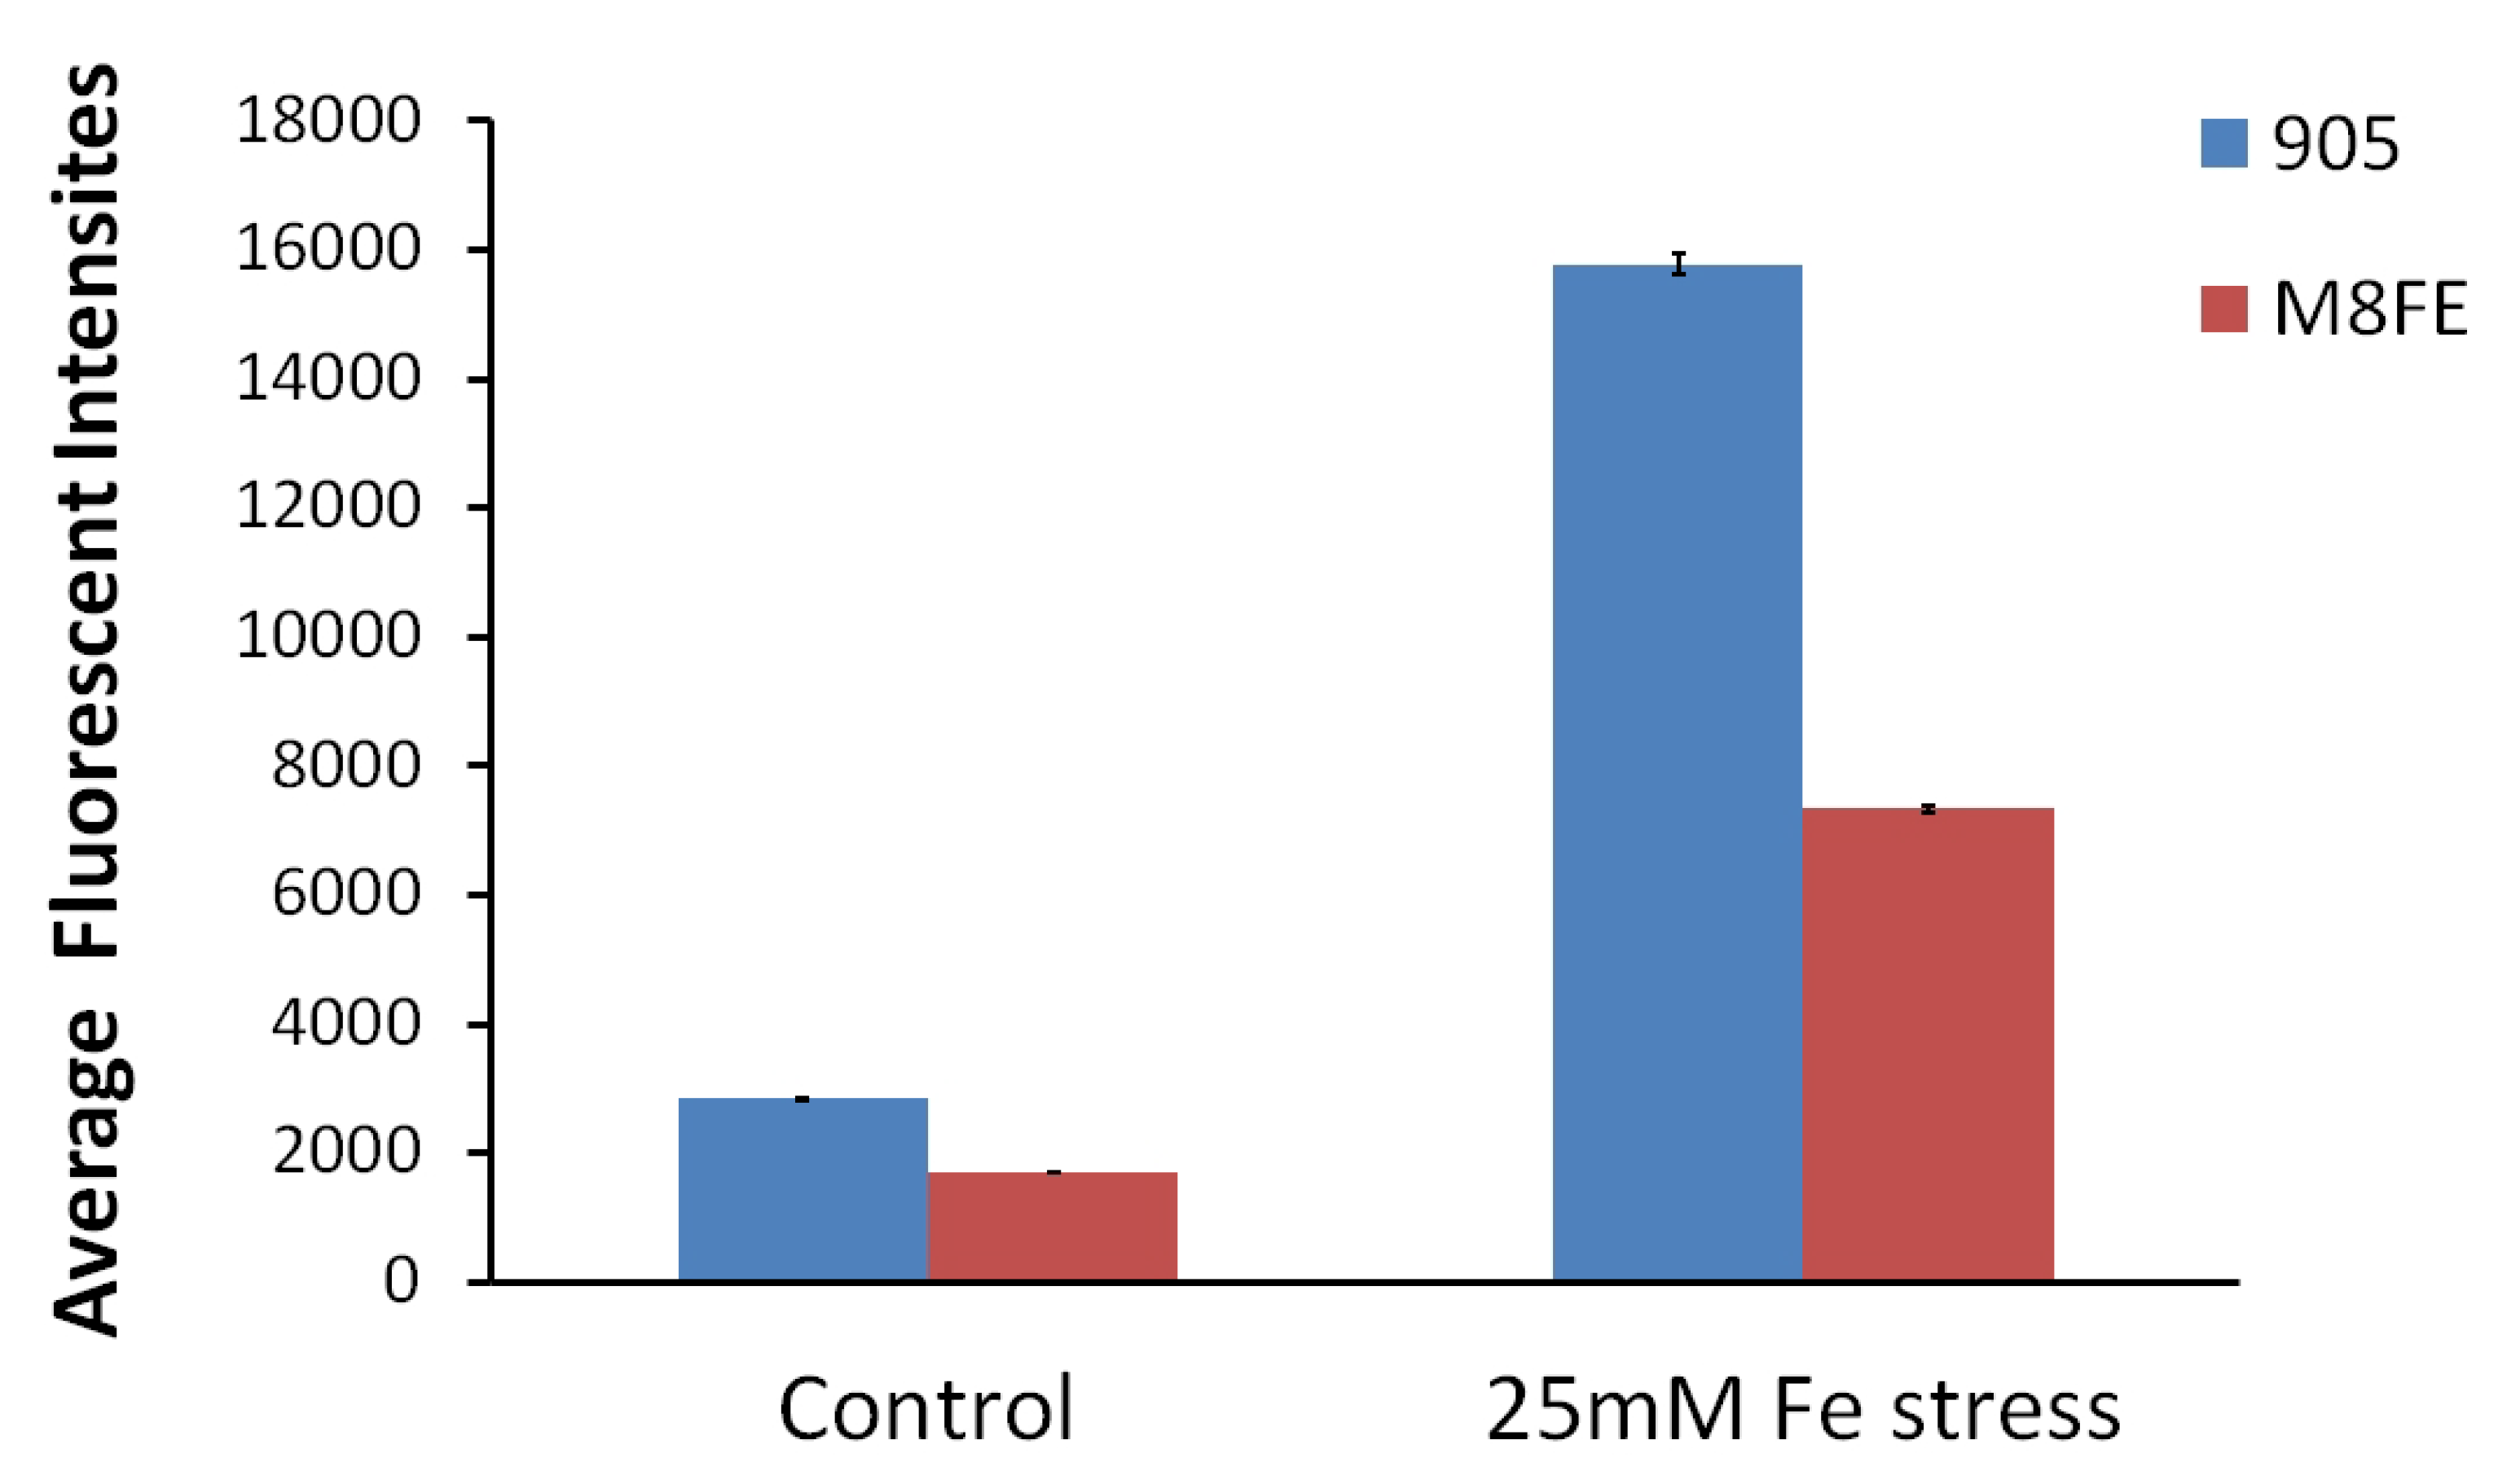
Intracellular Reactive Oxygen Species (ROS) Amounts Determined by Fluorescent Intensity Measurements
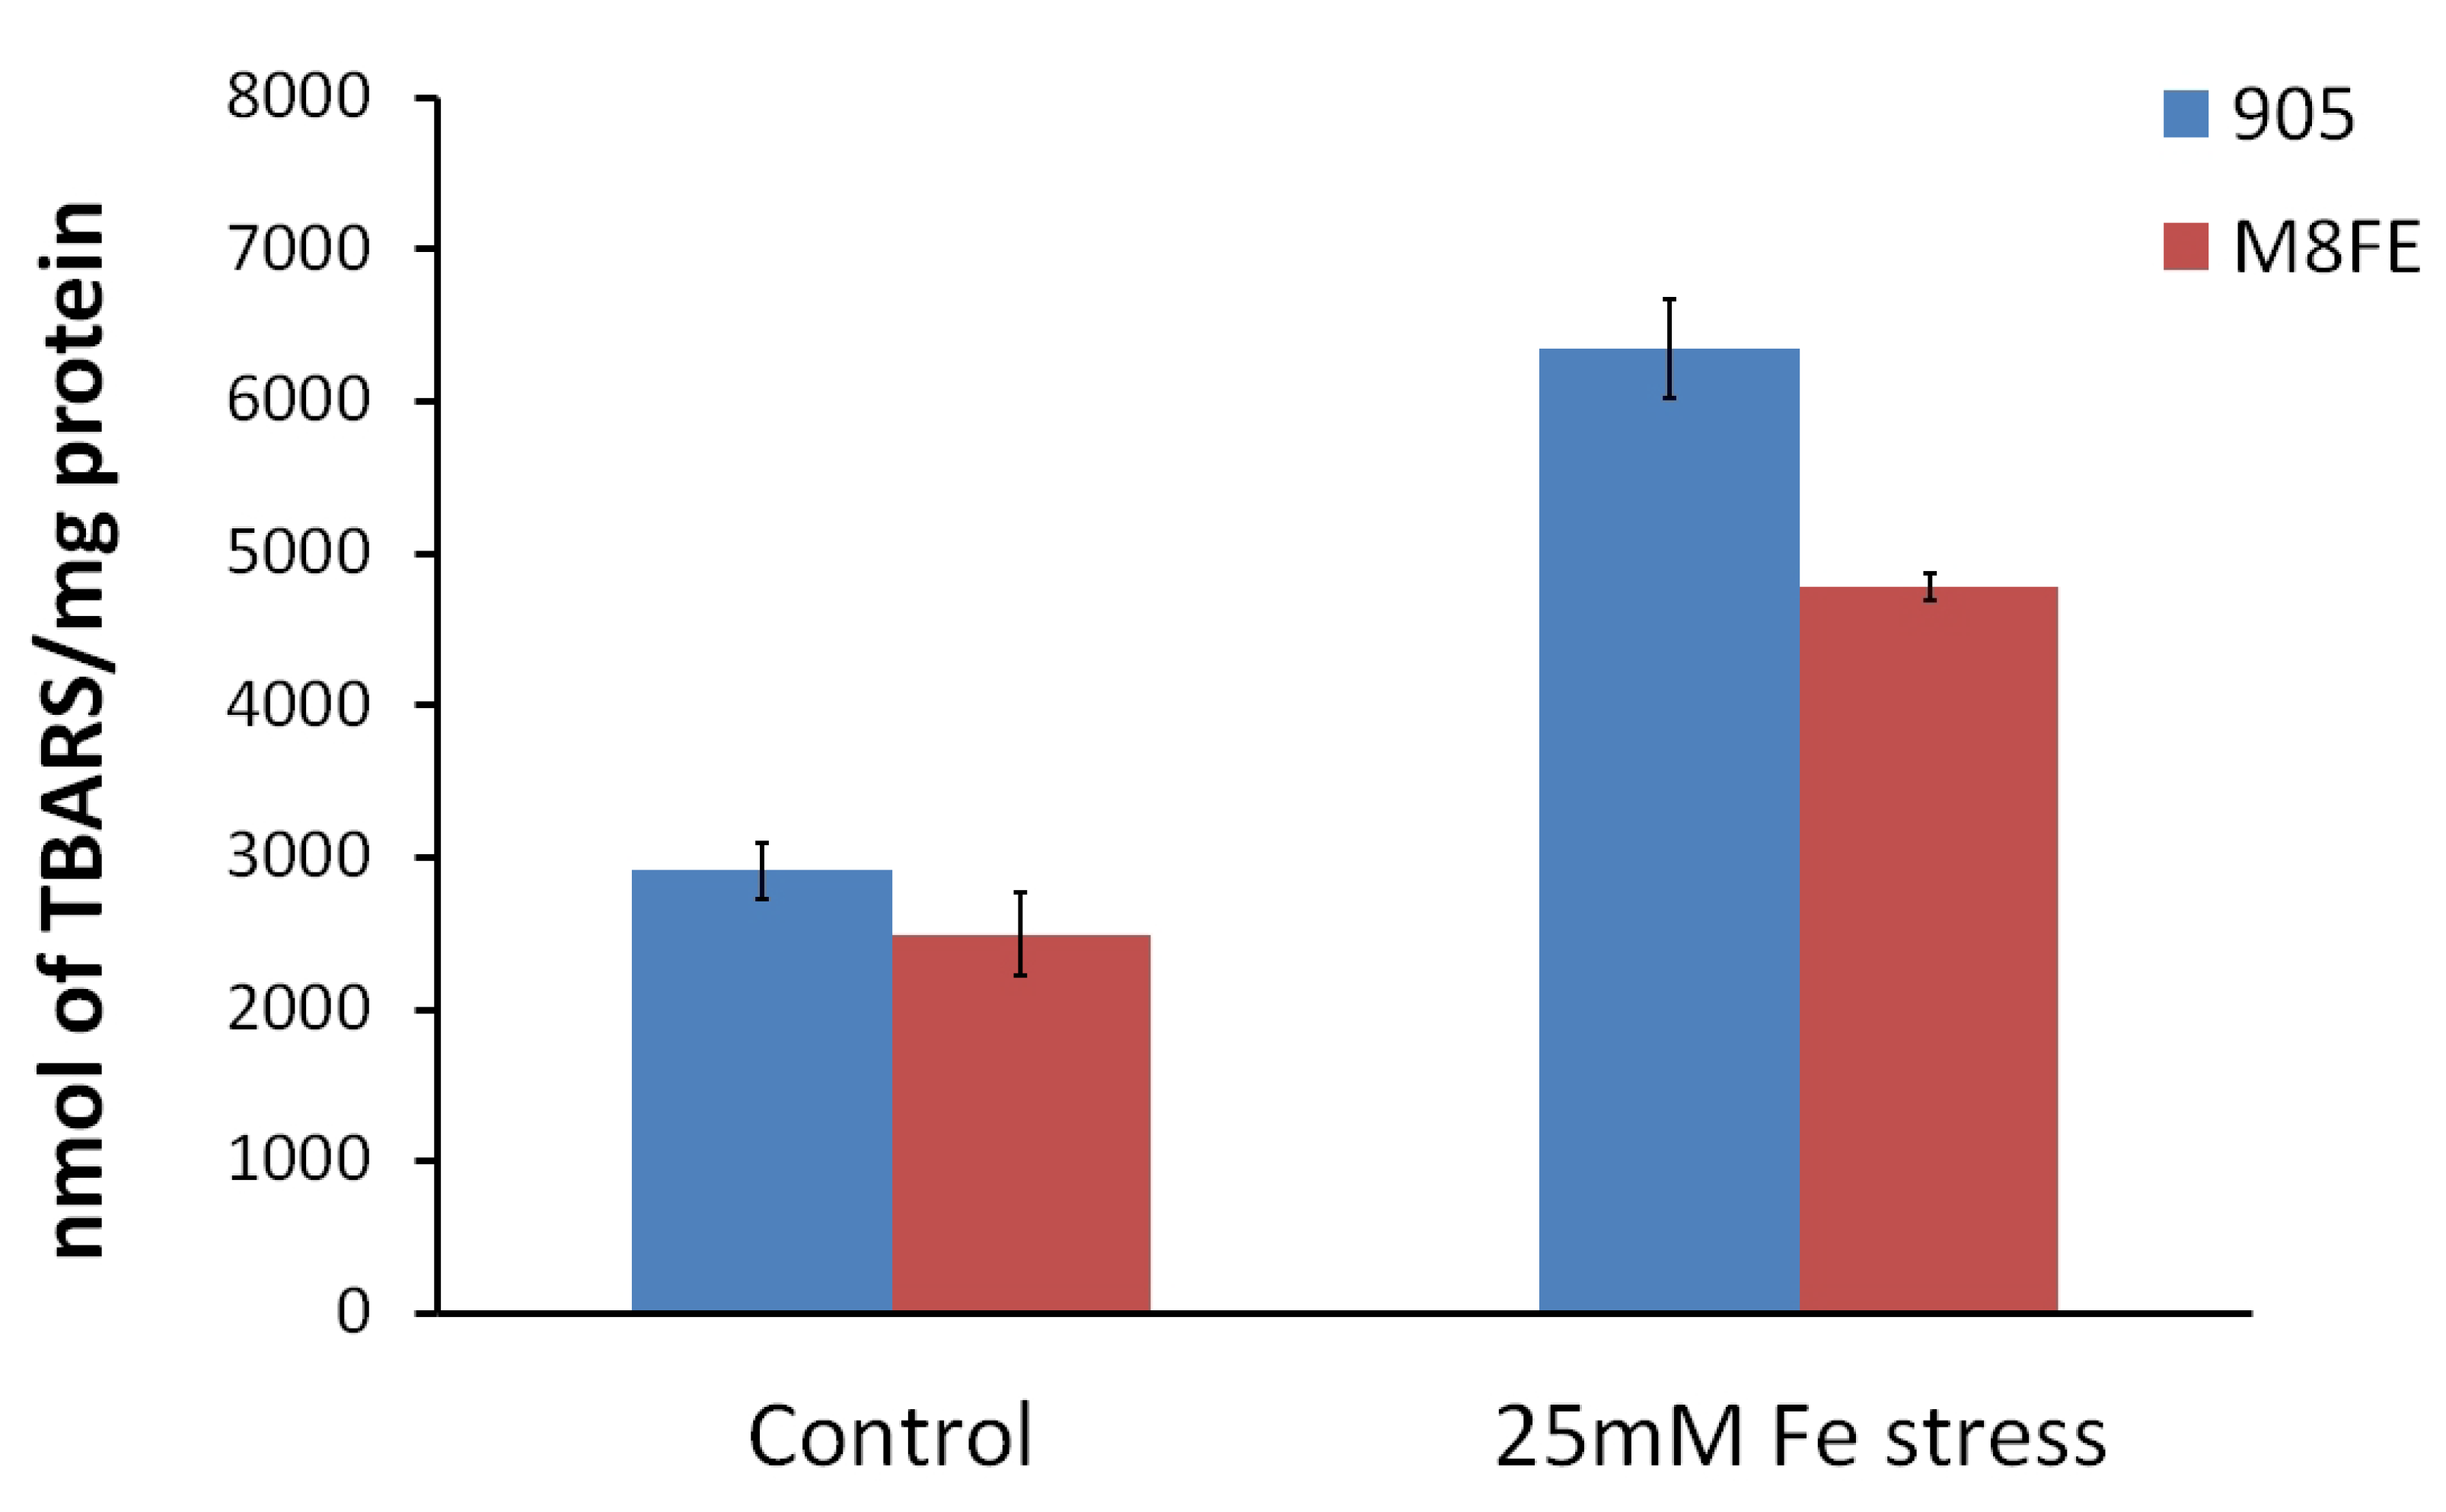
Lipid Peroxidation Assay
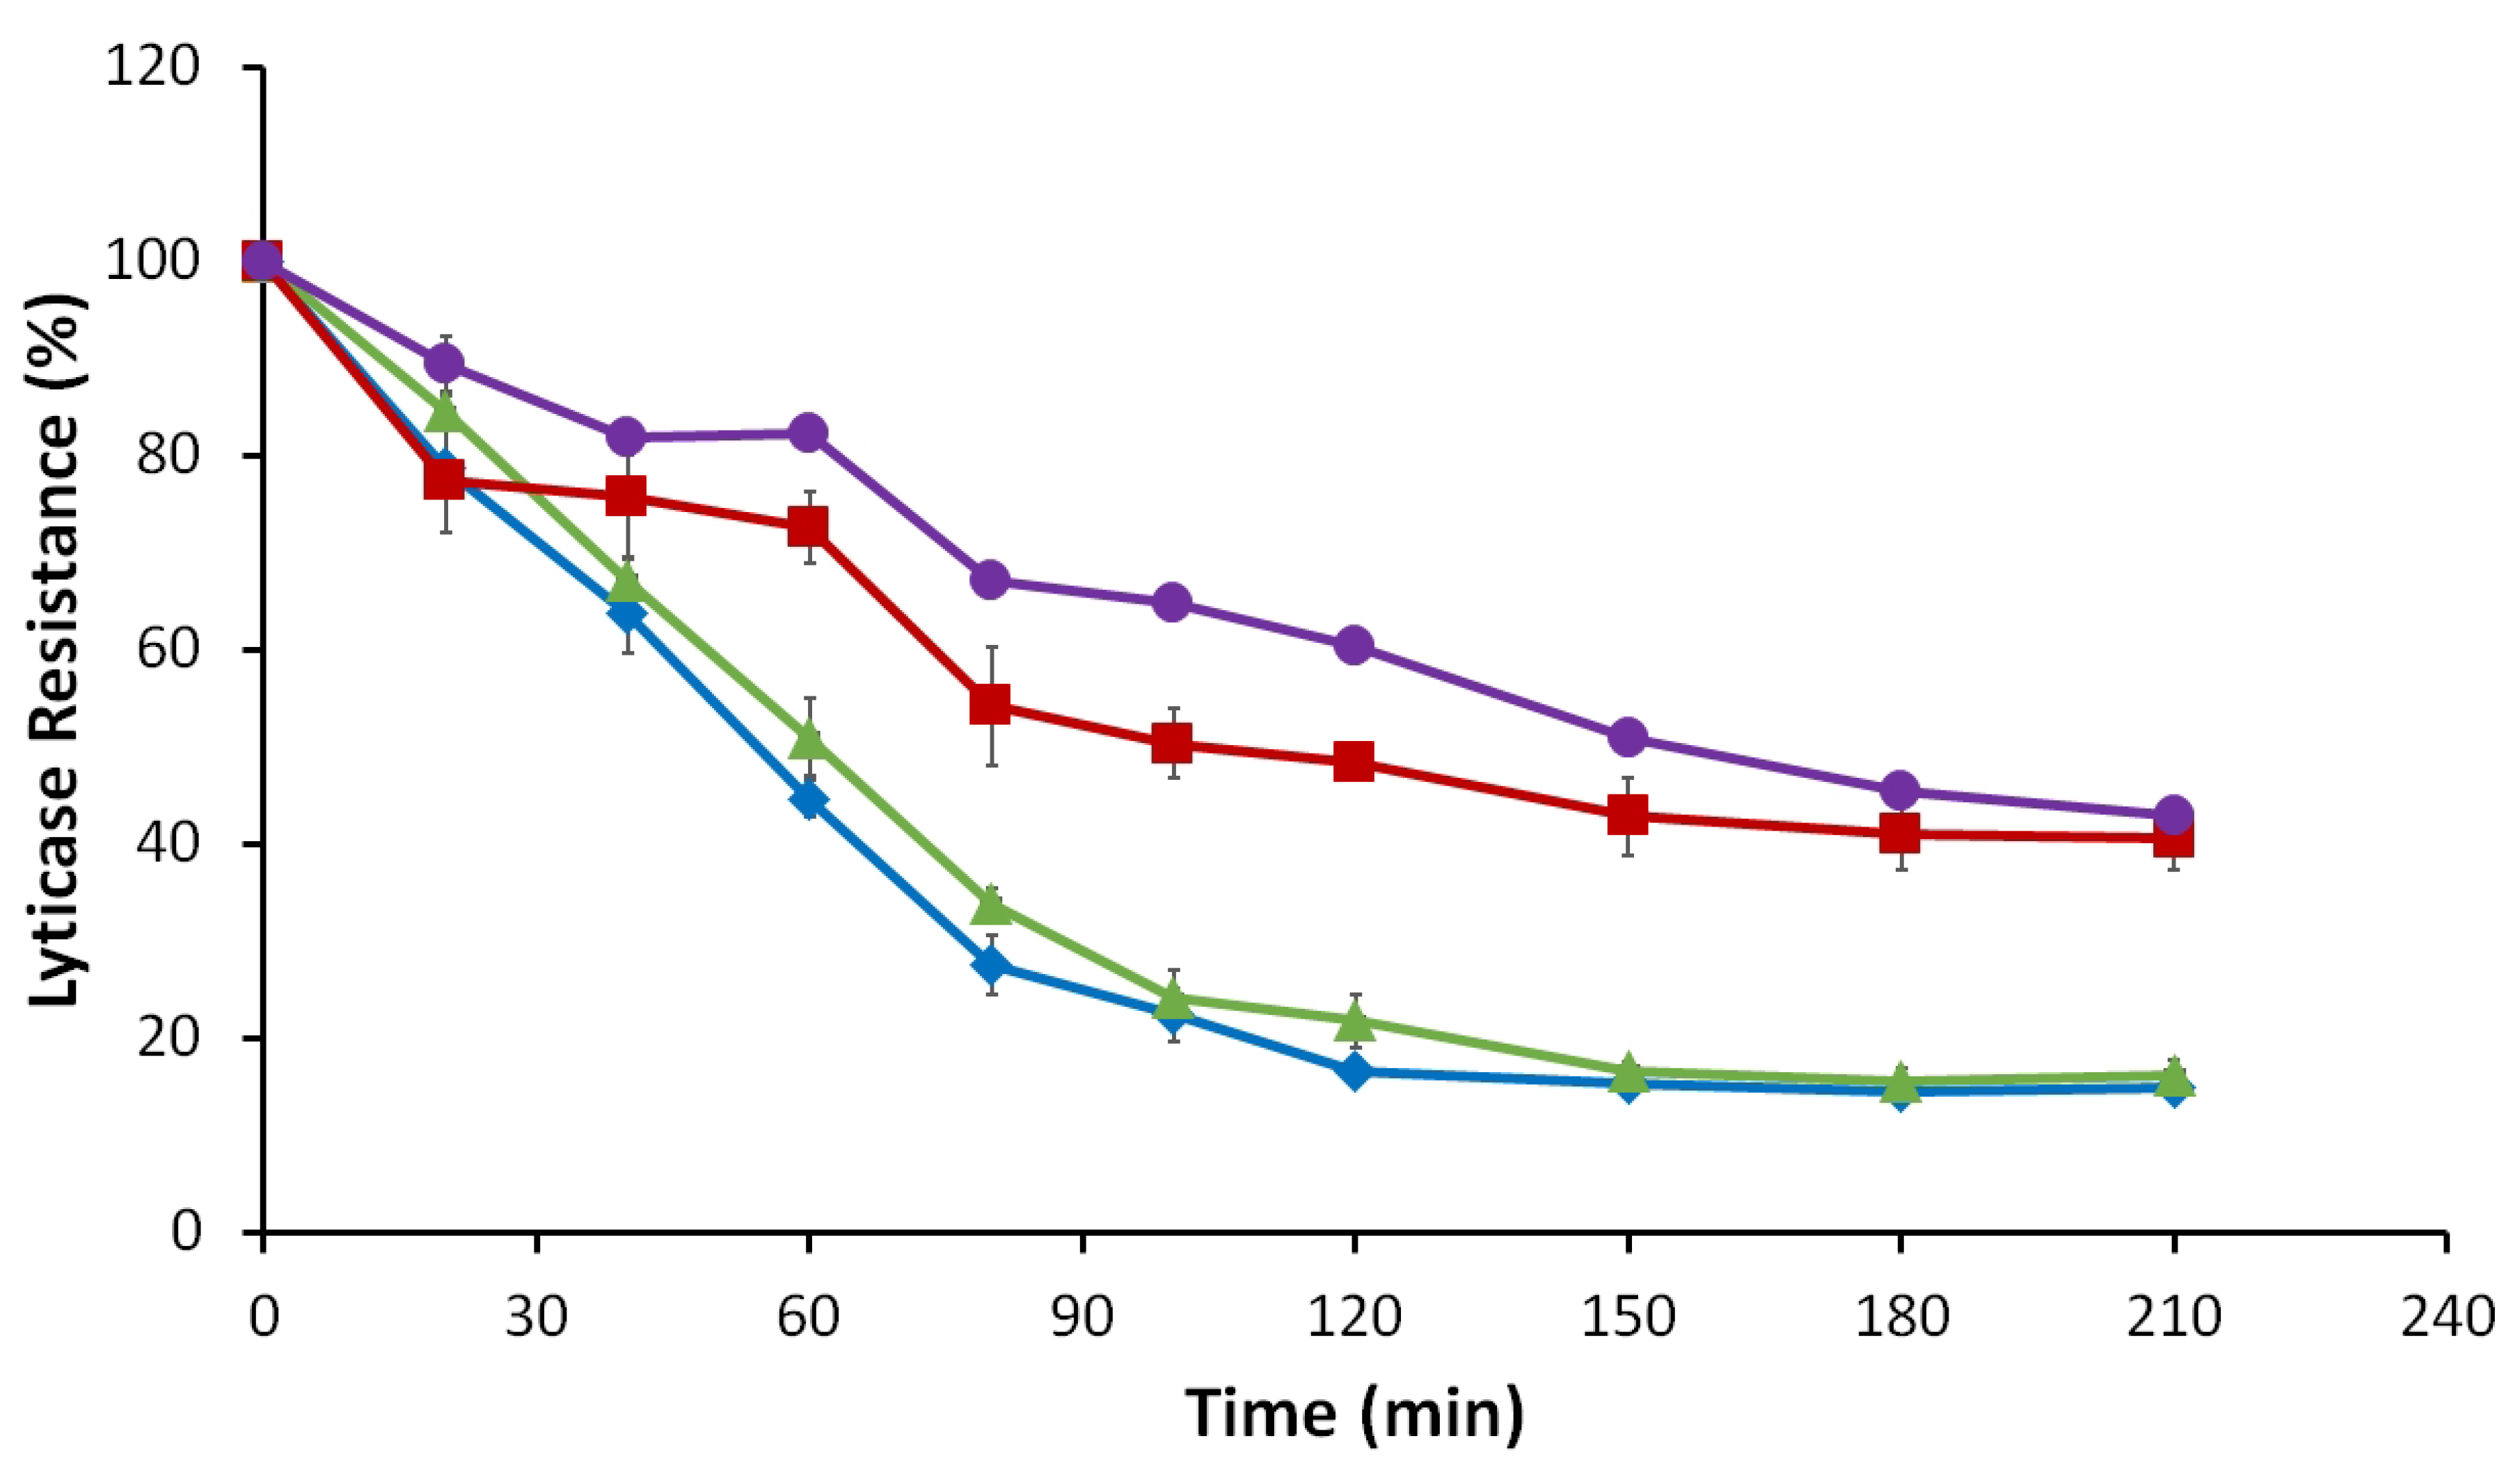
3.2.5. Lyticase Susceptibility Assay
3.3. Transcriptomic Analysis Results
3.3.1. One-Color DNA-Microarray Analysis Results
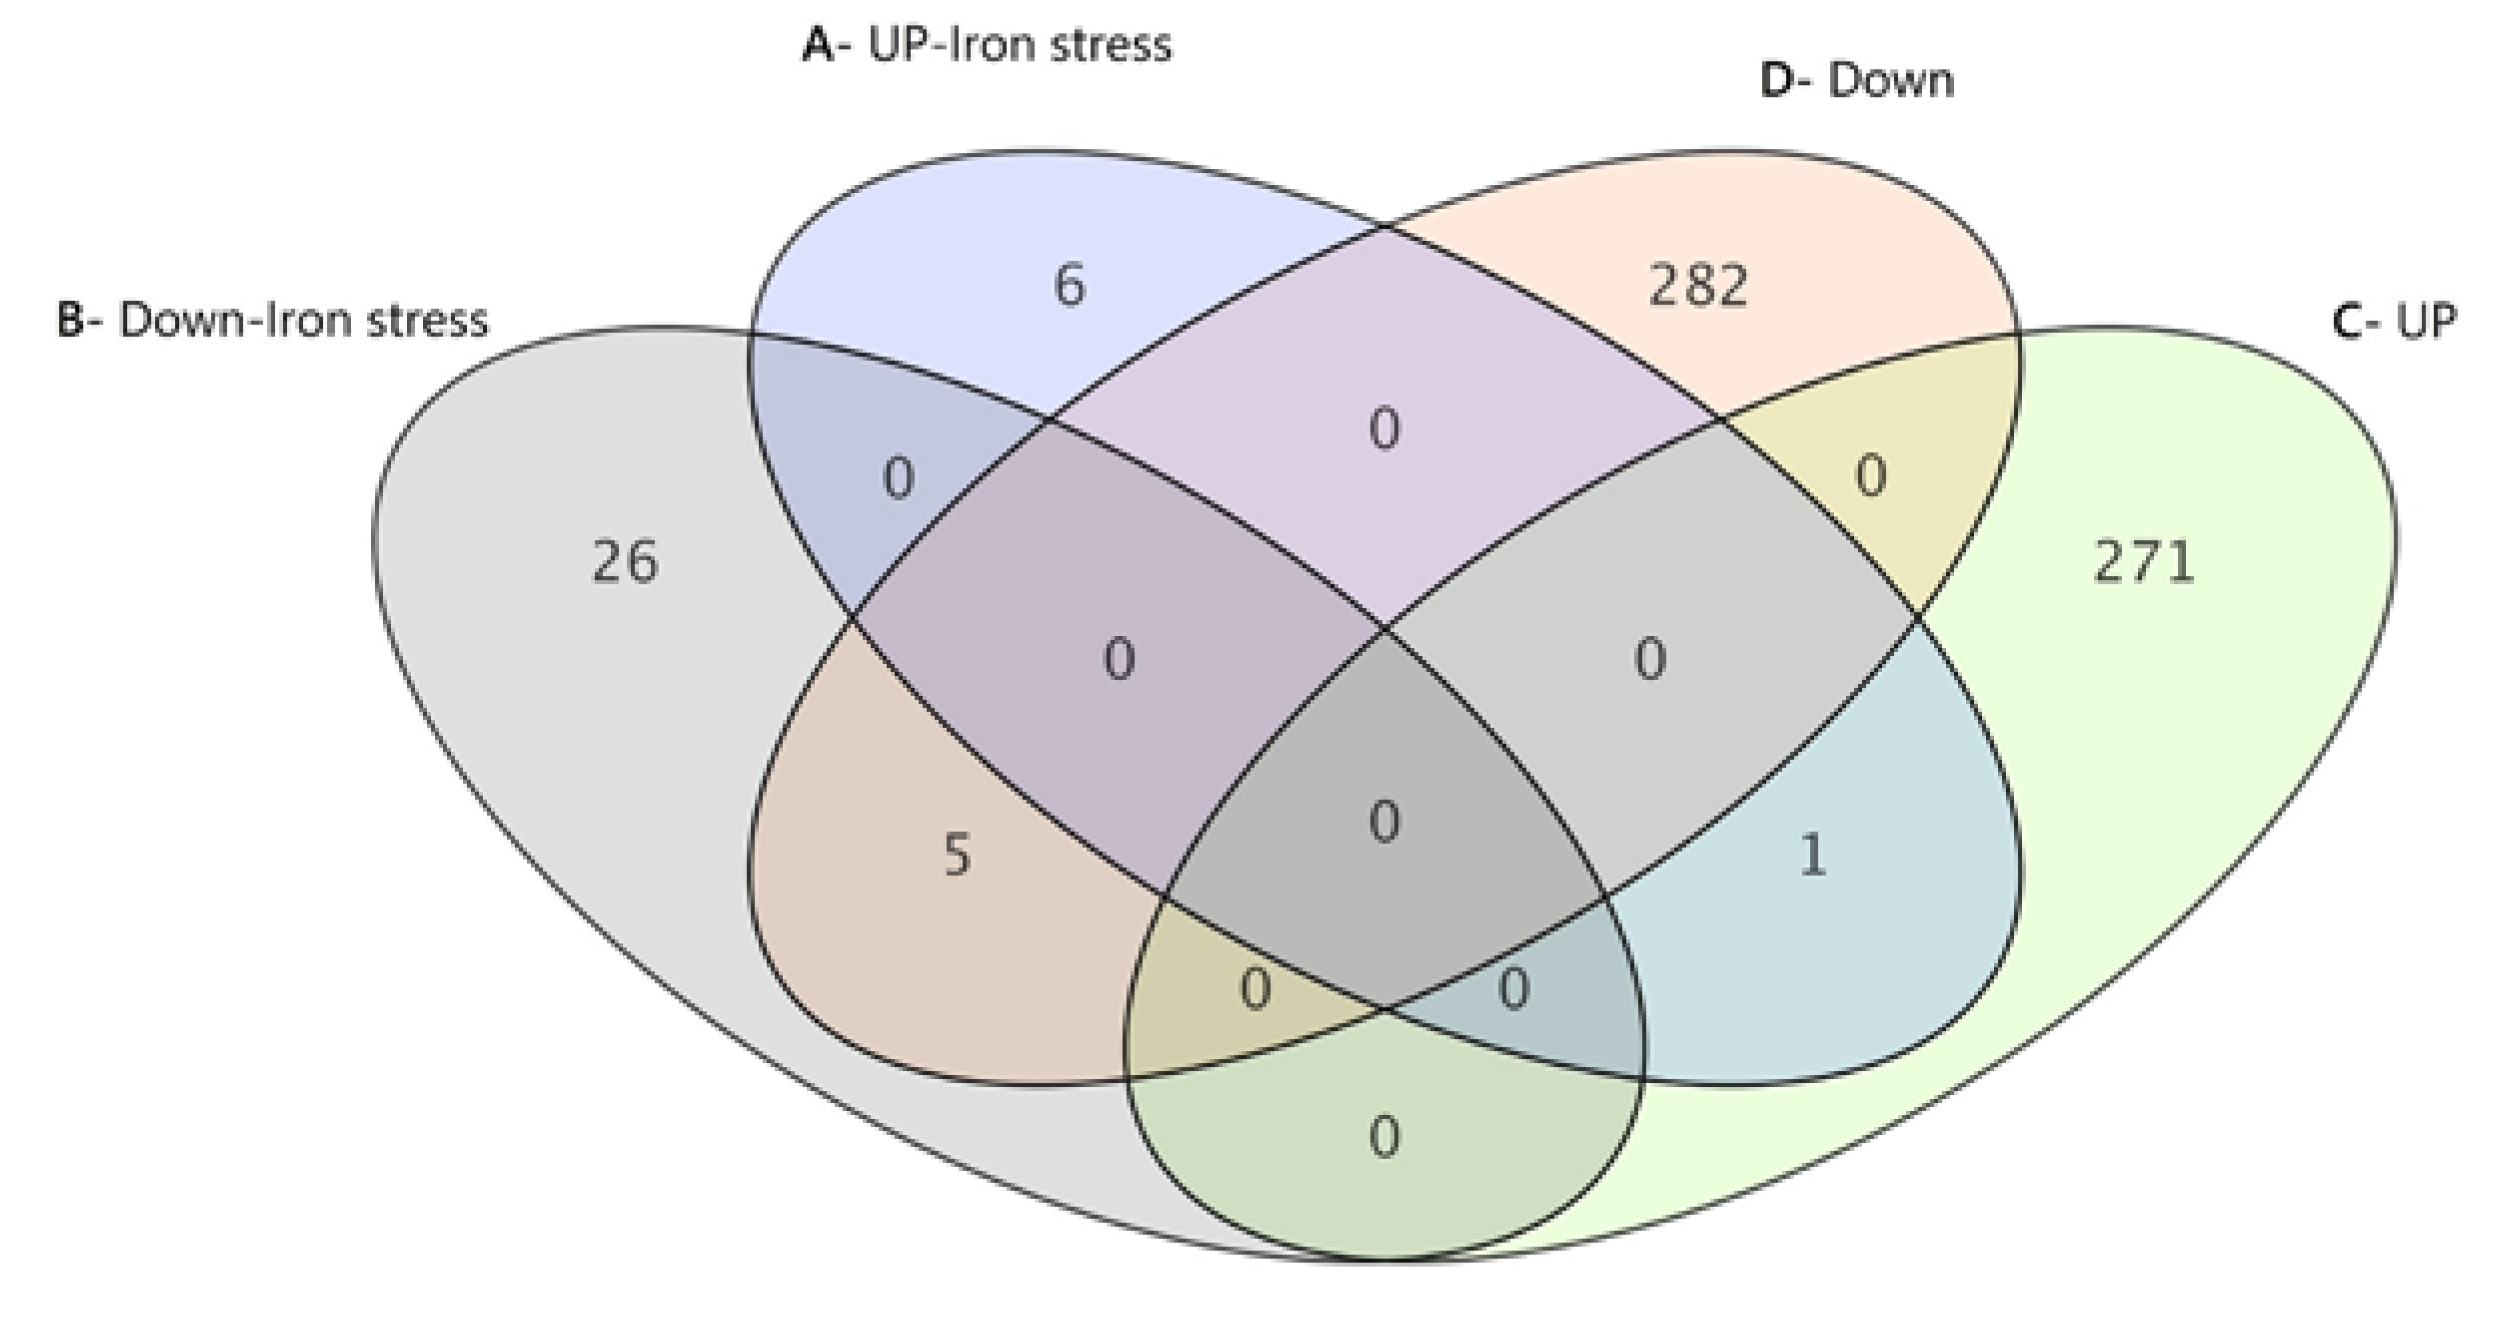
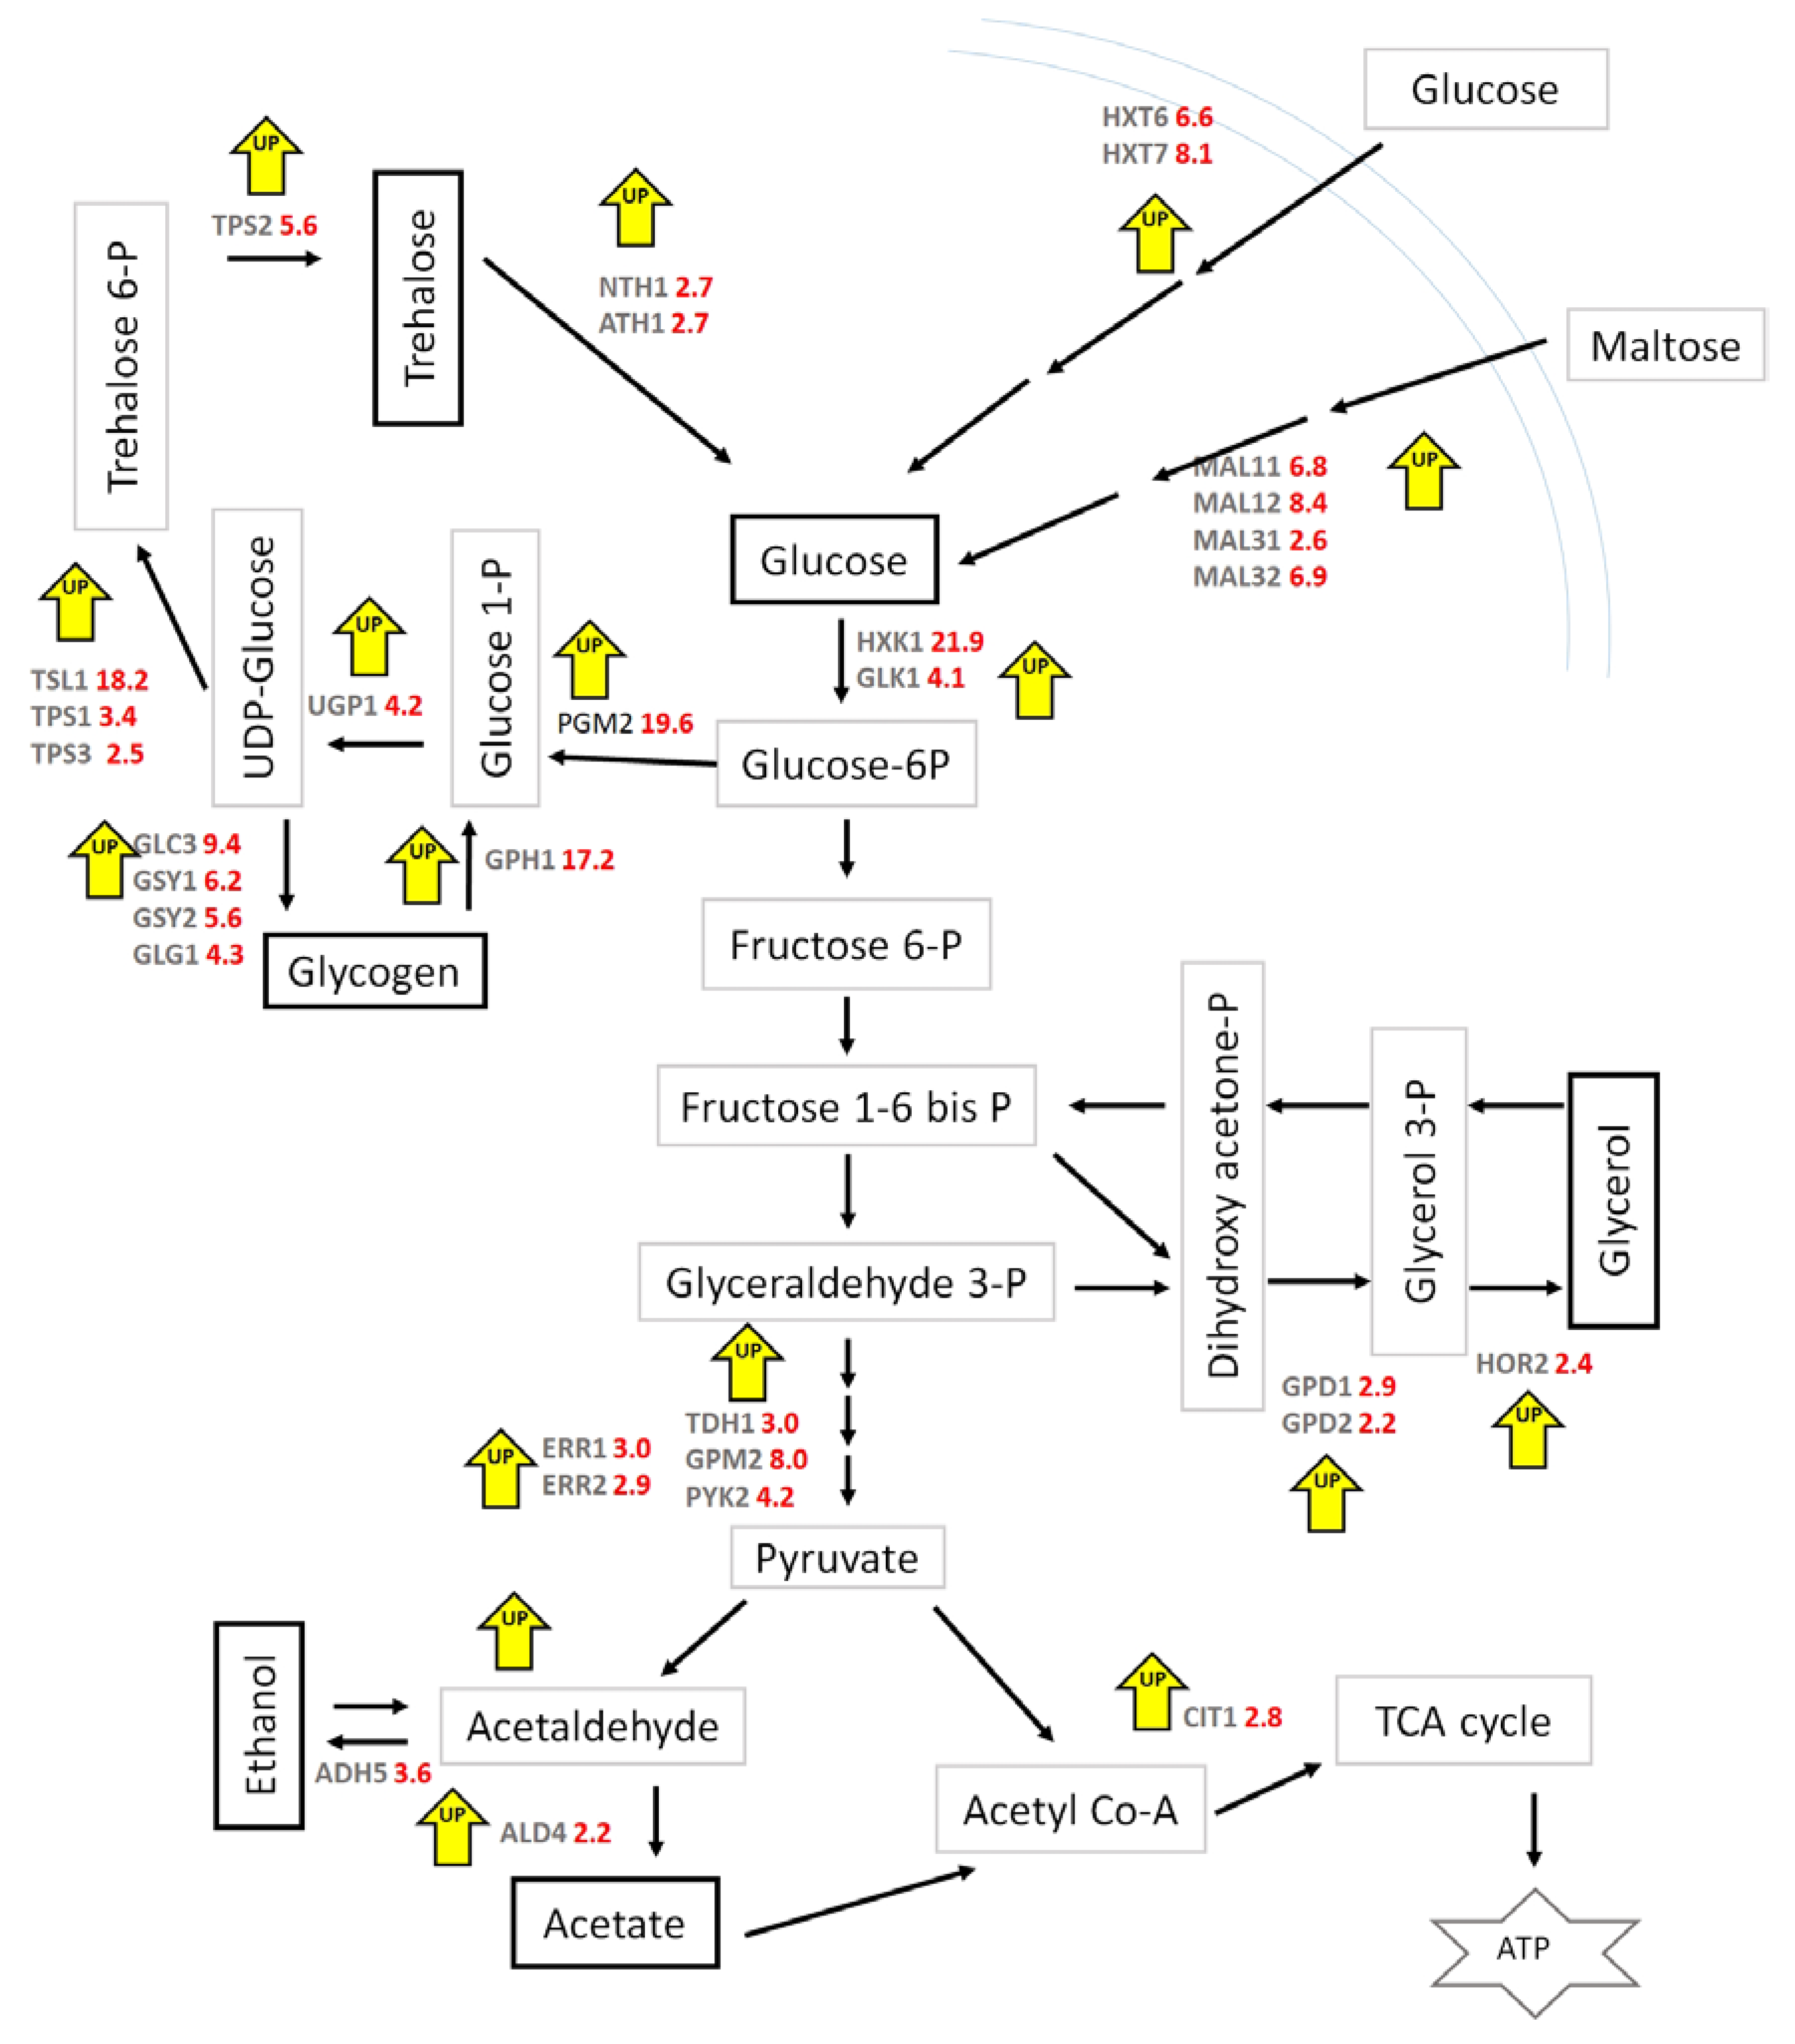
Transcriptome Profiles in the Absence of Iron Stress
Transcriptome Profiles in the Presence of Iron Stress
3.3.2. Validation of Microarray Results Using qRT-PCR
3.4. Mutations in M8FE Identified by Whole Genome Re-Sequencing Analysis
4. Discussion
5. Conclusions
Supplementary Materials
Author Contributions
Funding
Acknowledgments
Conflicts of Interest
References
- Wessling-Resnick, M. Biochemistry of iron uptake. Crit. Rev. Biochem. Mol. Biol. 1999, 34, 285–314. [Google Scholar] [CrossRef] [PubMed]
- Aisen, P.; Enns, C.; Wessling-Resnick, M. Chemistry and biology of eukaryotic iron metabolism. Int. J. Biochem. Cell Biol. 2001, 33, 940–959. [Google Scholar] [CrossRef]
- Sheftel, A.D.; Mason, A.B.; Ponka, P. The long history of iron in the Universe and in health and disease. Biochim. Biophys. Acta Gen. Subj. 2012, 1820, 161–187. [Google Scholar] [CrossRef] [PubMed] [Green Version]
- Silver, J. Chemistry of Iron, 1st ed.; Chapman & Hall: New Delhi, India, 1993. [Google Scholar]
- Crichton, R.R. Biological Inorganic Chemistry, 2nd ed.; Elsevier: Amsterdam, The Netherlands, 2012. [Google Scholar]
- Valko, M.; Rhodes, C.J.; Moncol, J.; Izakovic, M.; Mazur, M. Free radicals, metals and antioxidants in oxidative stress-induced cancer. Chem. Biol. Interact. 2006, 160, 1–40. [Google Scholar] [CrossRef] [PubMed]
- Costa, V.; Moradas-Ferreira, P. Oxidative stress and signal transduction in Saccharomyces cerevisiae: Insights into ageing, apoptosis and diseases. Mol. Asp. Med. 2001, 22, 217–246. [Google Scholar] [CrossRef]
- Bleackley, M.R.; Macgillivray, R.T.A. Transition metal homeostasis: From yeast to human disease. Biometals 2011, 24, 785–809. [Google Scholar] [CrossRef]
- Eid, R.; Arab, N.T.T.; Greenwood, M.T. Iron mediated toxicity and programmed cell death: A review and a re-examination of existing paradigms. Biochim. Biophys. Acta Mol. Cell Res. 2017, 1864, 399–430. [Google Scholar] [CrossRef]
- Koechler, S.; Farasin, J.; Cleiss-Arnold, J.; Arsene-Ploetze, F. Toxic metal resistance in biofilms: Diversity of microbial responses and their evolution. Res. Microbiol. 2015, 166, 764–773. [Google Scholar] [CrossRef]
- Caviccholi, R.; Ripple, W.J.; Timmis, K.N.; Azam, F.; Bakken, L.R.; Baylis, M.; Behrenfeld, M.J.; Boeitus, A.; Boyd, P.W.; Classen, A.T.; et al. Scientist’ warning to humanity: Microorganisms and climate change. Nat. Rev. Microbiol. 2019, 17, 569–586. [Google Scholar] [CrossRef] [Green Version]
- Kyyaly, M.A.; Powell, C.; Ramadan, E. Preparation of iron-enriched baker’s yeast and its efficiency in recovery of rats from dietary iron deficiency. Nutrition 2015, 31, 1155–1164. [Google Scholar] [CrossRef]
- Reed, S.; Hadar, N.; Raymond, P.G.; Omry, K.; Elay, T. Characterizing the gut (Gallus gallus) microbiota following the consumption of an iron biofortified Rwandan cream seeded carioca (Phaseolus Vulgaris L.) bean-based diet. PLoS ONE 2017, 12, 1–15. [Google Scholar] [CrossRef] [PubMed] [Green Version]
- Parmanand, B.A.; Kellingray, L.; Le Gall, G.; Basit, A.W.; Fairweather-Tat, S.; Narbad, A. A decrease in iron availability to human gut microbiome reduces the growth of potentially pathogenic gut bacteria; an in vitro colonic fermentation study. J. Nutr. Biochem. 2019, 67, 20–27. [Google Scholar] [CrossRef] [PubMed]
- Askwith, C.C.; de Silva, D.; Kaplan, J. Molecular biology of iron acquisition in Saccharomyces cerevisiae. Mol. Microbiol. 1996, 20, 27–34. [Google Scholar] [CrossRef] [PubMed]
- Jennings, D.H. Stress Tolerance of Fungi, 10th ed.; Marcel Dekker: New York, NY, USA, 1993. [Google Scholar]
- Alberts, B.; Johnson, A.; Lewis, J.; Raff, M.; Roberts, K.; Walter, P. Molecular Biology of the Cell, 4th ed.; Garland Science: New York, NY, USA, 2002. [Google Scholar]
- Dickinson, J.R.; Schweizer, M. The Metabolism and Molecular Physiology of Saccharomyces Cerevisiae, 2nd ed.; CRC Press: Boca Raton, FL, USA, 2004. [Google Scholar]
- Chen, X.-Z. Yeast SMF1 Mediates H+-coupled iron uptake with concomitant uncoupled cation currents. J. Biol. Chem. 1999, 274, 35089–35094. [Google Scholar] [CrossRef] [PubMed] [Green Version]
- Cakar, Z.P.; Seker, U.O.S.; Tamerler, C.; Sonderegger, M.; Sauer, U. Evolutionary engineering of multiple-stress resistant Saccharomyces cerevisiae. FEMS Yeast Res. 2005, 5, 569–578. [Google Scholar] [CrossRef] [PubMed] [Green Version]
- Cakar, Z.P.; Alkim, C.; Turanli, B.; Tokman, N.; Akman, S.; Sarikaya, M.; Tamerler, C.; Benbadis, L.; François, J.M. Isolation of cobalt hyper-resistant mutants of Saccharomyces cerevisiae by in vivo evolutionary engineering approach. J. Biotechnol. 2009, 143, 130–138. [Google Scholar] [CrossRef]
- Sen, M.; Yılmaz, U.; Baysal, A.; Akman, S.; Cakar, Z.P. In vivo evolutionary engineering of a boron-resistant bacterium: Bacillus boroniphilus. Antonie Leeuwenhoek 2011, 99, 825–835. [Google Scholar] [CrossRef]
- Küçükgöze, G.; Alkım, C.; Yılmaz, Ü.; Kısakesen, H.İ.; Gündüz, S.; Akman, S.; Çakar, Z.P. Evolutionary engineering and transcriptomic analysis of nickel-resistant Saccharomyces cerevisiae. FEMS Yeast Res. 2013, 13, 731–746. [Google Scholar] [CrossRef] [Green Version]
- Turanlı-Yıldız, B.; Benbadis, L.; Alkım, C.; Sezgin, T.; Akşit, A.; Gökçe, A.; Öztürk, Y.; Baykal, A.T.; Çakar, Z.P.; François, J.M. In vivo evolutionary engineering for ethanol-tolerance of Saccharomyces cerevisiae haploid cells triggers diploidization. J. Biosci. Bioeng. 2017, 124, 309–318. [Google Scholar] [CrossRef]
- Arslan, M.; Holyavkin, C.; Kısakesen, H.İ.; Topaloğlu, A.; Sürmeli, Y.; Çakar, Z.P. Physiological and transcriptomic analysis of a chronologically long-lived Saccharomyces cerevisiae strain obtained by evolutionary engineering. Mol. Biotechnol. 2018, 60, 468–484. [Google Scholar] [CrossRef]
- Hacısalihoğlu, B.; Holyavkin, C.; Topaloğlu, A.; Kısakesen, H.İ.; Çakar, Z.P. Genomic and transcriptomic analysis of a coniferyl aldehyde-resistant Saccharomyces cerevisiae strain obtained by evolutionary engineering. FEMS Yeast Res. 2019, 19, foz021. [Google Scholar] [CrossRef] [PubMed]
- Sürmeli, Y.; Holyavkin, C.; Topaloğlu, A.; Arslan, M.; Kısakesen, H.İ.; Çakar, Z.P. Evolutionary engineering and molecular characterization of a caffeine-resistant Saccharomyces cerevisiae strain. World J. Microbiol. Biotechnol. 2019, 35, 183. [Google Scholar] [CrossRef] [PubMed]
- Lawrence, C.W. Classical mutagenesis techniques. Methods Enzymol. 1991, 194, 273–278. [Google Scholar] [PubMed]
- Russek, E.; Colwell, R.R. Computation of most probable numbers. Appl. Environ. Microbiol. 1983, 45, 1646–1650. [Google Scholar] [PubMed]
- Lindquist, J. The MPN Method. Available online: http://www.jlindquist.com/generalmicro/102dil3.html (accessed on 1 September 2019).
- Pereira, M.D.; Eleutherio, E.C.; Panek, D. Acquisition of tolerance against oxidative damage in Saccharomyces cerevisiae. BMC Microbiol. 2001, 1, 11. [Google Scholar] [CrossRef] [PubMed]
- Kommuguri, U.N.; Bodiga, S.; Sankuru, S.; Bodiga, V.L. Copper deprivation modulates CTR1 and CUP1 expression and enhances cisplatin cytotoxicity in Saccharomyces cerevisiae. J. Trace Elem. Med. Biol. 2012, 26, 13–19. [Google Scholar] [CrossRef] [PubMed]
- Kuranda, K.; Leberre, V.; Sokol, S.; Palamarczyk, G.; François, J. Investigating the caffeine effects in the yeast Saccharomyces cerevisiae brings new insights into the connection between TOR, PKC and Ras/cAMP signaling pathways. Mol. Microbiol. 2006, 61, 1147–1166. [Google Scholar] [CrossRef] [PubMed]
- Benjamini, Y.; Hochberg, Y. Controlling the false discovery rate: A practical and powerful approach to multiple testing. J. R. Stat. Soc. 1995, 57, 289–300. [Google Scholar] [CrossRef]
- Rozen, S.; Skaletsky, H. Primer3 on the WWW for general users and for biologist programmers. Bioinforma. Methods Protoc. 1999, 132, 365–386. [Google Scholar]
- Livak, K.J.; Schmittgen, T.D. Analysis of relative gene expression data using real-time quantitative PCR and the 2(-Delta Delta C(T)) Method. Methods 2001, 25, 402–408. [Google Scholar] [CrossRef]
- Myles, H.; Wolfe, D.A. Nonparametric Statistical Methods; John Wiley & Sons.: New York, NY, USA, 1973. [Google Scholar]
- Best, D.J.; Roberts, D.E. Algorithm AS 89: The upper tail probabilities of Spearman’s rho. Appl. Stat. 1975, 24, 377–379. [Google Scholar] [CrossRef]
- R: A Language and Environment for Statistical, Vienna Austria. Available online: https://www.r-project.org/ (accessed on 20 September 2019).
- François, J.; Parrou, J. Reserve carbohydrates metabolism in the yeast Saccharomyces cerevisiae. FEMS Microbiol. Rev. 2001, 25, 125–145. [Google Scholar] [CrossRef] [PubMed] [Green Version]
- Balaban, B.G.; Alkım, C.; Yılmaz, U.; Kısakesen, H.I.; Cakar, Z.P. NCBI GEO Query DataSets for GSE61317. Available online: http://www.ncbi.nlm.nih.gov/geo/query/acc.cgi?acc=GSE61317 (accessed on 11 September 2014).
- Ofiteru, A.M.; Ruta, L.L.; Rotaru, C.; Dumitru, I.; Ene, C.D.; Neagoe, A.; Farcasanu, I.C. Overexpression of the PHO84 gene causes heavy metal accumulation and induces Ire1p-dependent unfolded protein response in Saccharomyces cerevisiae cells. Appl. Microbiol. Biotechnol. 2012, 94, 425–435. [Google Scholar] [CrossRef] [PubMed]
- Saccharomyces Genome Database. Available online: http://www.yeastgenome.org/ (accessed on 20 September 2018).
- Robinson, M.D.; Grigull, J.; Mohammad, N.; Hughes, T.R. Robinson FunSpec: A Web-Based Cluster Interpreter for Yeast. Available online: http://funspec.med.utoronto.ca/ (accessed on 7 March 2013).
- Bonferroni, C.E. Teoria statistica delle classi e calcolo delle probabilitá. Pubbl. Ist. Super. Sci. Econ. Commer. Firenze 1936, 8, 3–62. [Google Scholar]
- Slenter, D.N.; Kutmon, M.; Hanspers, K.; Riutta, A.; Windsor, J.; Nunes, N.; Mélius, J.; Cirillo, E.; Coort, S.L.; DIgles, D.; et al. WikiPathways: A multifaceted pathway database bridging metabolomics to other omics research. Nucleic Acids Res. 2018, 46, D661–D667. [Google Scholar] [CrossRef]
- Rai, M. Advances in Fungal Biotechnology; I.K. International Publishing House: New Delhi, India, 2009. [Google Scholar]
- Yoshida, S.; Ohya, Y.; Goebl, M.; Nakano, A.; Anraku, Y. A novel gene, STT4, encodes a phosphatidylinositol 4-kinase in the PKCl protein kinase pathway of Saccharomyces cerevisiae. J. Biol. Chem. 1994, 269, 1166–1172. [Google Scholar]
- Barałkiewicz, D.; Siepak, J. Chromium, nickel and cobalt in environmental samples and existing legal norms. Polish J. Environ. Stud. 1999, 8, 201–208. [Google Scholar]
- Collins, J.H. On mineral classification. Mineral. Mag. J. Mineral. Socity Gt. Britain Irel. 1878, II, 65–81. [Google Scholar] [CrossRef]
- Stadler, J.A.; Schweyen, R.J. The yeast iron regulon is induced upon cobalt stress and crucial for cobalt tolerance. J. Biol. Chem. 2002, 277, 39649–39654. [Google Scholar] [CrossRef] [Green Version]
- Alkim, C.; Benbadis, L.; Yilmaz, U.; Cakar, Z.P.; François, J.M. Mechanisms other than activation of the iron regulon account for the hyper-resistance to cobalt of a Saccharomyces cerevisiae strain obtained by evolutionary engineering. Metallomics 2013, 5, 1043–1060. [Google Scholar] [CrossRef]
- Clapp, C.; Portt, L.; Khoury, C.; Sheibani, S.; Eid, R.; Greenwood, M.; Vali, H.; Mandato, C.A.; Greenwood, M.T. Untangling the roles of anti-apoptosis in regulating programmed cell death using humanized yeast cells. Front. Oncol. 2012, 59, 1–17. [Google Scholar] [CrossRef] [PubMed] [Green Version]
- Jensen, L.T.; Ajua-Alemanji, M.; Culotta, V.C. The Saccharomyces cerevisiae high affinity phosphate transporter encoded by PHO84 also functions in manganese homeostasis. J. Biol. Chem. 2003, 278, 42036–42040. [Google Scholar] [CrossRef] [PubMed] [Green Version]
- Rosenfeld, L.; Reddi, A.R.; Leung, E.; Aranda, K.; Jensen, L.T.; Culotta, V.C. The effect of phosphate accumulation on metal ion homeostasis in Saccharomyces cerevisiae. J. Biol. Inorg. Chem. 2010, 15, 1051–1062. [Google Scholar] [CrossRef] [PubMed] [Green Version]
- Samyn, D.R.; Ruiz-Pávon, L.; Andersson, M.R.; Popova, Y.; Thevelein, J.M.; Persson, B.L. Mutational analysis of putative phosphate- and proton-binding sites in the Saccharomyces cerevisiae Pho84 phosphate:H + transceptor and its effect on signalling to the PKA and PHO pathways. Biochem. J. 2012, 445, 413–422. [Google Scholar] [CrossRef] [Green Version]
- Schothorst, J.; Van Zeebroeck, G.; Thevelein, J. Identification of Ftr1 and Zrt1 as iron and zinc micronutrient transceptors for activation of the PKA pathway in Saccharomyces cerevisiae. Microb. Cell 2017, 4, 74–89. [Google Scholar] [CrossRef] [Green Version]
- Yang, Y.S.; Strittmatter, S.M. The reticulons: A family of proteins with diverse functions. Genome Biol. 2007, 8, 234. [Google Scholar] [CrossRef] [Green Version]
- Touati, D. Iron and oxidative stress in bacteria. Arch. Biochem. Biophys. 2000, 373, 1–6. [Google Scholar] [CrossRef]
- Valko, M.; Morris, H.; Cronin, M.T.D. Metals, toxicity and oxidative stress. Curr. Med. Chem. 2005, 12, 1161–1208. [Google Scholar] [CrossRef] [Green Version]
- Lin, H.; Li, L.; Jia, X.; Ward, D.M.; Kaplan, J. Genetic and biochemical analysis of high iron toxicity in yeast: Iron toxicity is due to the accumulation of cytosolic iron and occurs under both aerobic and anaerobic conditions. J. Biol. Chem. 2011, 286, 3851–3862. [Google Scholar] [CrossRef] [Green Version]
- Lin, S.J.; Culotta, V.C. Suppression of oxidative damage by Saccharomyces cerevisiae ATX2, which encodes a manganese-trafficking protein that localizes to Golgi-like vesicles. Mol. Cell. Biol. 1996, 16, 6303–6312. [Google Scholar] [CrossRef] [Green Version]
- Zhou, X.; Arita, A.; Ellen, T.P.; Liu, X.; Bai, J.; Rooney, J.P.; Kurtz, A.D.; Klein, C.B.; Dai, W.; Begley, T.J.; et al. A genome-wide screen in Saccharomyces cerevisiae reveals pathways affected by arsenic toxicity. Genomics 2009, 94, 294–307. [Google Scholar] [CrossRef] [PubMed] [Green Version]
- Brown, J.A.; Sherlock, G.; Myers, C.L.; Burrows, N.M.; Deng, C.; Wu, H.I.; McCann, K.E.; Troyanskaya, O.G.; Brown, J.M. Global analysis of gene function in yeast by quantitative phenotypic profiling. Mol. Syst. Biol. 2006. [Google Scholar] [CrossRef] [PubMed] [Green Version]
- Bandara, P.D.S.; Flattery-O’Brien, J.A.; Grant, C.M.; Dawes, I.W. Involvement of the Saccharomyces cerevisiae UTH1 gene in the oxidative-stress response. Curr. Genet. 1998, 34, 259–268. [Google Scholar] [CrossRef] [PubMed]
- Ritch, J.J.; Davidson, S.M.; Sheehan, J.J.; Austriaco, O.P. The Saccharomyces SUN gene, UTH1, is involved in cell wall biogenesis. FEMS Yeast Res. 2010, 10, 168–176. [Google Scholar] [CrossRef] [PubMed] [Green Version]
- Tuttle, M.S.; Radisky, D.; Li, L.; Kaplan, J. A dominant allele of PDR1 alters transition metal resistance in yeast. J. Biol. Chem. 2003, 278, 1273–1280. [Google Scholar] [CrossRef] [PubMed] [Green Version]
- Lemasters, J.J. Selective mitochondrial autophagy, or mitophagy, as a targeted defense against oxidative stress, mitochondrial dysfunction, and aging. Rejuvenation Res. 2005, 8, 3–5. [Google Scholar] [CrossRef] [PubMed]
- Camougrand, N.; Bhatia-kis, I. Mitophagy in yeast: Actors and physiological roles. FEMS Yeast Res. 2010, 10, 1023–1034. [Google Scholar]
- Crawford, D.R.; Wang, Y.; Schools, G.P.; Kochheiser, J.; Davies, K.J.A. Down-regulation of mammalian mitochondrial RNAs during oxidative stress. Free Radic. Biol. Med. 1997, 22, 551–559. [Google Scholar] [CrossRef]
- Carmona-Gutierrez, D.; Bauer, M.A.; Zimmermann, A.; Aguilera, A.; Austriaco, N.; Ayscough, K.; Balzan, R.; Bar-Nun, S.; Barrientos, A.; Belenky, P. Guidelines and recommendations on yeast cell death nomenclature. Microb. Cell 2018, 5, 4–31. [Google Scholar] [CrossRef] [Green Version]
- Thomson, E.; Ferreira-Cerca, S.; Hurt, E. Eukaryotic ribosome biogenesis at a glance. J. Cell Sci. 2013, 126, 4815–4821. [Google Scholar] [CrossRef] [Green Version]
- Scanes, K.T.; Hohmann, S.; Prior, B.A. Glycerol production by the yeast Saccharomyces cerevisiae and its relevance to wine: A review. S. Afr. J. Enol. Vitic. 1998, 19, 17–24. [Google Scholar] [CrossRef] [Green Version]
- Li, L.; Ye, Y.; Pan, L.; Zhu, Y.; Zheng, S.; Lin, Y. The induction of trehalose and glycerol in Saccharomyces cerevisiae in response to various stresses. Biochem. Biophys. Res. Commun. 2009, 387, 778–783. [Google Scholar] [CrossRef] [PubMed]


| Read Values from F-AAS Multiplied by the Dilution Factor | Read Values from F-AAS Multiplied by the Dilution Factor–Controls Subtracted (mg/L) | Cell Dry Weight (CDW)/L (mg/L) | Average mg Fe/g cdw Values | ||
|---|---|---|---|---|---|
| 905 | Control | 0.085 | 1330 | ||
| 0.094 | 1170 | ||||
| 0.082 | 1270 | ||||
| Iron stress | 0.746 | 0.659 | 1130 | 0.5942 ± 0.0103 | |
| 0.762 | 0.675 | 1120 | |||
| 0.750 | 0.663 | 1110 | |||
| M8FE | Control | 2.909 | 970 | ||
| 2.974 | 1030 | ||||
| 2.996 | 940 | ||||
| Iron stress | 3.395 | 0.436 | 900 | 0.382 ± 0.088 | |
| 3.261 | 0.302 | 880 | |||
| 3.261 | 0.302 | 940 | |||
| Analysis Set Name | Number of Upregulated Genes | Number of Downregulated Genes |
|---|---|---|
| FC ([M8FE] vs. [905]) | 272 | 287 |
| FC ([M8FE stress] vs. [905-stress]) | 7 | 31 |
| FC ([905 stress] vs. [905]) | 178 | 127 |
| FC ([M8FE stress] vs. [M8FE]) | 213 | 208 |
| Category | Number of Genes from the Input Cluster in the Given Category | Number of Genes Total in the Given Category |
|---|---|---|
| Up-regulated genes | ||
| Biological process | 85 | 1203 |
| Metabolic process | 39 | 425 |
| Oxidation-reduction process | 29 | 272 |
| Response to stress | 26 | 152 |
| Carbohydrate metabolic process | 20 | 94 |
| Cellular response to oxidative stress | 13 | 67 |
| Glycolysis | 9 | 28 |
| Glycogen biosynthetic process | 7 | 12 |
| Trehalose biosynthetic process | 6 | 7 |
| Maltose metabolic process | 6 | 11 |
| Down-regulated genes | ||
| Ribosome biogenesis | 109 | 170 |
| rRNA processing | 103 | 195 |
| Maturation of SSU-rRNA from tricistronic rRNA transcript | 33 | 60 |
| Endonucleolytic cleavage in ITS1 to separate SSU-rRNA from 5.8S rRNA and LSU-rRNA from tricistronic rRNA transcript | 27 | 40 |
| Ribosomal large subunit biogenesis | 24 | 37 |
| Endonucleolytic cleavage to generate mature 5’-end of SSU-rRNA from (SSU-rRNA, 5.8S rrna, LSU-rRNA) | 23 | 29 |
| Endonucleolytic cleavage in 5’-ETS of tricistronic rRNA transcript | 22 | 27 |
| Ribosomal large subunit assembly | 19 | 38 |
| tRNA processing | 17 | 80 |
| Methylation | 16 | 71 |
| Ribosomal small subunit biogenesis | 13 | 24 |
| Maturation of LSU-rRNA from tricistronic rRNA transcript | 11 | 18 |
| Gene Name | qRT-PCR Values of M8FE, as Fold of 905 | Microarray (Norm-ACT1) Log FC ([M8FE] vs. [905]) |
|---|---|---|
| PHO84 | 0.18 | −6.17 |
| HSP12 | 3.70 | 1.95 |
| HSP104 | 4.62 | 1.96 |
| STR3 | 4.35 | 2.96 |
| CTT1 | 3.37 | 3.19 |
| HSP26 | 7.94 | 3.26 |
| HXK1 | 16.31 | 4.55 |
| Gene Name | Genetic Change | Amino Acid Substitution | Description |
|---|---|---|---|
| Cell division | |||
| SFI1 | c.2624 G > A | S875N | Centrin (Cdc31p)-binding protein required for SPB duplication. |
| UTH1 | c.436 A > G | T146A | Mitochondrial inner membrane protein; implicated in cell wall biogenesis, the oxidative stress response, life span during starvation and cell death. |
| EGT2 | c.1592 C > T | S531F | Glycosylphosphatidylinositol (GPI)-anchored cell wall endoglucanase; required for proper cell separation. |
| NOC3 | c.593 C > T | T198I | Subunit of a nuclear complex with Noc2p and pre-replicative complexes; required for pre-RC formation and maintenance during DNA replication licensing. |
| STU1 | c.3416 C > T | T1139I | Microtubule plus-end-tracking non-motor protein; required for the structural integrity of the mitotic spindle. |
| Phosphatidylinositol-mediated signalling | |||
| VPS34 | c.2131 G > A | D711N | Phosphatidylinositol (PI) 3-kinase that synthesizes PI-3-phosphate; forms membrane-associated signal transduction complex with Vps15p to regulate protein sorting. |
| STT4 | c. 5341 C > T | P1781S | Phosphatidylinositol-4-kinase; required for normal vacuole morphology, cell wall integrity, and actin cytoskeleton organization. |
| Nuclear-transcribed mRNA catabolic process | |||
| SSN2 | c.14 C > T | A5V | Subunit of the RNA polymerase II mediator complex; essential for transcriptional regulation. |
| NUP2 | c.627 A > G | I209M | Nucleoporin involved in nucleocytoplasmic transport; has a role in chromatin organization. |
| Transcription factors | |||
| SNF6 | c.940 G > A | E314K | Subunit of the SWI/SNF chromatin remodelling complex; involved in transcriptional regulation. |
| YRM1 | c. 2251 G > A | E751K | Zn(2)-Cys(6) zinc finger transcription factor; activates genes involved in multidrug resistance. |
| Metal homeostasis | |||
| ATX2 | c.61 G > A | G21R | Golgi membrane protein involved in manganese homeostasis. |
© 2019 by the authors. Licensee MDPI, Basel, Switzerland. This article is an open access article distributed under the terms and conditions of the Creative Commons Attribution (CC BY) license (http://creativecommons.org/licenses/by/4.0/).
Share and Cite
Balaban, B.G.; Yılmaz, Ü.; Alkım, C.; Topaloğlu, A.; Kısakesen, H.İ.; Holyavkin, C.; Çakar, Z.P. Evolutionary Engineering of an Iron-Resistant Saccharomyces cerevisiae Mutant and Its Physiological and Molecular Characterization. Microorganisms 2020, 8, 43. https://doi.org/10.3390/microorganisms8010043
Balaban BG, Yılmaz Ü, Alkım C, Topaloğlu A, Kısakesen Hİ, Holyavkin C, Çakar ZP. Evolutionary Engineering of an Iron-Resistant Saccharomyces cerevisiae Mutant and Its Physiological and Molecular Characterization. Microorganisms. 2020; 8(1):43. https://doi.org/10.3390/microorganisms8010043
Chicago/Turabian StyleBalaban, Berrak Gülçin, Ülkü Yılmaz, Ceren Alkım, Alican Topaloğlu, Halil İbrahim Kısakesen, Can Holyavkin, and Zeynep Petek Çakar. 2020. "Evolutionary Engineering of an Iron-Resistant Saccharomyces cerevisiae Mutant and Its Physiological and Molecular Characterization" Microorganisms 8, no. 1: 43. https://doi.org/10.3390/microorganisms8010043
APA StyleBalaban, B. G., Yılmaz, Ü., Alkım, C., Topaloğlu, A., Kısakesen, H. İ., Holyavkin, C., & Çakar, Z. P. (2020). Evolutionary Engineering of an Iron-Resistant Saccharomyces cerevisiae Mutant and Its Physiological and Molecular Characterization. Microorganisms, 8(1), 43. https://doi.org/10.3390/microorganisms8010043