Article

Global Transcriptional Response of Three Highly Acid-Tolerant Field Strains of Listeria monocytogenes to HCl Stress

Institute for Food Safety and Hygiene, Vetsuisse Faculty, University of Zurich, 8006 Zürich, Switzerland
*
Author to whom correspondence should be addressed.
Microorganisms 2019, 7(10), 455; https://doi.org/10.3390/microorganisms7100455
Submission received: 9 September 2019 / Revised: 8 October 2019 / Accepted: 10 October 2019 / Published: 16 October 2019
(This article belongs to the Special Issue Feature Papers in Microbial Biotechnology)

Abstract

:
Tolerance to acid is of dual importance for the food-borne pathogen Listeria monocytogenes: acids are used as a preservative, and gastric acid is one of the first defenses within the host. There are considerable differences in the acid tolerance of strains. Here we present the transcriptomic response of acid-tolerant field strains of L. monocytogenes to HCl at pH 3.0. RNAseq revealed significant differential expression of genes involved in phosphotransferase systems, oxidative phosphorylation, cell morphology, motility, and biofilm formation. Genes in the acetoin biosynthesis pathway were upregulated, suggesting that L. monocytogenes shifts to metabolizing pyruvate to acetoin under organic acid stress. We also identified the formation of cell aggregates in microcolonies as a potential relief strategy. A motif search within the first 150 bp upstream of differentially expressed genes identified a novel potential regulatory sequence that may have a function in the regulation of virulence gene expression. Our data support a model where an excess of intracellular H+ ions is counteracted by pumping H+ out of the cytosol via cytochrome C under reduced activity of the ATP synthase. The observed morphological changes suggest that acid stress may cause cells to aggregate in biofilm microcolonies to create a more favorable microenvironment. Additionally, HCl stress in the host stomach may serve as (i) a signal to downregulate highly immunogenic flagella, and (ii) as an indicator for the imminent contact with host cells which triggers early stage virulence genes.

1. Introduction

Most human cases of listeriosis are caused by the ingestion food contaminated with Listeria monocytogenes. The disease often has a mild course in healthy individuals, while the elderly, young children, pregnant women and immunocompromised people may suffer life-threatening invasive forms of listeriosis like sepsis, meningitis, or abortions [1].
During the transition along the food production chain and into the human host, L. monocytogenes is able to survive food safety measures and host defense mechanisms. Low pH is of special interest in this context because of its dual role as a food preservative and as a first line of defense in the gastrointestinal tract of the human host.
L. monocytogenes, a low-CG Gram positive organism, has a remarkable tolerance against low pH conditions [2]. This is especially relevant in food in which acid serves as a preservative, but also because strains with a higher acid tolerance might survive the low pH in the human stomach at an increased rate and therefore pose a higher risk for infection. Therefore, the potential hazard associated with a given strain of L. monocytogenes found in the food environment is affected by its degree of acid tolerance.
In general, L. monocytogenes cells faced with the challenge of an increased concentration of H+ ions have the options of (i) consuming H+ ions, e.g., through decarboxylation reactions, (ii) exporting H+ ions through pumps, and (iii) repairing the damage resulting from low pH, for instance mediated by heat shock proteins. All these mechanisms have been described for L. monocytogenes [2,3], making the acid response of L. monocytogenes a complex, highly orchestrated process that involves various components. Many genes involved in stress response in L. monocytogenes are regulated by the alternative sigma factor B (SigB) [4] and indeed sigB mutants are highly acid sensitive [5,6,7]. The glutamate amino acid decarboxylase Gad is an example for SigB-regulated acid response [8,9,10]. Gad catalyzes the formation of γ-aminobutyric acid (GABA) from glutamate in a reaction that consumes protons [11]. Other known responses to acid shock in L. monocytogenes include the SOS response regulated by RecA [12,13], the LisRK two-component system [14], the agmatine deiminase system [15], proton consumption by acetoin production [2], and, in exponential growing cells, using the F0/F1-ATP synthase in reverse to pump protons from the cytosol to the extracellular space under the expense of ATP [16].
Most work on acid tolerance in L. monocytogenes was performed using laboratory strains that have been passaged in research institutions for years [17], and few studies exist that compare the acid tolerance between different strains [18,19,20,21]. We have previously shown large differences in acid tolerance between field strains of L. monocytogenes isolated from the food and host environment [22]. Interestingly, the acid phenotype was largely strain specific and not consistently associated with lineage, serotype or clonal complex. Here, we set out to determine the mechanism by which three highly acid-tolerant field strains achieve survival under acid shock at pH 3.0 with HCL, mimicking the acidic conditions encountered during the transition from the food environment to infection of the human host. The global transcriptional response under acid stress was compared to non-stress conditions. The strains used in this study were isolated from patients or food products and are thus directly related to real-life settings.

2. Results and Discussion

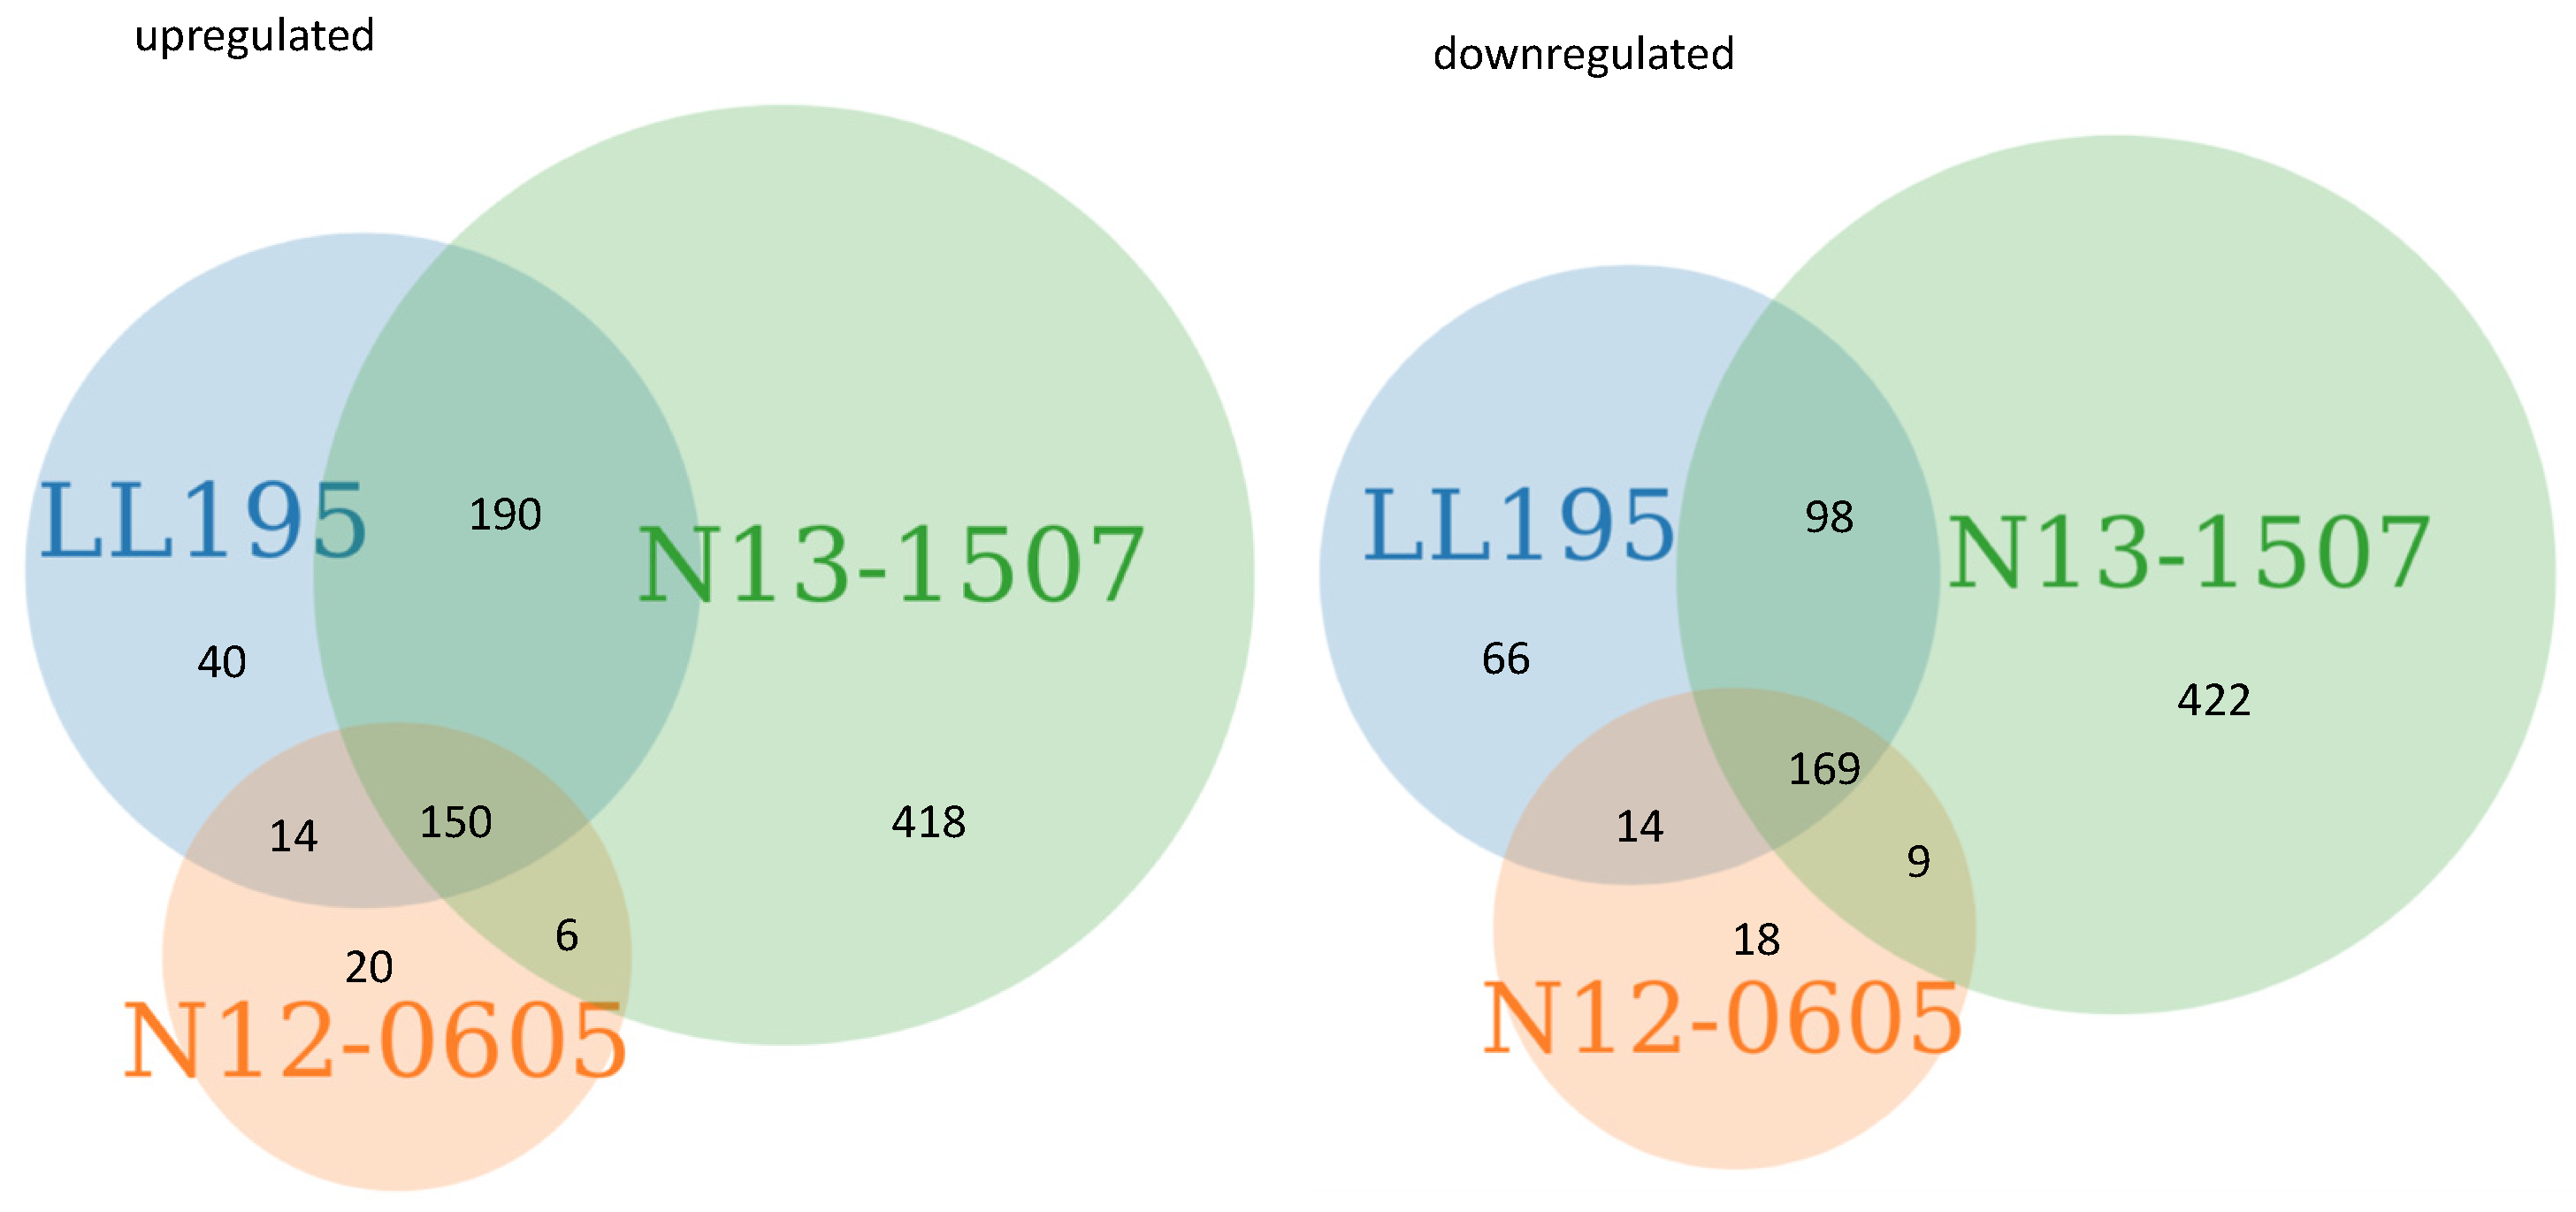
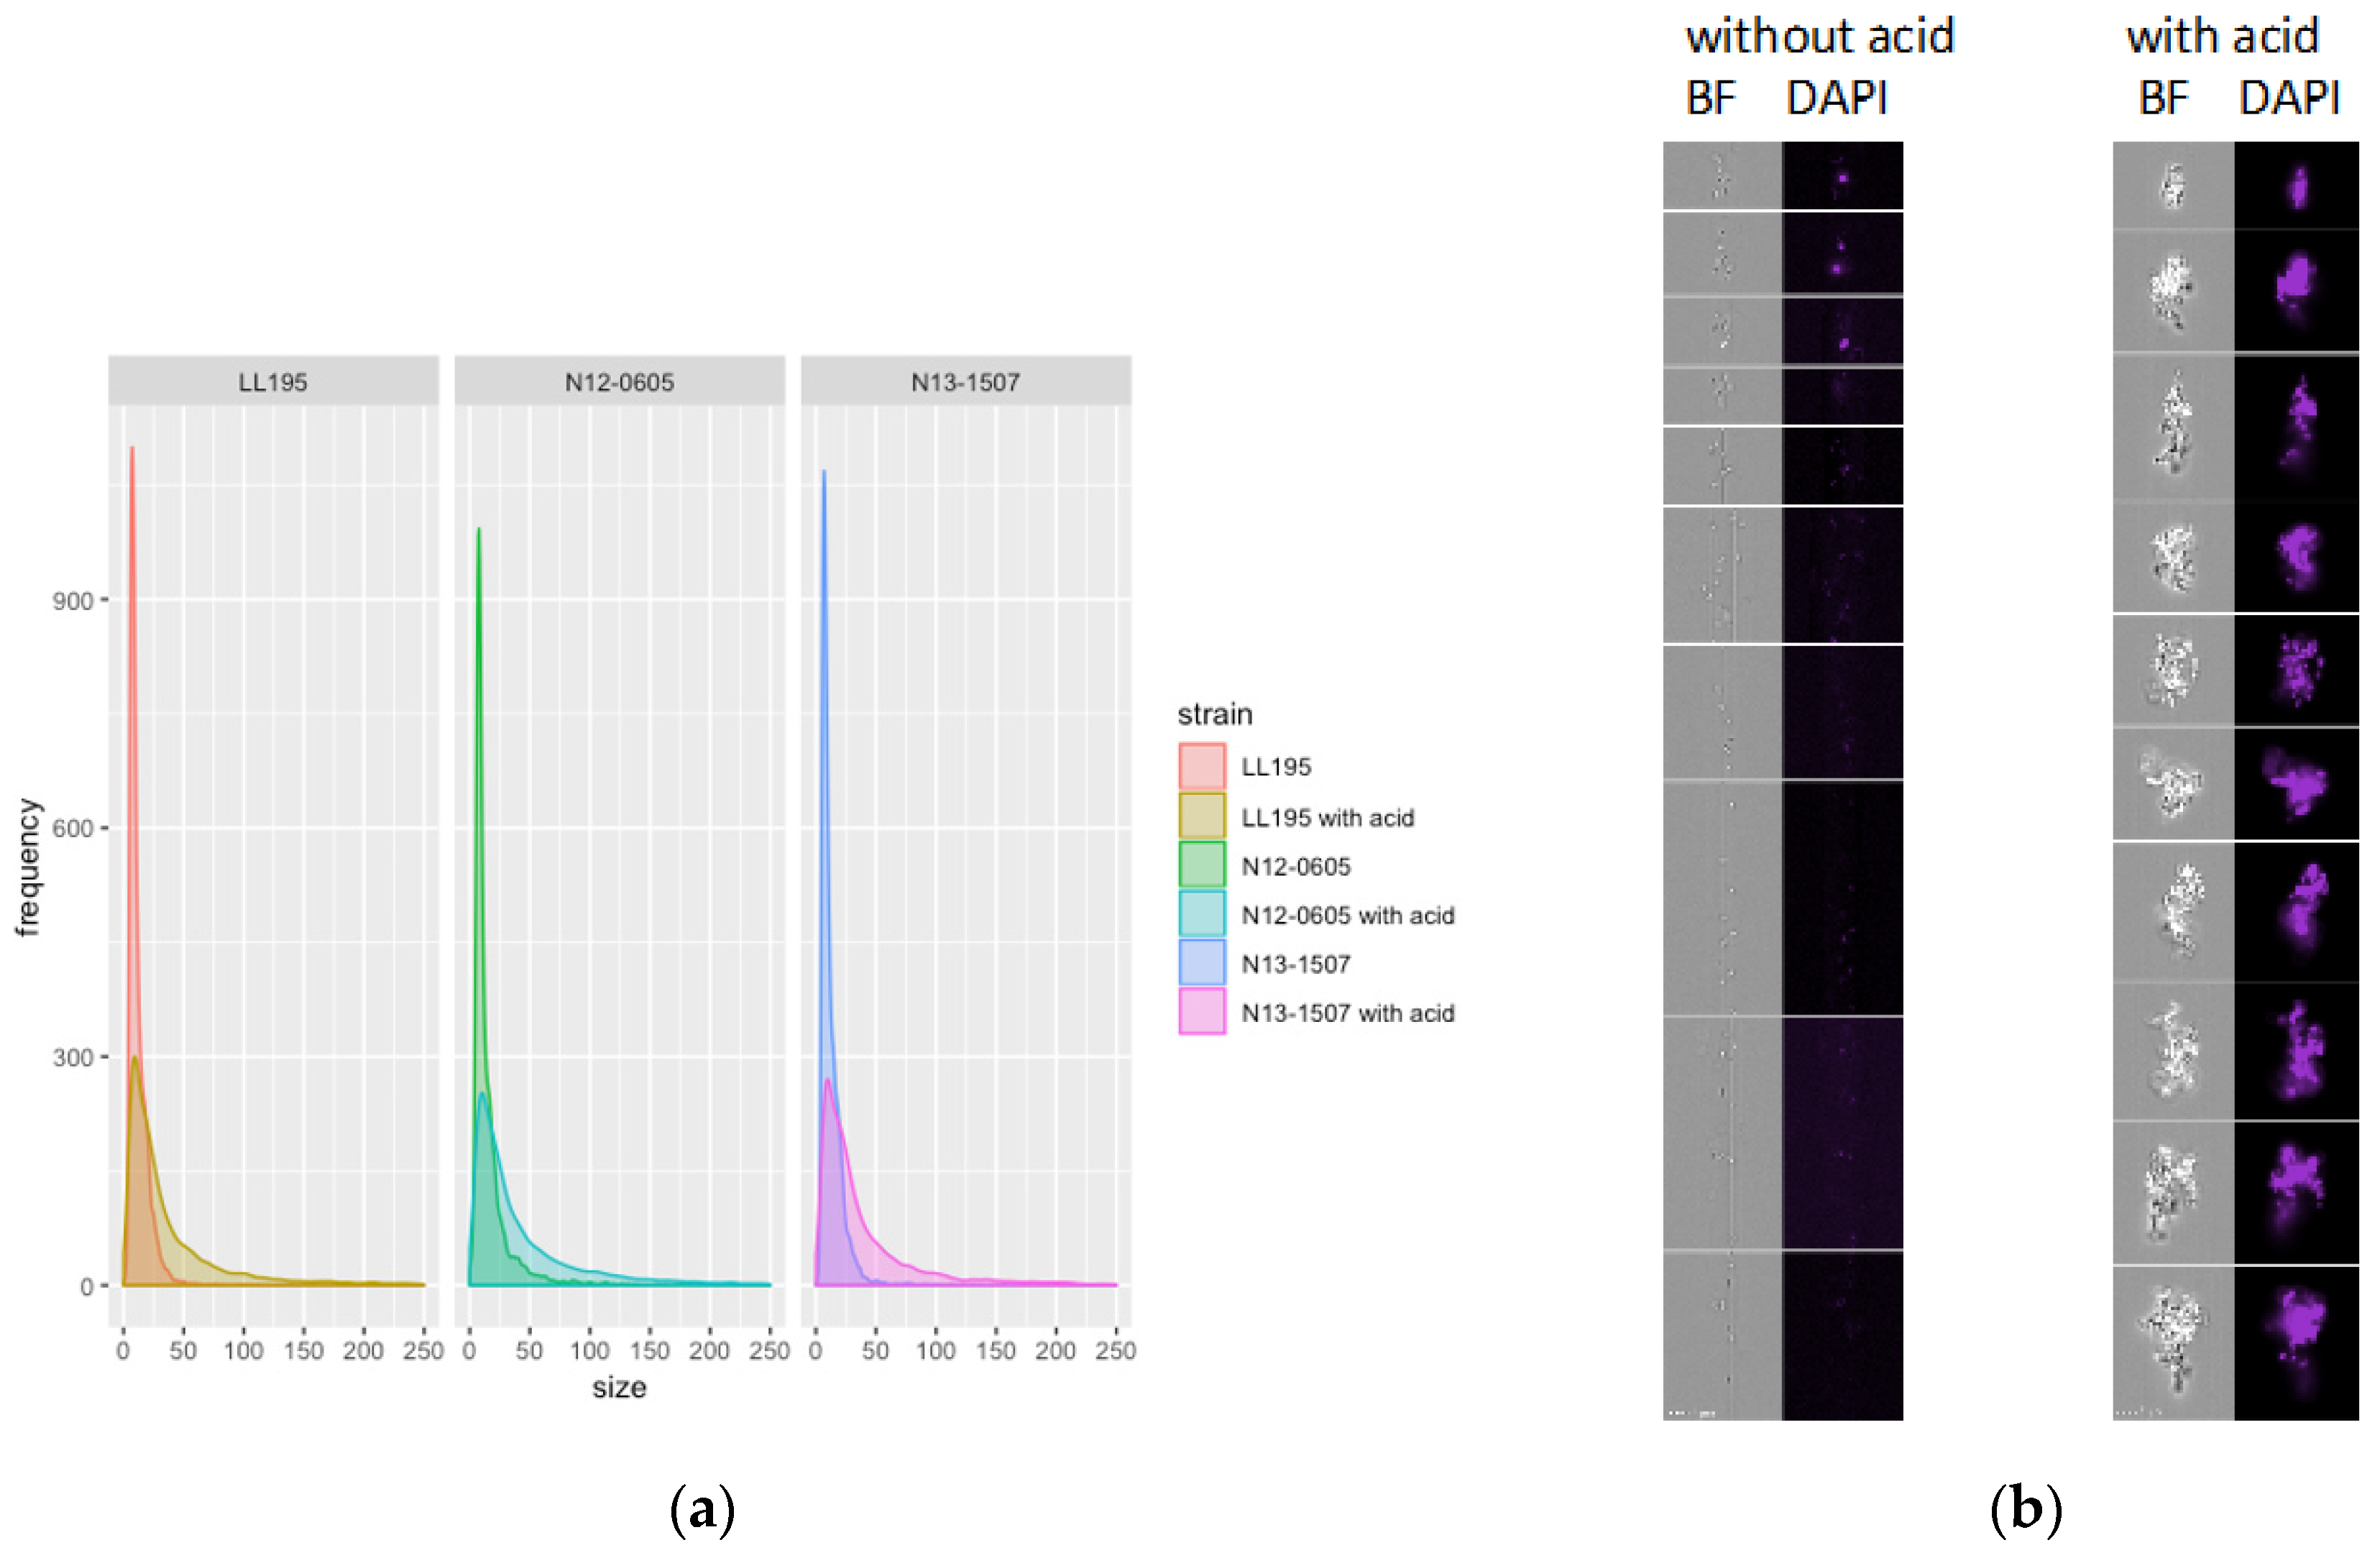
2.1. General Response of 3 Strains to Acid Stress

L. monocytogenes in early stationary phase was exposed to non-lethal acid stress with HCl at pH 3.0 for one hour, as previously described [22], and differentially expressed genes were determined in comparison to non-acid exposed controls. While the three acid-resistant strains used here ceased growing under these conditions, a large proportion of cells survived (−0.5–1 log CFU/mL, compared to −4–7 log CFU/mL in acid-sensitive strains) [22]. The number of genes that were significantly up- or downregulated were similar for LL195 (394/347 up and down regulated, respectively) and N12-0605 (380/227), but higher for N13-1507 (764/689). The core acid regulon of differentially expressed genes consisted of 150 upregulated genes and 169 downregulated genes (Figure 1, Table S1). From these gene counts, two major conclusions were drawn: (i) A considerable proportion of 319 differentially expressed genes was shared across all strains, and (ii) the acid regulon of strain N13-1507 was larger than that of LL195 and N12-0605. This difference in regulon size is likely an effect of the different genetic background of strain N13-1507 (CC6) compared to LL195 and N12-0605 (CC1). An overview of gene ontology terms associated with the up- and downregulated genes can be found in Table S2. Our further analysis focused primarily on differentially expressed genes that were shared across at least two strains in order to characterize the core acid regulon under HCl stress.

2.2. Components of the Acid Response in L. monocytogenes were Differentially Expressed after Acid Stress

A number of the genes that were differentially expressed after acid stress correspond to genes previously described as involved in the acid response of L. monocytogenes, namely the activation of the general stress response transcriptional regulator SigB, the Gad system, parts of the SOS response and the agmatine deiminase system [5,6,7,8,9,10,12,13,15].
The activation of SigB was evident in the increased transcription of lmo2230 (L. monocytogenes EGDe nomenclature) after acid stress in strains LL195 and N13-150. lmo2230 encodes an arsenate reductase that is under direct SigB control and has previously been used as a reporter for SigB activity [23,24,25].
Another SigB-regulated gene whose product is involved in the acid response of L. monocytogenes is the glutamate amino acid decarboxylase gad [26]. Amino acid decarboxylases consume protons and their activation helps alleviate intracellular acid stress. Transcripts for gad were increased in LL195 and N13-1507 after acid exposure. Other amino acid decarboxylases like the glycine decarboxylases encoded by gcvPB and gcvPA were upregulated in all three strains, and the arginine decarboxylase encoded by yaaO was upregulated in LL195 and N13-1507.
The SOS response is an inducible pathway involved in DNA repair [27], and L. monocytogenes with a deficient SOS response system (recA mutants) show impaired survival under acid stress [13]. The gene coding for the main transcriptional activator of the SOS response, recA [13], was not induced by acid stress. However, yneA is part of the L. monocytogenes SOS response [13] and was upregulated in all three strains.
In addition to the above-mentioned mechanisms, L. monocytogenes have been shown to use the agmatine deiminase system to alleviate acid stress [28]. Agmatine catabolism produces ATP and releases NH3, which helps raise the intracellular pH. In our dataset, the agmatine deiminase encoded by aguA1 was upregulated in N13-1507 after acid stress.

2.3. Genes Involved in Cell Division and Gene Expression were Downregulated after Acid Stress

After comparing the transcriptional response to known acid responses, we used KEGG [29], gene ontology (GO) enrichment [30] and manual analysis to identify novel components of the acid response in these three L. monocytogenes field strains (Table S2).
Genes whose products are involved in genome replication and partition (dnaG, smc) and genes coding for cell envelope components (fabG, dat, tarL, tagB, tagF, and dltCD) were downregulated in all three strains in the post-acid dataset, which is in agreement with the observed growth arrest. GO term analysis showed that the GO terms “gene expression” (GO:0010467), “ribonucleoside triphosphate biosynthetic process” (GO:0009201), several terms associated with tRNA aminoacylation (GO:0006399, GO:0006418, GO:0043039), “aminoacyl-tRNA ligase activity” (GO:0004812), “translation” (GO:0006412), and several terms associated with ribosomal components (GO:0003735, GO:0015934, GO:0015935) were enriched among the downregulated genes in all three strains, which again corresponds with the growth arrest and points toward an overall decreased metabolic activity of the cells. For instance, transcripts for the rpoA RNA polymerase subunit were downregulated in all three strains post acid stress. Reduced translation was apparent in the downregulation of 26 ribosomal proteins, 14 tRNA ligases, the translation initiation factors infA and infC, and the elongation factor fusA in all three strains.

2.4. Changes in Metabolism after Acid Stress

All strains showed profound changes in carbon metabolism after acid stress. Among the top upregulated genes, a cluster of phosphotransferase systems (PTSs) was evident. A Fisher’s exact test confirmed that PTS were significantly upregulated in all three strains (p < 0.0001 in LL195 and N13-1507, p = 0.028 in N12-0605). Specifically, the EIIA components of fructose, mannose, galacitol, lactose, and glycerol PTSs were upregulated after acid stress in all strains. Additionally, the transcriptional regulator of a cellobiose PTS, licR, and all components of the glycerol catabolism pathway (glpF, golD, dhaKLM) were upregulated in all three strains in the post-acid dataset.
Upregulation of PTS systems and the glycerol catabolism pathway has been observed in other organisms, for instance in the low-G+C Gram positive Lactococcus lactis, where exposure to pH 5.1 resulted in a significant upregulation of a cellobiose PTS [31]. This may indicate an increased demand of alternative carbon sources by the cells. The experiments were performed in BHI with an initial glucose content of 2 g/L and glucose starvation is an unlikely cause for this apparent need for alternative carbon sources. The upregulation of PTS under acid stress therefore indicates a release of the carbon catabolite repression (CCR) under acid stress. CCR is mediated by a global transcriptional regulator: The catabolite control protein A (CcpA), which is activated by HPr phosphorylated at serine 46 (HPr-ser46). Phosphorylation of HPr is catalyzed by the HPr kinase/phosphatase (HprK/P), which is a sensor of the energy state within the cell (reviewed in [32]). A study in B. subtilis [33] correlated HprK/P activity with pH and showed that lowering the reaction pH lead to a shift towards phosphatase activity in HprK/P. As a consequence, HPr-ser46 was not phosphorylated, and hence CcpA did no longer repress the catabolite promoters. Because CCR is highly conserved in firmicutes [34] a similar mechanism may be responsible for the observed de-repression of the CCR in L. monocytogenes.
In addition, the fumarate reductase flavoprotein subunit, which is part of the citric acid cycle, was downregulated after acid stress in all strains.

2.5. Shift in Pyruvate Fermentation

L. monocytogenes can ferment pyruvate to lactate in the presence of abundant NADH. In the absence of NADH, fermentation shifts to the reaction from pyruvate to acetoin via 2-acetolactate in reactions that use one proton each [35]. The reaction from pyruvate to 2-acetolactate is catalyzed by the acetolactate synthase encoded by ilvB, ilvH, and alsS, the reaction from 2-acetolactate to R-acetoin by alpha-acetolactate decarboxylase encoded by alsD. Of these, alsD was upregulated after acid stress in all three strains. alsS was upregulated in N13-1507 and LL195, and ilvB was upregulated in N13-1507. This shift to producing acetoin may alleviate acid stress by consuming protons and by not using the alternative pathway of fermenting pyruvate to lactic acid [36,37]. AlsS and alsD were also upregulated after exposure of L. monocytogenes EGDe [38] and H7858 [39] to organic acids.

2.6. Genes Involved in Cell Wall Biology and Biofilm Formation were Differentially Expressed after Acid Stress

The GO terms “membrane” (GO:0016020), “cell wall” (GO:0005618) and “plasma membrane” (GO:0005886) were enriched among the genes that were downregulated after acid stress in all three strains, consistent with growth arrest. In contrast, more than ten GO terms associated with the cell envelope (i.e., GO:0005887, GO:0016021, GO:0020002, GO:0031224, GO:0031226, GO:0032977, GO:0033644, GO:0044218, GO:0044279, GO:0044425 GO:0051205, GO:0051668, GO:0061024, GO:0016998) were enriched in the set of upregulated genes after acid stress in at least one strain. This suggests profound remodeling of the cell envelope in response to acid stress. In addition, several genes coding for proteins involved in cell wall functions, such as the SOS response member yneA, the cell shape factor ylmH and the membrane insertion factor yidD were upregulated in all strains, while the membrane insertion factor yidC was upregulated in N13-1507.
Comparative microscopy of Gram-stained L. monocytogenes cells before and after acid stress suggested that L. monocytogenes elongated and aggregated with acid stress (Figure S1), and an image stream analysis confirmed that individual cells were larger after acid stress (p < 0.001) (Figure 2a).
Cell elongation under different stress conditions has been shown for a variety of organisms and stress conditions; e.g., in Salmonella Enteritidis after cold stress [40], in L. monocytogenes after salt stress [41] and in L. monocytogenes, Bacillus and Clostridium species after acid stress [42]. In L. monocytogenes and B. subtilis, induction of yneA by the SOS response resulted in elongated cells [13,43], possibly by the accumulation of YneA at the cell center which prevented septum formation [43]. YlmH has been described in B. subtilis as a “factor involved in shape determination” [44,45] and the ylm cluster of genes has been speculated to be involved in cell division [46]. Hence it is conceivable that the combined effect of increased transcription of ylmH and yneA may have caused the observed cell elongation after acid stress.
The image stream analysis also revealed an increase in aggregates of cells in the post acid stress samples compared to the controls (Figure 2b). LuxS and yneA were upregulated under acid stress in all three strains. The products of these genes are involved in early and late stage biofilm formation, respectively [47,48,49]. AgrD, another early stage biofilm gene [50], was upregulated in N12-0605 and N13-1507 after acid exposure. Biofilm formation and secretion of extracellular matrix may offer an explanation for the observed increase of cell clumping after acid exposure, since the matrix may cause cells to stick together in biofilm microcolonies.
Remarkably, the biofilm dispersion locus A (bldA) (responsible for dispersion of cells from mature biofilm by lowering their adherence in Pseudomonas aeruginosa [51]) was downregulated in LL195 and N13-1507 after acid stress.
Taken together, our data support a model where the formation of biofilm microcolonies is used as a strategy to combat acid stress by creating a slightly more favorable microenvironment in the immediate vicinity of cells. L. monocytogenes showed more efficient adherence to stainless steel when grown in medium adjusted to pH 6.0 compared to pH 7.3 [52], while pre-exposure to acidic conditions did not affect the biofilm formation ability at neutral pH [53].
Our study describes, to the best of our knowledge, for the first time the formation of aggregates of L. monocytogenes stationary phase cells after acid stress.

2.7. Genes Involved in Cellular Respiration were Differentially Expressed after Acid Stress

Expulsion of protons from the cytoplasm is an effective strategy to relieve acid stress [2]. During aerobic respiration, the electron transport chain mediates the translocation of protons across the cell wall. This generates a proton gradient that is subsequently used to drive the ATP synthase. GO term enrichment analysis showed that several components of this system were overrepresented among the upregulated genes (“electron transport chain” GO:0022900, “respiratory electron transport chain” GO:0022904, “ATP synthesis coupled electron transport” GO:0042773). The cytochrome BC complex uses redox reactions between quinone/quinol to power the electron transport chain, with molybdopterins acting as cofactors in the quinone/quinol cycling [54,55]. Genes coding for quinol oxidase subunits three and four (qoxC and qoxD) were upregulated in all three strains, while genes coding for quinol oxidase subunits one and two (qoxB and qoxA) were upregulated in LL195 and N13-1507. Molybdopterin moaB was upregulated in all three strains after acid exposure, while moeA, mobB, moaEI and moaD were upregulated in LL195 and N13-1507. Cytochromes depend on insertases for their correct insertion into cell membranes [56]. In line with this, yidD has been upregulated in all three strains after acid stress. yidD codes for a membrane protein insertion efficiency factor, and YidD in concert with YidC have been shown to be involved in the insertion of cytochrome oxidases as well as the F0c subunit of the ATPase into the membrane in Escherichia coli [57].
These results suggest that L. monocytogenes is using the electron transport chain to pump protons out of the cytosol to relieve acid stress. An analogous mechanism has been speculated for Bacillus cereus and Bacillus subtilis under acid stress [37,58]. In contrast, L. monocytogenes exponential phase cells, but not stationary phase cells, use the ATP synthase in reverse to pump protons out of the cytosol under the use of ATP [16].
The proton gradient created through respiration is used by the ATP synthase to drive ATP synthesis. GO term analysis showed that genes encoding subunits of the ATP synthase were downregulated after acid stress (“proton-transporting ATP synthase complex” GO:0045259, “plasma membrane proton-transporting ATP synthase complex” GO:0045260, “proton-transporting ATP synthase complex, catalytic core F(1)” GO:0045261, “plasma membrane proton-transporting ATP synthase complex, catalytic core F(1)” GO:0045262). Specifically, atpC, atpH, atpD2, atpG, and yscN were downregulated in all three strains after acid stress, and all additional genes that belong to the ATP synthase complex (atpC, atpA2, atpE, atpC, atpI, atpF) were downregulated in at least one strain after acid stress. The efficiency of the respiratory chain to pump protons out of the cytosol, as proposed above, would to a degree be abolished if the ATP synthase is then used to import H+ ions into the cell again. The observed downregulation of transcripts coding for the ATP synthase can therefore be seen as a strategy to increase the efficiency of stress relieve generated by the upregulation of proton pumps in the respiratory chain. Interestingly, high pH stress in E. coli results in F1F0 ATP synthase upregulation, suggesting that the ATP synthase was used to import H+ [59]. Arguably, downregulating the ATP synthase would result in decreased ATP production solely via glycolysis. However, we found no evidence of upregulation of alternative pathways for ATP synthesis. This may explain the observed growth arrest and reduced metabolism.
Also, the increased activity of the respiratory chain regenerates more NAD from NADH. Hence, NAD regeneration reactions such as lactate formation from pyruvate are not needed. This enables the observed activation of the proton consuming pathway from pyruvate to acetoin.
Taken together, these results show for the first time that L. monocytogenes stationary phase cells under HCl stress increase the expression of proton pumps in the respiratory chain, while at the same time reducing the activity of the ATP synthase, resulting in a net loss of H+ from the cells.

2.8. Cell Motility Related Genes were Downregulated after Acid Stress

All three strains used in this study were motile at 37 °C (Figure S2). The GO term “cell motility” (GO:0048870) and eight GO terms associated with different parts of the flagella (GO:0001539, GO:0009288, GO:0009420, GO:0009424, GO:0009425, GO:0030694, GO:0044461, GO:0055040) were enriched among genes that were downregulated after acid stress. Accordingly, genes involved in cellular motility, e.g., flagellar synthesis genes (flaA, fliEFGM, flgB, flgC, flgEGKL, motB and lmo0707) and genes involved in chemotaxis (cheARVY, and pomA) were downregulated in all three strains after acid stress.
Repression of flagella is in line with the previously described repression of flaA or the gene sets “cellular processes: chemotaxis and motility” repressed after long term exposure to pH 5.5 [60,61].
Flagella are strong immunogens [62] and consume considerable amounts of energy [63]—hence it makes evolutionary sense for a pathogen to tightly control their expression. Motile L. monocytogenes 10403S outcompeted otherwise isogenic, non-motile ΔflaA mutants in vivo [64], and exposure to bile in the duodenum induced the expression of motility genes in L. monocytogenes 10403S and H7858 [65].
Combined with these other studies, our data support the hypothesis that flagella are suppressed during exposure to acid mimicking the first stages of infection, i.e., the exposure to HCl in the stomach (this study). Upon entry into the duodenum, flagella are expressed to facilitate the physical contact with host cells [64], possibly by using bile as a signal for imminent host cell contact [65].

2.9. Early-Stage Virulence Genes were Upregulated after Acid Stress

In a next step, the response of virulence genes to acid was studied. Transcripts for the positive regulatory factor A (prfA) were upregulated in post-acid stress for N13-1507 and LL195. PrfA is the main transcriptional regulator of virulence genes in L. monocytogenes [66]. Further, genes that belong to the PrfA regulon, inlA and hly, were highly induced in all three strains after acid stress. hly codes for the pore-forming toxin listeriolysin O [67], while inlA encodes an internalin that is important for cell adhesion and host cell invasion [68]. Both the products of inlA and hly are involved in early steps of host cell invasion. In contrast, virulence genes involved in later steps of host cell invasion such as plcA, actA, mpl, and plcB were not induced by acid stress. Additionally, in order to be in its active form, PrfA needs glutathione as a cofactor, and both PrfA itself and glutathione need to be reduced by thioredoxins and glutathione reductases [69,70]. Remarkably, three thioredoxins (trxA, trx1 and lmo2152) and trxB (thioredoxin reductase) were upregulated in all three strains. Taken together, our data indicate that the exposure of L. monocytogenes to HCl during the gastric passage could lead to an induction of parts of the PrfA regulon, specifically InlA which is used to attach to host cells and LLO which is needed to escape the phagocytic vacuole. PrfA itself is regulated by a positive feedback loop and it is positively co-regulated by SigB [71]. The increased amounts of active SigB as well as activated PrfA after acid stress may jointly have led to increased prfA transcription, which is also evident in other studies that found prfA itself or PrfA-dependent genes upregulated after exposure of L. monocytogenes to organic and inorganic acids [39,60,61,72,73].

2.10. Promoter Analysis of Differentially Expressed Genes

A motif search within the first 150 bp upstream of differentially expressed genes identified the involvement of two potential regulatory sequences in the regulation of the acid stress response (Figure 3a). The genome sequences of all strains were then screened for these motifs to identify potential co-regulation of genes by novel regulatory mechanisms.
Motif 14_0047 is a palindromic sequence that is homologous to the consensus binding sequence for the transcriptional regulator of ferric uptake Fur in B. subtilis [74]. It was identified in six instances in LL195 and five in N12-0605 and N13-1507, respectively (Table 1). Consistent with the homology to the B. subtilis Fur box, motif 14_0047 was found in front of several genes that are annotated with functions related to iron transport and management. In LL195, these were genes coding for the Iron(3+)-hydroxamate-binding protein yxeB, the iron transporter feoB, and the Fe-S protein maturation auxiliary factor sufT, of which feoB was upregulated after acid stress. Additionally, motif 14_0047 was found in front of an O-acetyl-ADP ribose homologous to lmo2759, which was also upregulated in the post-acid dataset. In N12-0605 and N13-1507, motif 14_0047 was found in front of the Fe(3+)-citrate-binding protein yfmC and sufT, both of which were upregulated after acid stress. Interestingly, upregulation of the iron transporter FeoB was also observed after exposure of L. monocytogenes to organic acids [39], and Corynebacterium glutamicum induced the iron-starvation response at pH 6.0 [75] and pH 5.7 [76] compared to neutral conditions.
Complex media such as tryptic soy broth and BHI sequester iron at low pH [76]. Therefore, the observed induction of iron transporters is likely not a direct effect of the acid response, but rather of the iron starvation induced by performing acid stress at low pH in BHI.
Motif 17_1507 was found in 15 instances in all three strains (Table 1). Notably, it was identified upstream of plcA and thioredoxins (lmo2152). In the case of plcA, the motif included the PrfA-box upstream of plcA (Figure 3b). Motif 17_1507 was also identified in front of glutathione reductases (lmo1433), which are involved in the mitigation of oxidative stress [77]. The presence of this newly identified motif 17_1507 in the promoter regions of thioredoxins and plcA is consistent with a role in PrfA regulation. Motif 17_1507 upstream of plcA included the PrfA box, which is responsible for positive autoregulation of PrfA via transcription of a bicistronic mRNA containing plcA and prfA [78]. Loss of the readthrough from the PrfA-box upstream of plcA leads to loss of virulence [79]. Whether this motif has a regulatory function and whether the binding of a transcriptional regulator to this motif has a positive or negative effect on transcription of downstream genes remains to be determined.
In conclusion, RNAseq of HCl-exposed, early stationary phase L. monocytogenes cells shows a broad reshaping of the global transcriptional profile in response to acid shock with HCl at pH 3. Compared to the controls, many downregulated genes suggested growth arrest, slower metabolism and the reduction of motility in the post-acid dataset.
Our data support a model where L. monocytogenes combats the influx of H+ by using proton pumps and proton-consuming processes such as amino acid decarboxylases, and by forming biofilm microcolonies that could serve to establish a protective microclimate. During host invasion, the low pH in the stomach may serve as a signal to induce the staggered expression of virulence genes, possibly via activation of PrfA and a potential regulatory effect of the newly identified motif upstream of virulence-associated genes.

3. Materials and Methods

3.1. Bacterial Strains

Three lineage I, serotype 4b, acid-resistant strains from Horlbog et al. [22] were included in this study (Table 2). LL195 is a well characterized strain from an outbreak in Switzerland [80]. We included a closely related CC1 strain isolated from a meat product in 2012 (N12-0605) and a CC6 strain isolated from a human patient in 2013 (N13-1507). Both N12-0605 and N13-1507 were obtained from the Swiss National Reference Centre for Enteropathogenic Bacteria and Listeria (NENT).

3.2. Growth Conditions

L. monocytogenes were maintained as 15% glycerol stocks (Sigma-Aldrich, St. Louis, Missouri, United States) at −80 °C. To obtain cultures, they were streaked onto BHI agar plates (Oxoid, Hampshire, UK) and incubated at 37 °C for 16–18 h. A single colony was inoculated into 5 mL BHI and incubated at 37 °C for 16–18 h with shaking, sub cultured 1:100 into 5 mL of fresh BHI and grown for 6 h at 37 °C with shaking to obtain an early stationary culture corresponding to OD590 1.0 plus one hour. Acid stress was performed by adding 5 mL BHI adjusted to pH 1.6 with HCl (Fluka, Bucharest, Romania). This ratio had been previously titrated to result in a final pH of 3. Our previous study showed that pH 3 is able to differentiate between acid resistant and acid sensitive strains [22]. Controls were diluted 1:1 with untreated BHI. During the acid stress, all tubes were incubated at 37 °C for one hour without shaking. To avoid artefacts due to variations in the BHI composition, all liquid BHI used in this study originated from the same batch of pre-prepared BHI.

3.3. RNA Isolation

Strains LL195 and N12-0605 were sampled in biological triplicates whereas N13-1507 was represented in duplicate due to flow cell and sequencing depth limitations. After one hour of acid exposure, or the respective control condition in BHI without acid, all reactions were stopped by the addition of 1 mL of 10% acid phenol-chlorophorm in ethanol (v/v) to the cultures, which were chilled to 4 °C immediately. To extract the total RNA, the cultures were pelleted at 20,000× g at 4 °C, resuspended in 200 µL of 10 µM Tris-buffer (Sigma-Aldrich, Buchs, Switzerland) containing 20 mg/mL lysozyme (Sigma-Aldrich) and 50 µL of 20 mg/mL proteinase K (Qiagen, Hilden, Germany) and subsequently lysed for 30 min at 37 °C. Cell lysates were then mixed with 1 mL TRI-Reagent (Invitrogen by Thermo Fischer Scientific, Carlsbad, California, United States) and bead-beaten for 2 × 60 s with cooling on ice in between in beat-beating tubes containing 1.4 mm ceramic beads (MagNA lyser green tubes, Roche, Basel, Switzerland). Subsequently the samples were centrifuged at 16,000 × g at 4 °C and the supernatant was transferred to a new tube, where 500 µL of bromo-chloro-propane (BCP, ACROS Organics, Geel, Belgium) were added. After 10 min incubation at room temperature the tubes were centrifuged for 15 min at 16,000 × g at 4 °C and the top aqueous layer was transferred into a new tube. Nucleic acids were precipitated overnight in 2.5 mL isopropanol at −80 °C. The following day, nucleic acids were pelleted, washed with 5 mL 75% ethanol, resuspended in nuclease free water and adjusted to 500 ng/µL using a nanodrop (Witec AG, Sursee, Switzerland). 3 µL Turbo DNAse (Invitrogen by Thermo Fischer Scientific) and its buffer were added to digest the genomic DNA for one hour at 37 °C, with the addition of another 3 µL Turbo DNAse after 30 min to ensure complete digestion of genomic DNA. The DNAse treatment was followed by a phenol-chloroform (Fluka) extraction and RNA precipitation in EtOH with 1.6% (v/v) 3M sodium acetate at −80 °C overnight. The RNA was pelleted and washed with 70% ethanol, dried and resuspended in 100 µL nuclease free water. Total RNA quality was assessed by a nanodrop measurement and an Agilent 2100 Bioanalyzer pico Chip.

3.4. rRNA Depletion

Ribosomal RNA was depleted with Ribo-Zero rRNA Removal Reagents (Bacteria)-Low Input and the Magnetic Core Kit-Low Input (Illumina, San Diego, California, United States) according to the manufacturer’s specifications, and purified using the Agencourt RNAClean XP Kit (Beckman Coulter Inc., Brea, California, United States). A pico chip run on the bioanalyzer 2100 confirmed the depletion of 16S and 23S rRNA.

3.5. Library Preparation and Sequencing

Library preparation was done with an Illumina TruSeq RNA stranded kit. All samples were pooled and sequenced on one lane of a Novaseq (paired-end, 150bp per read) at the Functional Genomics Centre Zürich. The data discussed in this publication have been deposited in NCBI’s Gene Expression Omnibus [81] and are accessible through GEO Series accession number GSE135966 (https://www.ncbi.nlm.nih.gov/geo/query/acc.cgi?acc=GSE135966)

3.6. RNAseq Analysis

All strains were previously sequenced in an unrelated project. Whole genome sequences are available under the NCBI Reference Sequence: NC_019556.1 for LL195, NZ_QYGN00000000.1 for stain N12-0605 and NZ_QYDR00000000.1 for stain N13-1507.
Sequenced RNA reads were aligned to their corresponding genomes using the BWA mem algorithm [82] with the default settings. Samtools [83] was used to convert and sort the output and featureCounts [84] summarized the aligned reads. Normalization and statistical calculation of differentially expressed genes was done in R with the EdegR package as described previously [85,86]. Differential expression (DE) was analyzed for each strain separately between the acid exposed sample and the control without acid. Genes or features with an FDR of <0.05 and a log2 fold change (logFC) of >1 or <−1 (representing a more than 2-fold up or down regulation) were considered significantly differentially expressed.
To identify regulatory elements a MEME search suing standard setting was performed [87,88] using the region 150-bp upstream of the start codons of differentially expressed genes. MEME motifs were filtered manually using the presence of a clear palindrome and the occurrence of a clear consensus sequence in multiple sequences as inclusion criteria. In addition, the ribosomal binding site was excluded. The subset was then subjected to a MAST analysis using the complete genomes of the 3 strains as input.
GO ontologies of genes were identified using eggNOG [89,90]. Relative enrichments were calculated using exact Fischer test available the topGO package in R [91]. Homologous proteins between the 3 strains were identified with a bi-directional best hit approach using the perl script “get_homologous” [92] and with standard settings.

3.7. Morphological Analysis

First visual inspection was done by microscopy of Gram stained cells. Acid stressed and control samples were fixed for 45 min using 1% (v/v) paraformaldehyde (PFA) in PBS directly after acid stress and stained according to standard protocols.
For flow cytometry, cells were also fixed using 1% (v/v) PFA in PBS, incubated for 45 min and DAPI (Sigma-Aldrich) was added to each sample at 1 µg/mL. The samples were then analyzed on an Image Stream X Mark II imaging flow cytometer (Merck Millipore, Burlington, Massachusetts, United States).
A tiered gating strategy was applied to gate for events in focus of the image stream and on single cells. These gates showed very accurate single cells in the control samples. However, a large quantity of aggregated cells were present in the samples after acid stress due to the intensive clumping. Gating these out would have removed more than 90% of the sample. These aggregates were therefore treated as a result rather than an artifact. Within the above-mentioned gates, Brightfield, darkfield and intensity of DAPI fluorescence was recorded for each cell in samples after acid stress and in controls. The Image Stream generated images of every event in flow which also enabled a manual validation of single events.
Motility assays were performed starting with liquid overnight cultures grown at 37 °C. A sterile 10 µL pipet tip was dipped into the culture and used to spot a small amount of culture onto 0.05% BHI soft agar plates. These were incubated for 24 h at 37 °C and photographed.

Supplementary Materials

Supplementary materials can be found at https://www.mdpi.com/2076-2607/7/10/455/s1.

Author Contributions

Conceptualization, J.A.H., R.S. and C.G.; Formal analysis, M.J.A.S.; Investigation, J.A.H.; Methodology, C.G., M.J.A.S.; Project administration, C.G.; Resources, R.S.; Software, M.J.A.S.; Supervision, C.G.; Writing—original draft, J.A.H. and C.G.; Writing—review & editing, J.A.H., M.J.A.S., R.S. and C.G.

Funding

This research received no external funding.

Acknowledgments

We thank Weihong Qi from the Functional Genomics Center Zurich for her technical support and the NENT team (National Reference Center for Enteropathogenic Bacteria and Listeria) for serotyping and storage of the strains. We would also like to thank Claudia Dumrese (Cytometry Facility, University of Zürich) for her support during the image stream analysis.

Conflicts of Interest

The authors declare no conflicts of interest.

References

  1. Thakur, M.; Asrani, R.K.; Patial, V. Listeria monocytogenes: A Food-Borne Pathogen. In Foodborne Diseases; Elsevier: Amsterdam, The Netherland, 2018; pp. 157–192. ISBN 9780128114964. [Google Scholar]
  2. Smith, J.L.; Liu, Y.; Paoli, G.C. How does Listeria monocytogenes combat acid conditions? Can. J. Microbiol. 2013, 59, 141–152. [Google Scholar] [CrossRef] [PubMed]
  3. Ryan, S.; Hill, C.; Gahan, C.G.M. Acid stress responses in Listeria monocytogenes. In Advances in Applied Microbiology; Elsevier: Amsterdam, The Netherland, 2008; Volume 65, pp. 67–91. ISBN 9780123744296. [Google Scholar]
  4. O’Byrne, C.P.; Karatzas, K.A.G. The role of Sigma B (σB) in the stress adaptations of Listeria monocytogenes: Overlaps between stress adaptation and virulence. In Advances in Applied Microbiology; Elsevier: Amsterdam, The Netherland, 2008; pp. 115–140. ISBN 9780123744296. [Google Scholar]
  5. Raengpradub, S.; Wiedmann, M.; Boor, K.J. Comparative analysis of the σB-dependent stress responses in Listeria monocytogenes and Listeria innocua strains exposed to selected stress conditions. Appl. Environ. Microbiol. 2008, 74, 158–171. [Google Scholar] [CrossRef] [PubMed]
  6. Wiedmann, M.; Arvik, T.J.; Hurley, R.J.; Boor, K.J. General stress transcription factor sigmaB and its role in acid tolerance and virulence of Listeria monocytogenes. J. Bacteriol. 1998, 180, 3650–3656. [Google Scholar] [PubMed]
  7. Ferreira, A.; O’Byrne, C.P.; Boor, K.J. Role of σB in heat, ethanol, acid, and oxidative stress resistance and during carbon starvation in Listeria monocytogenes. Appl. Environ. Microbiol. 2001, 67, 4454–4457. [Google Scholar] [CrossRef] [PubMed]
  8. Cotter, P.D.; Hill, C. Surviving the acid test: Responses of Gram-positive bacteria to low pH. Microbiol. Mol. Biol. Rev. 2003, 67, 429–453. [Google Scholar] [CrossRef]
  9. Abram, F.; Starr, E.; Karatzas, K.A.G.; Matlawska-Wasowska, K.; Boyd, A.; Wiedmann, M.; Boor, K.J.; Connally, D.; O’Byrne, C.P. Identification of Components of the Sigma B Regulon in Listeria monocytogenes That Contribute to Acid and Salt Tolerance. Appl. Environ. Microbiol. 2008, 74, 6848–6858. [Google Scholar] [CrossRef]
  10. Wemekamp-Kamphuis, H.H.; Wouters, J.A.; de Leeuw, P.P.L.A.; Hain, T.; Chakraborty, T.; Abee, T. Identification of Sigma Factor B-Controlled Genes and Their Impact on Acid Stress, High Hydrostatic Pressure, and Freeze Survival in Listeria monocytogenes EGD-e. Appl. Environ. Microbiol. 2004, 70, 3457–3466. [Google Scholar] [CrossRef]
  11. Cotter, P.D.; Gahan, C.G.M.; Hill, C. A glutamate decarboxylase system protects Listeria monocytogenes in gastric fluid. Mol. Microbiol. 2001, 40, 465–475. [Google Scholar] [CrossRef]
  12. van der Veen, S.; Abee, T. Contribution of Listeria monocytogenes RecA to acid and bile survival and invasion of human intestinal Caco-2 cells. Int. J. Med. Microbiol. 2011, 301, 334–340. [Google Scholar] [CrossRef]
  13. van der Veen, S.; van Schalkwijk, S.; Molenaar, D.; de Vos, W.M.; Abee, T.; Wells-Bennik, M.H.J. The SOS response of Listeria monocytogenes is involved in stress resistance and mutagenesis. Microbiology 2010, 156, 374–384. [Google Scholar] [CrossRef]
  14. Cotter, P.D.; Emerson, N.; Gahan, C.G.; Hill, C. Identification and disruption of lisRK, a genetic locus encoding a two-component signal transduction system involved in stress tolerance and virulence in Listeria monocytogenes. J. Bacteriol. 1999, 181, 6840–6843. [Google Scholar] [PubMed]
  15. Soares, C.A.; Knuckley, B. Mechanistic studies of the agmatine deiminase from Listeria monocytogenes. Biochem. J. 2016, 473, 1553–1561. [Google Scholar] [CrossRef] [PubMed]
  16. Datta, A.R.; Benjamin, M.M. Factors controlling acid tolerance of Listeria monocytogenes: Effects of nisin and other ionophores. Appl. Environ. Microbiol. 1997, 63, 4123–4126. [Google Scholar] [PubMed]
  17. Bécavin, C.; Bouchier, C.; Lechat, P.; Archambaud, C.; Creno, S.; Gouin, E.; Wu, Z.; Kühbacher, A.; Brisse, S.; Pucciarelli, M.G.; et al. Comparison of widely used Listeria monocytogenes strains EGD, 10403S, and EGD-e highlights genomic variations underlying differences in pathogenicity. MBio 2014, 5, e00969-14. [Google Scholar] [CrossRef]
  18. Lundén, J.; Tolvanen, R.; Korkeala, H. Acid and heat tolerance of persistent and nonpersistent Listeria monocytogenes food plant strains. Lett. Appl. Microbiol. 2007, 46, 276–280. [Google Scholar] [CrossRef]
  19. Skandamis, P.N.; Gounadaki, A.S.; Geornaras, I.; Sofos, J.N. Adaptive acid tolerance response of Listeria monocytogenes strains under planktonic and immobilized growth conditions. Int. J. Food Microbiol. 2012, 159, 160–166. [Google Scholar] [CrossRef]
  20. Liu, D.; Lawrence, M.L.; Ainsworth, A.J.; Austin, F.W. Comparative assessment of acid, alkali and salt tolerance in Listeria monocytogenes virulent and avirulent strains. FEMS Microbiol. Lett. 2005, 243, 373–378. [Google Scholar] [CrossRef]
  21. Lianou, A.; Stopforth, J.D.; Yoon, Y.; Wiedmann, M.; Sofos, J.N. Growth and Stress Resistance Variation in Culture Broth among Listeria monocytogenes Strains of Various Serotypes and Origins. J. Food Prot. 2006, 69, 2640–2647. [Google Scholar] [CrossRef]
  22. Horlbog, J.A.; Kent, D.; Stephan, R.; Guldimann, C. Surviving host—And food relevant stresses: Phenotype of L. monocytogenes strains isolated from food and clinical sources. Sci. Rep. 2018, 8, 12931. [Google Scholar] [CrossRef]
  23. Ondrusch, N.; Kreft, J. Blue and red light modulates SigB-dependent gene transcription, swimming motility and invasiveness in Listeria monocytogenes. PLoS ONE 2011, 6, e16151. [Google Scholar] [CrossRef]
  24. Utratna, M.; Cosgrave, E.; Baustian, C.; Ceredig, R.; O’Byrne, C. Development and optimization of an EGFP-based reporter for measuring the general stress response in Listeria monocytogenes. Bioengineered 2012, 3, 93–103. [Google Scholar] [CrossRef] [PubMed]
  25. Guldimann, C.; Guariglia-Oropeza, V.; Harrand, S.; Kent, D.; Boor, K.J.; Wiedmann, M. Stochastic and Differential Activation of σB and PrfA in Listeria monocytogenes at the Single Cell Level under Different Environmental Stress Conditions. Front. Microbiol. 2017, 8. [Google Scholar] [CrossRef] [PubMed]
  26. Ferreira, A.; Sue, D.; O’Byrne, C.P.; Boor, K.J. Role of Listeria monocytogenes sigma(B) in survival of lethal acidic conditions and in the acquired acid tolerance response. Appl. Environ. Microbiol. 2003, 69, 2692–2698. [Google Scholar] [CrossRef] [PubMed]
  27. Baharoglu, Z.; Mazel, D. SOS, the formidable strategy of bacteria against aggressions. FEMS Microbiol. Rev. 2014, 38, 1126–1145. [Google Scholar] [CrossRef] [Green Version]
  28. Cheng, C.; Chen, J.; Fang, C.; Xia, Y.; Shan, Y.; Liu, Y.; Wen, G.; Song, H.; Fang, W. Listeria monocytogenes aguA1, but Not aguA2, Encodes a Functional Agmatine Deiminase. J. Biol. Chem. 2013, 288, 26606–26615. [Google Scholar] [CrossRef]
  29. Ogata, H.; Goto, S.; Sato, K.; Fujibuchi, W.; Bono, H.; Kanehisa, M. KEGG: Kyoto Encyclopedia of Genes and Genomes. Nucleic Acids Res. 1999, 27, 29–34. [Google Scholar] [CrossRef] [Green Version]
  30. Mi, H.; Muruganujan, A.; Ebert, D.; Huang, X.; Thomas, P.D. PANTHER version 14: More genomes, a new PANTHER GO-slim and improvements in enrichment analysis tools. Nucleic Acids Res. 2019, 47, D419–D426. [Google Scholar] [CrossRef]
  31. Carvalho, A.L.; Turner, D.L.; Fonseca, L.L.; Solopova, A.; Catarino, T.; Kuipers, O.P.; Voit, E.O.; Neves, A.R.; Santos, H. Metabolic and Transcriptional Analysis of Acid Stress in Lactococcus lactis, with a Focus on the Kinetics of Lactic Acid Pools. PLoS ONE 2013, 8, e68470. [Google Scholar] [CrossRef]
  32. Fujita, Y. Carbon catabolite control of the metabolic network in Bacillus subtilis. Biosci. Biotechnol. Biochem. 2009, 73, 245–259. [Google Scholar] [CrossRef]
  33. Ramström, H.; Sanglier, S.; Leize-Wagner, E.; Philippe, C.; Van Dorsselaer, A.; Haiech, J. Properties and Regulation of the Bifunctional Enzyme HPr Kinase/Phosphatase in Bacillus subtilis. J. Biol. Chem. 2003, 278, 1174–1185. [Google Scholar] [CrossRef]
  34. Warner, J.B.; Lolkema, J.S. CcpA-dependent carbon catabolite repression in bacteria. Microbiol. Mol. Biol. Rev. 2003, 67, 475–490. [Google Scholar] [CrossRef] [PubMed]
  35. Romick; Fleming Acetoin production as an indicator of growth and metabolic inhibition of Listeria monocytogenes. J. Appl. Microbiol. 1998, 84, 18–24. [CrossRef] [PubMed]
  36. Tsau, J.L.; Guffanti, A.A.; Montville, T.J. Conversion of Pyruvate to Acetoin Helps to Maintain pH Homeostasis in Lactobacillus plantarum. Appl. Environ. Microbiol. 1992, 58, 891–894. [Google Scholar]
  37. Wilks, J.C.; Kitko, R.D.; Cleeton, S.H.; Lee, G.E.; Ugwu, C.S.; Jones, B.D.; BonDurant, S.S.; Slonczewski, J.L. Acid and Base Stress and Transcriptomic Responses in Bacillus subtilis. Appl. Environ. Microbiol. 2009, 75, 981–990. [Google Scholar] [CrossRef] [PubMed]
  38. Bowman, J.P.; Lee Chang, K.J.; Pinfold, T.; Ross, T. Transcriptomic and phenotypic responses of Listeria monocytogenes strains possessing different growth efficiencies under acidic conditions. Appl. Environ. Microbiol. 2010, 76, 4836–4850. [Google Scholar] [CrossRef]
  39. Stasiewicz, M.J.; Wiedmann, M.; Bergholz, T.M. The transcriptional response of Listeria monocytogenes during adaptation to growth on lactate and diacetate includes synergistic changes that increase fermentative acetoin production. Appl. Environ. Microbiol. 2011, 77, 5294–5306. [Google Scholar] [CrossRef]
  40. Phillips; Humphrey; Lappin-Scott Chilling invokes different morphologies in two Salmonella Enteritidis PT4 strains. J. Appl. Microbiol. 1998, 84, 820–826. [CrossRef]
  41. Isom, L.L.; Khambatta, Z.S.; Moulf, J.L.; Akers, D.F.; Martin, S.E. Filament Formation in Listeria monocytogenes. J. Food Prot. 1995, 58, 1031–1033. [Google Scholar] [CrossRef]
  42. Everis, L.; Betts, G. pH stress can cause cell elongation in Bacillus and Clostridium species: A research note. Food Control 2001, 12, 53–56. [Google Scholar] [CrossRef]
  43. Kawai, Y.; Moriya, S.; Ogasawara, N. Identification of a protein, YneA, responsible for cell division suppression during the SOS response in Bacillus subtilis. Mol. Microbiol. 2003, 47, 1113–1122. [Google Scholar] [CrossRef]
  44. Molle, V.; Fujita, M.; Jensen, S.T.; Eichenberger, P.; González-Pastor, J.E.; Liu, J.S.; Losick, R. The Spo0A regulon of Bacillus subtilis. Mol. Microbiol. 2003, 50, 1683–1701. [Google Scholar] [CrossRef] [PubMed]
  45. Sierro, N.; Makita, Y.; de Hoon, M.; Nakai, K. DBTBS: A database of transcriptional regulation in Bacillus subtilis containing upstream intergenic conservation information. Nucleic Acids Res. 2008, 36, D93–D96. [Google Scholar] [CrossRef] [PubMed]
  46. Fadda, D.; Pischedda, C.; Caldara, F.; Whalen, M.B.; Anderluzzi, D.; Domenici, E.; Massidda, O. Characterization of divIVA and Other Genes Located in the Chromosomal Region Downstream of the dcw Cluster in Streptococcus pneumoniae. J. Bacteriol. 2003, 185, 6209–6214. [Google Scholar] [CrossRef] [PubMed]
  47. Challan Belval, S.; Gal, L.; Margiewes, S.; Garmyn, D.; Piveteau, P.; Guzzo, J. Assessment of the Roles of LuxS, S-Ribosyl Homocysteine, and Autoinducer 2 in Cell Attachment during Biofilm Formation by Listeria monocytogenes EGD-e. Appl. Environ. Microbiol. 2006, 72, 2644–2650. [Google Scholar] [CrossRef] [PubMed]
  48. van der Veen, S.; Abee, T. Dependence of Continuous-Flow Biofilm Formation by Listeria monocytogenes EGD-e on SOS Response Factor YneA. Appl. Environ. Microbiol. 2010, 76, 1992–1995. [Google Scholar] [CrossRef] [PubMed]
  49. Renier, S.; Hébraud, M.; Desvaux, M. Molecular biology of surface colonization by Listeria monocytogenes: An additional facet of an opportunistic Gram-positive foodborne pathogen. Environ. Microbiol. 2011, 13, 835–850. [Google Scholar] [CrossRef]
  50. Riedel, C.U.; Monk, I.R.; Casey, P.G.; Waidmann, M.S.; Gahan, C.G.M.; Hill, C. AgrD-dependent quorum sensing affects biofilm formation, invasion, virulence and global gene expression profiles in Listeria monocytogenes. Mol. Microbiol. 2009, 71, 1177–1189. [Google Scholar] [CrossRef]
  51. Morgan, R.; Kohn, S.; Hwang, S.-H.; Hassett, D.J.; Sauer, K. BdlA, a Chemotaxis Regulator Essential for Biofilm Dispersion in Pseudomonas aeruginosa. J. Bacteriol. 2006, 188, 7335–7343. [Google Scholar] [CrossRef]
  52. Briandet, R.; Leriche, V.; Carpentier, B.; Bellon-Fontain, M.-N. Effects of the growth procedure on the surface hydrophobicity of Listeria monocytogenes cells and their adhesion to stainless steel. J. Food Prot. 1999, 62, 994–998. [Google Scholar] [CrossRef]
  53. Barbosa, J.; Borges, S.; Camilo, R.; Magalhães, R.; Ferreira, V.; Santos, I.; Silva, J.; Almeida, G.; Teixeira, P. Biofilm Formation among Clinical and Food Isolates of Listeria monocytogenes. Int. J. Microbiol. 2013, 2013, 524975. [Google Scholar] [CrossRef]
  54. Simon, J.; van Spanning, R.J.M.; Richardson, D.J. The organisation of proton motive and non-proton motive redox loops in prokaryotic respiratory systems. Biochim. Biophys. Acta Bioenerg. 2008, 1777, 1480–1490. [Google Scholar] [CrossRef] [PubMed]
  55. Magalon, A.; Fedor, J.G.; Walburger, A.; Weiner, J.H. Molybdenum enzymes in bacteria and their maturation. Coord. Chem. Rev. 2011, 255, 1159–1178. [Google Scholar] [CrossRef]
  56. Hennon, S.W.; Soman, R.; Zhu, L.; Dalbey, R.E. YidC/Alb3/Oxa1 family of insertases. J. Biol. Chem. 2015, 290, 14866–14874. [Google Scholar] [CrossRef] [PubMed]
  57. Celebi, N.; Yi, L.; Facey, S.J.; Kuhn, A.; Dalbey, R.E. Membrane Biogenesis of Subunit II of Cytochrome bo Oxidase: Contrasting Requirements for Insertion of N-terminal and C-terminal Domains. J. Mol. Biol. 2006, 357, 1428–1436. [Google Scholar] [CrossRef] [PubMed]
  58. Mols, M.; van Kranenburg, R.; Tempelaars, M.H.; van Schaik, W.; Moezelaar, R.; Abee, T. Comparative analysis of transcriptional and physiological responses of Bacillus cereus to organic and inorganic acid shocks. Int. J. Food Microbiol. 2010, 137, 13–21. [Google Scholar] [CrossRef] [PubMed]
  59. Maurer, L.M.; Yohannes, E.; Bondurant, S.S.; Radmacher, M.; Slonczewski, J.L. pH Regulates Genes for Flagellar Motility, Catabolism, and Oxidative Stress in Escherichia coli K-12. J. Bacteriol. 2005, 187, 304–319. [Google Scholar] [CrossRef] [PubMed]
  60. Olesen, I.; Vogensen, F.K.; Jespersen, L. Gene transcription and virulence potential of Listeria monocytogenes strains after exposure to acidic and NaCl stress. Foodborne Pathog. Dis. 2009, 6, 669–680. [Google Scholar] [CrossRef]
  61. Tessema, G.T.; Møretrø, T.; Snipen, L.; Heir, E.; Holck, A.; Naterstad, K.; Axelsson, L. Microarray-based transcriptome of Listeria monocytogenes adapted to sublethal concentrations of acetic acid, lactic acid, and hydrochloric acid. Can. J. Microbiol. 2012, 58, 1112–1123. [Google Scholar] [CrossRef]
  62. Hajam, I.A.; Dar, P.A.; Shahnawaz, I.; Jaume, J.C.; Lee, J.H. Bacterial flagellin—A potent immunomodulatory agent. Exp. Mol. Med. 2017, 49, e373. [Google Scholar] [CrossRef]
  63. Martínez-García, E.; Nikel, P.I.; Chavarría, M.; de Lorenzo, V. The metabolic cost of flagellar motion in P seudomonas putida KT2440. Environ. Microbiol. 2014, 16, 291–303. [Google Scholar] [CrossRef]
  64. O’Neil, H.S.; Marquis, H. Listeria monocytogenes Flagella Are Used for Motility, Not as Adhesins, to Increase Host Cell Invasion. Infect. Immun. 2006, 74, 6675–6681. [Google Scholar]
  65. Guariglia-Oropeza, V.; Orsi, R.H.; Guldimann, C.; Wiedmann, M.; Boor, K.J. The Listeria monocytogenes Bile Stimulon under Acidic Conditions Is Characterized by Strain-Specific Patterns and the Upregulation of Motility, Cell Wall Modification Functions, and the PrfA Regulon. Front. Microbiol. 2018, 9, 120. [Google Scholar] [CrossRef] [PubMed]
  66. Scortti, M.; Monzó, H.J.; Lacharme-Lora, L.; Lewis, D.A.; Vázquez-Boland, J.A. The PrfA virulence regulon. Microbes Infect. 2007, 9, 1196–1207. [Google Scholar] [CrossRef] [PubMed]
  67. Cossart, P.; Vicente, M.F.; Mengaud, J.; Baquero, F.; Perez-Diaz, J.C.; Berche, P. Listeriolysin O is essential for virulence of Listeria monocytogenes: Direct evidence obtained by gene complementation. Infect. Immun. 1989, 57, 3629–3636. [Google Scholar] [PubMed]
  68. Gaillard, J.-L.; Berche, P.; Frehel, C.; Gouln, E.; Cossart, P. Entry of L. monocytogenes into cells is mediated by internalin, a repeat protein reminiscent of surface antigens from gram-positive cocci. Cell 1991, 65, 1127–1141. [Google Scholar] [CrossRef]
  69. Hall, M.; Grundström, C.; Begum, A.; Lindberg, M.J.; Sauer, U.H.; Almqvist, F.; Johansson, J.; Sauer-Eriksson, A.E. Structural basis for glutathione-mediated activation of the virulence regulatory protein PrfA in Listeria. Proc. Natl. Acad. Sci. USA 2016, 113, 14733–14738. [Google Scholar] [CrossRef]
  70. Cheng, C.; Dong, Z.; Han, X.; Wang, H.; Jiang, L.; Sun, J.; Yang, Y.; Ma, T.; Shao, C.; Wang, X.; et al. Thioredoxin A Is Essential for Motility and Contributes to Host Infection of Listeria monocytogenes via Redox Interactions. Front. Cell. Infect. Microbiol. 2017, 7. [Google Scholar] [CrossRef]
  71. Ollinger, J.; Bowen, B.; Wiedmann, M.; Boor, K.J.; Bergholz, T.M. Listeria monocytogenes B Modulates PrfA-Mediated Virulence Factor Expression. Infect. Immun. 2009, 77, 2113–2124. [Google Scholar] [CrossRef]
  72. Makariti, I.P.; Printezi, A.; Kapetanakou, A.E.; Zeaki, N.; Skandamis, P.N. Investigating boundaries of survival, growth and expression of genes associated with stress and virulence of Listeria monocytogenes in response to acid and osmotic stress. Food Microbiol. 2015, 45, 231–244. [Google Scholar] [CrossRef]
  73. Neuhaus, K.; Satorhelyi, P.; Schauer, K.; Scherer, S.; Fuchs, T.M. Acid shock of Listeria monocytogenes at low environmental temperatures induces prfA, epithelial cell invasion, and lethality towards Caenorhabditis elegans. BMC Genom. 2013, 14, 285. [Google Scholar] [CrossRef]
  74. Fuangthong, M.; Helmann, J.D. Recognition of DNA by three ferric uptake regulator (Fur) homologs in Bacillus subtilis. J. Bacteriol. 2003, 185, 6348–6357. [Google Scholar] [CrossRef] [PubMed]
  75. Follmann, M.; Ochrombel, I.; Krämer, R.; Trötschel, C.; Poetsch, A.; Rückert, C.; Hüser, A.; Persicke, M.; Seiferling, D.; Kalinowski, J.; et al. Functional genomics of pH homeostasis in Corynebacterium glutamicum revealed novel links between pH response, oxidative stress, iron homeostasis and methionine synthesis. BMC Genom. 2009, 10, 621. [Google Scholar] [CrossRef] [PubMed]
  76. Jakob, K.; Satorhelyi, P.; Lange, C.; Wendisch, V.F.; Silakowski, B.; Scherer, S.; Neuhaus, K. Gene Expression Analysis of Corynebacterium glutamicum Subjected to Long-Term Lactic Acid Adaptation. J. Bacteriol. 2007, 189, 5582–5590. [Google Scholar] [CrossRef] [PubMed]
  77. Carmel-Harel, O.; Storz, G. Roles of the glutathione- and thioredoxin-dependent reduction systems in the Escherichia coli and Saccharomyces cerevisiae responses to oxidative stress. Annu. Rev. Microbiol. 2000, 54, 439–461. [Google Scholar] [CrossRef]
  78. Gray, M.J.; Freitag, N.E.; Boor, K.J. How the Bacterial Pathogen Listeria monocytogenes Mediates the Switch from Environmental Dr. Jekyll to Pathogenic Mr. Hyde. Infect. Immun. 2006, 74, 2505–2512. [Google Scholar] [CrossRef]
  79. Camilli, A.; Tilney, L.G.; Portnoy, D.A. Dual roles of plcA in Listeria monocytogenes pathogenesis. Mol. Microbiol. 1993, 8, 143–157. [Google Scholar] [CrossRef]
  80. Weinmaier, T.; Riesing, M.; Rattei, T.; Bille, J.; Arguedas-Villa, C.; Stephan, R.; Tasara, T. Complete Genome Sequence of Listeria monocytogenes LL195, a Serotype 4b Strain from the 1983–1987 Listeriosis Epidemic in Switzerland. Genome Announc. 2013, 1, e00152-12. [Google Scholar] [CrossRef]
  81. Edgar, R. Gene Expression Omnibus: NCBI gene expression and hybridization array data repository. Nucleic Acids Res. 2002. [Google Scholar] [CrossRef]
  82. Li, H.; Durbin, R. Fast and accurate long-read alignment with Burrows–Wheeler transform. Bioinformatics 2010, 26, 589–595. [Google Scholar] [CrossRef]
  83. Li, H.; Handsaker, B.; Wysoker, A.; Fennell, T.; Ruan, J.; Homer, N.; Marth, G.; Abecasis, G.; Durbin, R. The Sequence Alignment/Map format and SAMtools. Bioinformatics 2009, 25, 2078–2079. [Google Scholar] [CrossRef] [Green Version]
  84. Liao, Y.; Smyth, G.K.; Shi, W. featureCounts: An efficient general purpose program for assigning sequence reads to genomic features. Bioinformatics 2014, 30, 923–930. [Google Scholar] [CrossRef] [PubMed]
  85. Robinson, M.D.; McCarthy, D.J.; Smyth, G.K. edgeR: A Bioconductor package for differential expression analysis of digital gene expression data. Bioinformatics 2010, 26, 139–140. [Google Scholar] [CrossRef] [PubMed]
  86. Tanner, S.A.; Chassard, C.; Rigozzi, E.; Lacroix, C.; Stevens, M.J.A. Bifidobacterium thermophilum RBL67 impacts on growth and virulence gene expression of Salmonella enterica subsp. enterica serovar Typhimurium. BMC Microbiol. 2016, 16, 46. [Google Scholar]
  87. Bailey, T.L.; Elkan, C. Fitting a mixture model by expectation maximization to discover motifs in biopolymers. Proc. Int. Conf. Intell. Syst. Mol. Biol. 1994, 2, 28–36. [Google Scholar] [PubMed]
  88. Bailey, T.L.; Gribskov, M. Combining evidence using p-values: Application to sequence homology searches. Bioinformatics 1998, 14, 48–54. [Google Scholar] [CrossRef]
  89. Huerta-Cepas, J.; Forslund, K.; Coelho, L.P.; Szklarczyk, D.; Jensen, L.J.; von Mering, C.; Bork, P. Fast Genome-Wide Functional Annotation through Orthology Assignment by eggNOG-Mapper. Mol. Biol. Evol. 2017, 34, 2115–2122. [Google Scholar] [CrossRef] [Green Version]
  90. Huerta-Cepas, J.; Szklarczyk, D.; Heller, D.; Hernández-Plaza, A.; Forslund, S.K.; Cook, H.; Mende, D.R.; Letunic, I.; Rattei, T.; Jensen, L.J.; et al. eggNOG 5.0: A hierarchical, functionally and phylogenetically annotated orthology resource based on 5090 organisms and 2502 viruses. Nucleic Acids Res. 2019, 47, D309–D314. [Google Scholar] [CrossRef]
  91. Kushwaha, M.; Salis, H.M. A portable expression resource for engineering cross-species genetic circuits and pathways. Nat. Commun. 2015, 6, 7832. [Google Scholar] [CrossRef] [Green Version]
  92. Contreras-Moreira, B.; Vinuesa, P. GET_HOMOLOGUES, a versatile software package for scalable and robust microbial pangenome analysis. Appl. Environ. Microbiol. 2013, 79, 7696–7701. [Google Scholar] [CrossRef]
Figure 1. The number of genes that were up- and downregulated per strain in response to HCl acid shock at pH 3.
Microorganisms 07 00455 g001
Figure 2. Morphological changes after HCl acid stress. (a) Flow cytometric analysis of cell size with and without acid. Each dataset represents 10’000 cells. (b) Image stream analysis of L. monocytogenes cells without (left) and with (right) acid stress. For each dataset, 10,000 cells were imaged. The figure contains representative images (left column: brightfield; right column: DAPI) from among the largest entities within each dataset.
Microorganisms 07 00455 g002
Figure 3. Motif search within 150 bp upstream of differentially expressed genes. (a) Sequence logos for motifs 17_1507 and 14_0047 (b) Schematic representation of the genomic context of motif 17_1507 in the promoter upstream of plcA. Coding sequences are not drawn to scale.
Microorganisms 07 00455 g003
Table 1. Motifs identified within 150bp upstream of differentially expressed genes.
Motif 17_1507
StrainMotif sequenceStrand 1e-valueProduct up 2Product down 2 FC up 3FDR up 4FC down 3FDR down 4
LL195GAAGAATATCCAAATGTGATTAAAAATATAGTTACACCGreverse9.16E-07Cyclic-di-AMP phosphodiesterase GdpP50S ribosomal protein L9−0.2200.774−0.2290.700
LL195CGCTTTACCTGCTTCGGCGATTGAATGTCAGTATGAGGCforward2.19E-16hypothetical proteinhypothetical protein0.9690.0570.7690.143
LL195GAGGCATTAACATTTGTTAACGACGATAAAGGGACAGCGreverse1.81E-151-phosphatidylinositol phosphodiesteraseListeriolysin O0.8020.1073.0130.000
LL195CAAGAAATGGCGCTTTTCTTCAACAAAAAAGAGAAAGCAreverse1.18E-07RNA polymerase sigma-H factorProtein translocase subunit SecE−0.6500.2270.6790.281
LL195GCAGAATACACCTATTTAGTAGGAGATAAAGTGAATGCTreverse1.48E-07Internalin-Ahypothetical protein0.0790.9040.2830.686
LL195CAAGAATTAGCAAATGTAAACGACGTAGCAATGGATGAGreverse6.03E-07hypothetical proteinNitrite transporter NirC0.4140.4620.3550.668
LL195CACTTTAATGATATTAACGAAGAAGATGATTACTGGGGGforward3.67E-07hypothetical proteinGlutathione reductase1.5760.0011.2180.028
LL195ACAGAAATCAGCCACTTAATTAGCGAAACAATGACAGAGreverse7.55E-07Putative TrmH family tRNA/rRNA methyltransferasehypothetical protein0.3100.6581.1450.024
LL195CTCTCTATCTTCAATGATTTTTGCAAGCGCGATTTGTTCforward8.88E-08Glutathione amide reductaseRibonuclease J 21.6610.026−0.4110.591
LL195GAGTCACTCACCCGCTTAAAAACAGATCACTGGAATGCGreverse1.65E-07putative cyclic di-GMP phosphodiesterase PdeGMalolactic enzyme−0.5270.348−0.2210.707
LL195GCACCATTCGCACTCTTCAACATCGATATCGTTAGAGCGreverse2.93E-16Ribonucleoside-diphosphate reductase 2 subunit alphahypothetical protein1.6200.0130.1410.842
LL195CACTAATTCCCCCATTTATAAAATAAAATCGGTAAAGCGreverse2.78E-14High-affinity heme uptake system protein IsdEIron-regulated surface determinant protein A1.0120.1431.7060.001
LL195CGCTTGCTCTTTCTCATTGATTAATTGTTCATATTGCGCforward2.58E-07putative protein YhaNputative metallophosphoesterase YhaO−0.6140.282−0.1390.825
LL195CCATAAGCGACATTATCATAAATCGAAAACGGGAATGGGreverse9.55E-07Phosphate import ATP-binding protein PstB 3Phosphate import ATP-binding protein PstB 30.7670.3600.4680.447
LL195CAGGCATTCAAACTTGCCAACAAATATACGAATAAAGCGreverse1.93E-07Heptaprenyl diphosphate synthase component 23′,5′-cyclic adenosine monophosphate phosphodiesterase CpdA−0.7720.187−1.6170.005
N12-0605GAACAAATCGCGCTTGCAAAAATCATTGAAGATAGAGAGreverse8.88E-08Glutathione amide reductasehypothetical protein0.2480.8640.3240.739
N12-0605CTCTGTCATTGTTTCGCTAATTAAGTGGCTGATTTCTGTforward7.55E-07Putative TrmH family tRNA/rRNA methyltransferasePutative aminopeptidase YsdC0.1520.8790.1570.881
N12-0605CCCCCAGTAATCATCTTCTTCGTTAATATCATTAAAGTGreverse3.67E-07hypothetical proteinhypothetical protein0.9980.1210.0930.921
N12-0605CTCATCCATTGCTACGTCGTTTACATTTGCTAATTCTTGforward6.03E-07hypothetical proteinhypothetical protein0.1040.916−0.1160.940
N12-0605AGCATTCACTTTATCTCCTACTAAATAGGTGTATTCTGCforward1.48E-07Internalin-Ahypothetical protein−0.2040.855−0.9500.264
N12-0605CGCTGTCCCTTTATCGTCGTTAACAAATGTTAATGCCTCforward1.81E-15Listeriolysin O1-phosphatidylinositol phosphodiesterase2.7640.0120.7290.267
N12-0605GCCTCATACTGACATTCAATCGCCGAAGCAGGTAAAGCGreverse2.19E-16hypothetical proteinhypothetical protein0.6390.4200.7530.289
N12-0605CGGTGTAACTATATTTTTAATCACATTTGGATATTCTTCforward9.16E-07Cyclic-di-AMP phosphodiesterase GdpPAccessory gene regulator A−0.3560.721−0.1000.934
N12-0605CGCTTTATTCGTATATTTGTTGGCAAGTTTGAATGCCTGforward1.93E-07Heptaprenyl diphosphate synthase component 2hypothetical protein−0.7040.298−0.2870.717
N12-0605CGCTTTACCGATTTTATTTTATAAATGGGGGAATTAGTGforward2.78E-14Iron-regulated surface determinant protein AHigh-affinity heme uptake system protein IsdE2.2610.0031.5930.089
N12-0605CGCTCTAACGATATCGATGTTGAAGAGTGCGAATGGTGCforward2.93E-16Ribonucleoside-diphosphate reductase 2 subunit alphaRibonucleoside-diphosphate reductase subunit beta1.0630.2110.9570.204
N12-0605CAAGAAATGGCGCTTTTCTTCAACAAAAAAGAGAAAGCAreverse1.18E-07RNA polymerase sigma-H factorProtein translocase subunit SecE−1.2140.0270.4950.603
N12-0605GCTGAAGTAGCACTTGAAAAAGACGATATCGACTCTGCGreverse8.24E-07Beta-barrel assembly-enhancing proteasehypothetical protein0.0290.9771.1960.081
N12-0605CGCATTCCAGTGATCTGTTTTTAAGCGGGTGAGTGACTCforward1.65E-07putative cyclic di-GMP phosphodiesterase PdeGhypothetical protein−0.6880.296−0.8100.205
N12-0605CCCATTCCCGTTTTCGATTTATGATAATGTCGCTTATGGforward9.55E-07Phosphate import ATP-binding protein PstB 3Phosphate-specific transport system accessory protein PhoU−0.1160.9280.2950.801
N13-1507GAACAAATTGCGCTCGCAAAAATCATTGAAGATAGAGAGreverse8.60E-07Glutathione amide reductasehypothetical protein4.4180.0002.3650.000
N13-1507CTCTGTCATTGTTTCGCTAATTAAGTGGCTGATTTCTGTforward7.55E-07Putative TrmH family tRNA/rRNA methyltransferasePutative aminopeptidase YsdC0.3140.2900.0110.981
N13-1507CCCCCAGTAATCATCTTCTTCGTTAATATCATTAAAGTGreverse3.67E-07hypothetical proteinhypothetical protein1.0470.0051.0840.001
N13-1507CTCATCCATTGCTACGTCGTTTACATTTGCTAATTCTTGforward6.03E-07hypothetical proteinhypothetical protein−0.0240.9632.3580.000
N13-1507AGCATTCACTTTATCTCCTACTAAATAGGTGTATTCTGCforward1.48E-07Internalin-Ahypothetical protein0.4820.353NANA
N13-1507CGCTGTCCCTTTATCGTCGTTAACAAATGTTAATGCCTCforward1.81E-15Listeriolysin O1-phosphatidylinositol phosphodiesterase4.2860.0001.5030.000
N13-1507GCCTCATACTGACATTCAATCGCCGAAGCAGGTAAAGCGreverse2.19E-16hypothetical proteinhypothetical protein1.2870.0052.1460.000
N13-1507CGGTGTAACTATATTTTTAATCACATTTGGATATTCTTCforward9.16E-07Cyclic-di-AMP phosphodiesterase GdpPAccessory gene regulator A−0.2850.4060.9450.005
N13-1507CGCTTTATTCGTATATTTGTTGGCAAGTTTGAATGCCTGforward1.93E-07Heptaprenyl diphosphate synthase component 2hypothetical protein−1.6720.000−1.2650.000
N13-1507CGCTTTACCGATTTTATTTTATAAATGGGGGAATTAGTGforward2.78E-14Iron-regulated surface determinant protein AHigh-affinity heme uptake system protein IsdE1.6240.0012.3510.001
N13-1507CGCTCTAACGATATCGATGTTGAAGAGTGCGAATGGTGCforward2.93E-16Ribonucleoside-diphosphate reductase 2 subunit alphaRibonucleoside-diphosphate reductase subunit beta (thioredoxin two genes downstream)1.5080.0001.6530.000
N13-1507TGCTTTCTCTTTTTTGTTGAAGAAAAGCGCCATTTCTTGforward1.18E-07RNA polymerase sigma-H factorputative protein YacP−0.8670.004−0.7860.026
N13-1507GCTGAAGTAGCACTTGAAAAAGACGATATCGACTCTGCGreverse8.24E-07Beta-barrel assembly-enhancing proteasehypothetical protein−1.4070.0000.3590.312
N13-1507CGCATTCCAGTGATCTGTTTTTAAGCGGGTGAGTGACTCforward1.65E-07putative cyclic di-GMP phosphodiesterase PdeGhypothetical protein−0.3530.309−0.2880.421
N13-1507CCATAAGCGACATTATCATAAATCGAAAACGGGAATGGGreverse9.55E-07Phosphate import ATP-binding protein PstB 3Phosphate import ATP-binding protein PstB 33.1810.0001.2300.024
Motif 14_0047
StrainMotif sequenceStrand 1ScoreProduct up 2Product down 2 FC up 3FDR up 4FC down 3FDR down 4
LL195TGATAATAATTCTCAreverse4.17E-08Iron(3+)-hydroxamate-binding protein YxeBputative siderophore transport system ATP-binding protein YusV0.2220.8200.5310.341
LL195AGAAAATCATTTTCAforward9.75E-07Fe(2+) transporter FeoBhypothetical protein1.8290.0081.5340.002
LL195TGAGAATGATTTTCAreverse1.99E-08Fe-S protein maturation auxiliary factor SufThypothetical protein0.7400.2100.9270.045
LL195TGGTAGCCATTTTCAforward5.38E-07hypothetical proteinputative protein YwqG−1.0060.048−0.1650.774
LL195TGAAAACAATTTTCAforward3.78E-07PhosphoglucomutaseAldose 1-epimerase−0.7610.216−0.6240.289
LL195TGGAAACAATTTTCAforward6.42E-07hypothetical proteinhypothetical protein0.8930.2090.8120.239
LL195TGAAAGTGATTTCCAreverse1.09E-07O-acetyl-ADP-ribose deacetylaseEnergy-dependent translational throttle protein EttA2.5190.000−1.0550.176
LL195TGAAAATGATTTTCAreverse2.07E-09Putative N-acetylmannosamine-6-phosphate 2-epimeraseRibosomal RNA small subunit methyltransferase G0.1060.923−0.7490.137
N12-0605TGAAAATCATTTTCAforward2.07E-09PTS system glucitol/sorbitol-specific EIIA componentFe(3+)-citrate-binding protein YfmC0.1030.9271.4260.012
N12-0605TGAAAATTGTTTCCAreverse6.42E-07hypothetical proteinProtein SapB0.0370.9770.0990.940
N12-0605TGAAAATCATTCTCAforward1.99E-08hypothetical proteinFe-S protein maturation auxiliary factor SufT0.7100.2811.3430.037
N12-0605TGAAAATTGTTTTCAreverse3.78E-07PhosphoglucomutaseNucleotide-binding protein YvcJ−0.8540.2230.4240.569
N12-0605TGAAAATGGCTACCAreverse5.38E-07hypothetical proteinPutative ion-transport protein YfeO−0.5420.500−0.5620.668
N13-1507TGAAAATCATTTTCAforward2.07E-09PTS system glucitol/sorbitol-specific EIIA componentFe(3+)-citrate-binding protein YfmC1.2760.0191.7840.000
N13-1507TGAAAATTGTTTCCAreverse6.42E-07hypothetical proteinProtein SapB3.0610.0003.7430.000
N13-1507TGAAAATCATTCTCAforward1.99E-08hypothetical proteinFe-S protein maturation auxiliary factor SufT0.3760.2941.4560.000
N13-1507TGGTAGCCATTTTCAforward5.38E-07hypothetical proteinputative protein YwqG−0.6050.1780.3570.364
N13-1507TGAAAACAATTTTCAforward3.78E-07PhosphoglucomutaseAldose 1-epimerase−1.5630.000−1.8920.000
1 Orientation of the motif; 2 Gene product upstream/downstream of the motif; 3 Fold change of the gene upstream/downstream of the motif; 4 False discovery rate of the gene upstream/downstream of the motif.
Table 2. Strains used in this study.
Strain IDClonal ComplexSerotypeIsolation SourceAcid PhenotypeRNAseq Replicates
LL195CC14bOutbreak strainResistant3
N12-0605CC14bMeat productResistant3
N13-1507CC64bBloodResistant2

