Author Contributions
Conceptualization, L.C. and W.S.; methodology, W.S.; software, X.Z. and T.L.; validation, W.S., X.Z. and J.L.; formal analysis, W.S.; investigation, W.S.; resources, L.C.; data curation, W.S.; writing—original draft preparation, W.S.; writing—review and editing, L.C. and Q.S.; visualization, J.L.; supervision, L.C.; project administration, L.C.; funding acquisition, L.C. All authors have read and agreed to the published version of the manuscript.
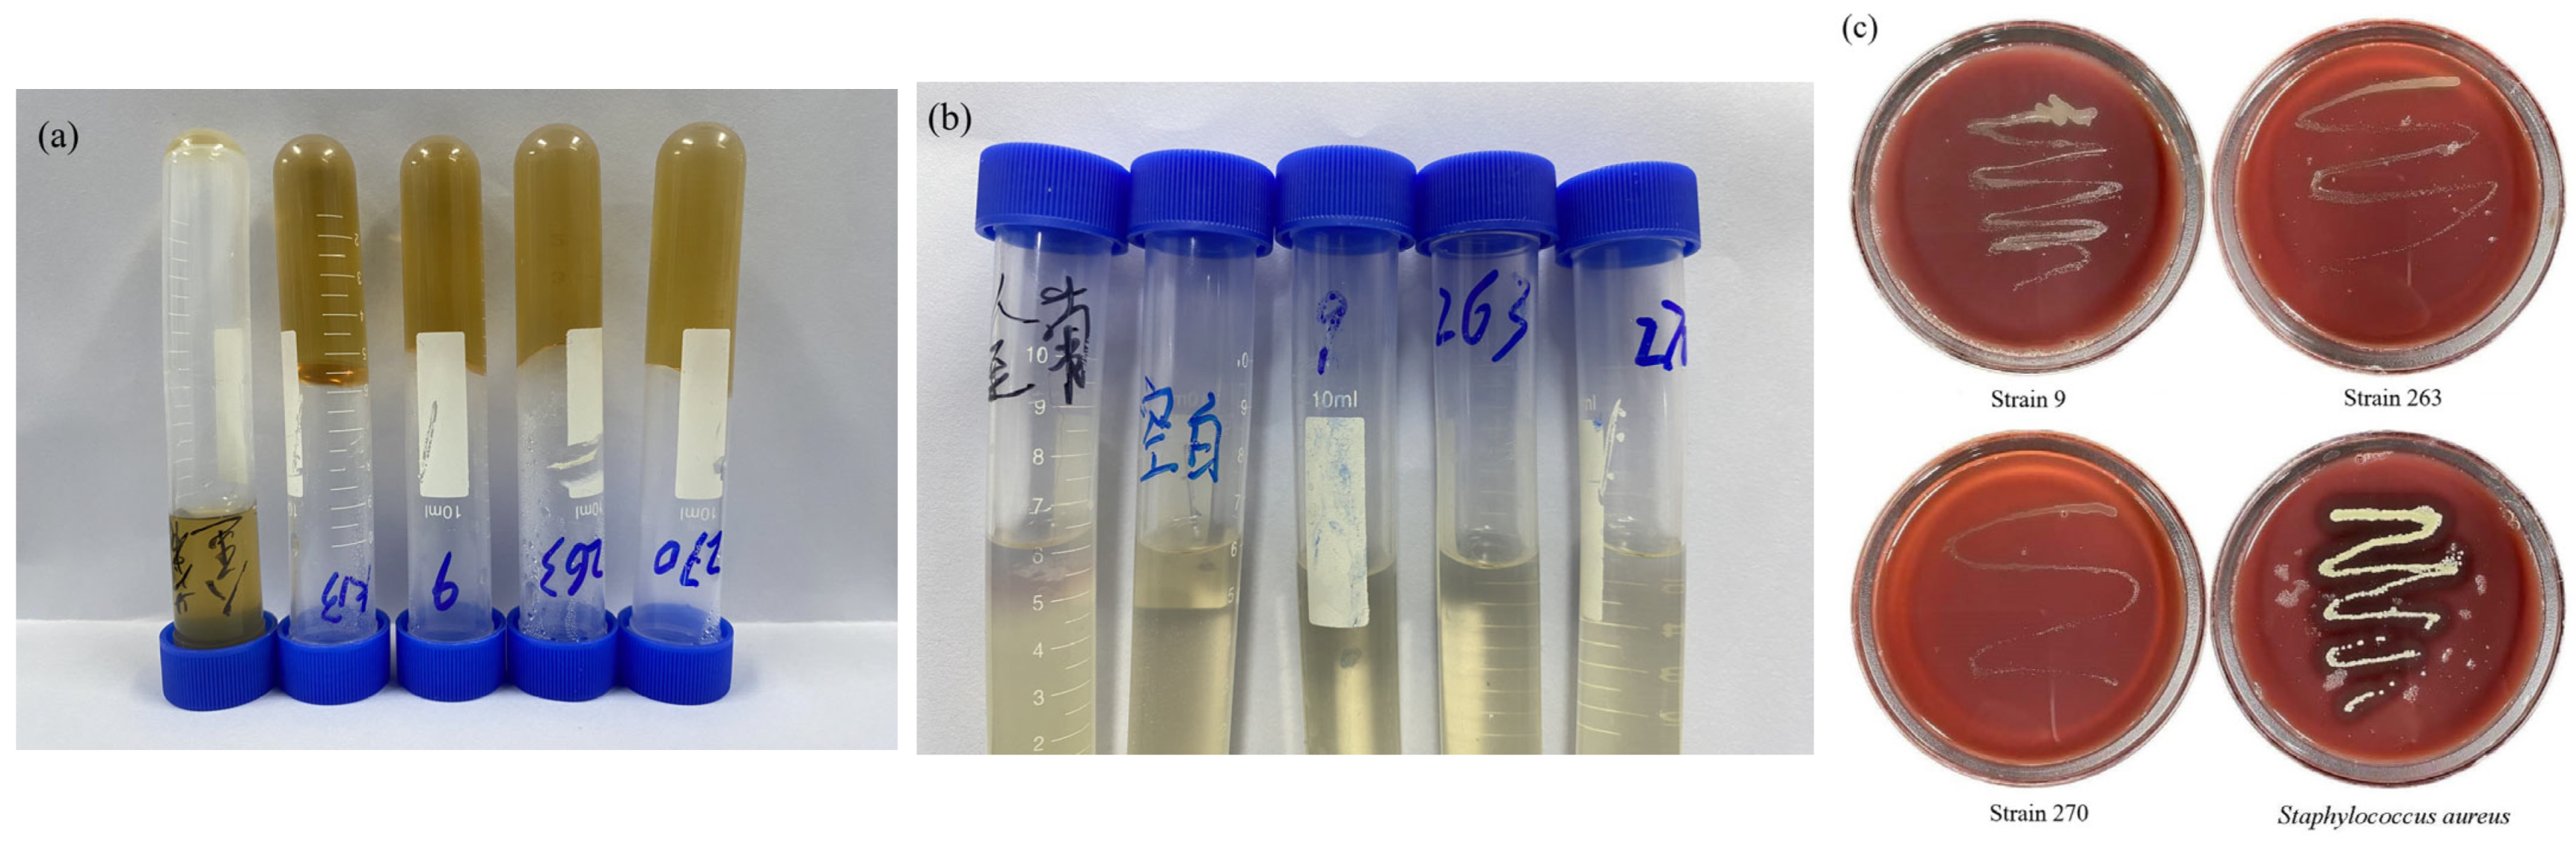
Figure 1.
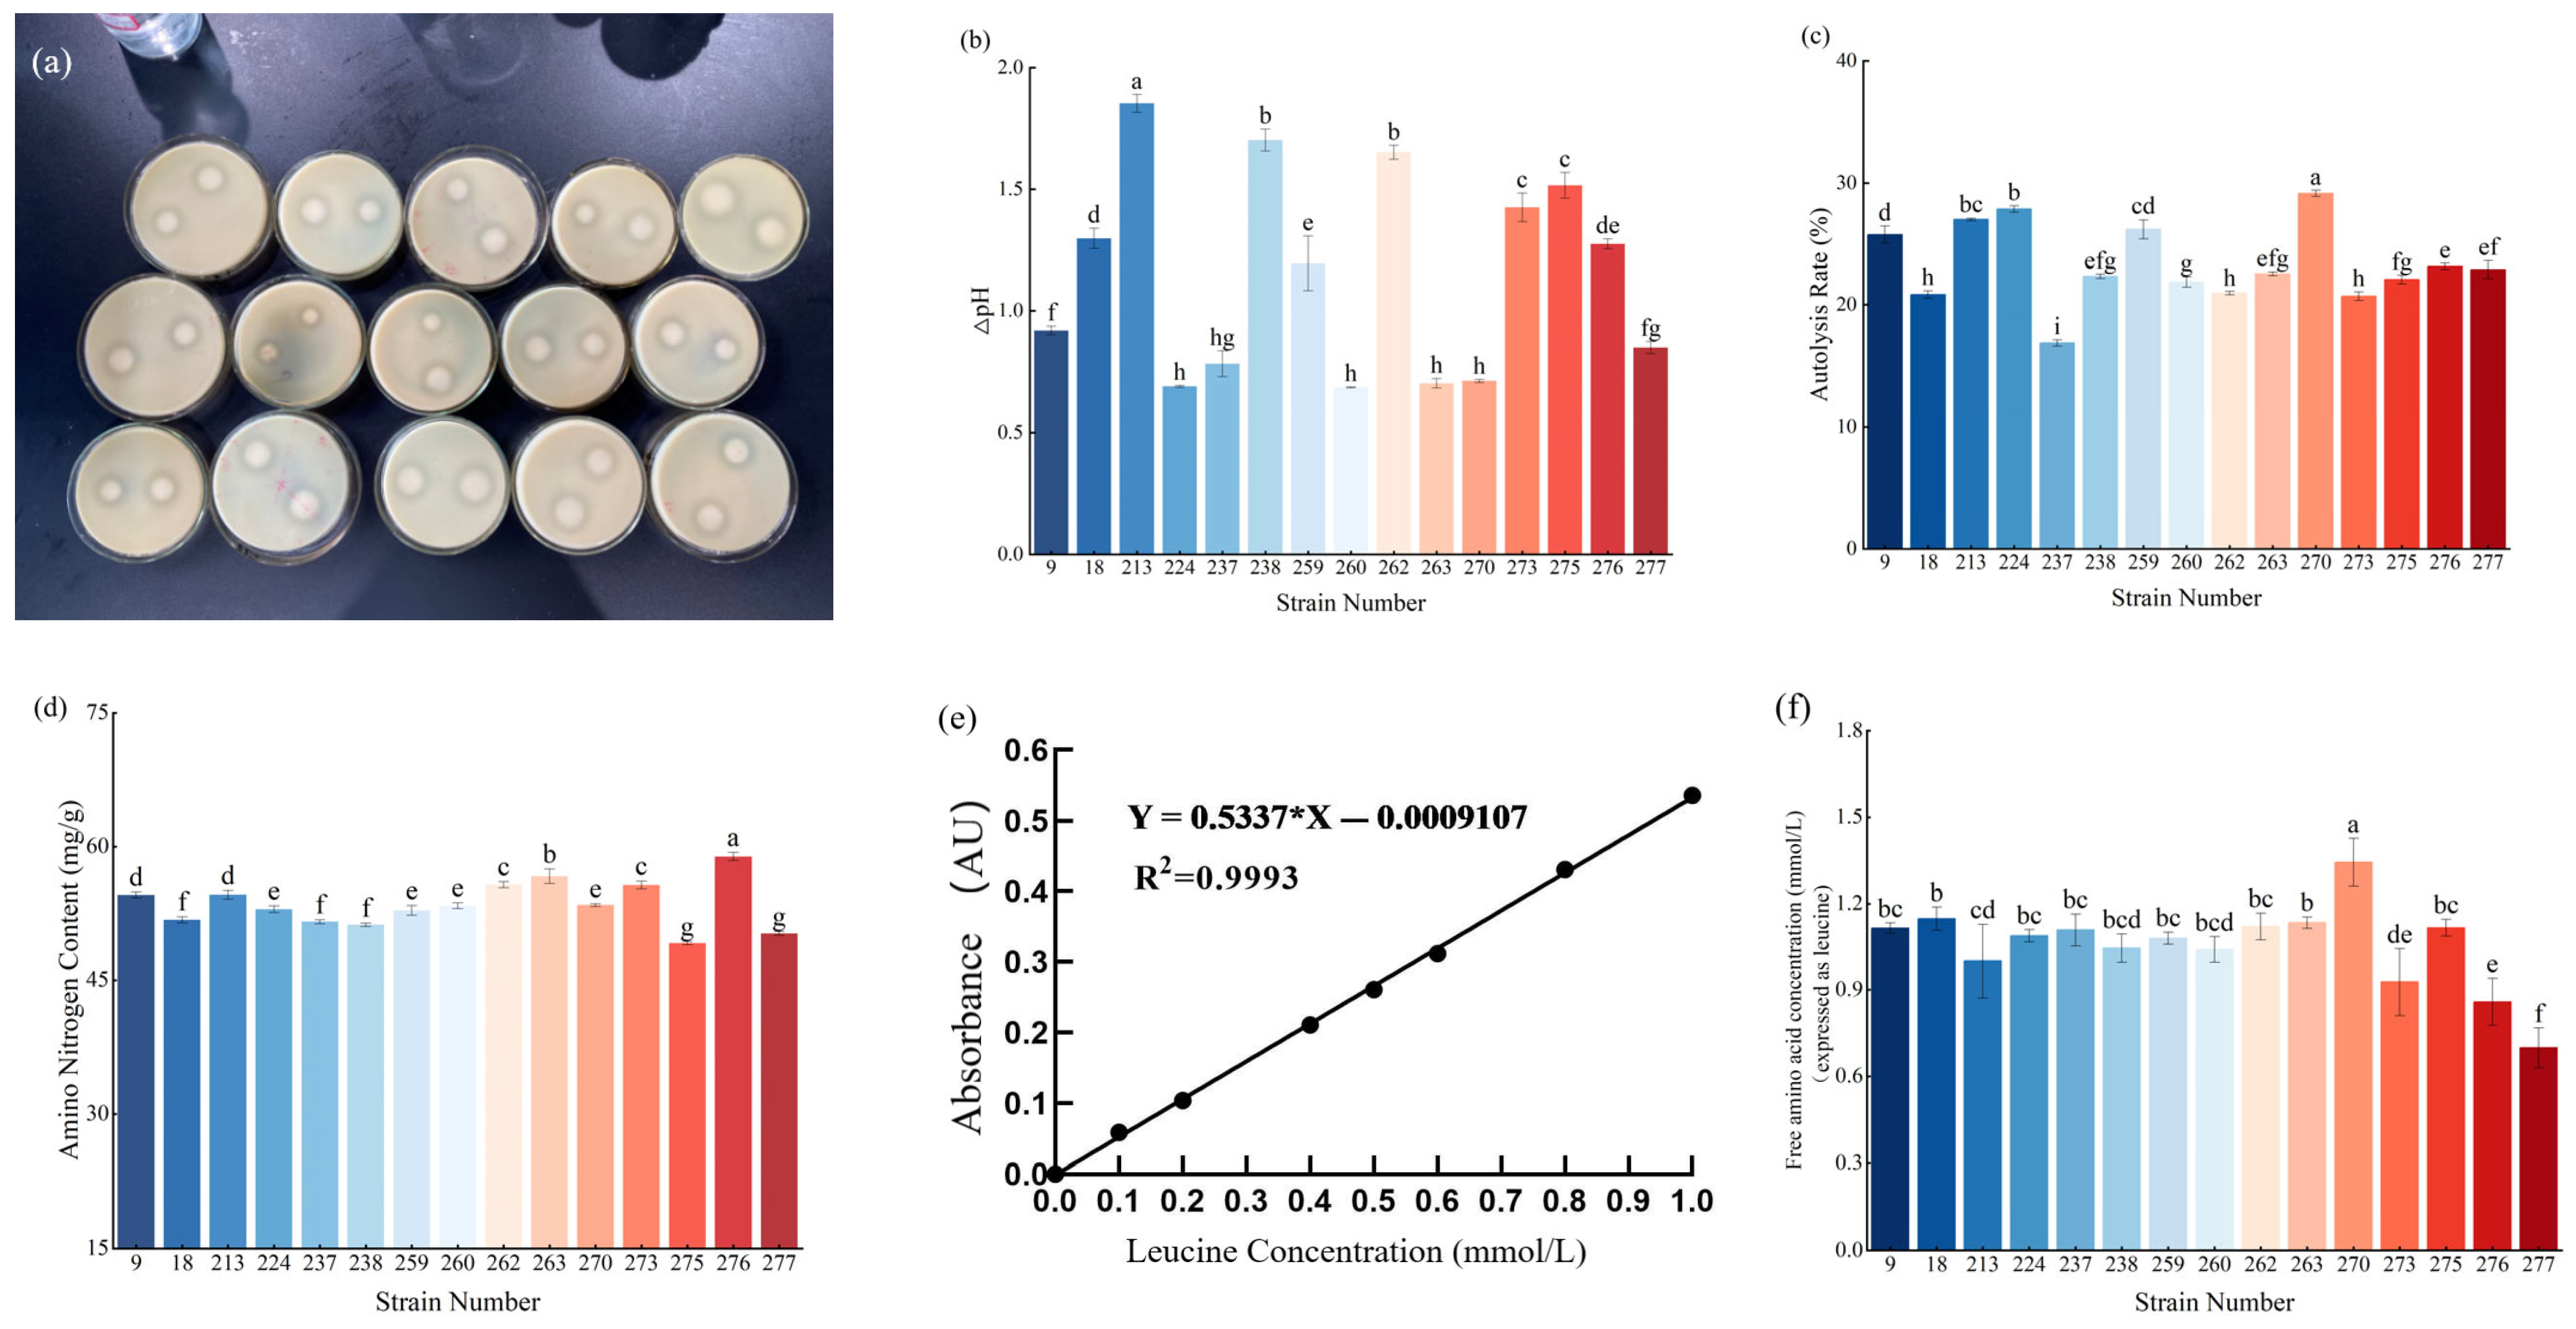
Secondary screening results of adjunct starter cultures. (a) Protease production capacity of the candidate strains. (b) Acid production capacity of the 15 strains. (c) Autolysis of the 15 strains. (d) Protein degradation capability of the 15 strains. (e) Standard curve of leucine. (f) Leucine standard curve and total peptidase activity of the 15 strains. Values with different lowercase letters (a–i) indicate significant differences among strains (p < 0.05).
Figure 1.
Secondary screening results of adjunct starter cultures. (a) Protease production capacity of the candidate strains. (b) Acid production capacity of the 15 strains. (c) Autolysis of the 15 strains. (d) Protein degradation capability of the 15 strains. (e) Standard curve of leucine. (f) Leucine standard curve and total peptidase activity of the 15 strains. Values with different lowercase letters (a–i) indicate significant differences among strains (p < 0.05).
Figure 2.
Gelatin liquefaction, indole, and hemolysis tests. (a) Gelatin liquefaction test; (b) Indole test; (c) Hemolysis test. In panels (a,b), the samples are arranged from left to right as follows: Staphylococcus aureus (positive control), negative control, Strain 9, Strain 263, and Strain 270.
Figure 2.
Gelatin liquefaction, indole, and hemolysis tests. (a) Gelatin liquefaction test; (b) Indole test; (c) Hemolysis test. In panels (a,b), the samples are arranged from left to right as follows: Staphylococcus aureus (positive control), negative control, Strain 9, Strain 263, and Strain 270.
Figure 3.
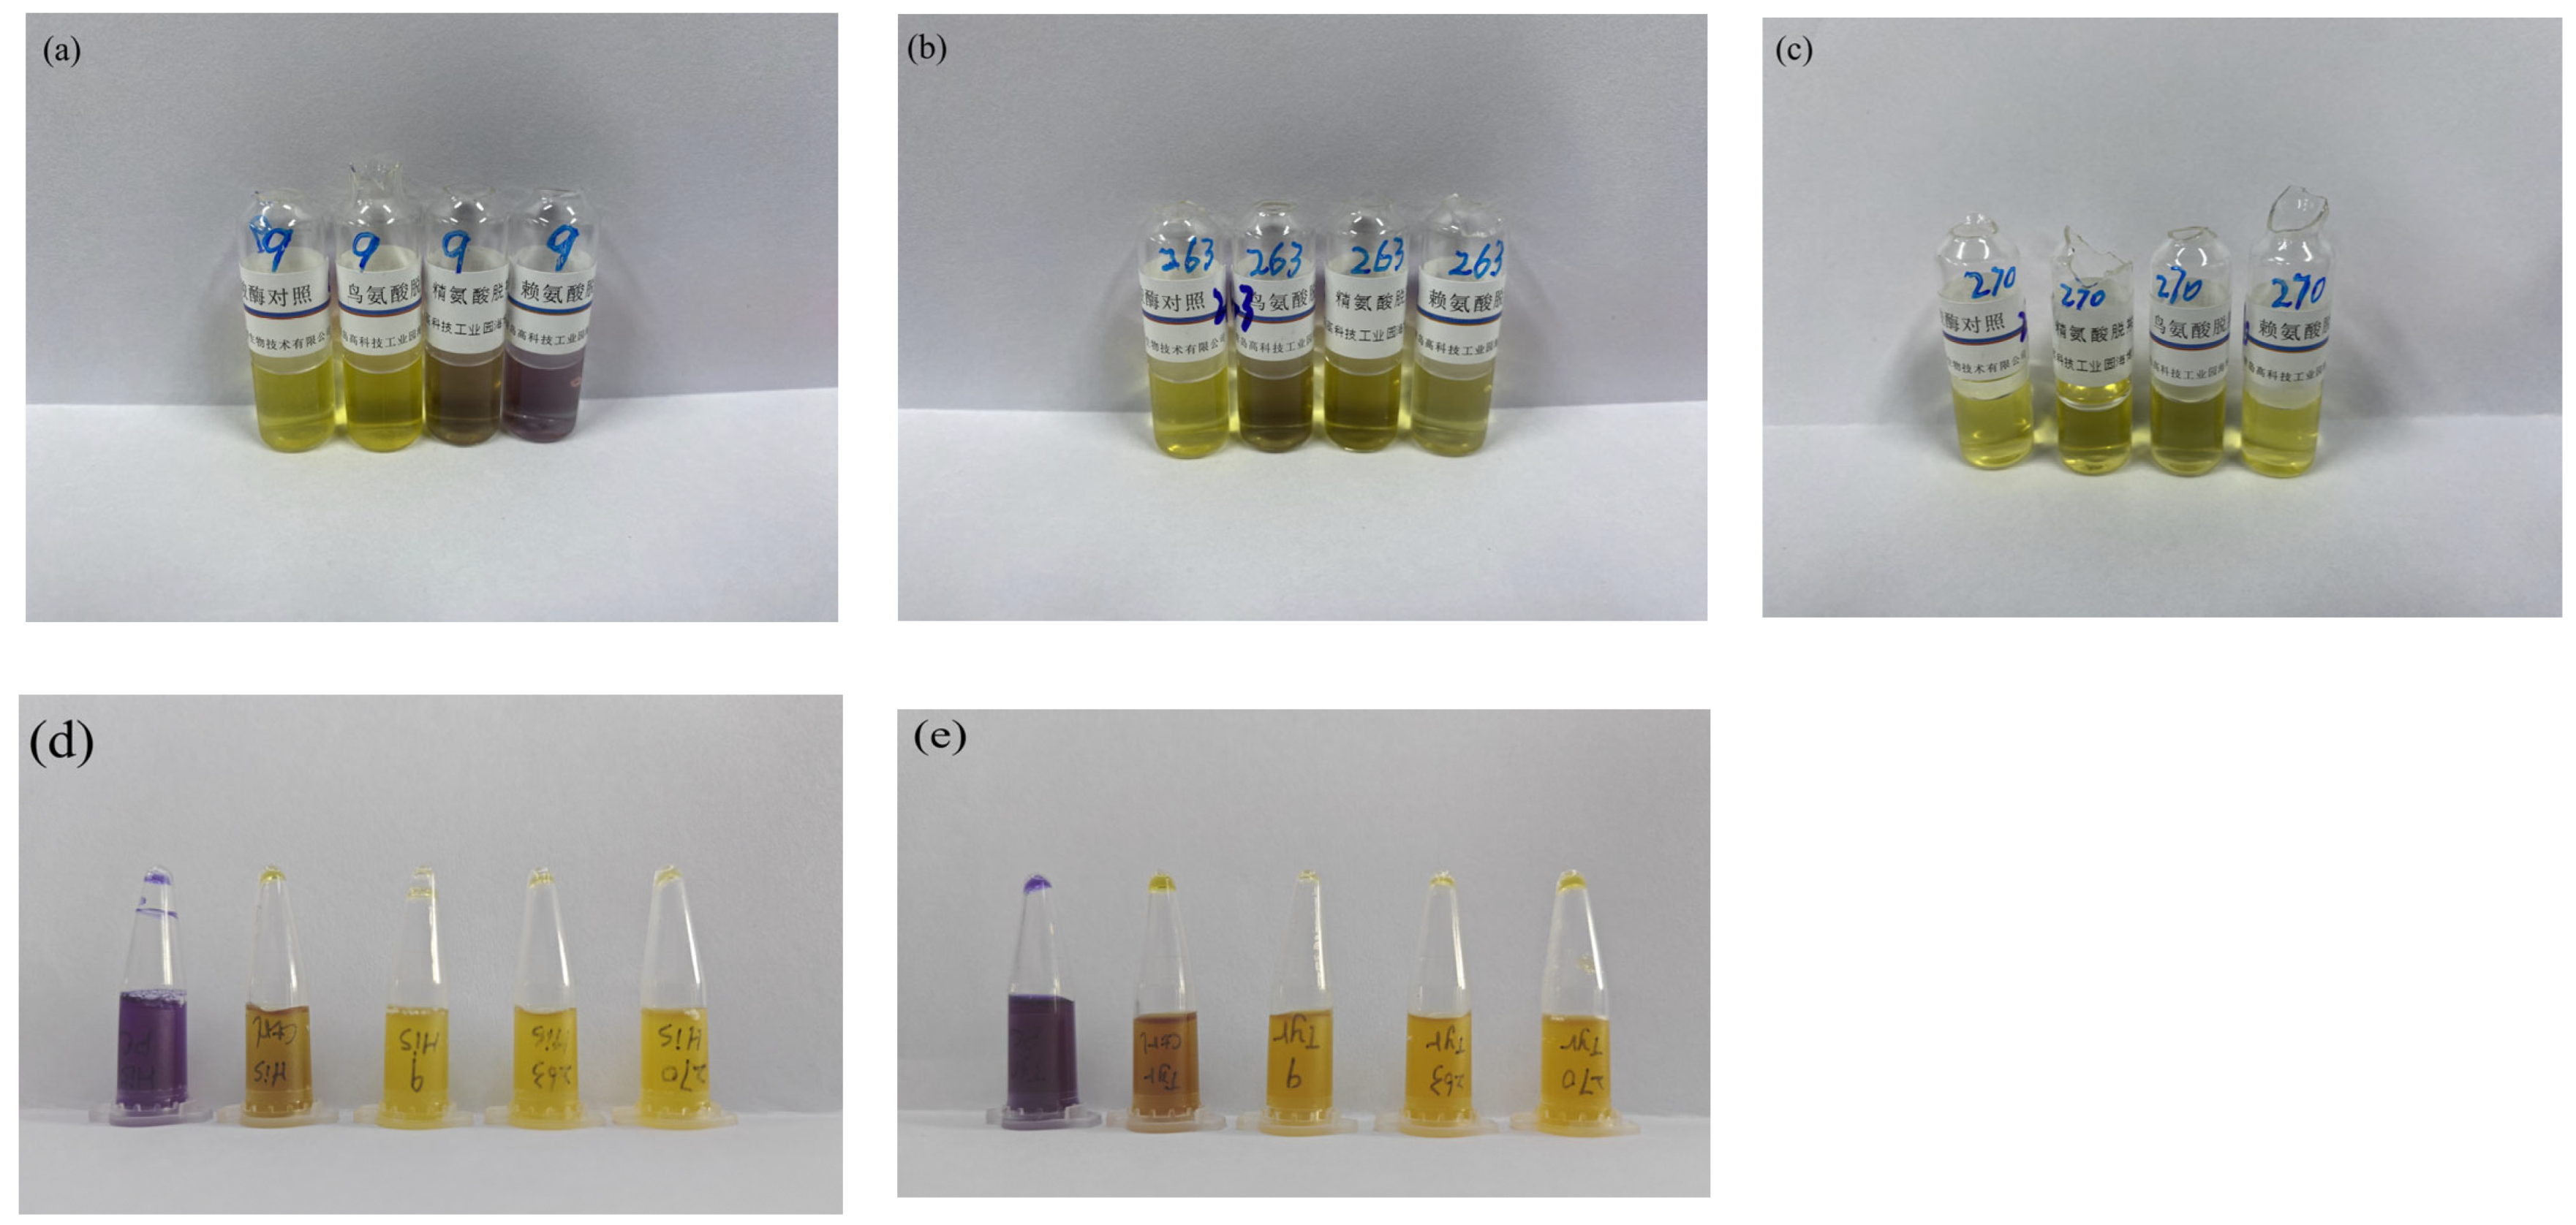
Amino acid decarboxylase test results. (a–c) Lysine, arginine, and ornithine decarboxylase tests for Strain 9 (a), Strain 263 (b), and Strain 270 (c), respectively. (d) Histidine decarboxylase test for the three strains. (e) Tyrosine decarboxylase test for the three strains.
Figure 3.
Amino acid decarboxylase test results. (a–c) Lysine, arginine, and ornithine decarboxylase tests for Strain 9 (a), Strain 263 (b), and Strain 270 (c), respectively. (d) Histidine decarboxylase test for the three strains. (e) Tyrosine decarboxylase test for the three strains.
Figure 4.
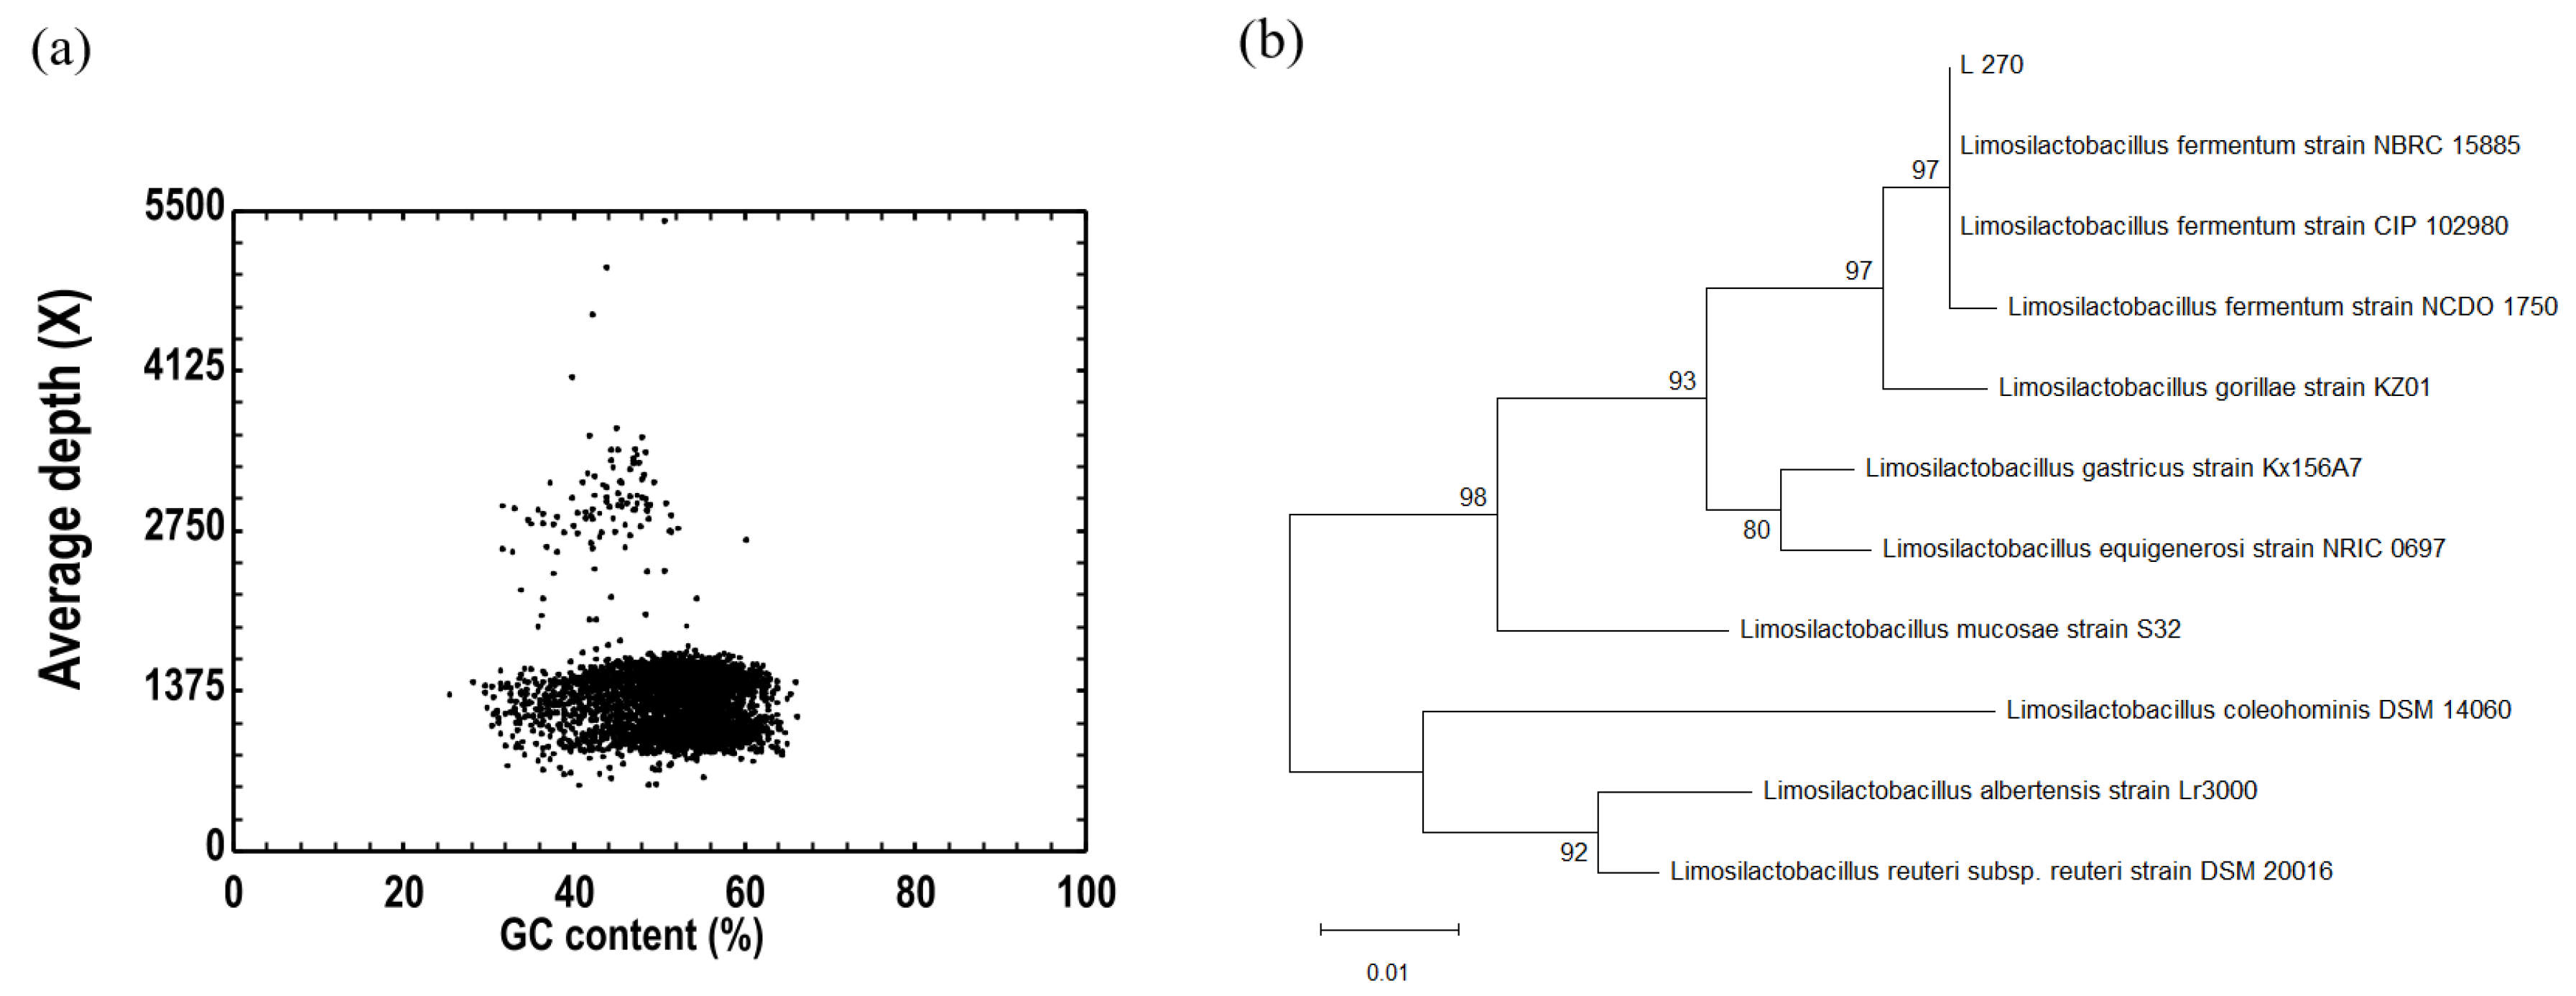
Genomic and phylogenetic analyses. (a) Correlation analysis between sample GC content and sequencing depth. (b) Phylogenetic tree based on the 16S rRNA gene sequence of Strain 270.
Figure 4.
Genomic and phylogenetic analyses. (a) Correlation analysis between sample GC content and sequencing depth. (b) Phylogenetic tree based on the 16S rRNA gene sequence of Strain 270.
Figure 5.
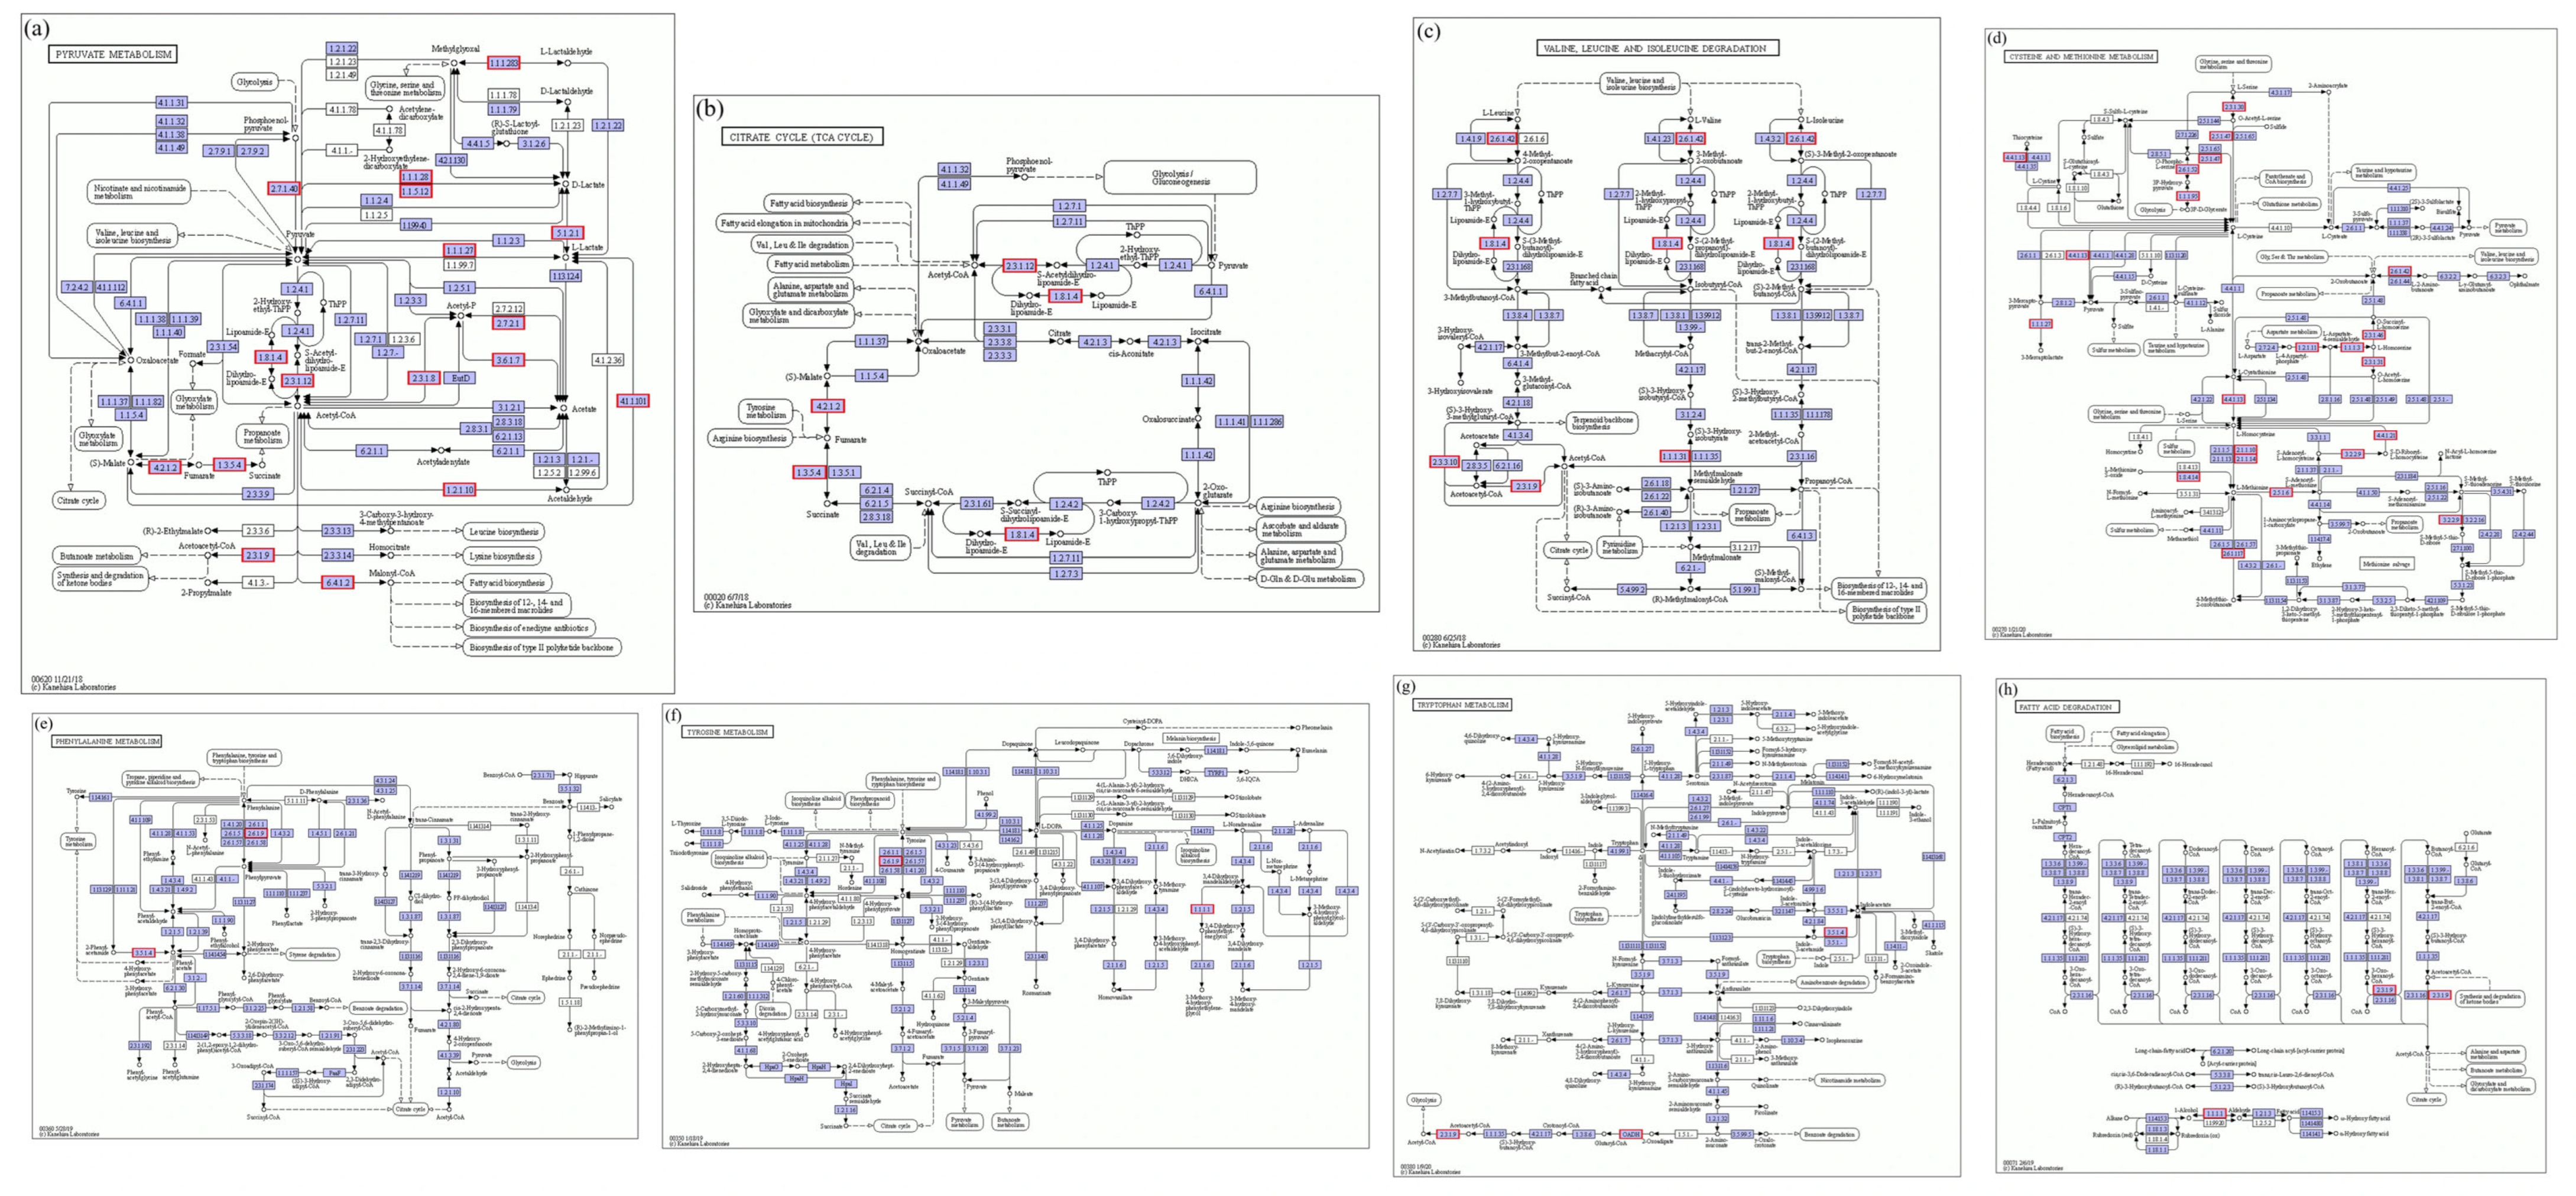
KEGG pathway analysis of flavor formation potential in L. fermentum 270. (a) Pyruvate metabolism (ko00620). (b) Citrate cycle (TCA cycle) (ko00020). (c) Lysine degradation (ko00310). (d) Cysteine and methionine metabolism (ko00270). (e) Phenylalanine metabolism (ko00360). (f) Tyrosine metabolism (ko00350). (g) Tryptophan metabolism (ko00380). (h) Fatty acid degradation (ko00071). Genes highlighted in red indicate those functionally annotated in the genome of L. fermentum 270.
Figure 5.
KEGG pathway analysis of flavor formation potential in L. fermentum 270. (a) Pyruvate metabolism (ko00620). (b) Citrate cycle (TCA cycle) (ko00020). (c) Lysine degradation (ko00310). (d) Cysteine and methionine metabolism (ko00270). (e) Phenylalanine metabolism (ko00360). (f) Tyrosine metabolism (ko00350). (g) Tryptophan metabolism (ko00380). (h) Fatty acid degradation (ko00071). Genes highlighted in red indicate those functionally annotated in the genome of L. fermentum 270.
Figure 6.
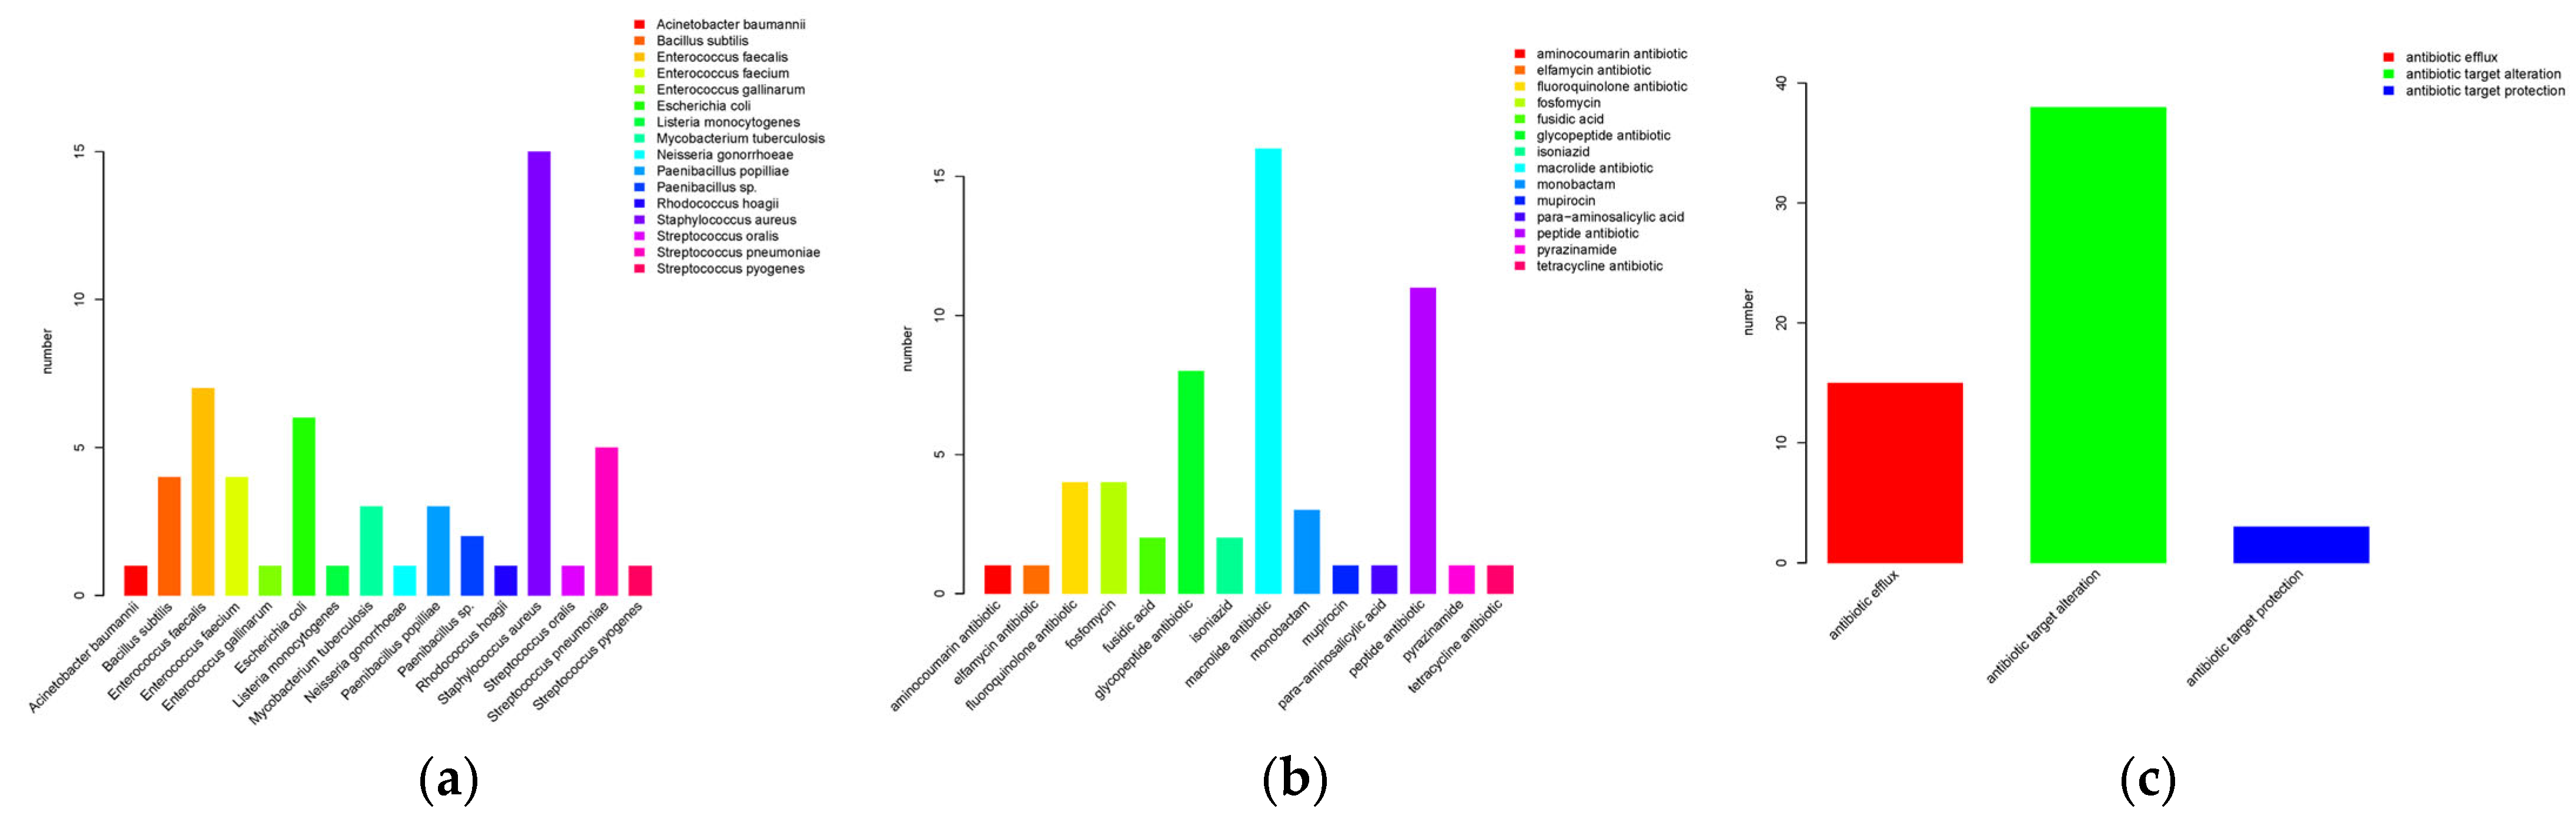
Summary of antibiotic resistance gene annotation. (a) Species-of-origin statistics. (b) Drug-class statistics. (c) Resistance-mechanism statistics.
Figure 6.
Summary of antibiotic resistance gene annotation. (a) Species-of-origin statistics. (b) Drug-class statistics. (c) Resistance-mechanism statistics.
Figure 7.
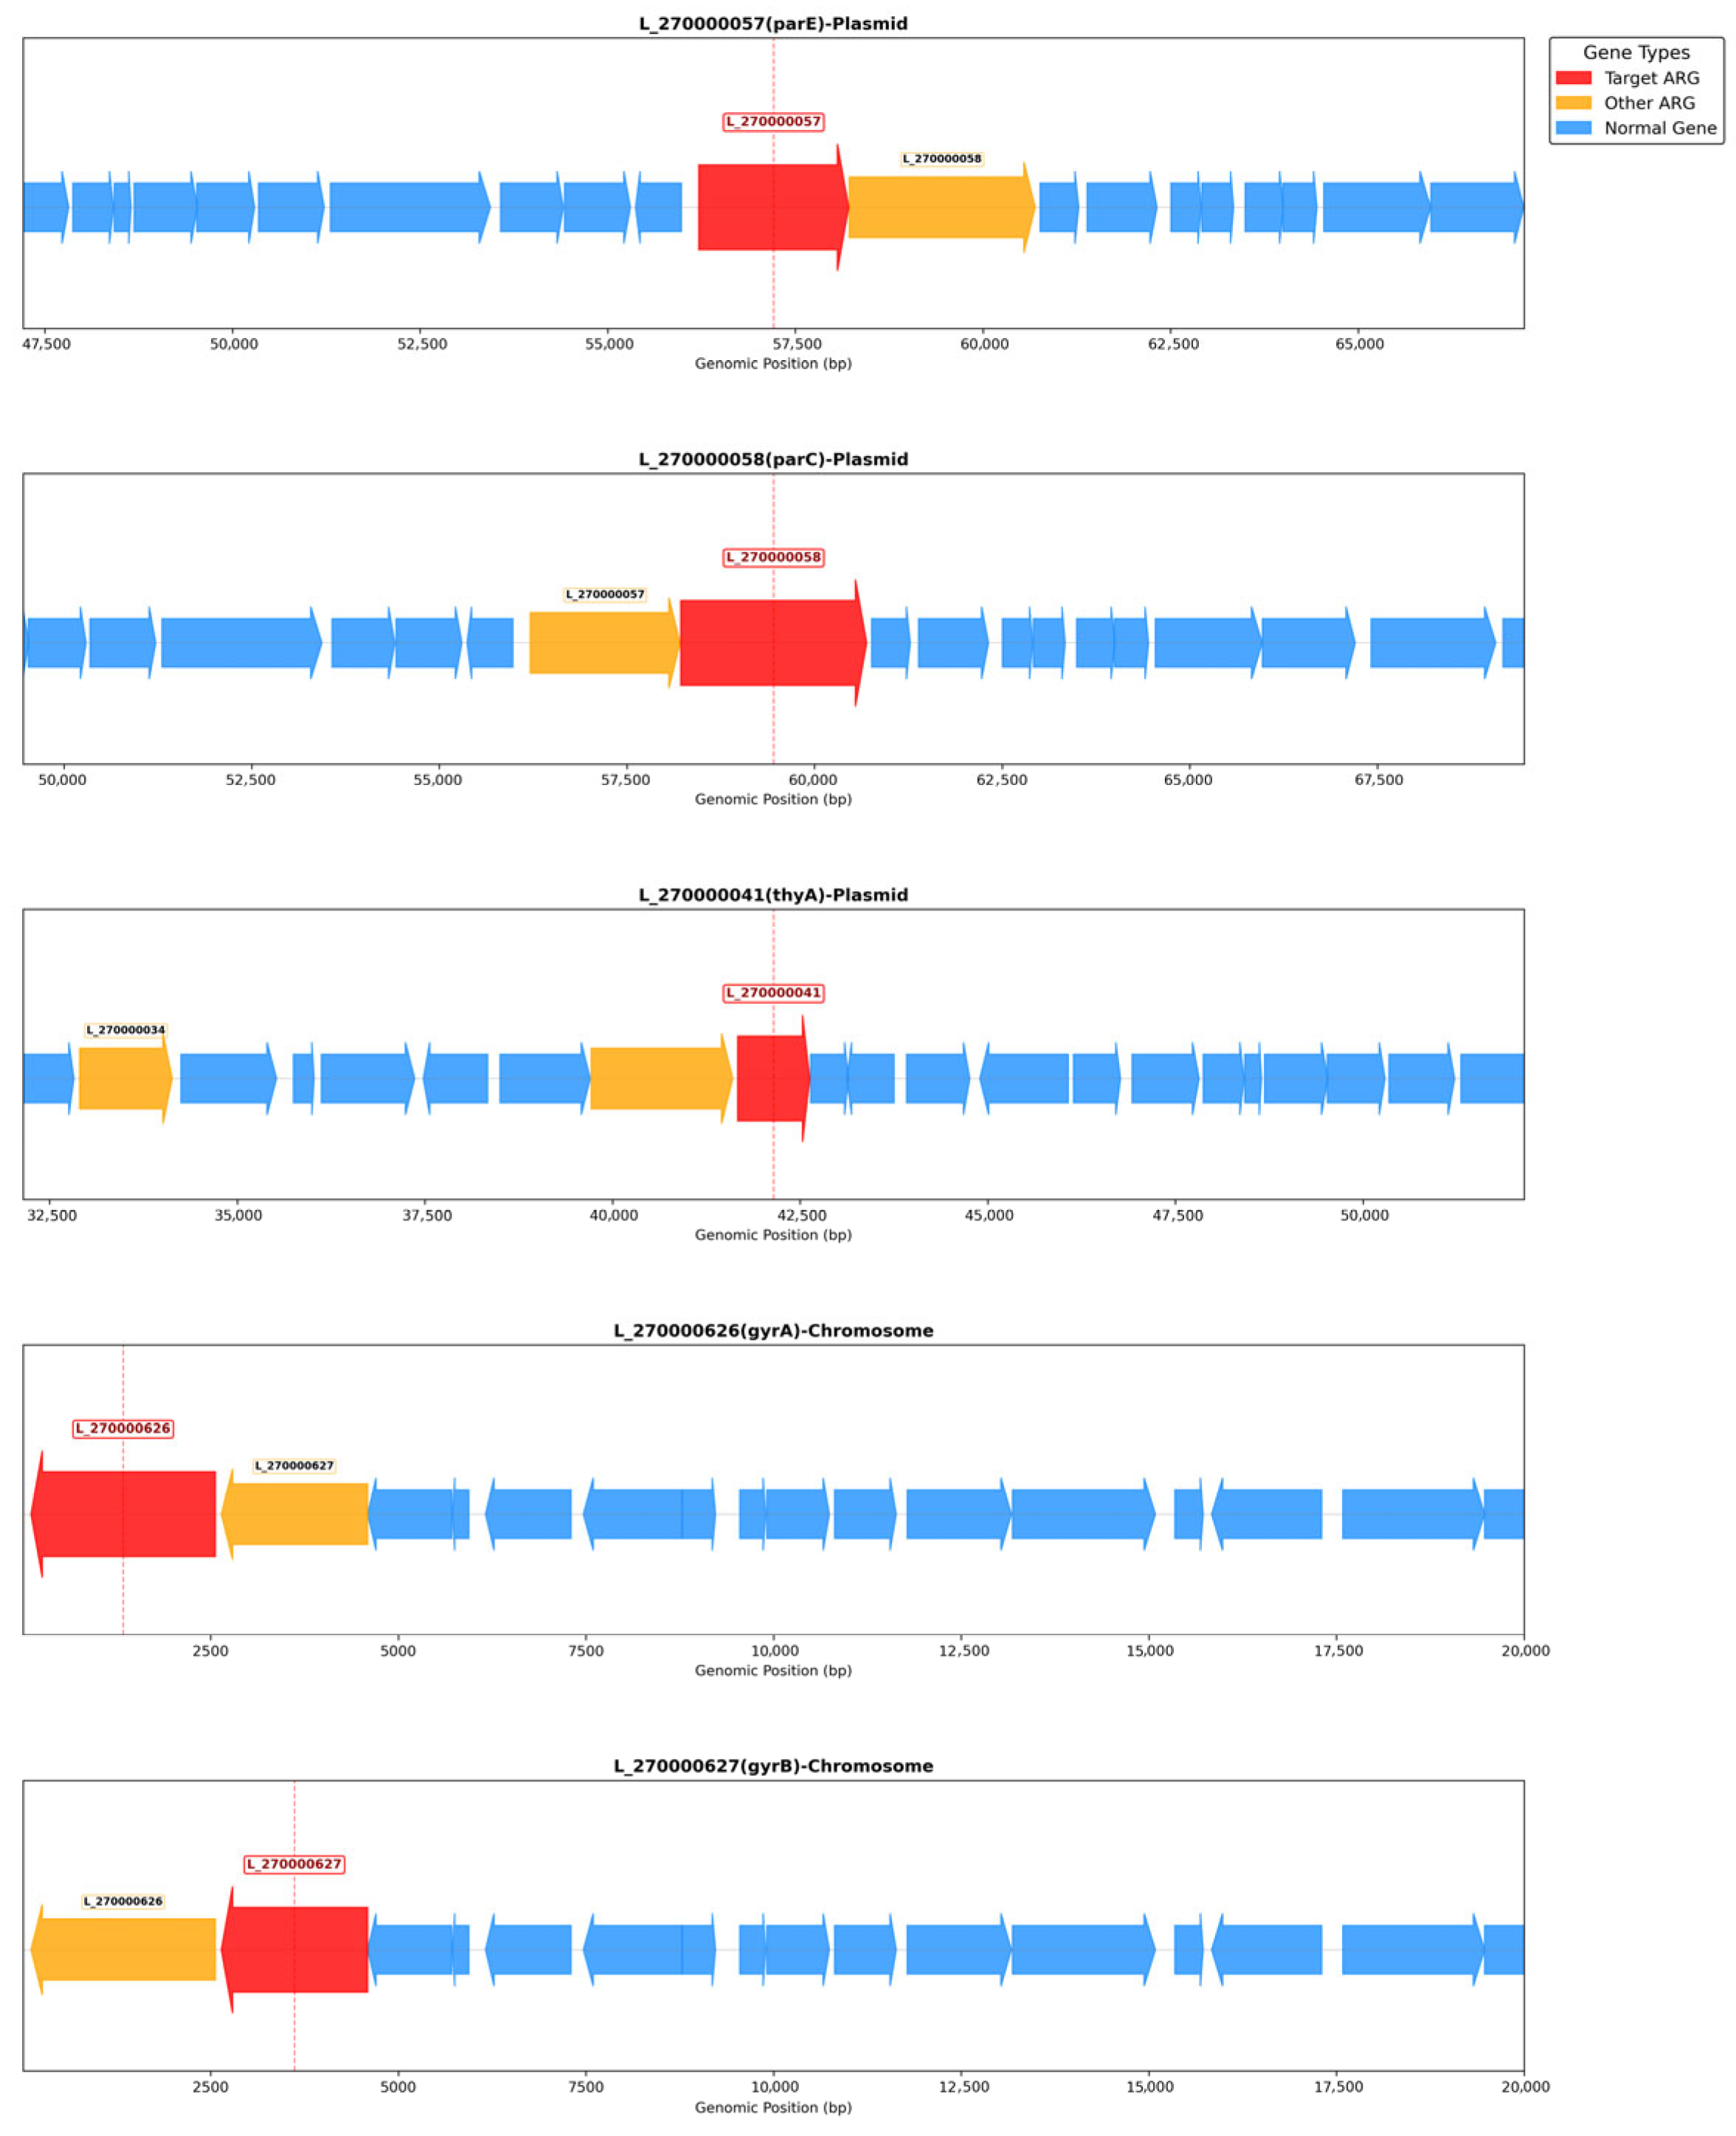
Genomic context of key antibiotic resistance genes. The diagram illustrates a 20-kb window (10 kb upstream and downstream) around each target gene. Genes are shown as arrows (orientation = transcriptional strand; length ∝ gene size). Color code: target ARG (red), other ARGs (orange), non-ARG genes (blue).
Figure 7.
Genomic context of key antibiotic resistance genes. The diagram illustrates a 20-kb window (10 kb upstream and downstream) around each target gene. Genes are shown as arrows (orientation = transcriptional strand; length ∝ gene size). Color code: target ARG (red), other ARGs (orange), non-ARG genes (blue).
Figure 8.
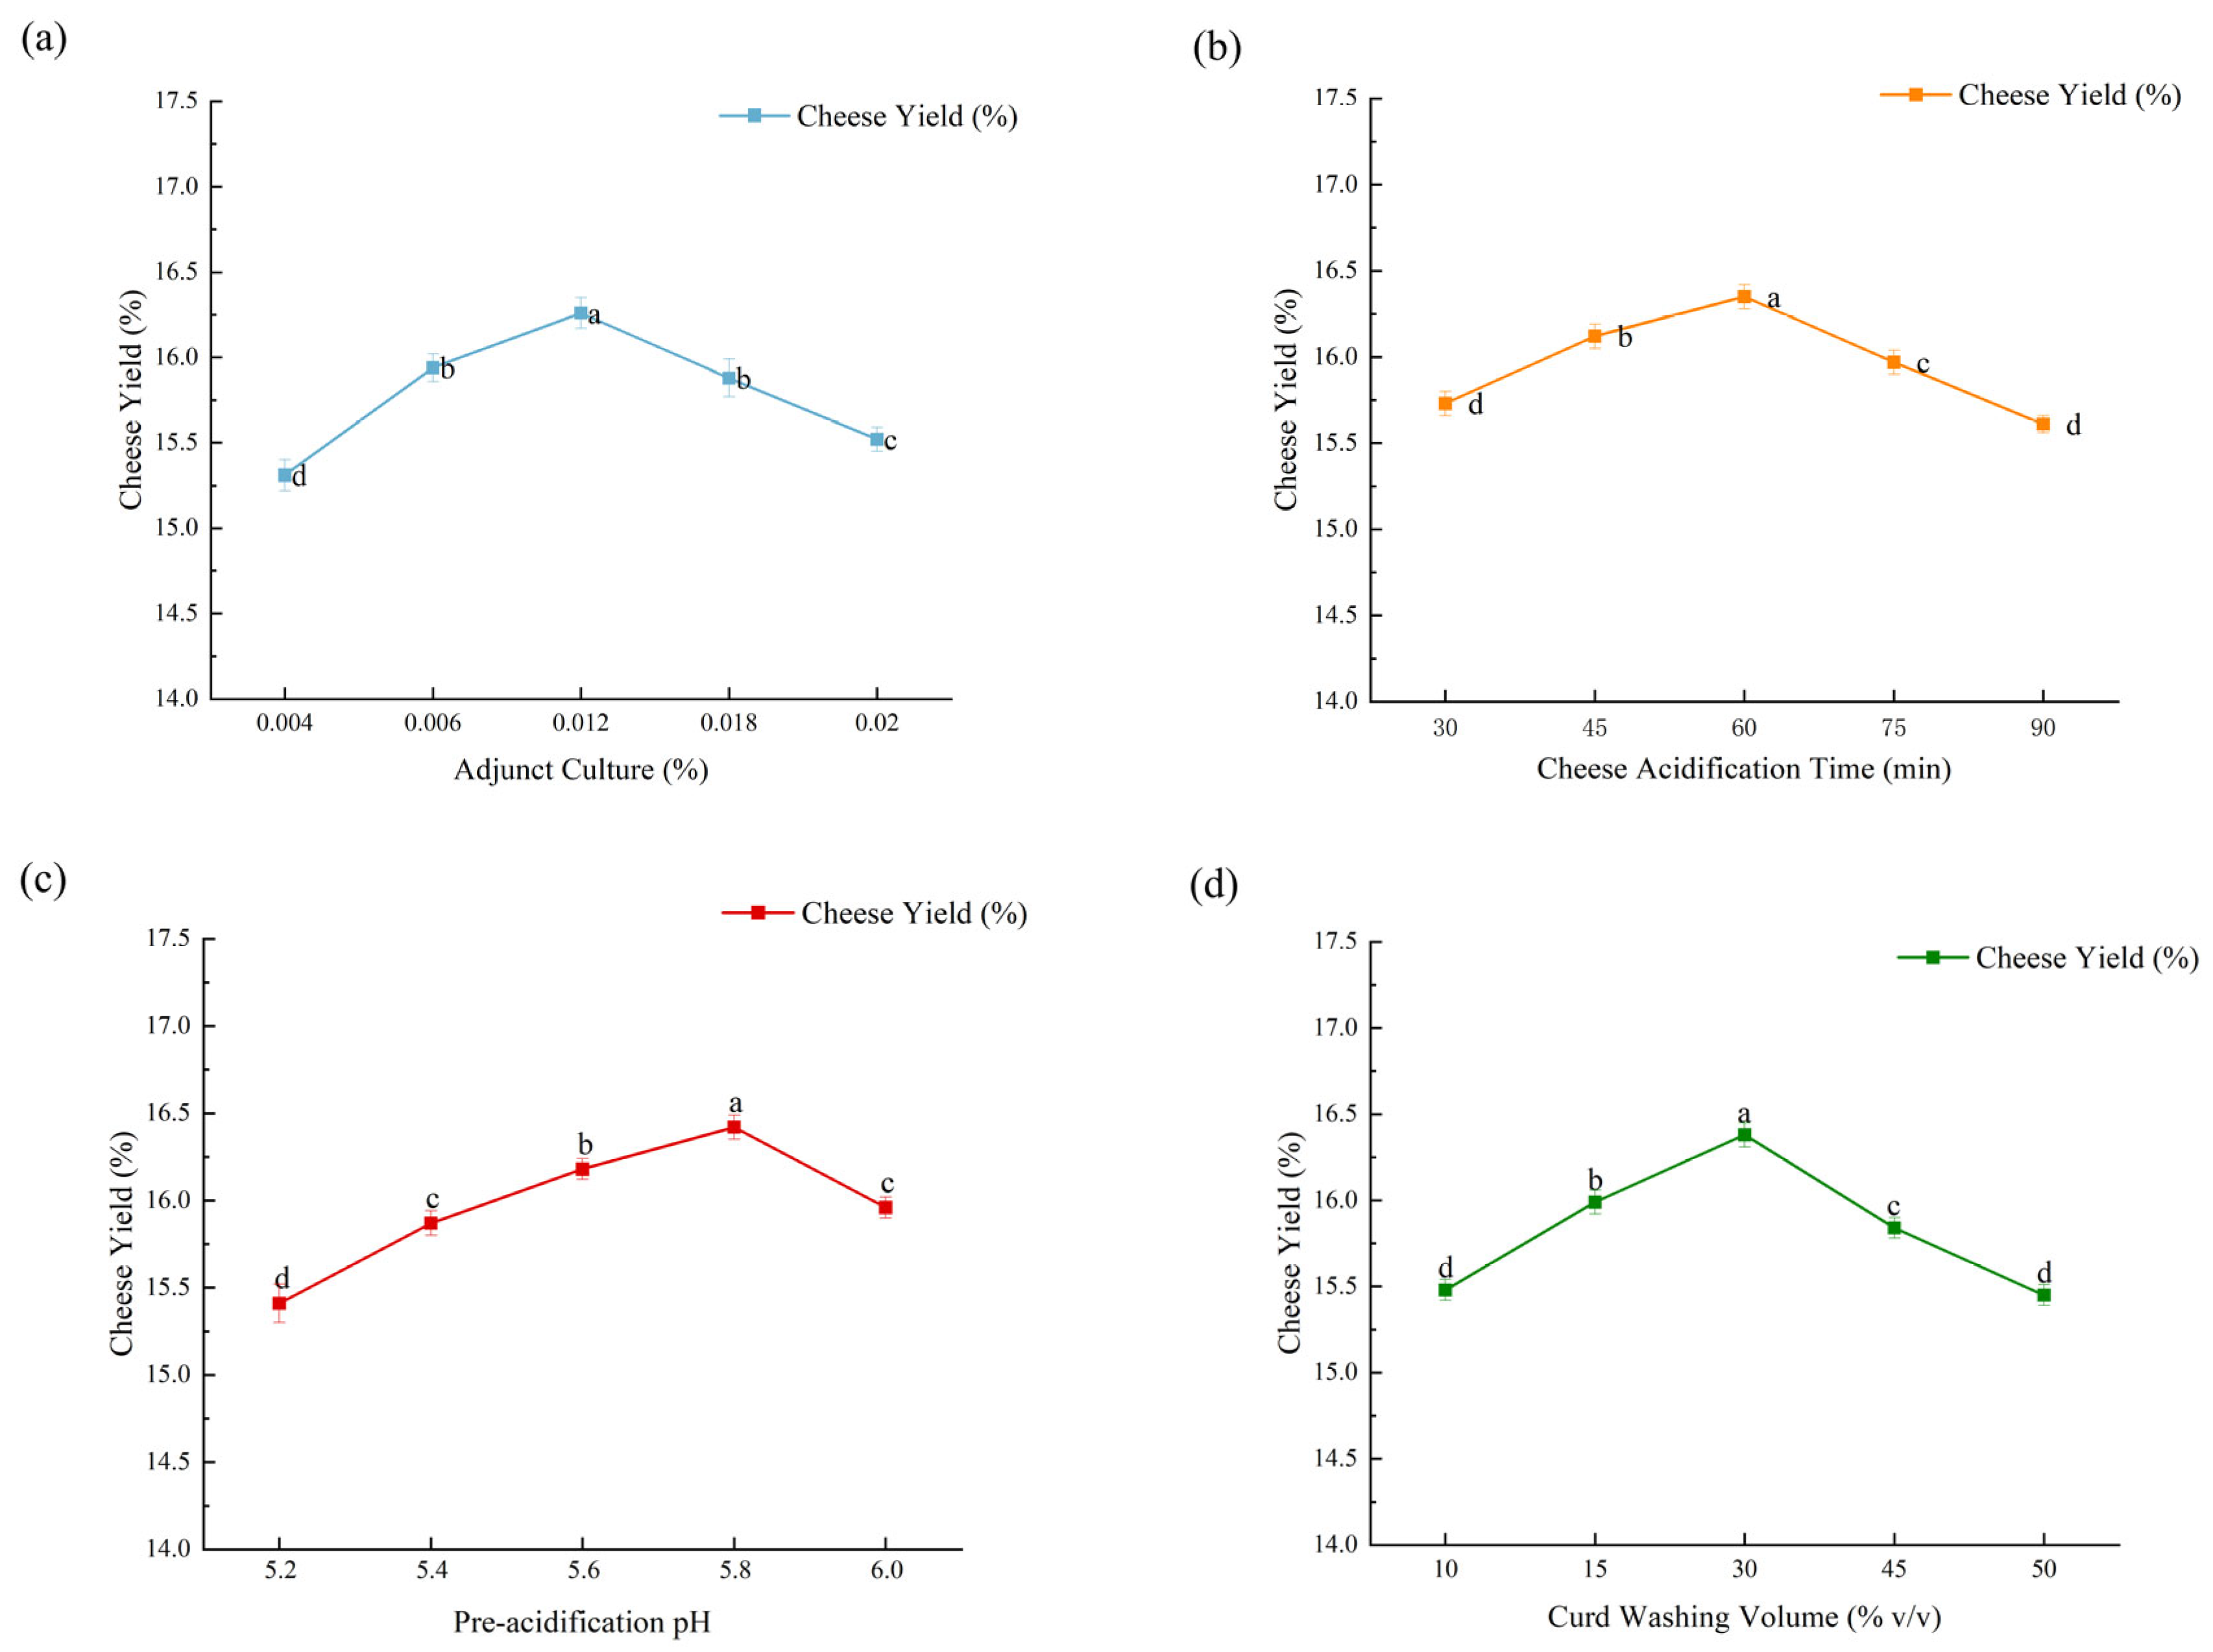
Effects of processing parameters on cheese yield: (a) adjunct starter culture addition; (b) cheese acidification time; (c) pre-acidification pH; and (d) curd washing volume. Different lowercase letters (a–d) above data points indicate significant differences among tested levels within each factor (p < 0.05).
Figure 8.
Effects of processing parameters on cheese yield: (a) adjunct starter culture addition; (b) cheese acidification time; (c) pre-acidification pH; and (d) curd washing volume. Different lowercase letters (a–d) above data points indicate significant differences among tested levels within each factor (p < 0.05).
Table 1.
Dominant lactic acid bacteria in high salt, low temperature and acidic environment.
Table 1.
Dominant lactic acid bacteria in high salt, low temperature and acidic environment.
| Strain ID | OD600 |
|---|
| 213 | 0.721 ± 0.037 a |
| 237 | 0.720 ± 0.010 a |
| 263 | 0.653 ± 0.015 b |
| 260 | 0.627 ± 0.018 bc |
| 262 | 0.601 ± 0.008 cd |
| 9 | 0.574 ± 0.011 d |
| 273 | 0.563 ± 0.033 d |
| 238 | 0.506 ± 0.020 e |
| 270 | 0.427 ± 0.011 f |
| 277 | 0.405 ± 0.011 fg |
| 259 | 0.397 ± 0.009 fgh |
| 224 | 0.367 ± 0.015 ghi |
| 276 | 0.356 ± 0.004 hi |
| 275 | 0.338 ± 0.044 ij |
| 18 | 0.311 ± 0.007 j |
Table 2.
Antibiotic susceptibility results.
Table 2.
Antibiotic susceptibility results.
| Antibiotic | Strain 9 | Strain 263 | Strain 270 |
|---|
| Inhibition Zone (mm) | Susceptibility | Inhibition Zone (mm) | Susceptibility | Inhibition Zone (mm) | Susceptibility |
|---|
| Penicillin (PEN) | 31.85 ± 0.15 | S | 33.20 ± 0.20 | S | 31.80 ± 0.30 | S |
| Kanamycin (KAN) | 8.95 ± 0.35 | R | 10.97 ± 0.54 | R | 9.77 ± 0.26 | R |
| Vancomycin (VAN) | 8.15 ± 0.15 | R | 7.55 ± 0.15 | R | 8.20 ± 0.10 | R |
| Tetracycline (TET) | 20.20 ± 0.10 | S | 21.95 ± 0.05 | S | 20.15 ± 0.35 | S |
| Azithromycin (AZM) | 19.65 ± 0.15 | S | 20.33 ± 0.88 | S | 22.30 ± 0.60 | S |
| Erythromycin (ERY) | 29.40 ± 0.50 | S | 31.97 ± 0.61 | S | 27.85 ± 0.45 | S |
| Norfloxacin (NOR) | 6.85 ± 0.05 | R | 6.97 ± 0.12 | R | 8.90 ± 0.10 | R |
Table 3.
Genome assembly quality assessment statistics of L. fermentum 270.
Table 3.
Genome assembly quality assessment statistics of L. fermentum 270.
| Assessment Item | Value |
|---|
| Number of scaffolds | 117 |
| Total length (bp) | 2,029,436 |
| Number of large scaffolds (>1 kbp) | 95 |
| Largest scaffold (bp) | 120,508 |
| Scaffold N50 (bp) | 37,772 |
| Scaffold N90 (bp) | 10,106 |
| GC content (%) | 51.75 |
| N rate (%) | 0.004 |
Table 4.
Summary of VFDB Annotation Results.
Table 4.
Summary of VFDB Annotation Results.
| Gene ID | Identify (%) | Identify-Len | E-Value | Coverage (%) | Gene | VFid | Description | Type |
|---|
| L_270000308 | 71.9 | 228 | 9.2 × 10−92 | 100 | lisR | VFG006826 | Two-component response regulator | Regulation |
| L_270001292 | 70.6 | 391 | 3.0 × 10−162 | 98.73 | tuf | VFG016490 | Translation elongation factor Tu | Adherence/Invasion |
| L_270001585 | 70.9 | 302 | 2.4 × 10−119 | 99.66 | hasC | VFG005874 | UTP--glucose-1-phosphate uridylyltransferase | Immune Evasion |
| L_270002027 | 71.7 | 434 | 9.5 × 10−178 | 98.63 | eno | VFG005582 | Enolase | Enzyme |
Table 5.
Putative antibiotic resistance genes in L. fermentum 270 with >50% identity to entries in the CARD database.
Table 5.
Putative antibiotic resistance genes in L. fermentum 270 with >50% identity to entries in the CARD database.
| Gene ID | Scaffold | Identify (%) | Identify-Len | E-Value | Coverage (%) | AROid | Gene | Drug Class | Resistance Mechanism |
|---|
| L_270001292 | L_270_scaffold22 | 75.19 | 391 | 0 | 92.43 | ARO:3003438 | EF-Tu | elfamycin antibiotic | antibiotic target alteration |
| L_270000988 | L_270_scaffold14 | 68.89 | 1186 | 0 | 100 | ARO:3003285 | rpoB | rifamycin antibiotic | antibiotic target alteration, antibiotic target replacement |
| L_270000996 | L_270_scaffold14 | 68.5 | 692 | 0 | 99.86 | ARO:3003735 | fusA | fusidane antibiotic | antibiotic target alteration |
| L_270000989 | L_270_scaffold14 | 66.64 | 1181 | 0 | 97.85 | ARO:3003291 | rpoC | peptide antibiotic | antibiotic target alteration |
| L_270000057 | L_270_scaffold1 | 65.36 | 638 | 0 | 95.94 | ARO:3003315 | parE | fluoroquinolone antibiotic | antibiotic target alteration |
| L_270000627 | L_270_scaffold7 | 62.68 | 635 | 0 | 98.76 | ARO:3003301 | gyrB | aminocoumarin antibiotic | antibiotic target alteration |
| L_270000626 | L_270_scaffold7 | 57.78 | 829 | 0 | 93.46 | ARO:3003296 | gyrA | fluoroquinolone antibiotic | antibiotic target alteration |
| L_270000058 | L_270_scaffold1 | 55.82 | 808 | 0 | 97.82 | ARO:3003311 | parC | fluoroquinolone antibiotic | antibiotic target alteration |
| L_270000308 | L_270_scaffold3 | 55.51 | 227 | 3.00 × 10−83 | 100 | ARO:3000838 | arlR | disinfecting agents and antiseptics, fluoroquinolone antibiotic | antibiotic efflux |
| L_270001012 | L_270_scaffold14 | 53.37 | 178 | 1.00 × 10−61 | 100 | ARO:3003737 | fusE | fusidane antibiotic | antibiotic target alteration |
| L_270001260 | L_270_scaffold21 | 52.76 | 923 | 0 | 100 | ARO:3003729 | ileS | mupirocin-like antibiotic | antibiotic target alteration |
| L_270000041 | L_270_scaffold1 | 52.09 | 311 | 2.00 × 10−104 | 100 | ARO:3004153 | thyA | salicylic acid antibiotic | antibiotic target alteration |
Table 6.
Genomic localization of candidate antibiotic-resistant genes.
Table 6.
Genomic localization of candidate antibiotic-resistant genes.
| Gene ID | Scaffold | Location Type |
|---|
| L_270001292 | L_270_scaffold22 | Chromosome |
| L_270000988 | L_270_scaffold14 | Chromosome |
| L_270000996 | L_270_scaffold14 | Chromosome |
| L_270000989 | L_270_scaffold14 | Chromosome |
| L_270000057 | L_270_scaffold1 | Plasmid |
| L_270000627 | L_270_scaffold7 | Chromosome |
| L_270000626 | L_270_scaffold7 | Chromosome |
| L_270000058 | L_270_scaffold1 | Plasmid |
| L_270000308 | L_270_scaffold3 | Chromosome |
| L_270001012 | L_270_scaffold14 | Chromosome |
| L_270001260 | L_270_scaffold21 | Chromosome |
| L_270000041 | L_270_scaffold1 | Plasmid |
Table 7.
Characteristics and genomic locations of six representative prophage regions in L. fermentum 270.
Table 7.
Characteristics and genomic locations of six representative prophage regions in L. fermentum 270.
| Prophage ID | Scaffold | Length (bp) | Gene Count | Contains Risk Genes |
|---|
| Prophage3 | L_270_scaffold4 | 25,291 | 37 | no |
| Prophage2 | L_270_scaffold4 | 20,813 | 19 | yes |
| Prophage7 | L_270_scaffold14 | 17,373 | 31 | yes |
| Prophage1 | L_270_scaffold1 | 16,325 | 32 | no |
| Prophage6 | L_270_scaffold13 | 13,644 | 16 | yes |
| Prophage11 | L_270_scaffold61 | 5436 | 6 | yes |
Table 8.
Putative virulence and antibiotic resistance gene homologs identified within prophage regions of L. fermentum 270.
Table 8.
Putative virulence and antibiotic resistance gene homologs identified within prophage regions of L. fermentum 270.
| Located Prophage | Gene ID | Gene Type | Gene | Identity (%) |
|---|
| Prophage7 | L_270001012 | Antibiotic Resistance Genes | fusE | 53.37 |
| Prophage2 | L_270000414 | Antibiotic Resistance Genes | pgsA | 49.47 |
| Prophage6 | L_270000981 | Antibiotic Resistance Genes | D-Ala-D-Ala | 35.31 |
| Prophage11 | L_270002027 | Virulence Factors | eno | 71.70 |
Table 9.
CRISPR annotation summary.
Table 9.
CRISPR annotation summary.
| Seqid | CRISPR Id | Start | End | Repeat_Num | Aver_Repeat_Len | Spacer_Num | Aver_Spacer_Len |
|---|
| L_270_scaffold12 | CRISPR1 | 1805 | 2049 | 4 | 36 | 3 | 33 |
| L_270_scaffold30 | CRISPR2 | 20,786 | 20,896 | 2 | 38 | 1 | 35 |
| L_270_scaffold37 | CRISPR3 | 18,889 | 20,685 | 30 | 28 | 29 | 33 |
| L_270_scaffold51 | CRISPR4 | 2561 | 2654 | 2 | 34 | 1 | 26 |
| L_270_scaffold73 | CRISPR5 | 3203 | 3304 | 2 | 26 | 1 | 50 |
Table 10.
Analysis of orthogonal test results.
Table 10.
Analysis of orthogonal test results.
| Group | Adjunct Starter Culture Addition/% | Acidification Time/min | Pre-Acidification pH | Curd Washing Volume/% | Cheese Yield/% |
|---|
| 1 | A1 | B1 | C1 | D1 | 16.47 ± 0.11 bc |
| 2 | A1 | B2 | C2 | D2 | 16.28 ± 0.07 c |
| 3 | A1 | B3 | C3 | D3 | 16.29 ± 0.09 c |
| 4 | A2 | B1 | C2 | D3 | 16.32 ± 0.10 bc |
| 5 | A2 | B2 | C3 | D1 | 16.55 ± 0.05 b |
| 6 | A2 | B3 | C1 | D2 | 15.75 ± 0.11 e |
| 7 | A3 | B1 | C3 | D2 | 17.04 ± 0.13 a |
| 8 | A3 | B2 | C1 | D3 | 16.04 ± 0.16 b |
| 9 | A3 | B3 | C2 | D1 | 16.30 ± 0.09 c |
| K1 | 43.10 | 83.4 | 85.1 | 88.4 | |
| K2 | 44.06 | 86.8 | 87.2 | 87.4 | |
| K3 | 41.03 | 87.0 | 86.4 | 85.6 | |
| R | 3.03 | 2.43 | 3.66 | 2.99 | |
| k1 | 16.35 | 16.61 | 16.09 | 16.44 | |
| k2 | 16.21 | 16.29 | 16.30 | 16.36 | |
| k3 | 16.46 | 16.12 | 16.63 | 16.22 | |
Table 11.
Variance analysis results of cheese yield rate in orthogonal test.
Table 11.
Variance analysis results of cheese yield rate in orthogonal test.
| Factor | Sum of Squares | Mean Square | F-Value | p-Value |
|---|
| Adjunct starter culture addition | 0.2929 | 0.14645 | 8.75 | 0.002 |
| acidification time | 1.1428 | 0.57140 | 34.14 | 0.000 |
| Pre-acidification pH | 1.3394 | 0.66969 | 40.01 | 0.000 |
| Curd washing volume | 0.2280 | 0.11401 | 6.81 | 0.006 |
Table 12.
Verify experimental results.
Table 12.
Verify experimental results.
| Condition | Factor | Yield/% |
|---|
| A | B | C | D |
|---|
| Experimental set | A3 | B1 | C3 | D2 | 17.04 ± 0.13 |
| Theoretical set | A2 | B3 | C2 | D1 | 16.61 ± 0.10 |