Article

Effect of UHPH and Sulphur Dioxide Content on Verdejo Vinification: Sensory, Chemical, and Microbiological Approach After Accelerated Aging Test

by
Miquel Puxeu
1,*,
Carlos Sánchez-Mateos
1,
Inés Horcajo-Abal
1,
Mercè Sunyer-Figueres
1,
Victoria Castillo
1,
Daniel Fernández-Vázquez
1,
Alejandro Suárez
1,
Natalia Santamaría
1,
Enric Nart
1,
Sergi de Lamo
1,
Antonio Morata
2 and
Immaculada Andorrà
1
1
Parc Tecnològic del Vi, Carretera de Porrera Km. 1, 43730 Falset, Spain
2
enotecUPM, Chemistry and Food Technology Department, ETSIAAB, Universidad Politécnica de Madrid, Avenida Complutense S/N, 28040 Madrid, Spain
*
Author to whom correspondence should be addressed.
Microorganisms 2025, 13(11), 2623; https://doi.org/10.3390/microorganisms13112623
Submission received: 30 September 2025 / Revised: 14 November 2025 / Accepted: 15 November 2025 / Published: 19 November 2025
(This article belongs to the Special Issue Wine Fermentation Microorganisms)

Abstract

Ultra-High-Pressure Homogenization (UHPH) is increasingly accepted by alimentation industries as a methodology to prevent microbial contamination with minimal impact on food organoleptic characteristics. Since 2022 the International Organization of Vine and Wine allows the use of high pressure (over 200 MPa), applied continuously, in winemaking. While previous works reported the impact of UHPH technology on must microbiology and color; in the present work, the effect of UHPH in Verdejo is investigated, evaluated, and compared with the use of different amounts of sulphur dioxide from a sensorial, chemical, and microbiological point of view. Our findings indicate that combining low doses of sulphur dioxide with UHPH improves wine quality, increasing the floral and overall assessment and decreasing the amount of aging flavors after an accelerated aging test. This study provides new insights into the effect of UHPH on wine quality and, specifically, on how the aging potential contributes to a better understanding of the impact of UHPH technology on the shelf life of wines.

1. Introduction

Sulphur dioxide (SO2) is the most common antioxidant and antibacterial agent used by the wine industry. Winemakers worldwide and food processing industries, in general, use it to prevent wine from oxidation, ensure stability from a microbiological point of view, and protect must and wine during all the processes of polyphenol aromatic damage and spoilage. However, some studies point to SO2 as potential cause of adverse health effects like abdominal pain, urticaria, headaches, and toxicity in vital organs [1]. In the last two decades, wine producers have been studying how to produce high-quality wines using less sulphur dioxide or even SO2-free processes, according to the preferences of consumers who are looking for healthy products [2]. Additionally, the International Organization of Vine and Wine (OIV) has gradually decreased the maximum limit of the total SO2 content in wines, which is currently at 150 mg/L for red wines and 200 mg/L for white wines, with some exceptions depending on the sugar content (OIV Resolution OENO 9/98).
In the last decade, most studies have focused on decreasing SO2 levels in wines through chemical methods, using alternative substances or agents in different steps of the winemaking process which could mimic SO2 activity. Tannins or yeast that produce and release glutathione into grape must or wine are examples of alternative antioxidants used by wineries that desire to minimize the use of SO2 for winemaking [3,4]. In fact, the oxidative protection and antimicrobial effect of adding tannins to wine are well documented [5]. Additionally, in terms of microbiological stability, including the control of wild microorganism populations, some agents like dimethyldicarbonate, lysozyme, or phenolic compounds have been tested with satisfactory results [6]. From an economic and technical point of view, the above-mentioned chemical techniques used to ensure wine microbiological stability and to prevent oxidation were considered more versatile than the use of physical methods [1,7]. On the other hand, the main advantage of using physical methods to improve microbiological stability is the absence of products added to the wine that could interfere with their organoleptic properties [7]. Some of the existing physical techniques which could replace the use of SO2 during the winemaking process or decrease its use and that have a direct effect on microorganism presence are pulsed electric fields (PEFs), ultraviolet (UV) radiation, high hydrostatic pressure (HHP), and flash-pasteurization [8,9,10]. Implementing new technologies in the winemaking process is a natural consequence of recent advances and research findings [11,12]. Recently, Ultra-High-Pressure Homogenization (UHPH) has emerged as a new physical technique to reduce or eliminate wild microorganisms in must or wine, ensuring microbial stability and the inactivation of oxidative enzymes like polyphenol oxidase (PPO), contributing to producing wines with improved sensory quality and longer shelf life while decreasing the need for sulphur dioxide [13,14,15,16].
UHPH is the natural evolution of the high-pressure process (HPP) with the advantage over the latter of being a continuous process. HPP uses pressures of 200 MPa or less while UHPH involves pressures higher than 200 MPa [17,18]. UHPH technology was accepted by the OIV in 2020 by the OIV-OENO resolution 594B-2020. What makes this technology interesting to winemakers is that it does not involve exposing the wine to thermal conditions known to affect wine’s organoleptic properties. Therefore, winemakers may continue producing high-quality wines with less SO2 while avoiding the negative consequences of alternative physical or thermal treatments [13]. High-pressure technologies have been used in other food manufacturing industries, such as the production of milk or fruit juices, since 1990 [18,19].
Oxygen (O2) concentration plays a fundamental role in wine quality outcomes, since the dissolved oxygen can have both good and bad consequences depending on timing in the winemaking process and existing concentrations [20]. For instance, the addition of oxygen during fermentation has a positive effect. In fact, oxygen deficiencies are among the main causes of fermentation interruptions, and the addition of at least 10–15 mg/L is often necessary [21]. However, at high O2 concentrations, and depending on other factors such as pH, the concentration of certain phenolic compounds, the presence of exogenous antioxidants such as SO2 or ascorbic acid, and storage temperature, wine can become oxidized [22].
The presence of certain chemical compounds such as methional, eugenol, sotolon, and 2,3,4-trimethyl-1,3-dioxane has been associated with oxidative degradation [23]. These compounds are associated with aromas described as “honey”, “dried fruit”, “farm feed”, “woody-like”, “cooked”, “oxidized apple”, and “aldehyde”; some of these descriptors have a negative impact on the aromatic composition of wine [22]. While the addition of sulphur dioxide is currently the mainstream technique used to prevent wine oxidation, the UHPH technique presents a promising, less-invasive alternative to combat the aging process of wine which is potentially more effective because of the direct and intense inactivation of polyphenol oxidases (PPOs) [24].
This study evaluates the effectivity of UHPH technology combined with ranging SO2 concentrations to prevent oxidation processes and microbial spoilage in winemaking. To evaluate the shelf life of wines produced under different combinations of UHPH and SO2, the chemical and microbiological properties of grape must as well as the sensory, chemical, and microbiological properties of wine were evaluated after an accelerated aging process.

2. Materials and Methods

2.1. Must Obtention and Preparation

The grapes were hand-picked from Vitis vinifera sp. verdejo vines in a commercial vineyard belonging to Bodegas Beronia (Rueda, Spain) during the 2024 harvest period. The fruit was harvested directly into 15 kg boxes and transported under refrigeration (at 4 °C) to the VITEC experimental winery in Tarragona (Spain). Once at the winery, the must was obtained using a Mini Ullrich Willmes Weintechnik press (Lampertheim, Germany) with a 300 kg whole-grape capacity and immediately transferred into 50 L steel tanks. The cold settling was carried out at 14 °C for 24 h using a Lafazyme CR enzyme at 1 g/hL (Laffort®, Floirac, France). A basic chemical characterization of the must was performed after clarification, and then the must was divided into two different sets. The first set underwent an UHPH technology process and was then divided into six independent tanks of 30 L, corresponding to 3 SO2 doses, with 2 repetitions each: UHPH SO2-free (×2), UHPH 50% SO2 (×2), and UHPH SO2 (×2). The second set did not undergo UHPH and was also divided into six independent tanks of 30 L named SO2-free (×2), 50% SO2 (×2), and SO2 (×2). The nomenclature “free” indicates that no sulphur dioxide was added at the grape, must, or wine stages, the nomenclature “50% SO2” indicates that the grapes and must were treated with 3 g/hL of sodium metabisulphite, and “SO2” indicates that the grapes and must were treated with 6 g/hL of sodium metabisulphite. A total number of six treatments and twelve tanks were studied.

2.2. Chemical Analysis

The chemical characterization of the must and wines was performed as follows. For must samples, the density, brix, potential alcohol strength, total acidity (expressed as tartaric acid), and pH, as well as the ammonia, primary amino nitrogen, and yeast-assimilable nitrogen contents were determined by infrared spectroscopy (FTIR) using a WineScanTM instrument (FOSS, Hilleroed, Denmark), and the glucose–fructose and malic acid contents were determined via enzymatic reaction using a Y200 instrument (Biosystems S.A., Barcelona, Spain). For wines, the alcoholic degree, total acidity (expressed as tartaric acid), volatile acidity (expressed as acetic acid), pH, and free and total sulphur dioxide contents were determined using infrared spectroscopy (FTIR), WineScanTM. The organic acid content (malic and lactic acids) was determined using the Y200 Biosystems equipment for enzymatic reactions (Biosystems S.A., Barcelona, Spain). For the colorimetric measurements, 10 mm path-length plastic cells were used to measure absorbances at 420 nm for yellow color contribution and at 450 nm, 520 nm, 570 nm, and 630 nm for the Cie Lab coordinates using a Helios-α spectrophotometer (Thermo Fisher Scientific, Waltham, MA, USA). Turbidity was measured with a Hach TL2310 turbidimeter (Hach, Loveland, CO, USA). Total phenols were determined using the Folin–Ciocalteu assay method (OIV-MA-AS2-10) with some modifications. Briefly, 100 μL of sample, 500 μL of Folin–Ciocalteu reagent, and 2 mL of a sodium carbonate solution (1.88 M) were mixed with water to obtain a final volume of 10 mL. The solution was stocked for 30 min for the reaction to take place and stabilize. Finally, the absorbance was measured at 750 nm by a Helios-α spectrophotometer (Thermo Fisher Scientific, Waltham, MA, USA). All analyses were performed according to the methods recommended by the Compendium of International Methods of Analysis—Organization of Vine and Wine (OIV) 2020 [25].

2.3. UHPH Treatment Conditions

Clarified must was processed using a UHPH system built under the patent by Universitat Autònoma de Barcelona (EP2409583B1) and capable of continuous UHPH treatment at 180 L/h (Ypsicon Advanced Technologies, Barcelona, Spain). The equipment used a tungsten carbide valve and was deployed in the VITEC experimental winery. The processing parameters were as follows: flow rate—180 L/h at 200 ± 10 MPa, inlet temperature—15 °C, in-valve temperature—65–78 °C for only 0.02 s, and outlet temperature—15 °C.

2.4. Microbiological Analysis

Common oenological microorganisms (yeast, lactic and acetic bacteria, and Brettanomyces) were quantified by plate count and Real-Time Polymerase Chain Reaction (RT-PCR). For the plate count, wine was inoculated into different solid media depending on the microorganism and incubated for different times and temperatures according to the methods described in the OIV (2020) [25], as follows: for the yeast count, YPDA medium (2% glucose, 2% peptone, 1% yeast extract, and 2% agar, w/v; Panreac, Barcelona, Spain) was used, incubated at 25 °C for 4 days; for the acetic acid bacteria count, GYC medium (5% glucose, 3% calcium carbonate, 1% yeast extract, 2.5% agar, 0.01% natamicyn, and 0.0013% penicillin, w/v; Panreac, Barcelona, Spain) was used, incubated at 25 °C for 6 days; for the lactic acid bacteria count, MRSA media (Sharlau, Barcelona, Spain) was used, incubated at 30 °C for 10 days, and for the Brettanomyces count, Brettanomyces Agar (Sharlau, Barcelona, Spain) was used, incubated at 25 °C for 7 days.
For the RT-PCR, 50 mL of wine or must was centrifuged to collect the cells, which were then washed, and DNA was isolated using the DNeasy Plant MiniKit (Qiagen, Valencia, CA, USA) with some modifications to improve cellular lysis. Prior to extraction, the cells were suspended, added to a 2 mL screw-cap tube with 1 g of 0.5 mm-diameter glass beads, and lysed using an MBB-16 Mini-Beadbeater (BioSpec Products, Cambridge, UK) (5 cycles of 30 s in the Mini-Beadbeater + 30 s on ice) [26]. RT-PCR was performed using a mix of the cells with 2 µL of DNA, 0.4 µL of each primer, 0.08 µL of ROX (SYBR Premix Ex II (TaKaRa Bio Inc., Shiga, Japan)), 10 µL of SYBR Green, and 2.12 µL of sterile Milli-Q water. The RT-PCR reactions were performed with different primers, according to each microorganism, to quantify the total yeast content, YEASTF and YEASTR [26]; lactic bacteria content, WLAB1 and WLAB 2 [27]; acetic acid bacteria content, AQ1F and AQ2R, and Brettanomyces content, DBRUX F and DBRUX R [28]. Amplification was conducted using a QuantStudio3 Real-Time PCR system (Thermo Fisher Scientific), following the amplification program, as follows: 50 °C for 2 min, 95 °C for 10 min, 40 cycles of 95 °C for 15 s, 60 °C for 1 min, and 72 °C, 30 s. Samples were analyzed in triplicate, and for all reactions, two negative controls were used (water as a non-template control (NTC) and an extraction negative control) and one sample of DNA was used as the positive control.

2.5. Particle Size After UHPH by Laser Diffraction

Particle size measurements were performed by laser diffraction, using the Malvern Mastersizer 2000® (Malvern Instruments Ltd., Malvern, UK). Samples were previously diluted with distilled water until the appropriate laser obscuration values were obtained (5–10%). The refractive indexes for the sample and water were set at 1.340 and 1.333, respectively. The particle size distribution was characterized by the D50 and D90 (particle diameter at 50 and 90% in the cumulative distribution) and d3.2 (surface area average diameter) and d4.3 (volume moment mean) parameters. Determination was performed on the third day after UHPH treatment. Measurements were performed in triplicate.

2.6. Particle Size and Colloidal Structure by Atomic Force Microscopy (AFM)

Air-dried must samples of 10 µL were scanned using a Nano-Observer AFM (Concept Scientific Instruments, Les Ulis, France) working in resonant mode to obtain the topography and sizes of colloidal particles included in the juice. The silicon cantilever used to analyze the surface had a strength of 1 N/m and a 15 nm nominal diameter (model Fort, AppNano, Mountain View, CA, USA). The frames used ranged from 100 to 10 µm and the scanning speed ranged from 2 to 0.5 L/second. For the UHPH treatments, more than 30 colloidal particles were measured.

2.7. Microfermentation Process

After the application of different concentrations of sulphur dioxide or UHPH, musts were fermented in a recirculating bath of cool water at 17 °C to avoid drastic changes in the fermentation temperature. Fifty liters of white must were settled at 12 °C in a temperature-controlled room and favored with the addition of 1.2 g/hL of LAFAZYM® CL (Agrovin S.L., Alcázar de San Juan, Spain) pectolytic enzymes. Thirty liters of clarified must was initiated with 20 g/hL Fermivin® PDM (Oenobrands SAS, Montferrier-sur-Lez, France) yeast, applying nutrition with Actimax Varietal (Agrovin S.L., Spain) at a density of 1.070 g/cm3 and with Actimax Plus (Agrovin S.L., Alcázar de San Juan, Spain) when the density reached 1.030 g/cm3. Then, the must was monitored by classical analytical techniques (density and temperature). Once residual sugar concentrations were lower than 0.5 g/L, alcoholic fermentation was considered completed and wines were stored under controlled temperatures. Before bottling, the obtained wines were clarified with the addition of 40 g/hL bentonite Microcol® (Laffort®, Floirac, France), cold-stabilized at 4 °C for 5 days and filtered through 0.80 µm pore sizes formed by a pleated polypropylene cartridge filter by Parker Hannifin (Cleveland, OH, USA). Experimental cellar facilities were cleaned and disinfected by hot water at 80 °C for 30 min and Ox-virin for all the surfaces (Grupo OX, Cuarte, Spain).

2.8. Accelerated Aging Process

Forced oxidation processes were performed following the conditions and protocols described by some authors [29,30]. Wine bottles with a 0.75 L capacity were separately oxidized by forcing an air stream against the wine under controlled laboratory conditions until oxygen saturation, 8.50 ppm [30]. The concentrations of dissolved oxygen for all samples submitted at accelerated aging were measured with a NomaSense P300 instrument (Vinventions France SAS, Ribesaltes, France) until the wine reached 100% saturation. Each saturated wine was kept in a closed glass bottle and incubated at 60 °C for 10 days. This forced aging implementation has been used previously in similar experiments with white wines [30,31]. After oxidation, a basic chemical characterization, fermentative aroma and oxidation aroma compounds by were conducted by GC-MS.

2.9. Analysis of Fermentation and Oxidation Aroma Compounds by Gas Chromatography with Mass Spectroscopy (GC-MS)

Fermentative aromas, oxidation resistance, and adequate aging potential are ongoing challenges in white wine production. Fermentative volatile compounds were analyzed as described by Torrens et al. [32]. An Agilent Technologies 7890A gas chromatograph (Palo Alto, CA, USA) was used, coupled to a triple quadrupole mass detector 5975 MSD equipped with a Headspace-HS injection MultiPurpose Autosampler for GC-MSD (Gerstel, Eberhard-Gerstel-Platz, Germany). The DB-WAX-UI column and pressure of (60 × 250 μm × 0.25 μm) were used at a flow rate of 1.6 mL/min and a pressure of 25 psi. Helium of purity greater than 99% was used as a carrier gas. The injector temperature was 250 °C for 1 min and then 235 °C to 260 °C/min. The oven temperature started at 40 °C for 1 min, rising to 225 °C at 15 °C/min and ending at 260 °C at 100 °C/min. The mass spectrometer was operated in electron ionization mode at 70 eV. Data acquisition and analysis was performed using Agilent Technologies MSD Chemstation software(version F.01.032357), performing a full-scan analysis (m/z 50–350). The volatile compounds were identified by comparison of their mass spectra, with the help of the NIST library. The quantification was carried out by the internal standard method (IS). The individual volatile compounds were quantified with the factor of response of 2-octanol (100 µL 2-octanol at a 1.000 ppm concentration in 10 mL of wine sample) and expressed as the equivalent of 2-octanol in μg/L. All analyses were carried out in duplicate.
Evolution compounds were determined using an Agilent Technologies 7890A gas chromatograph coupled to a triple quadrupole mass detector (MS) equipped with a liquid injection—LI MultiPurpose Autosampler for GC—GC/MS (Gerstel, Eberhard-Gerstel-Platz, Germany) according to [33]. The VF-200 ms (30 m × 250 μm × 0.25 μm) Agilent J&W GC Columns were used at a constant flow rate of 1.7 mL/min. Helium of purity greater than 99% was used as a carrier gas. A total of 5 µL was injected in Splitless mode with a pressure of 16 psi, a septum purge flow rate of 3 mL/min, and a Splitless time of 1 min. The injector temperature was 180 °C for 1 min and then 260 °C to 250 °C/min. Oven temperature started at 40 °C for 1 min, rising to 220 °C at 10 °C/min and ending at 270 °C at 100 °C/min. The mass spectrometer was operated in electron ionization mode at 70 eV. Data acquisition and analysis were performed using the Agilent Technologies MSD Chemstation software, performing a full-scan analysis (m/z 50–350) comparing with each of the reference compounds, which were calibrated against external (r2 > 0.99) and internal (20 µL 2-methylpentanal) standards. All compounds were from Fluka (Sigma-Aldrich, Buchs, Switzerland). The oxidative compounds were separated by derivatization with O-(2,3,4,5,5,6-pentafluorobenzyl) hydroxylamine (1 mL of 10 mg/mL) to obtain the derivatized oximes of the alkenals, aldehydes, ketones, lactones, and furans. These were then extracted with Bond Elut ENV cartridges (Agilent, Palo Alto, CA, USA) (200 mg) and collected with dichloromethane. Subsequently, the samples were evaporated from the solvent to 250 µL of concentrated extract to be injected and analyzed by GC-MS. In this study, the wine’s ability to resist oxidation was evaluated by comparing different antioxidant strategies, including the use of sulphites and ultra-high-pressure homogenization (UHPH).

2.10. Sensory Analysis

All the wines samples, produced according to the conditions described above, were sensory-analyzed in a normalized ISO 8589:2007 [34] room. The judges of the tasting panel were selected, trained, and qualified following the normative ISO 8586:2023 [35]. The training consisted in familiarization with sensory evaluation procedures, such as recognizing the basic tastes, aromas, and textures, as well as using standardized scales and rating systems to describe these attributes and their intensities. Once the initial training is complete, the active panel judges are regularly monitored to ensure their skills remain sharp and their tasting ability is consistent over time. Finally, a quantitative descriptive analysis (QDA) was carried out by 8 judges (age range: from 26 to 45 years old, 2 women and 6 men). The tasting panel used in this work has been continuously tasting since 2021 at a frequency of 2 tastings per week. Informed consent for participation was obtained from all subjects involved in the study, and no informed consent statement was required.
A test to determine if there were any significant differences between treatments was performed as follows. The two samples from different treatments were presented to the panel blindly (labeled with 3-digit random codes) using William’s design for the sample sets assigned to each judge. The sensory attributes were divided into 3 groups: color (intensity and evolution), aroma (intensity and profile), flavor (sourness, astringency, unctuosity, bitterness, persistence, dryness, tannic intensity, and burning), and overall assessment punctuation was also considered. Among the aroma profiles, fruity aromas (white, tropical, and citrus), spicy, balsamic, floral, chemical, and vegetal were considered. The attributes were rated on a linear scale ranging from 1 (absence) to 5 (maximum intensity). From the list of attributes, the judges only rated those that they perceived to be within the attribute’s scale. The wine ratings were collected using Compusense® Cloud software (Compusense Inc., Guelph, Ontario, Canada-Version 25.0.16).

2.11. Statistical Analysis

Means and standard deviations were calculated, and significant differences were determined by one-way analysis of variance (ANOVA) by the Tukey (HSD) test using the XLSTAT package (2016.01) for Excel software (Version 2510). Significance was set at p < 0.05.

3. Results and Discussion

3.1. Effect of UHPH on Colloidal Particle Size and Must Structure Using AFM

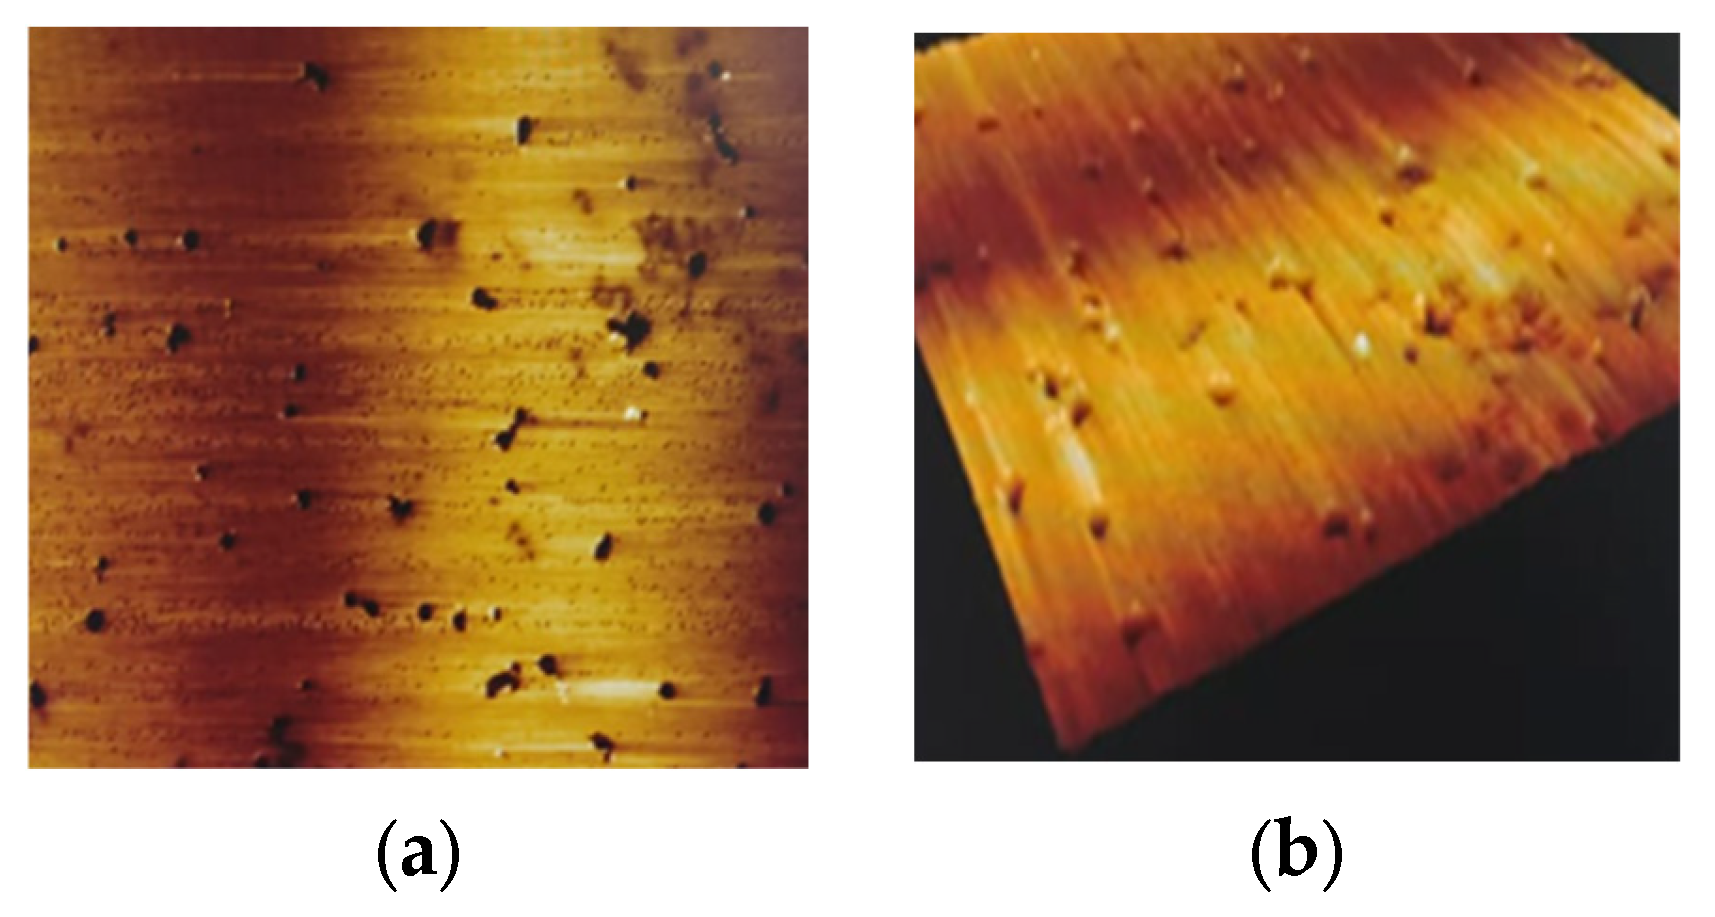
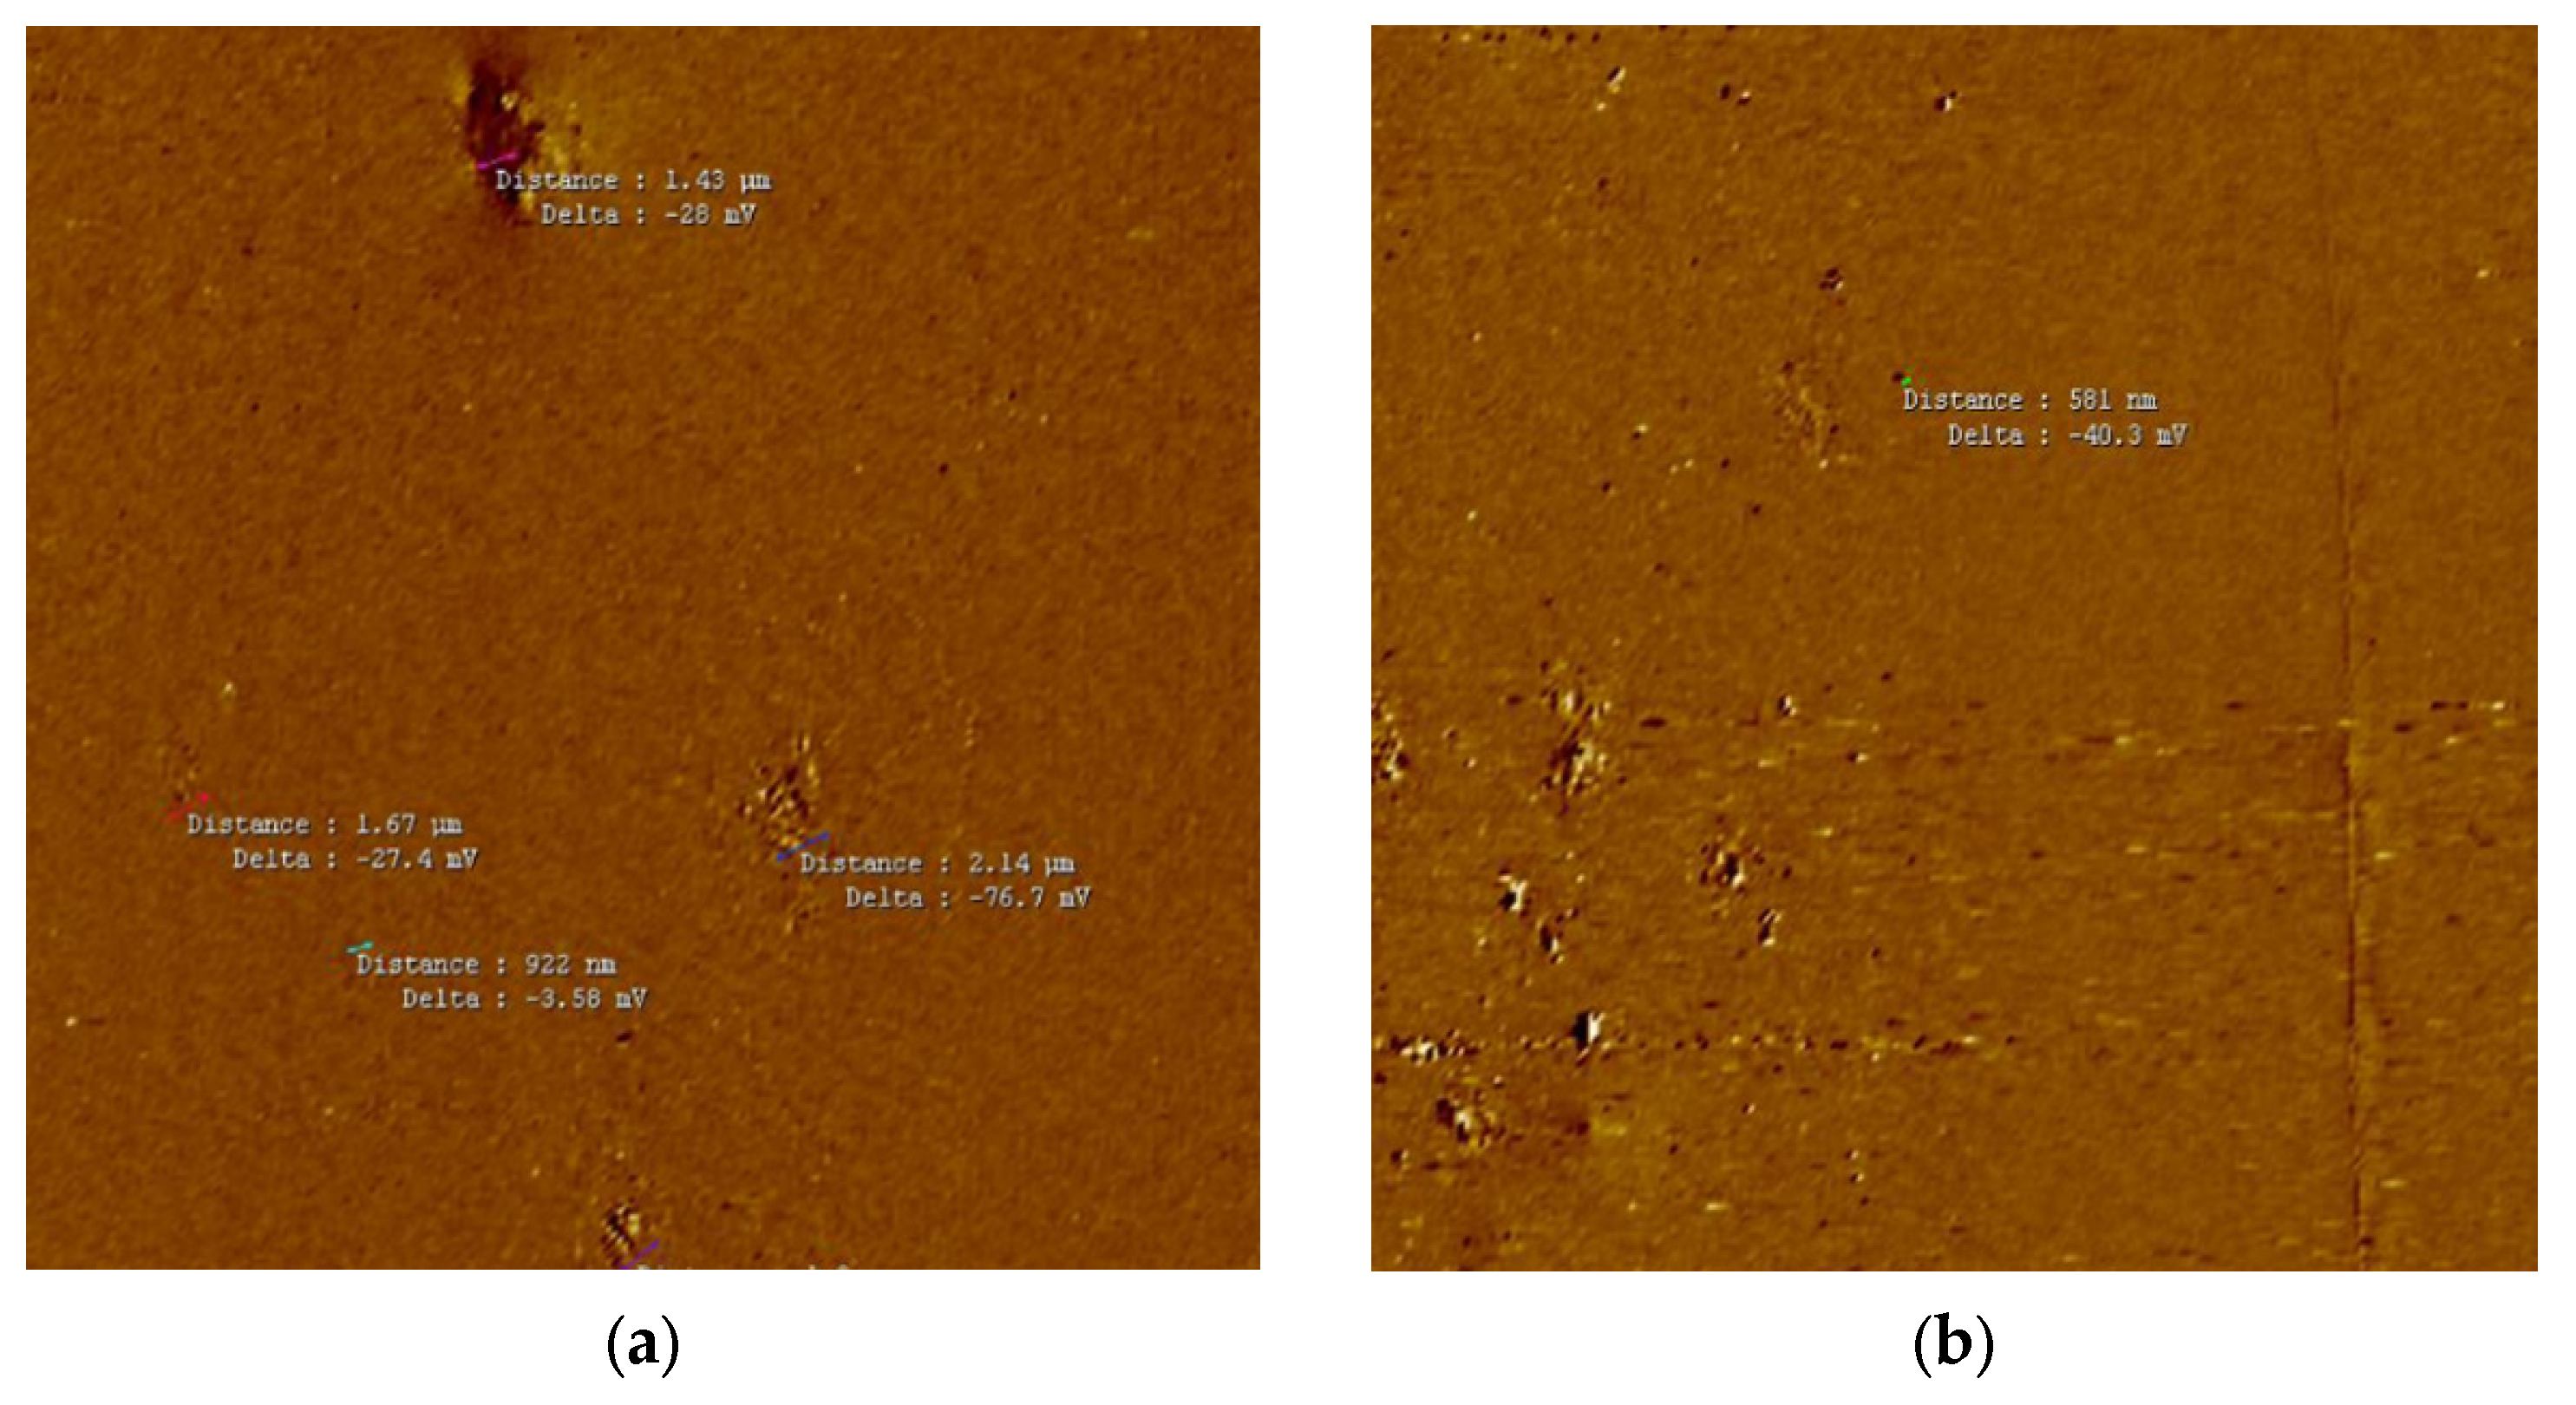
The dried juice of Verdejo grapes were scanned after UHPH treatment during the 2023 (preliminary works) and 2024 (present study) harvest periods, and the average size of the particles was around 500 nm in the submicron range (Table 1, Figure 1 and Figure 2b), in agreement with previous works [24]. In the untreated must samples, a relatively homogeneous surface was documented, characterized by the presence of polyhedral fragments, indicating that no super-micron particles (max. size 843–973 nm, Table 1) were present after the UHPH treatment, which is evidence that all grape microorganisms such as yeasts and bacteria were destroyed by the treatment. In comparison, the initial colloidal size of the juice particles was 2 µm on average (range 1.1–3.7 µm, Table 1; Figure 2a). After the UHPH processing, a regular colloidal structure can be observed by AFM with a uniform dispersion of colloidal particles at submicron scale (Figure 2b), which is also in agreement with previous research on grape juice [24,36]. The treated must exhibits a notable reduction in the quantity of these structures (Figure 1 and Figure 2b) compared to the control must (Figure 2a), suggesting a direct effect of the treatment on the composition of the must particles. These findings provide evidence that the UHPH treatment not only reduces the size of the fragments but also alters their distribution.
It is worth noting that, despite the existing fragments exceeding 200 nm in the UHPH-treated must, no adverse effects were observed in terms of nanosafety, given that the critical threshold is established below 100 nm [37,38]. This suggests that the UHPH treatment could be advantageous to produce musts with specific characteristics, without compromising the safety of the final product.

3.2. Chemical and Microbiological Composition of Must and UHPH Treatment

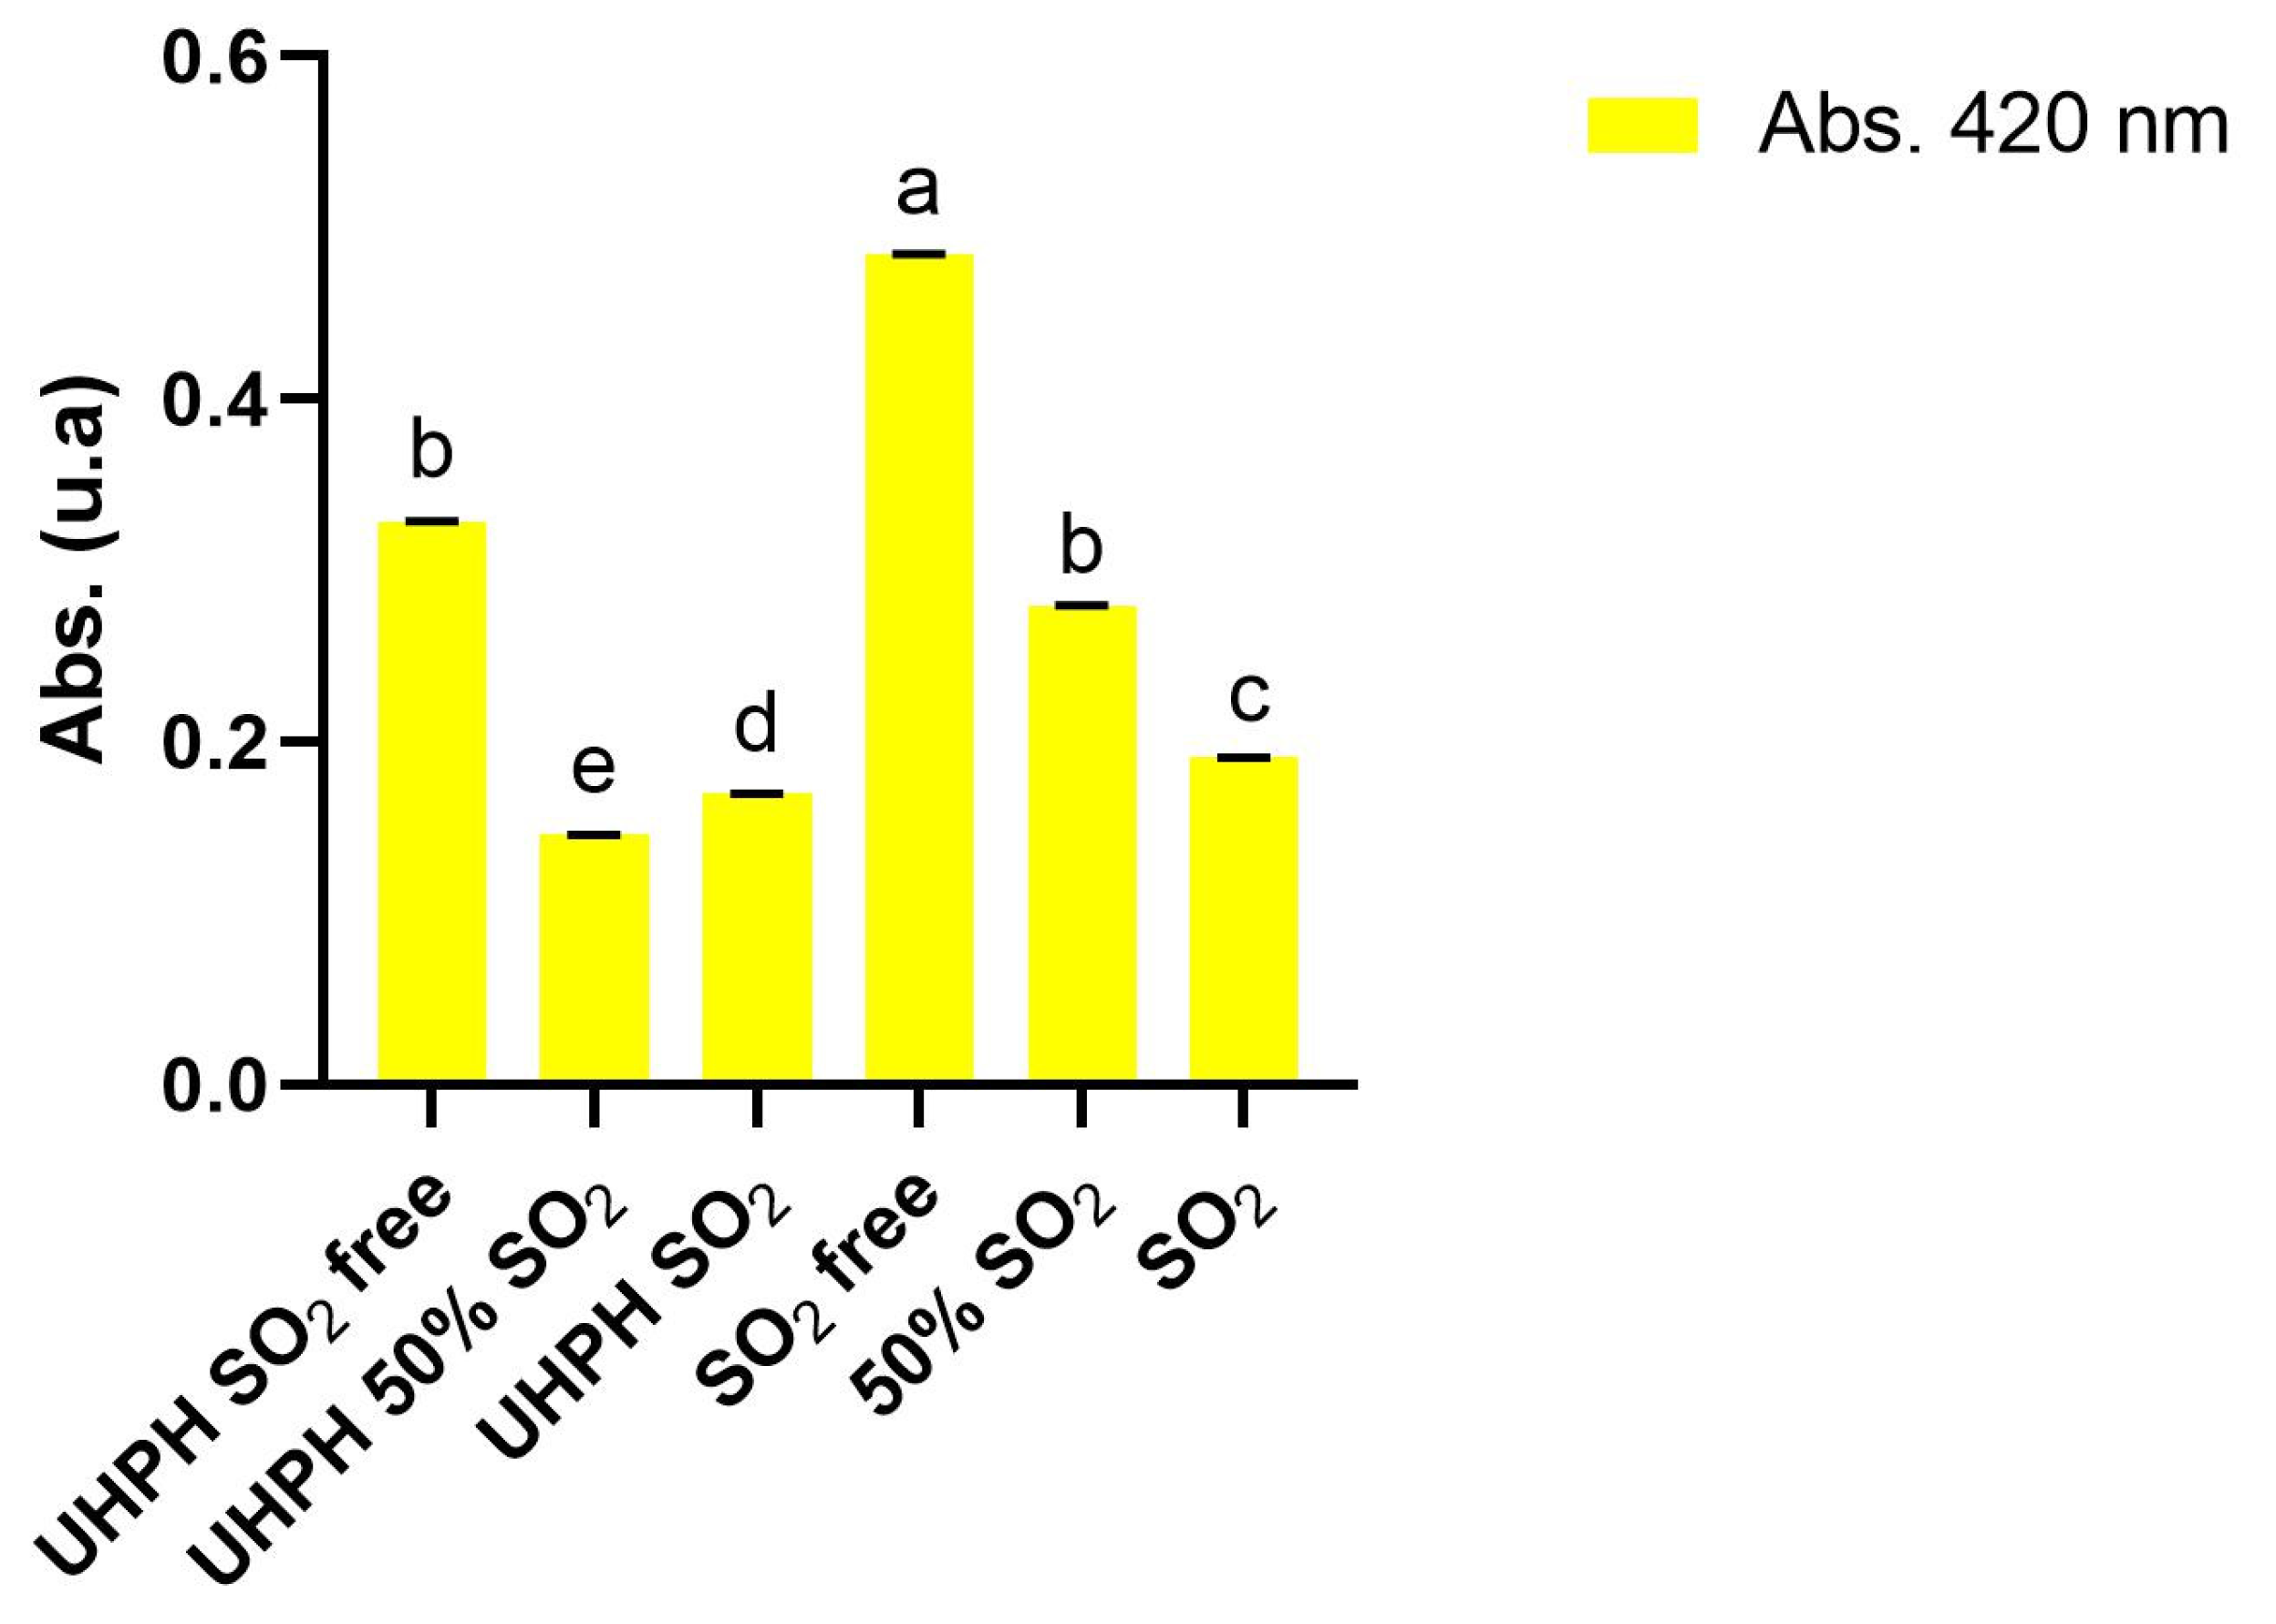
The results of the chemical characterization of grape juice after being clarified and submitted to the different treatments are shown in Table 2. No significant differences among treatments were found for degrees brix, glucose+fructose concentration, potential alcohol strength, total acidity, pH, ammonium and primary amino nitrogen, and L-malic acid. On the other hand, grape must color was significantly impacted by the UHPH technology and sulphur dioxide concentration. Higher absorbances at 420 nm were observed in samples not UHPH technology-treated and as the dose of sulphur dioxide was decreasing in all cases (Figure 3). The addition of sulphur dioxide as well as the dose had a direct impact on absorbance at 420 nm for all the studied treatments. In the treatments in which UHPH technology was applied, the color of grapes must had lower intensities compared with those without UHPH treatment, with the UHPH treatment group having a lower yellow and total coloration (Table 1 and Figure 4). The effect of sulphur dioxide on the color intensity of musts and wines has been reported before [39,40], and it was also observed in this study. In the case of the UHPH technology group, this decrease in the total coloration of musts is due to the antioxidant capacity of must juice for enzymatic oxidations by polyphenol oxidases (PPOs) [13]. Similar absorbances at 420 nm were obtained by UHPH-free SO2 and 50% SO2, reinforcing the idea that the present technology could help winemakers to reduce the use of sulphur dioxide without reducing the product quality and without a negative impact on organoleptic characteristics.
Microbiological concentrations of yeast, lactic acid bacteria, acetic acid bacteria, and Brettanomyces bruxellensis were determined for all the different treatments. For all the treatments where UHPH technology was applied, there was no detection of any of the oenological microorganisms—yeast, acetic and lactic acid bacteria, and Brettanomyces bruxellensis—by culture plate and qPCR. These results correspond to those obtained by other authors [24]. In the case of must without the application of UHPH technology, 105 cells/mL for yeast, 102 cells/mL for acetic acid bacteria, 102 cells/mL for lactic bacteria populations were detected. B. bruxellensis was not detected. These results agree with previously published data [41]. Sulphur dioxide concentration has a direct effect on the initial populations, especially of bacteria, but without the possibility the UHPH technology has for obtaining sterilized must.

3.3. Fermentation Kinetics

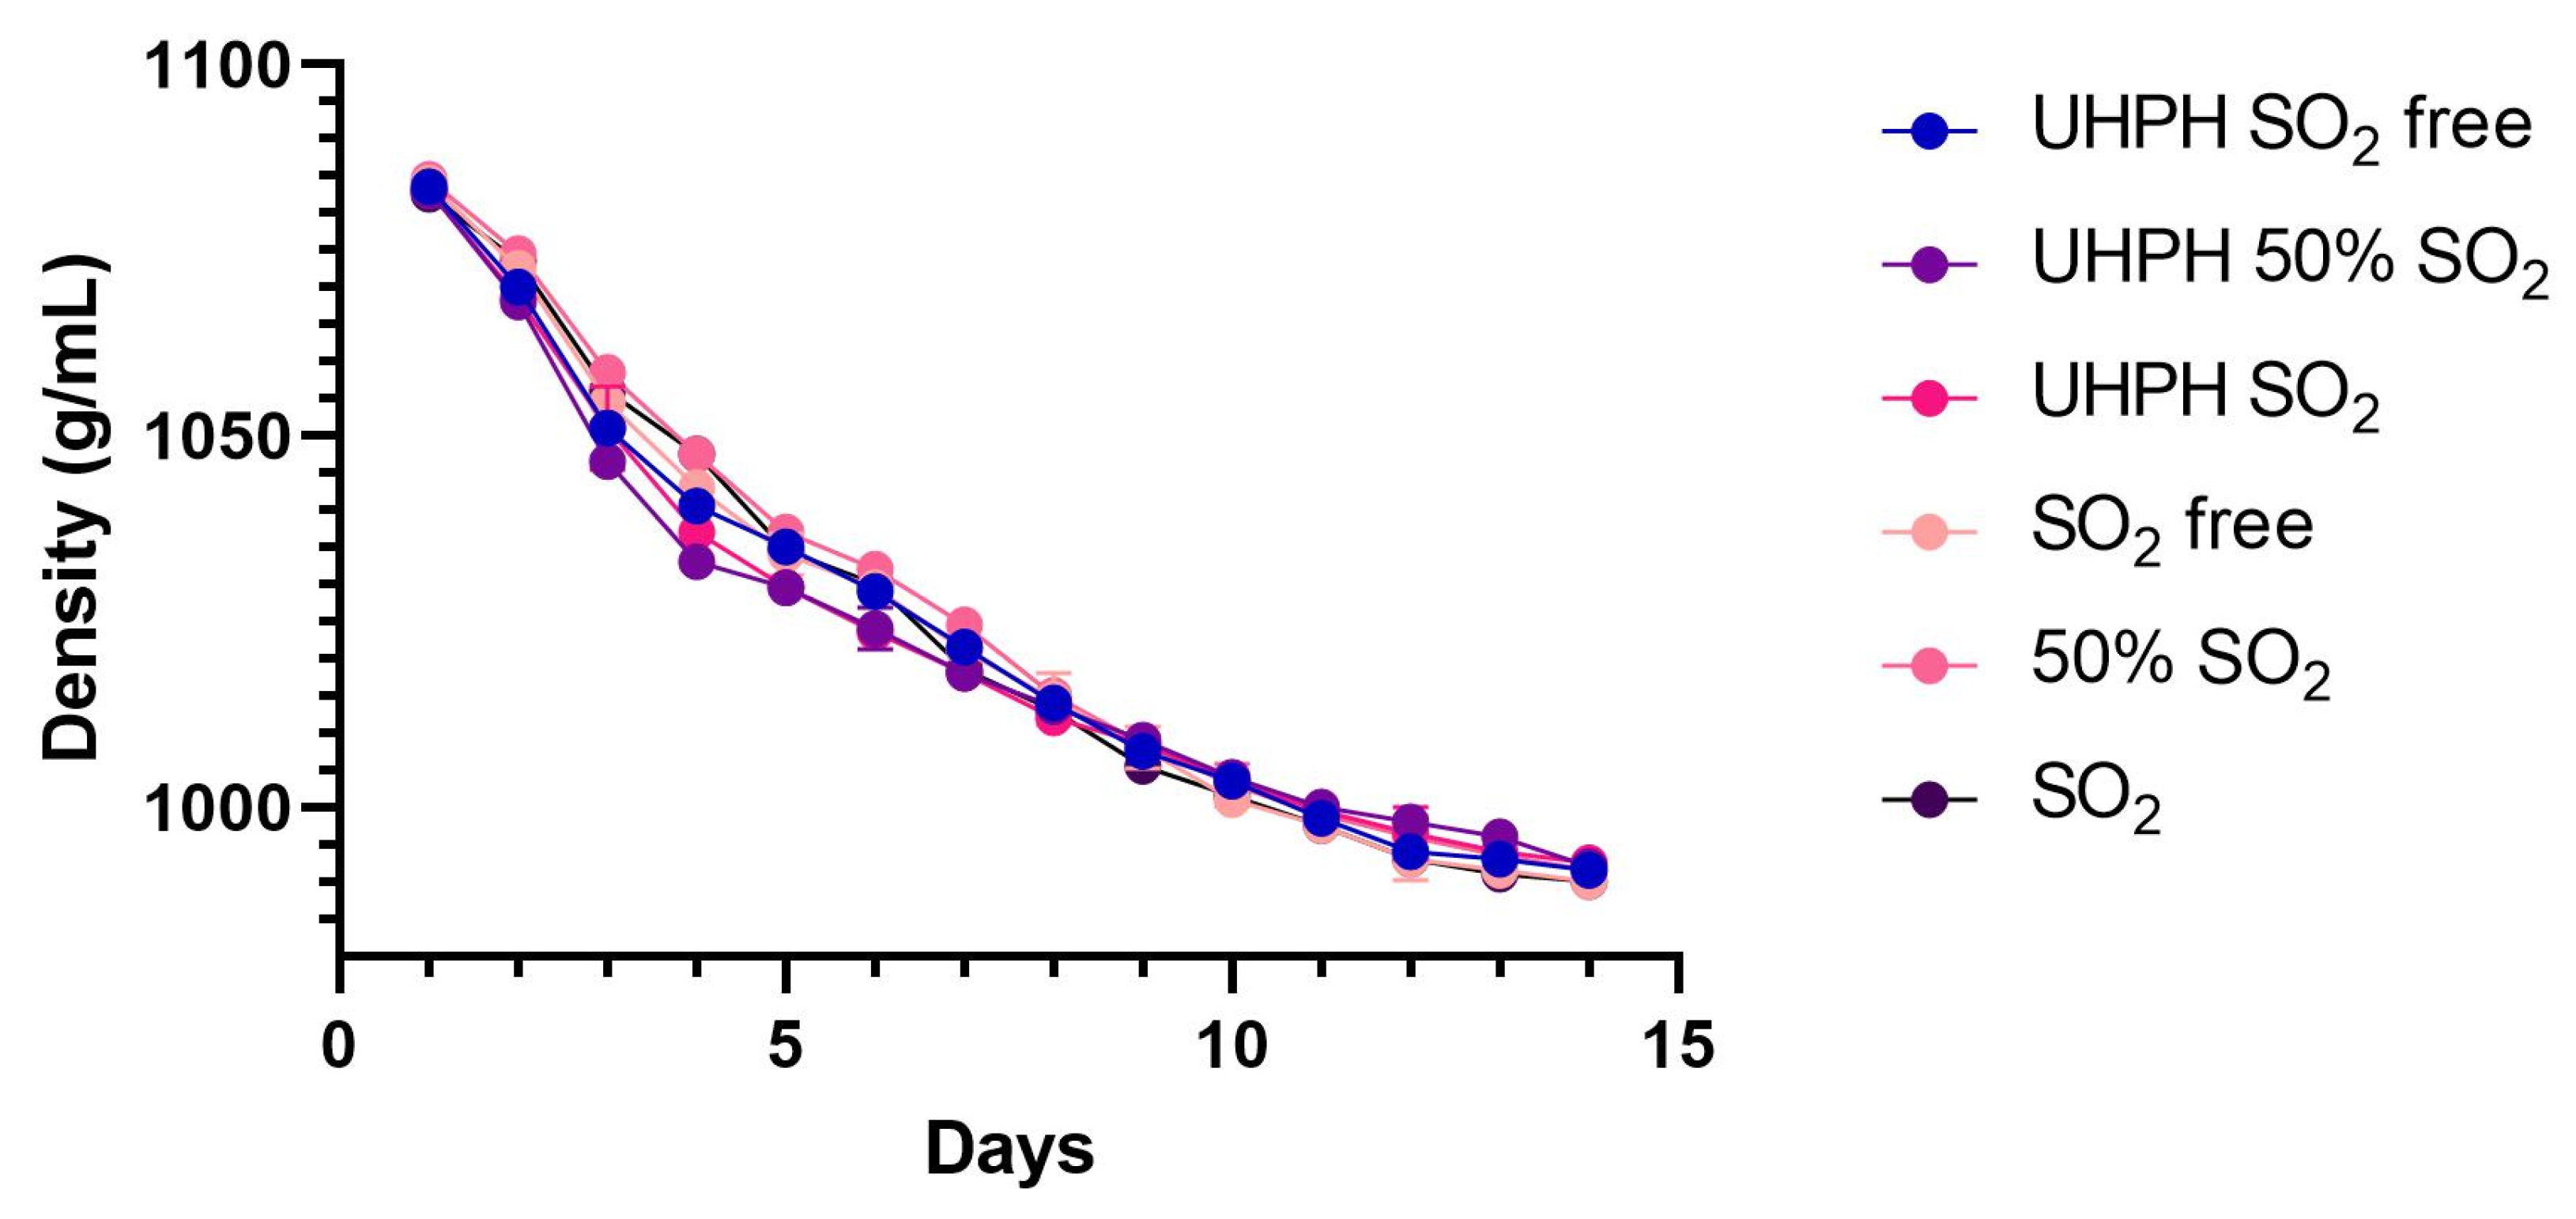
Fermentation performance was assessed through daily measurements of density (Figure 4) and the residual sugar concentration at the end of fermentation (lower than 0.5 g/L). In all fermentations tested, the kinetics curves obtained showed typical shape without detecting stuck fermentations or many other alterations such as long early exponential phases produced by yeast acclimation and slow fermentation speed in the stationary phase due to the concentration of ethanol. Fermentations showed a short acclimatization period of 24 h, followed by an exponential phase that lasted several days under all treatments, after which the fermentation entered the stationary phase, completing the fermentation at around 15 days. Small differences were observed in the initial hours of the exponential phase, and the UHPH batches were the fastest ones regardless of suphur dioxide concentration. Despite this, these differences were not statistically significant. After thirteen days of alcoholic fermentation, the sugar concentration was below (0.5 g/L) in all the treatments, and the alcoholic fermentation was considered finished. Therefore, the results indicate that neither the UHPH treatment nor the SO2 concentration affected the must in a manner that influenced the fermentation performance of the inoculated yeast.

3.4. Chemical, Microbiological, and Sensory Composition of Wines After Alcoholic Fermentation

According to the basic parameters, no significant differences were found in parameters like alcohol, volatile acidity, total acidity, pH, and the L-malic and L-lactic acids of the studied wines coming from musts treated or not treated by UHPH with different SO2 concentrations (Table 3). On the other hand, significant differences were detected in color and oxidation-related parameters. Absorbance at 420 nm, often used as an indicator of oxidative browning (40), was significantly lower in the UHPH-treated samples with partial or SO2-free treatments (0.075–0.077) compared to the SO2 without UHPH treatment (0.131), suggesting a protective potential effect of UHPH against oxidative browning. The UHPH SO2-free sample showed lower oxidation (0.104) than the full SO2 treatment without UHPH technology, indicating that UHPH may reduce the need for SO2 under certain conditions. Absorbance at 420 nm was highest in the SO2-treated sample (0.131), followed by the 50% SO2 sample (0.105), while all UHPH treatments showed significantly lower intensities, especially the UHPH 50% SO2 sample (0.075), suggesting that UHPH may lead the prevention of polyphenol oxidation [13]. In terms of CIE Lab color parameters, all wines maintained very high Luminosity (L*) values (>97), reflecting the expected brightness of young wines. The b* coordinates (yellow–blue axis) were lower in the UHPH 50% SO2 and UHPH SO2 treatments than wine with SO2, indicating a lower oxidative effect and UHPH mitigation of browning reactions. UHPH treatment independent of SO2 concentrations had an important and significant impact on wine turbidity, with the UHPH SO2-free treatment showing low turbidity (1.0 NTU), while free or SO2-containing wines without UHPH showed higher turbidity (>7.0 NTU). These results suggest that UHPH may improve the clarity of wines. The Folin–Ciocalteu index, which is an estimate of the total phenolic content, was highest in the SO2-free and SO2 50% treatments, 6.11 and 5.08, respectively, with samples obtained with UHPH treatment showing lower values, suggesting a partial degradation or structural modification of phenols [27,42].
Even though all musts treated by UHPH were sterilized to remove all oenological microorganisms, they can still be present after the alcoholic fermentation for several reasons. On one hand, yeasts inoculated during the alcoholic fermentation can be found in final wines. Moreover, microorganisms can be found on the equipment in the cellar (yeasts and lactic and acetic acid bacteria), that can contaminate the wine during the winemaking process. For this reason, the population conditions after alcoholic fermentation, clarification, and bottling were controlled. Details of all microbiological results after bottling are shown in Table 4. The results show that culturable populations of yeast, acetic acid bacteria, lactic acid bacteria, and Brettanomyces bruxellensis were below the detection limit (<1 CFU/mL) for all samples treated by UHPH (Table 4). In the case of samples untreated by UHPH, culturable yeast and acetic acid bacteria were detected in the 50% SO2 treatment. The populations of acetic acid bacteria, lactic acid bacteria, and Brettanomyces bruxelensis detected by RT-PCR were also lower than the detection limits (<20 cells/mL) for all the samples treated by UHPH. Only in the case of yeast, different populations (between 103 and 118 cells/mL) were found in all the samples. The RT-PCR technique detects the presence of DNA, which may come from either live or dead cells, so the population found can be either viable but not cultivable or dead. With regards to the samples not treated by UHPH technology and analyzed by RT-PCR, different populations of yeast were detected (from 109 to 22.825 cells/mL) and acetic acid bacteria at 56 cells/mL for 50% SO2 treatment. Wines produced from must treated with UHPH did not have microorganisms that came from the grape, but, like the non-treated wines, were susceptible to contamination during the winemaking process, as is shown in the case of 50% SO2 for yeasts. Therefore, the UHPH treatment reduces the sources of growth of non-desirable microorganisms, making wines more stable from a microbiological point of view.
The analysis of fermentative volatile compound groups after the alcoholic fermentation and oxidation conditions shows different behaviors depending on the studied treatment. Ultra-High-Pressure Homogenization (UHPH) and sulphur dioxide addition at different concentrations did not produce significant differences (p < 0.05) among samples in total ethyl esters, total acetates, and total fatty acids (Figure 5). This result suggests that, prior to oxidative stress, both UHPH and SO2 had a limited impact on the concentration of major aroma-active esters, alcohols, and fatty acids. However, a slight decrease in acetate esters was noted in the SO2-treated samples compared to the SO2-free samples, potentially reflecting early-stage ester hydrolysis or transformation [43]. These results indicate the neutral effect of UHPH treatment on the fermentative aromas produced by yeast during alcoholic fermentation. These results are in accordance with the results obtained by [44].
In terms of the oxidation markers of wines after alcoholic fermentation, the main aromatic compounds associated were analyzed and data considered the sum of all the compounds of each family: alkenals, strecker aldehydes, lactones, ketones, and aldehydes (Table 5). The alkenals family were formed by (E)-2-hexenal, (E)-2-heptenal, (E)-2-octenal, and (E)-2-nonenal, the strecker aldehydes family by 3-methylbutanal, 2-phenylacetaldehyde, and methional, the lactone family by γ- nonalactona and 3-methyl-2,4-nonadiona, furans by 3-hydroxy-4,5-dimethylfuran-2(5H)-one, and the aldehydes family by benzaldehyde.
Comparable values were obtained between the UHPH SO2-free and SO2 treatments, exhibiting comparable levels of oxidative aromas. These results indicate the potential of the UHPH technique to produce wines without SO2 with the same oxidation level as wines with the conventional use of SO2. The wine with a lower concentration of oxidative aromatic compounds was obtained with a conventional dose of SO2, and the wine with a higher oxidative aroma intensity was SO2-free, both without the use of UHPH.
The compounds that most strongly contribute to the high levels of oxidative aromas in wines with insufficient oxidation protection are aldehydes, particularly 2-phenylacetaldehyde and benzaldehyde, as shown in Table 5. These compounds are typically associated with notes of faded flowers, honey, and bitter almond. ANOVA results revealed significant differences in their concentrations among treatments: untreated or partially treated wines exhibited the highest levels, whereas SO2 and/or UHPH significantly reduced them. Overall, these aldehydes emerge as key contributors to the oxidative aroma profile, explaining the stronger sensory perception of oxidative notes in inadequately protected wines.
As shown in Figure 6a,b, the formation of oxidative aromas after fermentation was relatively low in wines treated only with SO2 (SO2), with values comparable to those obtained exclusively with UHPH (UHPH SO2-free). All other combinations displayed higher levels of initial oxidative aromas, with the SO2-free treatment showing the highest concentration. After the oxidation process, the SO2-free oxi. treatment showed the highest increase in oxidative aromas, followed by all other treatments without the use of UHPH (50% SO2 oxi. and SO2 oxi.). All treatments which combined the use of UHPH and sulphur dioxide (UHPH 50% SO2 oxi. and UHPH SO2 oxi.) showed lower concentrations of oxidative aromas.
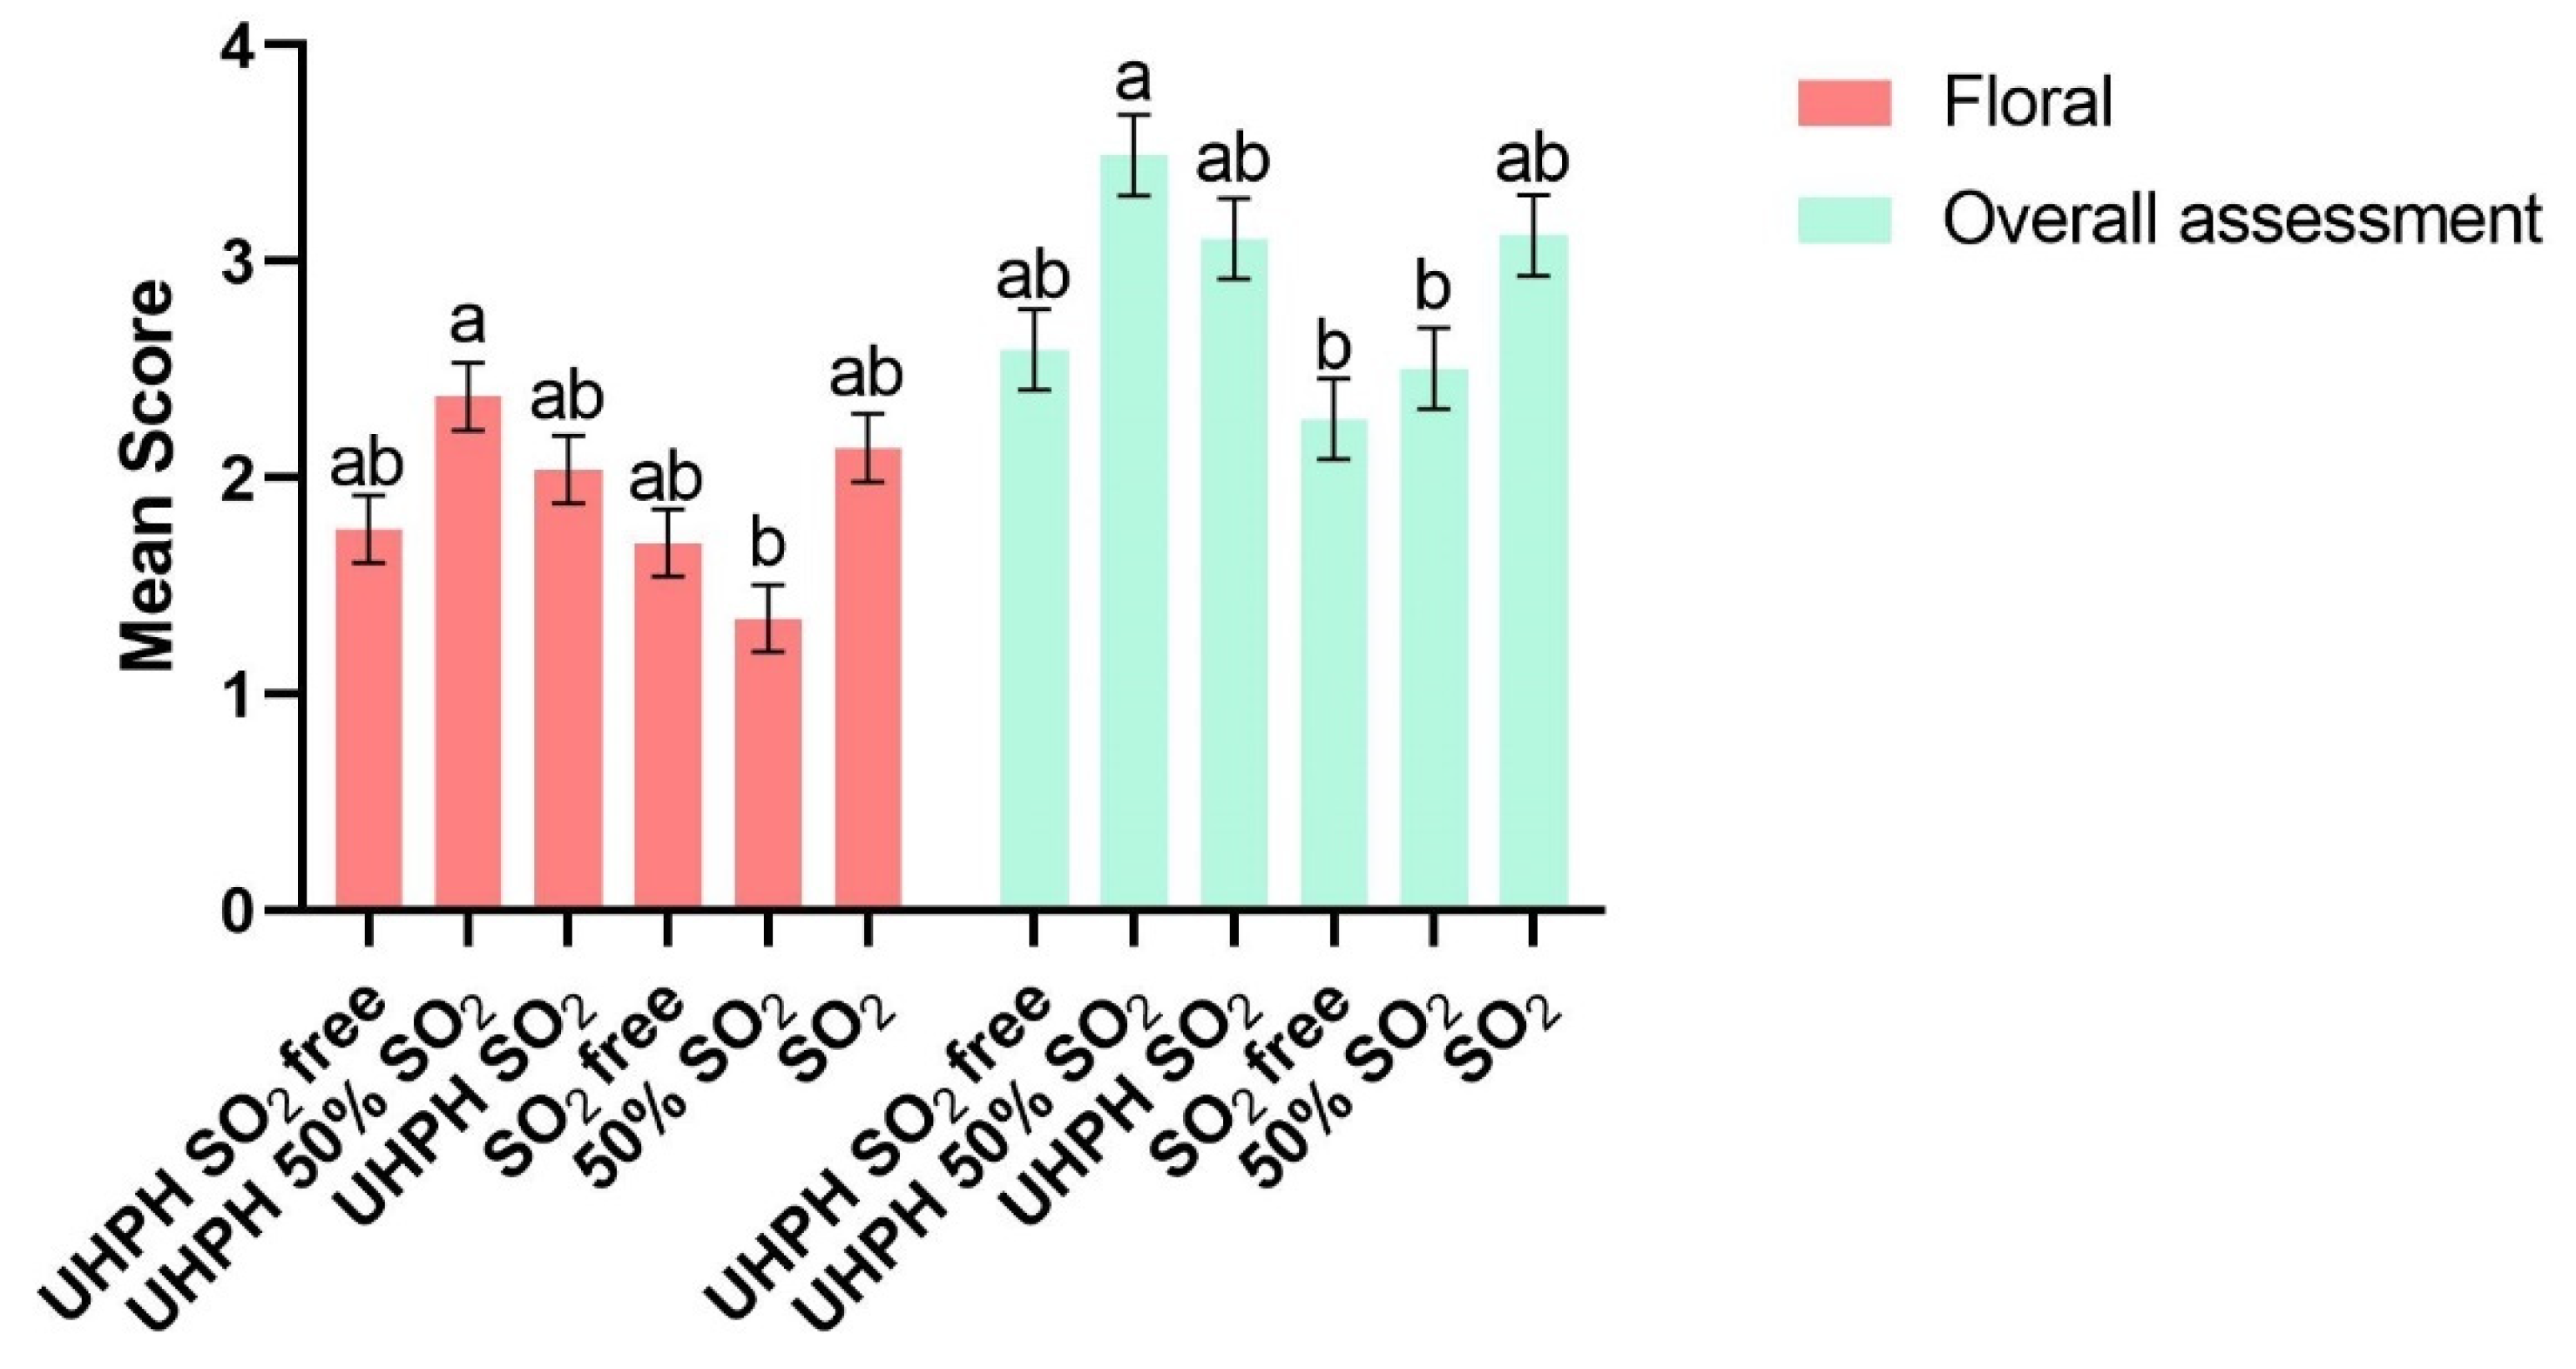
A total of nineteen sensorial parameters were analyzed by the tasting panel. Between them, significant differences were found in two parameters, that being floral and overall assessment attributes (Figure 7). The best-rated wine by floral and overall assessment attributes was, in both cases, UHPH 50% SO2. As these results show, the combination of the UHPH technology with lower doses of sulphur dioxide could be a good option for wineries to produce wines with a lower concentration of sulphur dioxide without the loss of sensory characteristics and flavors. No significant differences were found for wines produced without the use of sulphur dioxide in floral and overall assessment attributes.

3.5. Effect of UHPH Technology Combined with SO2 Concentrations After Forced Aging

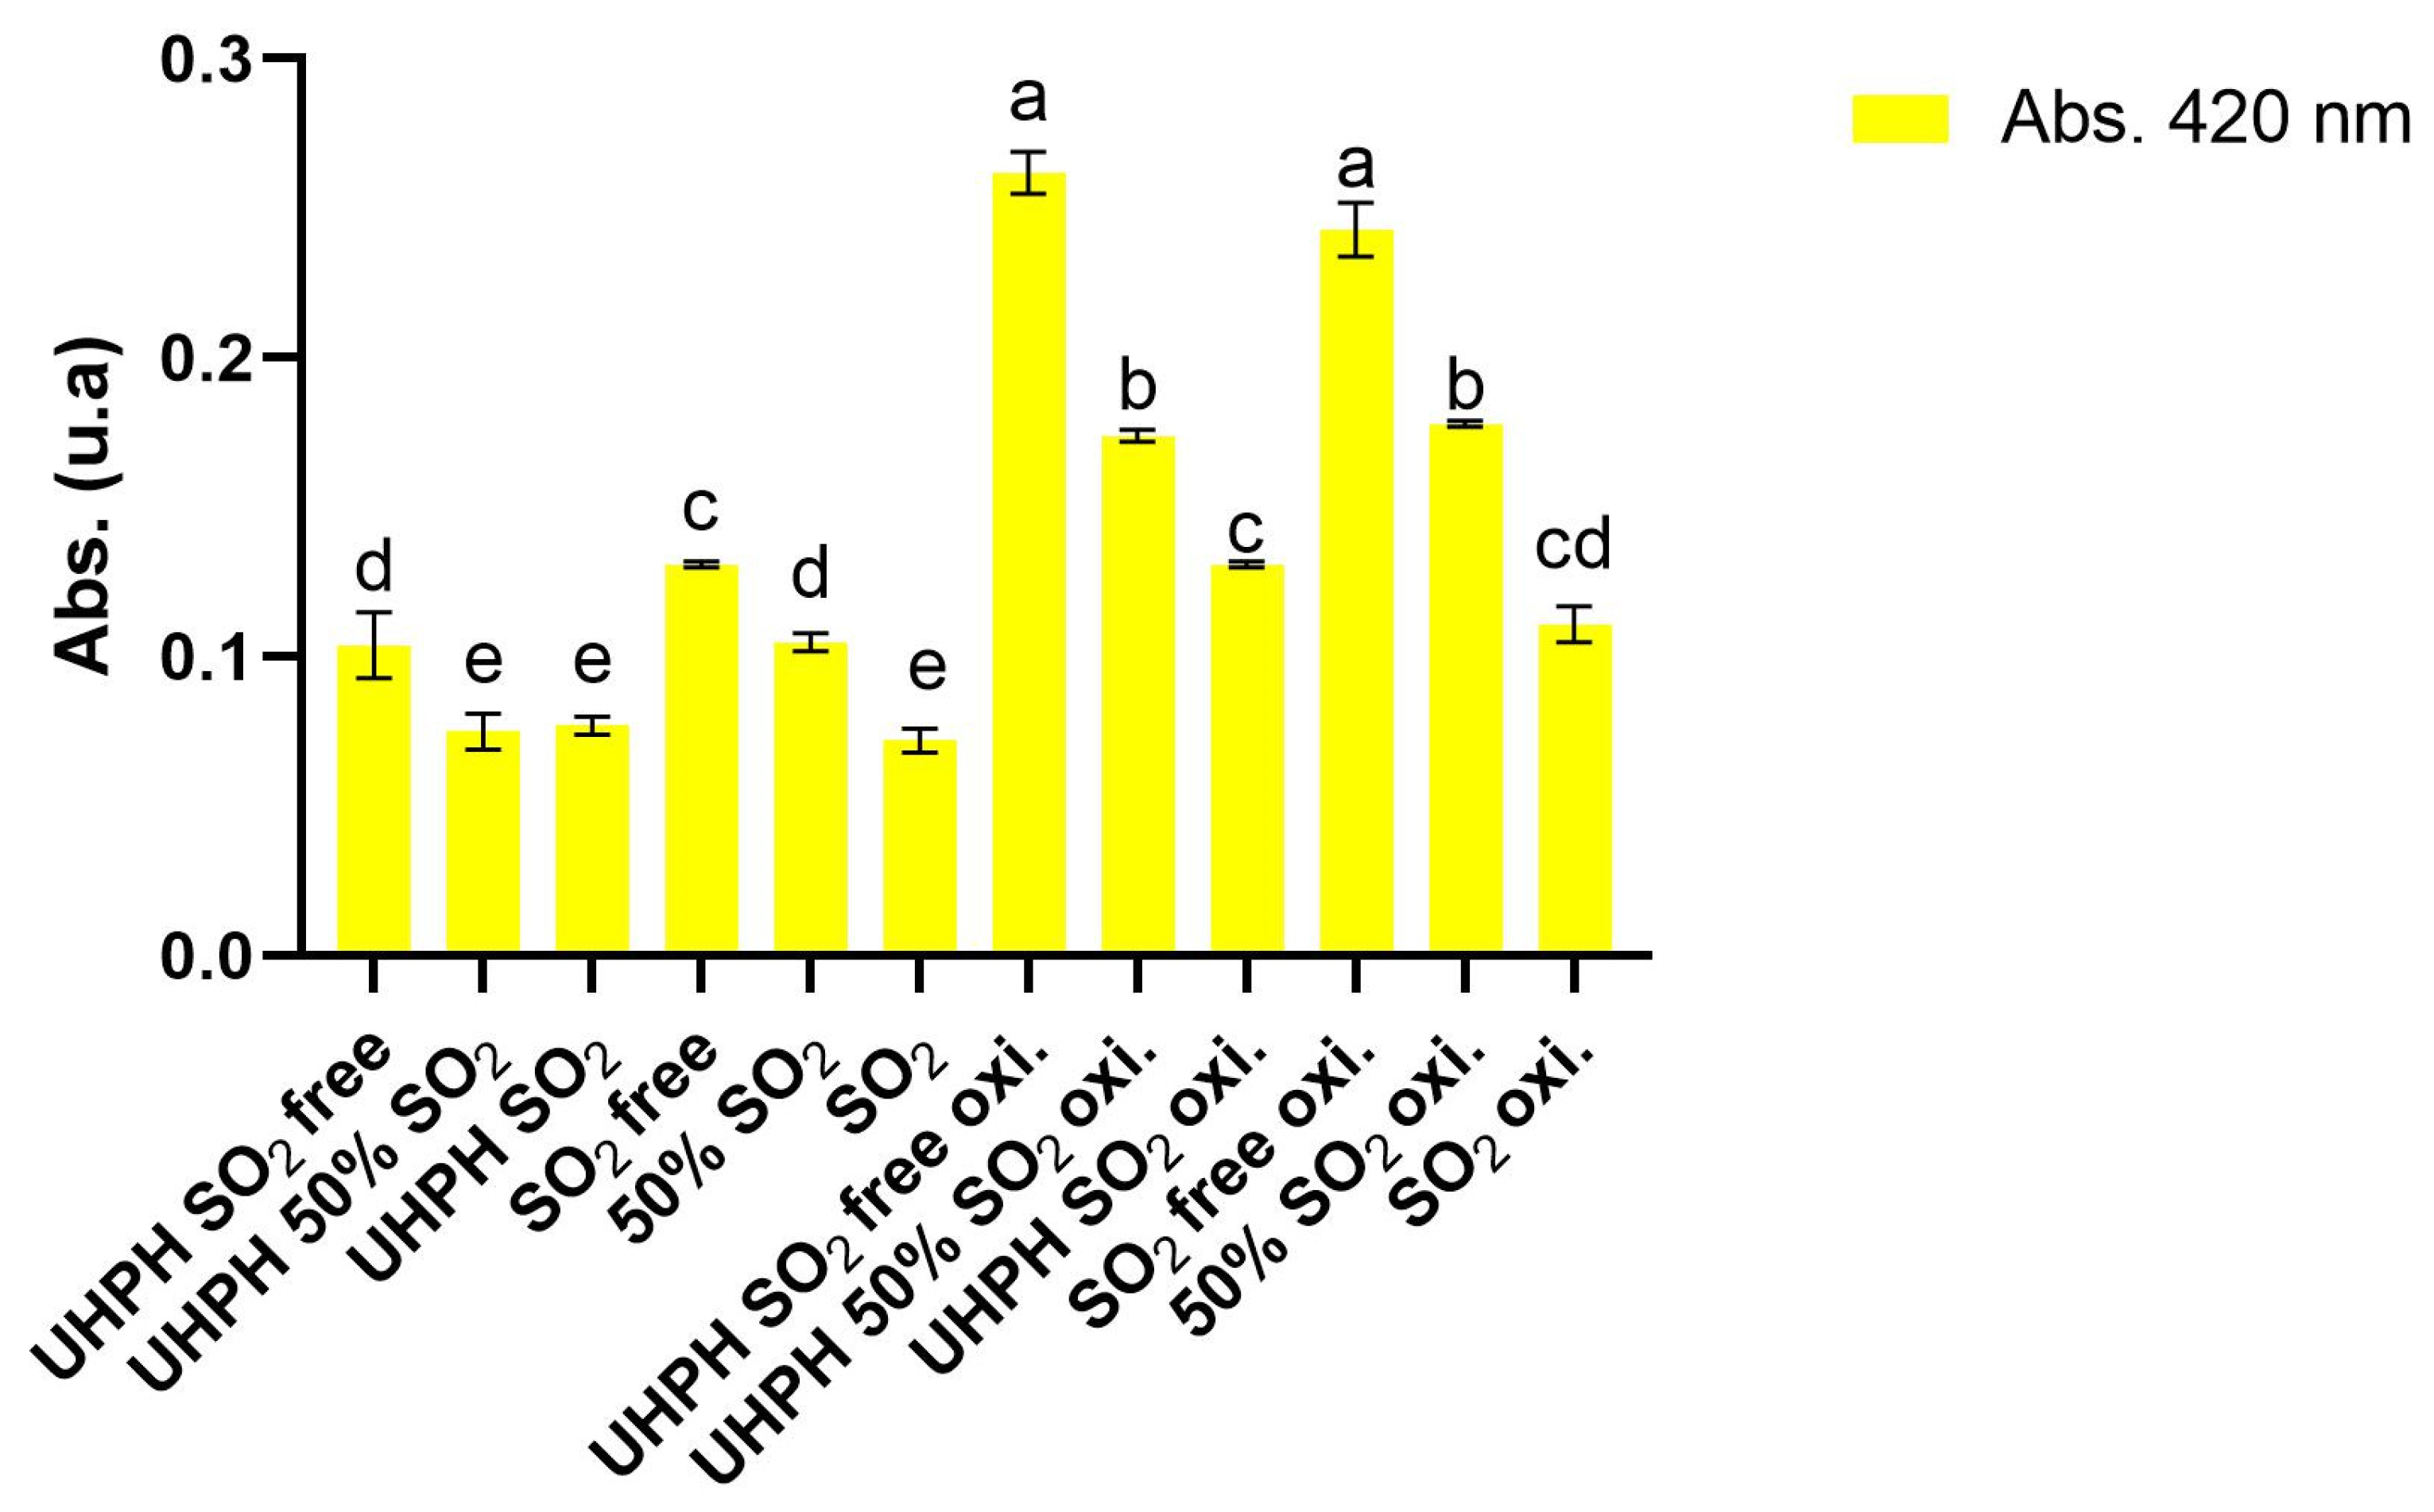
After the forced oxidation processes, analyses of the basic chemical characteristics, fermentative aromas, and oxidative aromas were carried out to evaluate the impact of the new technology combined with different doses of SO2 on the capacity of wines to fight against the accelerated oxidation process. According to the basic characterization, no significant differences were found between alcoholic degree, volatile acidity, total acidity, pH, and L-malic and L-lactic acid. The greatest impact of the accelerated oxidation on the basic parameters were in color characteristics, shown in Table 6 and Figure 8. Oxidation caused an increase in absorbance at 420 nm, resulting in a progressive darkening of the wine. This effect was particularly pronounced in untreated wines and those treated only with UHPH, which reached the highest values in all color bands. In contrast, wines treated with SO2, both individually and in combination with UHPH (even at reduced doses of 50%), showed significantly lower values, closer to those of the initial wine. These results confirm that SO2 is an effective protector against oxidative browning and that its combination with UHPH enhances this effect, allowing color stability to be maintained even with lower concentrations of sulphur dioxide.
Focusing only on the values after the forced oxidation process, the colors of the wines reveal significant differences related to oxidation depending on the treatment strategy used (UHPH, free, partial, and full use of SO2). Absorbance 420 nm, as an oxidative browning indicator, was highest in the UHPH SO2-free and SO2-free treatments (0.262 and 0.243, respectively), confirming their greater susceptibility to oxidation degradation. Simultaneously, samples treated with UHPH SO2 and SO2 without UHPH showed the lowest 420 nm values (0.131 and 0.111, respectively), reflecting higher oxidation resistance. These results align with the known antioxidant effect of SO2 and suggest that UHPH could be used as additional protection against oxidation processes once wines are bottled. Oxidative polymerization and browning were more pronounced in the absence of SO2. The L* values in the CIE Lab coordinates indicate a clear difference in brightness, with the samples of UHPH SO2 and SO2 showing higher values (>98), higher visual brightness, and less browning. On the other hand, UHPH SO2-free and SO2-free samples had significantly lower L* values, confirming their oxidation level due to the low concentration or absence of SO2. Regarding the b* coordinate, which indicates the color preservation, the highest values were, notably, shown for the UHPH SO2-free and SO2-free treatments (15.39 and 14.38, respectively), and the lowest values were found in the UHPH SO2 and SO2 treatments (8.82 and 7.15, respectively). No significant differences were found for the a* CIE Lab coordinate (red–green axis).
In contrast, the forced oxidation process reduced the levels of volatile ethyl esters and acetates across all treatments (Table 7). Notably, the UHPH SO2-free and SO2-free samples showed the largest decreases in both ethyl esters and acetates, suggesting an increased susceptibility to oxidative degradation without the presence of sulphur dioxide. In these treatments, the UHPH SO2-free treatment exhibited a dramatic drop in total ethyl esters (from 30.874 to 9.198 µg/L), highlighting the protective role of SO2 and the limited antioxidant capacity of UHPH without any other antioxidant agent preserving ethyl ester content under stress treatments like accelerating aging. Samples treated with SO2 or 50% SO2, in both the UHPH and conventional contexts, maintained significantly higher levels of ethyl esters during forced oxidation, with reductions between 25 and 75% of total ethyl esters compounds. These results indicated that partial SO2 addition, combined with UHPH, can offer a synergistic protective effect, being one of the most significant results of the present study. Total alcohol levels remained stable across treatments, with oxidative processes yielding no significant differences in alcohol concentrations between the SO2, 50% SO2, and SO2-free treatments, implying that alcohol compounds are less propitious to oxidative degradation than other compounds [32]. The percentage of total aroma loss for treatments without SO2 for the UHPH and no-UHPH treatments were 63% and 56%, respectively, 25% and 21% for the 50% SO2 UHPH and no-UHPH treatments, respectively, and finally, 35% and 28% for the UHPH SO2 and SO2 treatments. Overall, these findings suggest that while UHPH alone may not be enough for preventing the oxidative loss of key aroma compounds, its combination with reduced SO2 doses or the conventional use of SO2 could be a viable enological strategy to preserve wine aroma under oxidative stress, contributing to the development of more sustainable wine processing alternatives.
In relation to oxidative aromas, it was observed that they reached their highest values in wines without the application of suphur dioxide or UHPH, as we can see in Figure 6 and Table 5. In contrast, the combined treatment of UHPH and SO2 at 50% showed the greatest resistance to oxidation at the aromatic level, followed by the same treatment with SO2 at 100%. Overall, these results show that the application of UHPH in combination with SO2 is an effective strategy for delaying the appearance of oxidative notes, while also allowing for a reduction in the dose of sulfites without compromising the sensory stability of the wine.
As was expected, the accelerated oxidation process had an important effect on the concentration of oxidation markers for all the wines (Table 5). Figure 6b shows the oxidative aroma levels in the wines after forced oxidation. A marked increase was observed in the untreated wine (SO2-free oxid.), followed by the wine containing only 50% SO2 without UHPH. Intermediate values were found in wines treated with SO2 alone or UHPH alone. In contrast, the lowest concentrations were detected in wines treated with both techniques, as well as in those treated with 50% SO2 combined with UHPH. These results indicate that the combined application of SO2 and UHPH provides the greatest protection against oxidative aroma development, while SO2 and UHPH applied individually confer a similar, yet insufficient, level of protection to maintain a low oxidative profile. After oxidation, wines showed significantly higher concentrations of aldehydes (2-phenylacetaldehyde and 3-methylbutanal) and lactones, as confirmed by the ANOVA analyses. Among the aldehydes, the highest levels were observed in oxidized wines without SO2 and without UHPH treatment, whereas the application of SO2, UHPH, or their combination resulted in significantly lower concentrations. A similar trend was observed for γ-nonalactone: wines lacking protective treatments accumulated the highest amounts, while those treated with SO2 and/or UHPH exhibited reduced levels. These results demonstrate that both SO2 addition and UHPH processing mitigate the oxidative formation of aldehydes and lactones, thereby preventing the development of off-aromas such as dried fig, peach, or coconut notes and contributing to a more stable aromatic profile.
This study demonstrates that the combined application of SO2 (at both 100% and 50%) with UHPH was the most effective strategy, leading to the lowest concentrations of oxidative aroma compounds and providing greater resistance to their formation over time. When applied individually, SO2 or UHPH also reduced aldehyde and lactone accumulation, although their protective effect was less sustained compared to the combined treatment. In contrast, wines produced without any treatment consistently exhibited the highest levels of oxidative aromas. Finally, this study highlights the importance of combining strategies to replace or remove sulphur dioxide in winemaking to obtain high-quality wines. The effects of UHPH technology from a sensory and volatile perspective had not been studied yet in relation to their potential for higher stability and shelf life.
4. Conclusions

This study provides clear evidence of the potential of UHPH technology for the wine sector to produce healthy and good-quality wines without the need for using additives to increase the optimal period of consumption. The singularity of the present study lies in addressing all the efforts to evaluate the effect of a new technology on the chemical, sensory, and microbiological properties of bottled wines before and after being submitted to forced oxidation treatment. Results clearly show that UHPH technology combined with lower doses of sulphur dioxide could be a potential strategy to obtain sensorially and microbiologically stable wines with high resistance to unfavorable environmental conditions before their consumption. The impact of UHPH on preserving fermentative aromas is not significant but could help winemakers to obtain less colored grape musts, more stable wines from a microbiological point of view, and wines with higher resistance to enzymatic oxidation due to the inactivation of enzymes.
Future research will focus on studying other strategies like the use of oenological tannins or vegetal extracts to protect wines after the treatment of must by UHPH. Consumers around the world are looking for more sustainable, healthy wines with less additives used, and UHPH technology fits very well for this purpose. However, the initial research status and the high price of this technology are restrictions to its wide use in the wine sector. Furthermore, the potential of the UHPH technology exceeds that of other physical technologies for must or wine treatments, especially due to its non-thermal effect, which contributes to preserving the sensory properties of the product.

Author Contributions

Conceptualization, S.d.L. and M.P.; methodology, C.S.-M., I.H.-A., M.S.-F., A.S., D.F.-V., V.C., N.S., and E.N.; formal analysis, I.H.-A. and M.P.; investigation, C.S.-M., I.H.-A., I.A. and M.P.; resources, S.d.L.; data curation, I.H.-A. and M.P.; writing—original draft preparation, C.S.-M., I.H.-A., I.A. and M.P.; writing—review and editing, I.H.-A., M.S.-F., D.F.-V., I.A. and M.P.; visualization, I.H.-A., I.A. and M.P.; supervision, A.M.; project administration, S.d.L.; funding acquisition, S.d.L. All authors have read and agreed to the published version of the manuscript.

Funding

This research was funded by the Ministerio de Ciencia, Innovación y Universidades project RTI2018-096626-B-I00.

Institutional Review Board Statement

Not applicable.

Informed Consent Statement

Not applicable.

Data Availability Statement

The original contributions presented in this study are included in the article. Further inquiries can be directed to the corresponding author.

Acknowledgments

The authors acknowledge the Ypsicon company for their technical support and supply of technology.

Conflicts of Interest

The authors declare no conflicts of interest.

Abbreviations

The following abbreviations are used in this manuscript:
UHPHUltra-High-Pressure Homogenization
OIVInternational Organization of Vine and Wine
CFUColony-Forming Unit
PPOPoliphenol Oxidase
SO2Sulphur Dioxide
O2Oxygen
PEFPulsed Electric Fields
UVUltraviolet Radiation
HHPHigh Hydrostatic Pressure
USUltrasounds
VITECWine Technology Center
RT-PCRReal-Time Polimerase Chain Reaction
YPDAYeast Peptone Dextrose Agar
GYCYeast Calcium Carbonate
MRSAMan, Rogose, and Sharpe Agar
GCGas Chromatography
MSDMass Selective Detector
ANOVAAnalysis of Variance
QDAQuantitative Descriptive Analysis
DNADeoxyribonucleic Acid
AFMAtomic Force Microscopy
HSDHonest Significant Difference
ISOInternational Organization for Standardization
ISInternal Standard

Appendix A

In this section, data supplemental to the main text is added. The individual fermentative aromas analyses of a sum of each individual compounds is shown in the main text for a better interpretation of the effect of UHPH. Table A1 shows the individual concentrations of fermentative compounds relative to Figure 5 and Table 7 in the main text.
Table A1. Individual fermentative aromas concentrations for UHPH and SO2 treatments before and after oxidation processes. Data are expressed as mean values of n = 2 by ANOVA and Tukey’s HSD post-test (p < 0.05), and significant differences are indicated by different letters in the same row (a, b, c, d, e, f, and g). All results are expressed as equivalents of 2-octanol in μg/L.
UHPH SO2-freeUHPH 50%SO2UHPH SO2SO2-free50% SO2SO2
InitialOxidatedInitialOxidatedInitialOxidatedInitialOxidatedInitialOxidatedInitialOxidated
Ethyl butyrate709 a171 d651 a544 abc588 ab452 bc599 ab174 d538 abc459 bc532 abc390 c
Ethyl isovaleriate21 fg30 de22 fg58 a23 ef54 ab16 g33 d17 fg49 b22 fg40 c
Ethyl hexanoate6.849 abc2.745 e6.897 abc6.172 bcd6.933 ab5.678 cd7.026 ab3.394 e6.340 abcd6.230 abcd7.439 a5.198 d
Ethyl octanoate12.860 a4.485 e12.052 abc10.041 cd13.046 a8.770 d13.027 a6.247 e12.331 ab10.290 bcd13.959 a8.879 d
Ethyl decanoate9.107 a1.002 e9.042 a4.654 b9.057 a3.064 cd9.657 a1.816 de8.683 a4.401 bc8.561 a4.374 bc
Ethyl dodecaonat1.099 ab6 d920 b79 d1.168 a5 d1.069 ab3 d683 c3 d567 c109 d
Diethyl succinate231 d760 ab195 d676 abc161 d581 bc201 d522 c281 d627 abc201 d858 a
Total Ethyl esters30.874 a9.198 c29.779 a22.224 b30.977 a18.605 b31.594 a12.190 c28.874 a22.060 b31.282 a19.850 b
Ethyl acetate4.588 bc3.682 de4.436 bcd4.788 bc4.473 bc4.110 cde4.599 bc3.655 e4.919 b5.083 b6.014 a4.458 bc
Isobutyl acetate126 ab10 d170 a50 cd129 ab36 d110 b13 d109 b49 cd93 bc48 cd
Isoamyl acetate8.400 a416 c8.509 a4.607 b8.594 a4.445 b7.684 a698 c7.156 a4.509 b4.881 b4.466 b
Hexyl acetate521 bc221 de664 ab330 cde746 a358 cde282 de190 de371 cd178 e628 ab294 de
2-phenylehtyl acetate701 a42 e670 ab177 cde656 ab164 cde449 abc85 de378 bcd147 de664 ab191 cde
Total acetates14.336 a4.372 d14.448 a9.951 c14.598 a9.113 c13.124 ab4.640 d12.933 ab9.965 c12.280 b9.457 c
Isobutanol316 a159 a300 a261 a243 a190 a330 a200 a258 a262 a327 a224 a
Isoamyl alcohol4857 a3.494 a4.516 a4.042 a4.469 a3.957 a4.767 a3.902 a4.150 a4.073 a4.299 a3.841 a
Benzil alcohol4 cde3 de4 cde3 e3 e3 e9 a8 a8 ab6 bcd6 bc6 abc
2-phenylethyl alcohol102 a112 a97 a109 a123 a127 a88 a76 a111 a78 a94 a106 a
Total alcohols5.279 a3.769 a4.916 a4.415 a4.838 a4.277 a5.193 a4.187 a4.527 a4.419 a4.726 a4.177 a
Hexanoic acid3.140 a909 c3.015 a2.281 ab3.180 a2.179 ab3.212 a1.148 bc2.616 a2.451 a3.238 a2.335 ab
Octanoic acid2.109 a1.931 a2.005 a1.774 a1.975 a1.879 a1.729 a1.455 a2.172 a1.396 a1.587 a1.982 a
Decanoic acid710 a689 a615 a644 a717 a647 a640 a530 a752 a469 a586 a723 a
Total fatty acids5.958 a3.530 bc5.634 a4.698 abc5.872 a4.705 abc5.581 a3.133 c5.541 a4.316 abc5.411 a5.040 ab

References

  1. Costanigro, M.; Appleby, C.; Menke, S.D. The wine headache: Consumer perceptions of sulfites and willingness to pay for non-sulfited wines. Food Qual. Prefer. 2014, 31, 81–89. [Google Scholar] [CrossRef]
  2. Ferrer-Gallego, R.; Puxeu, M.; Nart, E.; Martín, L.; Andorrà, I. Evaluation of Tempranillo and Albariño SO2-free wines produced by different chemical alternatives and winemaking procedures. Food Res. Int. 2017, 102, 647–657. [Google Scholar] [CrossRef] [PubMed]
  3. Kritzinger, E.C.; Bauer, F.F.; Du Toit, W.J. Role of glutathione in winemaking: A review. J. Agric. Food Chem. 2013, 61, 269–277. [Google Scholar] [CrossRef] [PubMed]
  4. Ricci, A.; Olejar, K.J.; Parpinello, G.P.; Mattioli, A.U.; Teslić, N.; Kilmartin, P.A.; Versari, A. Antioxidant activity of commercial food grade tannins exemplified in a wine model. Food Addit. Contam. Part A 2016, 33, 1761–1774. [Google Scholar] [CrossRef]
  5. Versari, A.; Du Toit, W.; Parpinello, G.P. Oenological tannins: A review. Aust. J. Grape Wine Res. 2013, 19, 1–10. [Google Scholar] [CrossRef]
  6. Nieto-Rojo, R.; Luquin, A.; Ancín-Azpilicueta, C. Improvement of wine aromatic quality using mixtures of lysozyme and dimethyl dicarbonate, with low SO2 concentration. Food Addit. Contam. Part A 2015, 32, 1965–1975. [Google Scholar] [CrossRef]
  7. Santos, M.C.; Nunes, C.; Saraiva, J.A.; Coimbra, M.A. Chemical and physical methodologies for the replacement/reduction of sulfur dioxide use during winemaking: Review of their potentialities and limitations. Eur. Food Res. Technol. 2012, 234, 1–12. [Google Scholar] [CrossRef]
  8. Puértolas, E.; Saldaña, G.; Condón, S.; Álvarez, I.; Raso, J. Evolution of polyphenolic compounds in red wine from Cabernet Sauvignon grapes processed by pulsed electric fields during aging in bottle. Food Chem. 2010, 119, 1063–1070. [Google Scholar] [CrossRef]
  9. Puértolas, E.; Saldaña, G.; Álvarez, I.; Raso, J. Experimental design approach for the evaluation of anthocyanin content of rosé wines obtained by pulsed electric fields. Influence of temperature and time of maceration. Food Chem. 2011, 126, 1482–1487. [Google Scholar] [CrossRef]
  10. Puig, A.; Olmos, P.; Quevedo, J.M.; Guamis, B.; Mínguez, S. Microbiological and sensory effects of musts treated by high-pressure homogenization. Food Sci. Technol. Int. 2008, 14 (Suppl. S5), 5–11. [Google Scholar] [CrossRef]
  11. Mislata, A.M.; Puxeu, M.; Nart, E.; de Lamo, S.; Ferrer-Gallego, R. Preliminary study of the effect of cation-exchange resin treatment on the aging of tempranillo red wines. Food Sci. Tecnol. 2021, 138, 110669. [Google Scholar] [CrossRef]
  12. Puxeu, M.; Andorra, I.; De Lamo-Castellví, S. Monitoring Saccharomyces cerevisiae grape must fermentation process by attenuated total reflectance spectroscopy. Food Bioprocess Technol. 2015, 8, 637–646. [Google Scholar] [CrossRef]
  13. Bañuelos, M.A.; Loira, I.; Guamis, B.; Escott, C.; Del Fresno, J.M.; Codina-Torrella, I.; Quevedo, J.M.; Gervilla, R.; Rodríguez Chavarría, J.M.; de Lamo, S.; et al. White wine processing by UHPH without SO2. Elimination of microbial populations and effect in oxidative enzymes, colloidal stability and sensory quality. Food Chem. 2020, 332, 127417. [Google Scholar] [CrossRef]
  14. Loira, I.; Morata, A.; Bañuelos, M.A.; Puig-Pujol, A.; Guamis, B.; González, C.; Suárez-Lepe, J.A. Use of Ultra-High Pressure Homogenization processing in winemaking: Control of microbial populations in grape musts and effects in sensory quality. Innov. Food Sci. Emerg. Technol. 2018, 50, 50–56. [Google Scholar] [CrossRef]
  15. Patrignani, F.; Mannozzi, C.; Tappi, S.; Tylewicz, U.; Pasini, F.; Castellone, V.; Riciputi, Y.; Rocculi, P.; Romani, S.; Caboni, M.F.; et al. (Ultra) high pressure homogenization potential on the shelf-life and functionality of kiwifruit juice. Front. Microbiol. 2019, 10, 246. [Google Scholar] [CrossRef] [PubMed]
  16. Velázquez-Estrada, R.M.; Hernández-Herrer, M.M.; Rüfer, C.E.; Guamis-López, B.; Roig-Segués, A.X. Influence of ultra high pressure homogenization processing on bioactive compounds and antioxidant activity of orange juice. Innov. Food Sci. Emerg. Technol. 2013, 18, 89–94. [Google Scholar] [CrossRef]
  17. Comuzzo, P.; Calligaris, S. Potential applications of high pressure homogenization in winemaking: A review. Beverages 2019, 5, 56. [Google Scholar] [CrossRef]
  18. Zamora, A.; Guamis, B. Opportunities for ultra-high-pressure homogenisation (UHPH) for the food industry. Food Eng. Rev. 2015, 7, 130–142. [Google Scholar] [CrossRef]
  19. Addo, C.N.A.; Ferragut, V. Evaluating the ultra-high pressure homogenization (UHPH) and pasteurization effects on the quality and shelf life of donkey milk. Int. J. Food Stud. 2015, 4, 104–115. [Google Scholar] [CrossRef]
  20. Day, M.P.; Schmidt, S.A.; Smith, P.A.; Wikes, E.N. Use and impact of oxygen during winemaking. Aust. J. Grape Wine Res. 2015, 21, 693–704. [Google Scholar] [CrossRef]
  21. Ghidossi, R.; Meunier, F. Vinification and aging: How much oxygen to add and when? IVES Tech. Rev. Vine Wine 2020. [Google Scholar] [CrossRef]
  22. Silva Ferreira, A.C.; Guedes de Pinho, P.; Hogg, T. Kinetics of oxidative degradation of white wines and how they are affected by selected technological parameters. J. Agric. Food. Chem. 2002, 50, 5919–5924. [Google Scholar] [CrossRef]
  23. Singleton, V.L.; Kramlinga, T.E. Browning of white wines and an accelerated test for browning capacity. Am. J. Enol. Vitic. 1976, 27, 157–160. [Google Scholar] [CrossRef]
  24. Vaquero, C.; Escott, C.; Loira, I.; Guamis, B.; del Fresno, J.M.; Quevedo, J.M.; Gervilla, R.; de Lamo, S.; Ferrer-Gallego, R.; González, C.; et al. Cabernet sauvignon red must processing by UHPH to produce wine without SO2: The colloidal structure, microbial and oxidation control, color protection and sensory quality of the wine. Food Bioprocess Technol. 2022, 15, 620–634. [Google Scholar] [CrossRef]
  25. OIV, Organisation Internationale de la Vigne et du Vin. Compendium of International Methods of Wine and Must Analysis, 2023rd ed.; OIV: Dijon, France, 2023; Volume 737 1 and 2. [Google Scholar]
  26. Hierro, N.; Esteve-Zarzoso, B.; González, A.; Mas, A.; Guillamón, J.M. Real-Time Quantitative PCR (QPCR) and reverse transcription-QPCR for Detection and Enumeration of Total Yeasts in Wine. App. Environ. Microbiol. 2006, 72, 7148–7155. [Google Scholar] [CrossRef] [PubMed]
  27. Lopez-Toledano, A.; Mayen, M.; Merida, J.; Medina, M. Yeasts used to delay browning in white wines. Food Chem. 2006, 97, 498–504. [Google Scholar] [CrossRef]
  28. Phister, T.G.; Mills, D.A. Real-Time PCR Assay for detection and enumeration of Dekkera bruxellensis in wine. App. Environ. Microbiol. 2003, 69, 7430–7434. [Google Scholar] [CrossRef]
  29. Balboa-Lagunero, T.; Arroyo, T.; Cabellos, J.M.; Aznar, M. Sensory and olfactometric profiles of red wines after natural and forced oxidation processes. Am. J. Enol. Vitic. 2011, 62, 527–535. [Google Scholar] [CrossRef]
  30. Silva Ferreira, A.C.; Hogg, T.; Guedes de Pinho, P. Identification of key odorants related to the typical aroma of oxidation-spoiled white wines. J. Agric. Food Chem. 2003, 51, 1377–1381. [Google Scholar] [CrossRef]
  31. Martins, R.C.; Oliveira, R.; Bento, F.; Geraldo, D.; Lopes, V.V.; Guedes de Pinho, P.; Oliveira, C.M.; Silva Ferreira, A. Oxidation management of white wines using cyclic voltammetry and multivariate process monitoring. J. Agric. Food Chem. 2008, 56, 12092–12098. [Google Scholar] [CrossRef]
  32. Torrens, J.; Riu-Aumatell, M.; López-Tamames, E.; Buxaderas, S. Volatile compounds of red and white wines by headspace-solid-phase microextraction using different fibers. J. Chromatogr. Sci. 2004, 42, 310–316. [Google Scholar] [CrossRef]
  33. Zapata, J.; Mateo-Vivaeacho, L.M.; Cacho, J.; Ferrerira, V. Comparison of extraction techniques and mass spectrometric ionization modes in the analysis of wine volatile carbonyls. Anal. Chim. Acta 2010, 660, 197–205. [Google Scholar] [CrossRef]
  34. ISO 8589:2007; Sensory Analysis—Guidelines for the Design of Tasting Rooms. International Organization for Standardization: Geneva, Switzerland, 2007.
  35. ISO 8586:2023; Sensory Analysis— Guidelines for the Selection, Training and Monitoring of Tasters. International Organization for Standardization: Geneva, Switzerland, 2023.
  36. Escott, C.; Vaquero, C.; del Fresno, J.M.; Topo, A.; Comuzzo, P.; Gonzalez, C.; Morata, A. Effect of processing Verdejo grape must by UHPH using non-Saccharomyces yeasts in the absence of SO2. Sustain. Food Technol. 2024, 2, 437–446. [Google Scholar] [CrossRef]
  37. Bajpai, V.K.; Kamle, M.; Shukla, S.; Kumar Mahoto, D.; Chandra, P.; Kyu Hwang, S.; Kumar, P.; Suk Huh, Y.; Han, Y.K. Prospects of using nanotechnology for food preservation, safety, and security. J. Food Drug Anal. 2018, 26, 1201–1214. [Google Scholar] [CrossRef] [PubMed]
  38. Monge, M.; Moreno-Arribas, M.V. Applications of nanotechnology in wine production and quality and safety control. In Wine Safety, Consumer Preference, and Human Health. In Wine Safety, Consumer Preference, and Human Health; Springer: Berlin/Heidelberg, Germany, 2016; pp. 51–69. [Google Scholar] [CrossRef]
  39. Dallas, C.; Laureano, O. Effects of pH, sulphur dioxide, alcohol content, temperature and storage time on colour composition of a young Portuguese red table wine. J. Sci. Food Agric. 1994, 65, 477–485. [Google Scholar] [CrossRef]
  40. Nel, A.P.; Du Toit, W.J.; Van Jaarsveld, F.P. Pinking in white wines-A review. South Afr. J. Enol. Vitic. 2020, 41, 151–157. [Google Scholar] [CrossRef]
  41. Andorrà, I.; Landi, S.; Mas, A.; Guillamón, J.M.; Esteve-Zarzoso, B. Effect of oenological practices on microbial populations using culture-independent techniques. Food Microbiol. 2008, 25, 849–856. [Google Scholar] [CrossRef]
  42. Morata, A.; Del Fresno, J.M.; Gavahian, M.; Guamis, B.; Palomero, F.; López, C. Effect of HHP and UHPH high-pressure techniques on the extraction and stability of grape and other fruit anthocyanins. Antioxidants 2023, 12, 1746. [Google Scholar] [CrossRef]
  43. Makhotkina, O.; Kilmartin, P.A. Hydrolysis and formation of volatile esters in New Zealand Sauvignon blanc wine. Food Chem. 2012, 135, 486–493. [Google Scholar] [CrossRef]
  44. Morata, A.; Loria, I.; Escott, C.; Vaquero, C.; Bañuelos, M.A.; Fresno, J.M.; González, C.; Guamis, B. UHPH processing of grape must to improve wine quality. BIO Web Conf. 2023, 56, 02006. [Google Scholar] [CrossRef]
Figure 1. Atomic Force Microscopy (AFM) resonant scanning at 25 µm frame of Verdejo must treated with UHPH (a) 2D Topography; (b) 3D Topography.
Microorganisms 13 02623 g001
Figure 2. Atomic Force Microscopy (AFM) 2D amplitude of (a) Verdejo must control and (b) Verdejo must treated with UHPH.
Microorganisms 13 02623 g002
Figure 3. Absorbance at 420 nm of each must condition after clarification and UHPH treatment in the cases indicated. Data are expressed as the mean values (standard deviation) of n = 2 by ANOVA and Tukey’s HSD post-test (p < 0.05), and statistically significant differences are indicated by different letters (a, b, c, d, e). The nomenclature “free” indicates that no sulphur dioxide was added at the grape, must, or wine stages, the nomenclature “SO2 50%” indicates that grape and must were treated with 3 g/hL of sodium metabisulphite, and “SO2” indicates that grape and must were treated with 6 g/hL of sodium metabisulphite. UHPH indicates the sets treated by UHPH.
Microorganisms 13 02623 g003
Figure 4. Density evolution for each studied alcoholic fermentation. Mean data are shown. The nomenclature “free” indicates that no sulphur dioxide was added at the grape, must, or wine stages, the nomenclature “SO2 50%” indicates that grape and must were treated with 3 g/hL of sodium metabisulphite, and “SO2” indicates that grape and must were treated with 6 g/hL of sodium metabisulphite. UHPH indicates the sets treated by UHPH.
Microorganisms 13 02623 g004
Figure 5. Concentrations of total fermentative aromas (ethyl esters: ethyl butyrate, ethyl isovaleriate, ethyl hexanoate, ethyl octanoate, ethyl decanoate, ethyl dodecanoate, diethyl succinate, and ethyl acetate; acetates: isobutyl acetate, hexyl acetate, and 2-phenylethyl acetate; alcohols: isobutanol, isoamyl alcohol, benzil alcohol, and 2-phenylethyl alcohol; and fatty acids: hexanoic acid, octanoic acid, and decanoic acid) for each family after alcoholic fermentation for all the studied treatments and after the accelerated aging process. Data are expressed as mean values (standard deviation) of n = 2 by ANOVA and Tukey’s HSD post-test (p < 0.05), and statistically significant differences are indicated by different letters (a, b, c, and d) for each different fermentative aromas families. “oxi” refers to wines submitted to forced oxidation. All results are expressed as the equivalent of 2-octanol in μg/L. Supplementation data is shown in Table A1 in Appendix A.
Microorganisms 13 02623 g005
Figure 6. (a) Total oxidative aromas in Verdejo’s wines before the oxidation process and (b) total oxidative aromas in Verdejo’s wines after the oxidation process. Data are expressed as mean values (standard deviation) of n = 2 by ANOVA and Tukey’s HSD post-test (p < 0.05), and significant differences are indicated by different letters (a, b, c, d and e).
Microorganisms 13 02623 g006
Figure 7. Mean scores and significant differences obtained in the floral and overall assessment of wines performed by tasting panels. Data are expressed as mean values (standard deviation) of n = 2 by ANOVA and Tukey’s HSD post-test (p < 0.05), and statistically significant differences are indicated by different letters applied to bars of the same color (a and b).
Microorganisms 13 02623 g007
Figure 8. Absorbance at 420 nm of each wine before and after the oxidation process. Data are expressed as mean values (standard deviation) of n = 2 by ANOVA and Tukey’s HSD post-test (p < 0.05), and significant differences are indicated by different letters (a, b, c, d and e).
Microorganisms 13 02623 g008
Table 1. AFM sizes of the colloidal particles in the UHPH-processed and control Verdejo juices. Data are expressed as the mean values and SD (standard deviation) of n = 2.
Verdejo
202320242024
MeasureUHPH (nm)UHPH (nm)Control (nm)
Mean ± SD518.6 ± 129.3494.8 ± 143.72016.0 ± 781.0
Min.312.0183.21127.0
Max.973.9843.63759.0
Table 2. Basic chemical characterization of Verdejo must after clarification and UHPH batch treatment. Data are expressed as the mean values (standard deviation) of n = 2 by ANOVA and Tukey’s HSD post-test (p < 0.05), and statistically significant differences are indicated by different letters in the same row (a, b, c, d, e, f).
UHPH SO2-FreeUHPH 50% SO2UHPH SO2SO2-Free50% SO2SO2
°Brix22.7 a22.8 a22.7 a22.7 a22.8 a22.7 a
Glucose + Fructose (g/L)222.8 a223.9 a228.8 a222.8 a223.9 a222.8 a
Potential Alcohol Strength (% vol.)13.24 a13.31 a13.24 a13.24 a13.31 a13.44 a
Total Acidity (g/L)4.61 a4.30 a4.42 a4.69 a4.46 a4.48 a
pH3.46 a3.47 a3.45 a3.44 a3.43 a3.42 a
Ammonia (mg/L)110 a113 a113.0 a113 a114 a100 a
Primary Amino Nitrogen (mg/L)50 a53 a52 a51 a48 a37 a
Yeast-Assimilable Nitrogen (mg/L)149 a154 a154 a153 a151 a129 a
L-Malic acid (g/L)1.44 a1.44 a1.40 a1.39 a1.43 a1.48 a
Abs. 420 nm0.329 b0.146 f0.170 e0.485 a0.280 c0.191 d
Table 3. Oenological parameters of wines from must processed or untreated by UHPH. Data is expressed as the mean values (standard deviation) of n = 2 by ANOVA and Tukey’s HSD post-test (p < 0.05), and significative differences are indicated by different letters in the same row (a, b, c, and d).
UHPH SO2-FreeUHPH 50% SO2UHPH SO2SO2-Free50% SO2SO2
Alcohol (% vol.)14.15 a14.36 a14.26 a14.35 a14.43 a14.43 a
Volatile acidity (g/L)0.45 a0.48 a0.41 a0.45 a0.48 a0.47 a
Total acidity (g/L)4.4 a4.4 a4.4 a4.3 a4.3 a4.4 a
pH3.40 a3.41 a3.41 a3.43 a3.43 a3.42 a
L-Malic acid (g/L)1.1 a1.1 a1.1 a1.1 a1.1 a1.1 a
L-Lactic acid (g/L)<0.1 a<0.1 a<0.1 a<0.1 a<0.1 a<0.1 a
Abs. 420 nm0.104 b0.075 c0.077 c0.072 c0.105 b0.131 a
L*98.85 a99.65 a99.15 a99.65 a98.05 a97.75 a
a*−1.36 a−1.41 a−1.20 a−1.35 a−1.00 a−1.12 a
b*7.95 ab6.40 cd5.84 d5.68 d7.32 bc8.76 a
Turbidity1.03 c3.89 bc1.73 c7.41 ab11.8 a9.53 a
Folin–Ciocalteu index3.85 a4.15 a4.33 a6.11 a5.08 a3.91 a
Table 4. Microbiological results by culture plate and RT-PCR for all wines after bottling for all treatments. Data are expressed as mean values and SD (standard deviation) of n = 2. Data is expressed as the mean values (standard deviation) of n = 2 by ANOVA and Tukey’s HSD post-test (p < 0.05), and significative differences are indicated by different letters in the same row (a and b).
UHPH SO2-FreeUHPH 50% SO2UHPH SO2SO2-Free50% SO2SO2
Yeast (cfu/100 mL)<1 b<1 b<1 b<1 b240 a<1 b
Lactic bacteria (cfu/100 mL)<1<1<1<1<1<1
Acetic acid bacteria (cfu/100 mL)<1 b<1 b<1 b<1 b18 a<1 b
Brettanomyces (cfu/100 mL)<1 b<1< 1<1<1<1
Yeast (cells/mL)118 b103 b105 b109 b20.825 a119 b
Lactic acid bacteria (cells/mL)<20<20<20<20<20<20
Acetic acid bacteria (cells/mL)<20<20<20<2056<20
Brettanomyces bruxellensis (cells/mL)<20<20<20<20<20<20
Table 5. Concentration of oxidation markers by families for all studied wines (UHPH SO2-free; UHPH 50% SO2; UHPH SO2; SO2-free; 50% SO2; and SO2) after bottling “Initial” and after an accelerated aging process “Oxidated”. All data are expressed in µg/L. Data are expressed as the mean values of n = 2 by ANOVA and Tukey’s HSD post-test (p < 0.05), and significant differences are indicated by different letters in the same row (a, b, c, d, e and f). n.d.: not detected.
UHPH SO2-FreeUHPH 50%SO2UHPH SO2SO2-Free50% SO2SO2
InitialOxidatedInitialOxidatedInitialOxidatedInitialOxidatedInitialOxidatedInitialOxidated
(E)2-hexenal0.5 f3.0 d1.7 e4.3 c1.6 ef4.0 cd8.1 a6.1 b0.9 ef4.4 c0.9 ef7.4 a
(E)2-heptenal0.1 e0.8 b0.5 c0.3 cd0.5 c0.3 cd0.4 cd1.2 a0.3 d0.8 b0.9 b0.8 b
(E)2-octenal9.2 c4.6 d10.7 c2.7 d2.3 d0.5 d20.4 a0.6 d13.0 bc2.2 d1.2 d15.7 b
(E)2-nonenal0.9 cd1.1 cd1.6 c3.6 a0.3 d0.8 cd2.8 b2.0 c3.3 a3.3 a3.1 b1.2 cd
Total alkenals10.79.614.410.94.75.731.69.917.510.66.125.0
3-methylbutanaln.d. 129.0 bn.d.14.3 en.d.89.3 cn.d.294.2 an.d.71.5 dn.d.16.4 e
2-phenylacetaldehyde15.9 f72.8 b36.2 de46.3 d17.3 f43.3 d28.3 e126.0 a11.1 f36.3 de12.1 f60.7 c
methionaln.d.n.d.n.d.n.d.n.d.n.d.n.d.n.d.n.d.n.d.n.d.n.d.
Total strecker aldehides15.9191.336.260.617.3132.628.3420.211.1107.812.177.0
γ-nonalactona13.8 e14.2 e20.3 bcd17.2 cde13.3 e15.8 e20.6 bcd21.5 bc16.6 de57.0 a1.6 f22.9 b
Total lactones13.814.220.317.213.315.820.621.516.657.01.622.9
3-methyl-2,4-nonadiona0.6 e4.7 de11.4 c13.9 c0.5 e 18.4 c5.0 de14.1 c2.7 de96.2 an.d.72.3 b
Total ketones0.64.711.413.90.518.45.014.12.796.2n.d.72.3
4,5-Dimethyl-3-hydroxy-2,5-dihydrofuran-2-onen.d.n.d.n.d.n.d.n.d.n.d.n.d.n.d.n.d.n.d.n.d.n.d.
Total furansn.d.n.d.n.d.n.d.n.d.n.d.n.d.n.d.n.d.n.d.n.d.n.d.
Benzaldehyde14.3 e50.9 d13.3 e6.6 e55.7 d11.2 e62.0 d101.1 ab54.9 d86.0 bc119.7 a68.2 cd
Total aldehydes14.350.913.36.655.711.262.0101.154.986.0119.768.2
Table 6. Color characteristics of wines processed or untreated by UHPH after forced oxidation processes. Data are expressed as mean values (standard deviation) of n = 2 by ANOVA and Tukey’s HSD post-test (p < 0.05), and significant differences are indicated by different letters (a, b, c, and d).
UHPH SO2-FreeUHPH 50% SO2UHPH SO2SO2-Free50% SO2SO2
Abs. 420 nm0.262 a0.174 b0.131 c0.243 a0.178 b0.111 c
L*94.55 d97.35 ab98.25 a95.40 cd96.60 bc98.30 a
a*−0.80 a−0.84 a−0.91 a−1.03 a−0.66 a−0.59 a
b*15.39 a11.56 b8.82 c14.38 a10.95 b7.15 c
Folin–Ciocalteu index2.84 b3.16 b3.38 b3.34 b3.46 b4.07 a
Table 7. Fermentative aroma concentrations for the studied treatments before and after oxidation processes. Data are expressed as mean values (standard deviation) of n = 2 by ANOVA and Tukey’s HSD post-test (p < 0.05), and significant differences are indicated by different letters in the same row (a, b, c, and d). All results are expressed as equivalents of 2-octanol in μg/L. Supplementation data is shown in Table A1 in Appendix A.
SampleTotal Ethyl EstersTotal AcetatesTotal AlcoholsTotal Fatty Acids
Initial sampleUHPH SO2-free30.874 a14.336 a5.275 a5.958 a
UHPH 50% SO229.779 a14.448 a4.912 a5.634 a
UHPH SO230.977 a14.598 a4.835 a5.872 a
SO2-free31.594 a13.124 ab5.189 a5.581 a
50% SO228.874 a12.933 ab4.519 a5.541 a
SO231.282 a12.280 b4.723 a5.411 a
Forced oxidation processUHPH SO2-free9.198 c4.372 d3.766 a3.530 bc
UHPH 50% SO222.224 b9.951 c4.412 a4.698 abc
UHPH SO210.690 b9.113 c4.274 a4.705 abc
SO2-free15.802 c4.640 d4.183 a3.133 c
50% SO222.060 b9.966 c4.413 a4.316 abc
SO215.433 b9.457 c4.174 a5.040 ab
Fermentative aromas were formed by the sum of ethyl esters: ethyl butyrate, ethyl isovaleriate, ethyl hexanoate, ethyl octanoate, ethyl decanoate, ethyl dodecanoate, diethyl succinate, and ethyl acetate; acetates: isobutyl acetate, hexyl acetate, and 2-phenylethyl acetate; alcohols: isobutanol, isoamyl alcohol, benzil alcohol, and 2-phenylethyl alcohol; and fatty acids: hexanoic acid, octanoic acid, and decanoic acid.
Disclaimer/Publisher’s Note: The statements, opinions and data contained in all publications are solely those of the individual author(s) and contributor(s) and not of MDPI and/or the editor(s). MDPI and/or the editor(s) disclaim responsibility for any injury to people or property resulting from any ideas, methods, instructions or products referred to in the content.