
Real-Time and Rapid Respiratory Response of the Soil Microbiome to Moisture Shifts
 , ,
, ,
Abstract
:1. Introduction
2. Methods
2.1. Field Site
2.2. Incubations
2.3. Soil Respiration Measurements
2.4. Data Analysis
3. Results
4. Discussion
5. Conclusions
Author Contributions
Funding
Data Availability Statement
Acknowledgments
Conflicts of Interest
References
- Gao, J.Q.; Feng, J.; Zhang, X.W.; Yu, F.H.; Xu, X.L.; Kuzyakov, Y. Drying-rewetting cycles alter carbon and nitrogen mineralization in litter-amended alpine wetland soil. Catena 2016, 145, 285–290. [Google Scholar] [CrossRef]
- Birch, H.F. The effect of soil drying on humus decomposition and nitrogen availability. Plant Soil 1958, 10, 9–31. [Google Scholar] [CrossRef]
- Warren, C.R. Pools and fluxes of osmolytes in moist soil and dry soil that has been re-wet. Soil Biol. Biochem. 2020, 150, 108012. [Google Scholar] [CrossRef]
- Jarvis, P.; Rey, A.; Petsikos, C.; Wingate, L.; Rayment, M.; Pereira, J.; Banza, J.; David, J.; Miglietta, F.; Borghetti, M.; et al. Drying and wetting of Mediterranean soils stimulates decomposition and carbon dioxide emission: The “Birch effect”. Tree Physiol. 2007, 27, 929–940. [Google Scholar] [CrossRef] [PubMed]
- Unger, S.; Maguas, C.; Pereira, J.S.; David, T.S.; Werner, C. The influence of precipitation pulses on soil respiration—Assessing the “Birch effect” by stable carbon isotopes. Soil Biol. Biochem. 2010, 42, 1800–1810. [Google Scholar] [CrossRef]
- Borken, W.; Matzner, E. Reappraisal of drying and wetting effects on C and N mineralization and fluxes in soils. Glob. Chang. Biol. 2009, 15, 808–824. [Google Scholar] [CrossRef]
- Fierer, N.; Schimel, J.P. A proposed mechanism for the pulse in carbon dioxide production commonly observed following the rapid rewetting of a dry soil. Soil Sci. Soc. Am. J. 2003, 67, 798–805. [Google Scholar] [CrossRef]
- Canarini, A.; Kiaer, L.P.; Dijkstra, F.A. Soil carbon loss regulated by drought intensity and available substrate: A meta-analysis. Soil Biol. Biochem. 2017, 112, 90–99. [Google Scholar] [CrossRef]
- Fierer, N.; Schimel, J.P. Effects of drying-rewetting frequency on soil carbon and nitrogen transformations. Soil Biol. Biochem. 2002, 34, 777–787. [Google Scholar] [CrossRef]
- Birch, H.F.; Friend, M.T. Humus Decomposition in East African Soils. Nature 1956, 178, 500–501. [Google Scholar] [CrossRef]
- Birch, H.F. Mineralisation of plant nitrogen following alternate wet and dry conditions. Plant Soil 1964, 20, 43–49. [Google Scholar] [CrossRef]
- Unger, S.; Maguas, C.; Pereira, J.S.; David, T.S.; Werner, C. Interpreting post-drought rewetting effects on soil and ecosystem carbon dynamics in a Mediterranean oak savannah. Agr. For. Meteorol. 2012, 154, 9–18. [Google Scholar] [CrossRef]
- Kakumanu, M.L.; Cantrell, C.L.; Williams, M.A. Microbial community response to varying magnitudes of desiccation in soil: A test of the osmolyte accumulation hypothesis. Soil Biol. Biochem. 2013, 57, 644–653. [Google Scholar] [CrossRef]
- Maier, M.; Schack-Kirchner, H.; Hildebrand, E.E.; Schindler, D. Soil CO2 efflux vs. soil respiration: Implications for flux models. Agr. For. Meteorol. 2011, 151, 1723–1730. [Google Scholar] [CrossRef]
- Bertrand, I.; Delfosse, O.; Mary, B. Carbon and nitrogen mineralization in acidic, limed and calcareous agricultural soils: Apparent and actual effects. Soil Biol. Biochem. 2007, 39, 276–288. [Google Scholar] [CrossRef]
- Warren, C.R. Response of osmolytes in soil to drying and rewetting. Soil Biol. Biochem. 2014, 70, 22–32. [Google Scholar] [CrossRef]
- Denef, K.; Six, J.; Bossuyt, H.; Frey, S.D.; Elliott, E.T.; Merckx, R.; Paustian, K. Influence of dry-wet cycles on the interrelationship between aggregate, particulate organic matter, and microbial community dynamics. Soil Biol. Biochem. 2001, 33, 1599–1611. [Google Scholar] [CrossRef]
- Navarro-Garcia, F.; Casermeiro, M.A.; Schimel, J.P. When structure means conservation: Effect of aggregate structure in controlling microbial responses to rewetting events. Soil Biol. Biochem. 2012, 44, 1–8. [Google Scholar] [CrossRef]
- Warren, C.R. Do microbial osmolytes or extracellular depolymerisation products accumulate as soil dries? Soil Biol. Biochem. 2016, 98, 54–63. [Google Scholar] [CrossRef]
- Iovieno, P.; Baath, E. Effect of drying and rewetting on bacterial growth rates in soil. Fems Microbiol. Ecol. 2008, 65, 400–407. [Google Scholar] [CrossRef]
- Meisner, A.; Baath, E.; Rousk, J. Microbial growth responses upon rewetting soil dried for four days or one year. Soil Biol. Biochem. 2013, 66, 188–192. [Google Scholar] [CrossRef]
- Scheu, S.; Parkinson, D. Changes in Bacterial and Fungal Biomass-C, Bacterial and Fungal Biovolume and Ergosterol Content after Drying, Remoistening and Incubation of Different Layers of Cool Temperate Forest Soils. Soil Biol. Biochem. 1994, 26, 1515–1525. [Google Scholar] [CrossRef]
- Bottner, P. Response of Microbial Biomass to Alternate Moist and Dry Conditions in a Soil Incubated with C-14-Labeled and N-15-Labelled Plant-Material. Soil Biol. Biochem. 1985, 17, 329–337. [Google Scholar] [CrossRef]
- Wayson, C.A.; Randolph, J.C.; Hanson, P.J.; Grimmond, C.S.B.; Schmid, H.P. Comparison of soil respiration methods in a mid-latitude deciduous forest. Biogeochemistry 2006, 80, 173–189. [Google Scholar] [CrossRef]
- Sandor, M. Soil respiration: Concept and measurement methods. Proenvironment Promediu 2010, 3, 54–57. [Google Scholar]
- Orchard, V.A.; Cook, F.J. Relationship between soil respiration and soil moisture. Soil Biol. Biochem. 1983, 15, 447–453. [Google Scholar] [CrossRef]
- Weitz, K.K.; Smith, M.L.; Hixson, K.K.; Hill, E.A.; Jansson, J.K.; Hofmockel, K.S.; Lipton, M.S. Real-Time Mass Spectrometry Measurements of Respiration Rates in Biological Systems. J. Am. Soc. Mass Spectrom. 2021, 32, 648–652. [Google Scholar] [CrossRef] [PubMed]
- Blazewicz, S.J.; Schwartz, E.; Firestone, M.K. Growth and death of bacteria and fungi underlie rainfall-induced carbon dioxide pulses from seasonally dried soil. Ecology 2014, 95, 1162–1172. [Google Scholar] [CrossRef] [PubMed]
- Davidson, E.A.; Savage, K.E.; Finzi, A.C. A big-microsite framework for soil carbon modeling. Glob. Chang. Biol. 2014, 20, 3610–3620. [Google Scholar] [CrossRef]
- Schjonning, P.; Thomsen, I.K.; Moldrup, P.; Christensen, B.T. Linking soil microbial activity to water- and air-phase contents and diffusivities. Soil Sci. Soc. Am. J. 2003, 67, 156–165. [Google Scholar]
- Skopp, J.; Jawson, M.D.; Doran, J.W. Steady-State Aerobic Microbial Activity as a Function of Soil-Water Content. Soil Sci. Soc. Am. J. 1990, 54, 1619–1625. [Google Scholar] [CrossRef]
- Schimel, J.P. Life in Dry Soils: Effects of Drought on Soil Microbial Communities and Processes. Annu. Rev. Ecol. Evol. Syst. 2018, 49, 409–432. [Google Scholar] [CrossRef]
- Tecon, R.; Or, D. Biophysical processes supporting the diversity of microbial life in soil. FEMS Microbiol. Rev. 2017, 41, 599–623. [Google Scholar] [CrossRef] [PubMed]
- Liu, Y.C.; Lawrence, C.R.; Winnick, M.J.; Hsu, H.T.; Maher, K.; Druhan, J.L. Modeling Transient Soil Moisture Limitations on Microbial Carbon Respiration. J. Geophys. Res. Biogeosci. 2019, 124, 2222–2247. [Google Scholar] [CrossRef]
- Vargas, R.; Carbone, M.S.; Reichstein, M.; Baldocchi, D.D. Frontiers and challenges in soil respiration research: From measurements to model-data integration. Biogeochemistry 2011, 102, 1–13. [Google Scholar] [CrossRef]
- Carbone, M.S.; Vargas, R. Automated soil respiration measurements: New information, opportunities and challenges. New Phytol. 2008, 177, 295–297. [Google Scholar] [CrossRef]
- Available online: https://www.usclimatedata.com/climate/prosser/washington/united-states/uswa0355 (accessed on 20 September 2023).
- Available online: https://nasis.sc.egov.usda.gov/NasisReportsWebSite/limsreport.aspx?report_name=Pedon_Site_Description_usepedonid&pedon_id=S1961WA025011 (accessed on 20 September 2023).
- Carter, D.O.; Yellowlees, D.; Tibbett, M. Autoclaving kills soil microbes yet soil enzymes remain active. Pedobiologia 2007, 51, 295–299. [Google Scholar] [CrossRef]
- Berns, A.E.; Philipp, H.; Narres, H.D.; Burauel, P.; Vereecken, H.; Tappe, W. Effect of gamma-sterilization and autoclaving on soil organic matter structure as studied by solid state NMR, UV and fluorescence spectroscopy. Eur. J. Soil Sci. 2008, 59, 540–550. [Google Scholar] [CrossRef]
- Razavi Darbar, S. Evaluation of chemical and biological consequences of soil sterilization methods. Casp. J. Enviromental Sci. 2007, 5, 87–91. [Google Scholar]
- Brown, V.A. An Introduction to Linear Mixed-Effects Modeling in R. Adv. Methods Pract. Psychol. Sci. 2021, 4, 2515245920960351. [Google Scholar] [CrossRef]
- Salonius, P.O.; Robinson, J.B.; Chase, F.E. A Comparison of Autoclaved and Gamma-Irradiated Soils as Media for Microbial Colonization Experiments. Plant Soil 1967, 27, 239–248. [Google Scholar] [CrossRef]
- Salonius, P.O.; Robinson, J.B.; Chase, F.E. Autoclaving kills soil microbes yet soil enzymes remain active. Pedobiologia 1967, 51, 295–299. [Google Scholar]
- Williams, M.A.; Xia, K. Characterization of the water soluble soil organic pool following the rewetting of dry soil in a drought-prone tallgrass prairie. Soil Biol. Biochem. 2009, 41, 21–28. [Google Scholar] [CrossRef]
- de Graaff, M.A.; Classen, A.T.; Castro, H.F.; Schadt, C.W. Labile soil carbon inputs mediate the soil microbial community composition and plant residue decomposition rates. New Phytol. 2010, 188, 1055–1064. [Google Scholar] [CrossRef]
- Manzoni, S.; Schaeffer, S.M.; Katul, G.; Porporato, A.; Schimel, J.P. A theoretical analysis of microbial eco-physiological and diffusion limitations to carbon cycling in drying soils. Soil Biol. Biochem. 2014, 73, 69–83. [Google Scholar] [CrossRef]
- Slessarev, E.W.; Schimel, J.P. Partitioning sources of CO2 emission after soil wetting using high-resolution observations and minimal models. Soil Biol. Biochem. 2020, 143, 107753. [Google Scholar] [CrossRef]


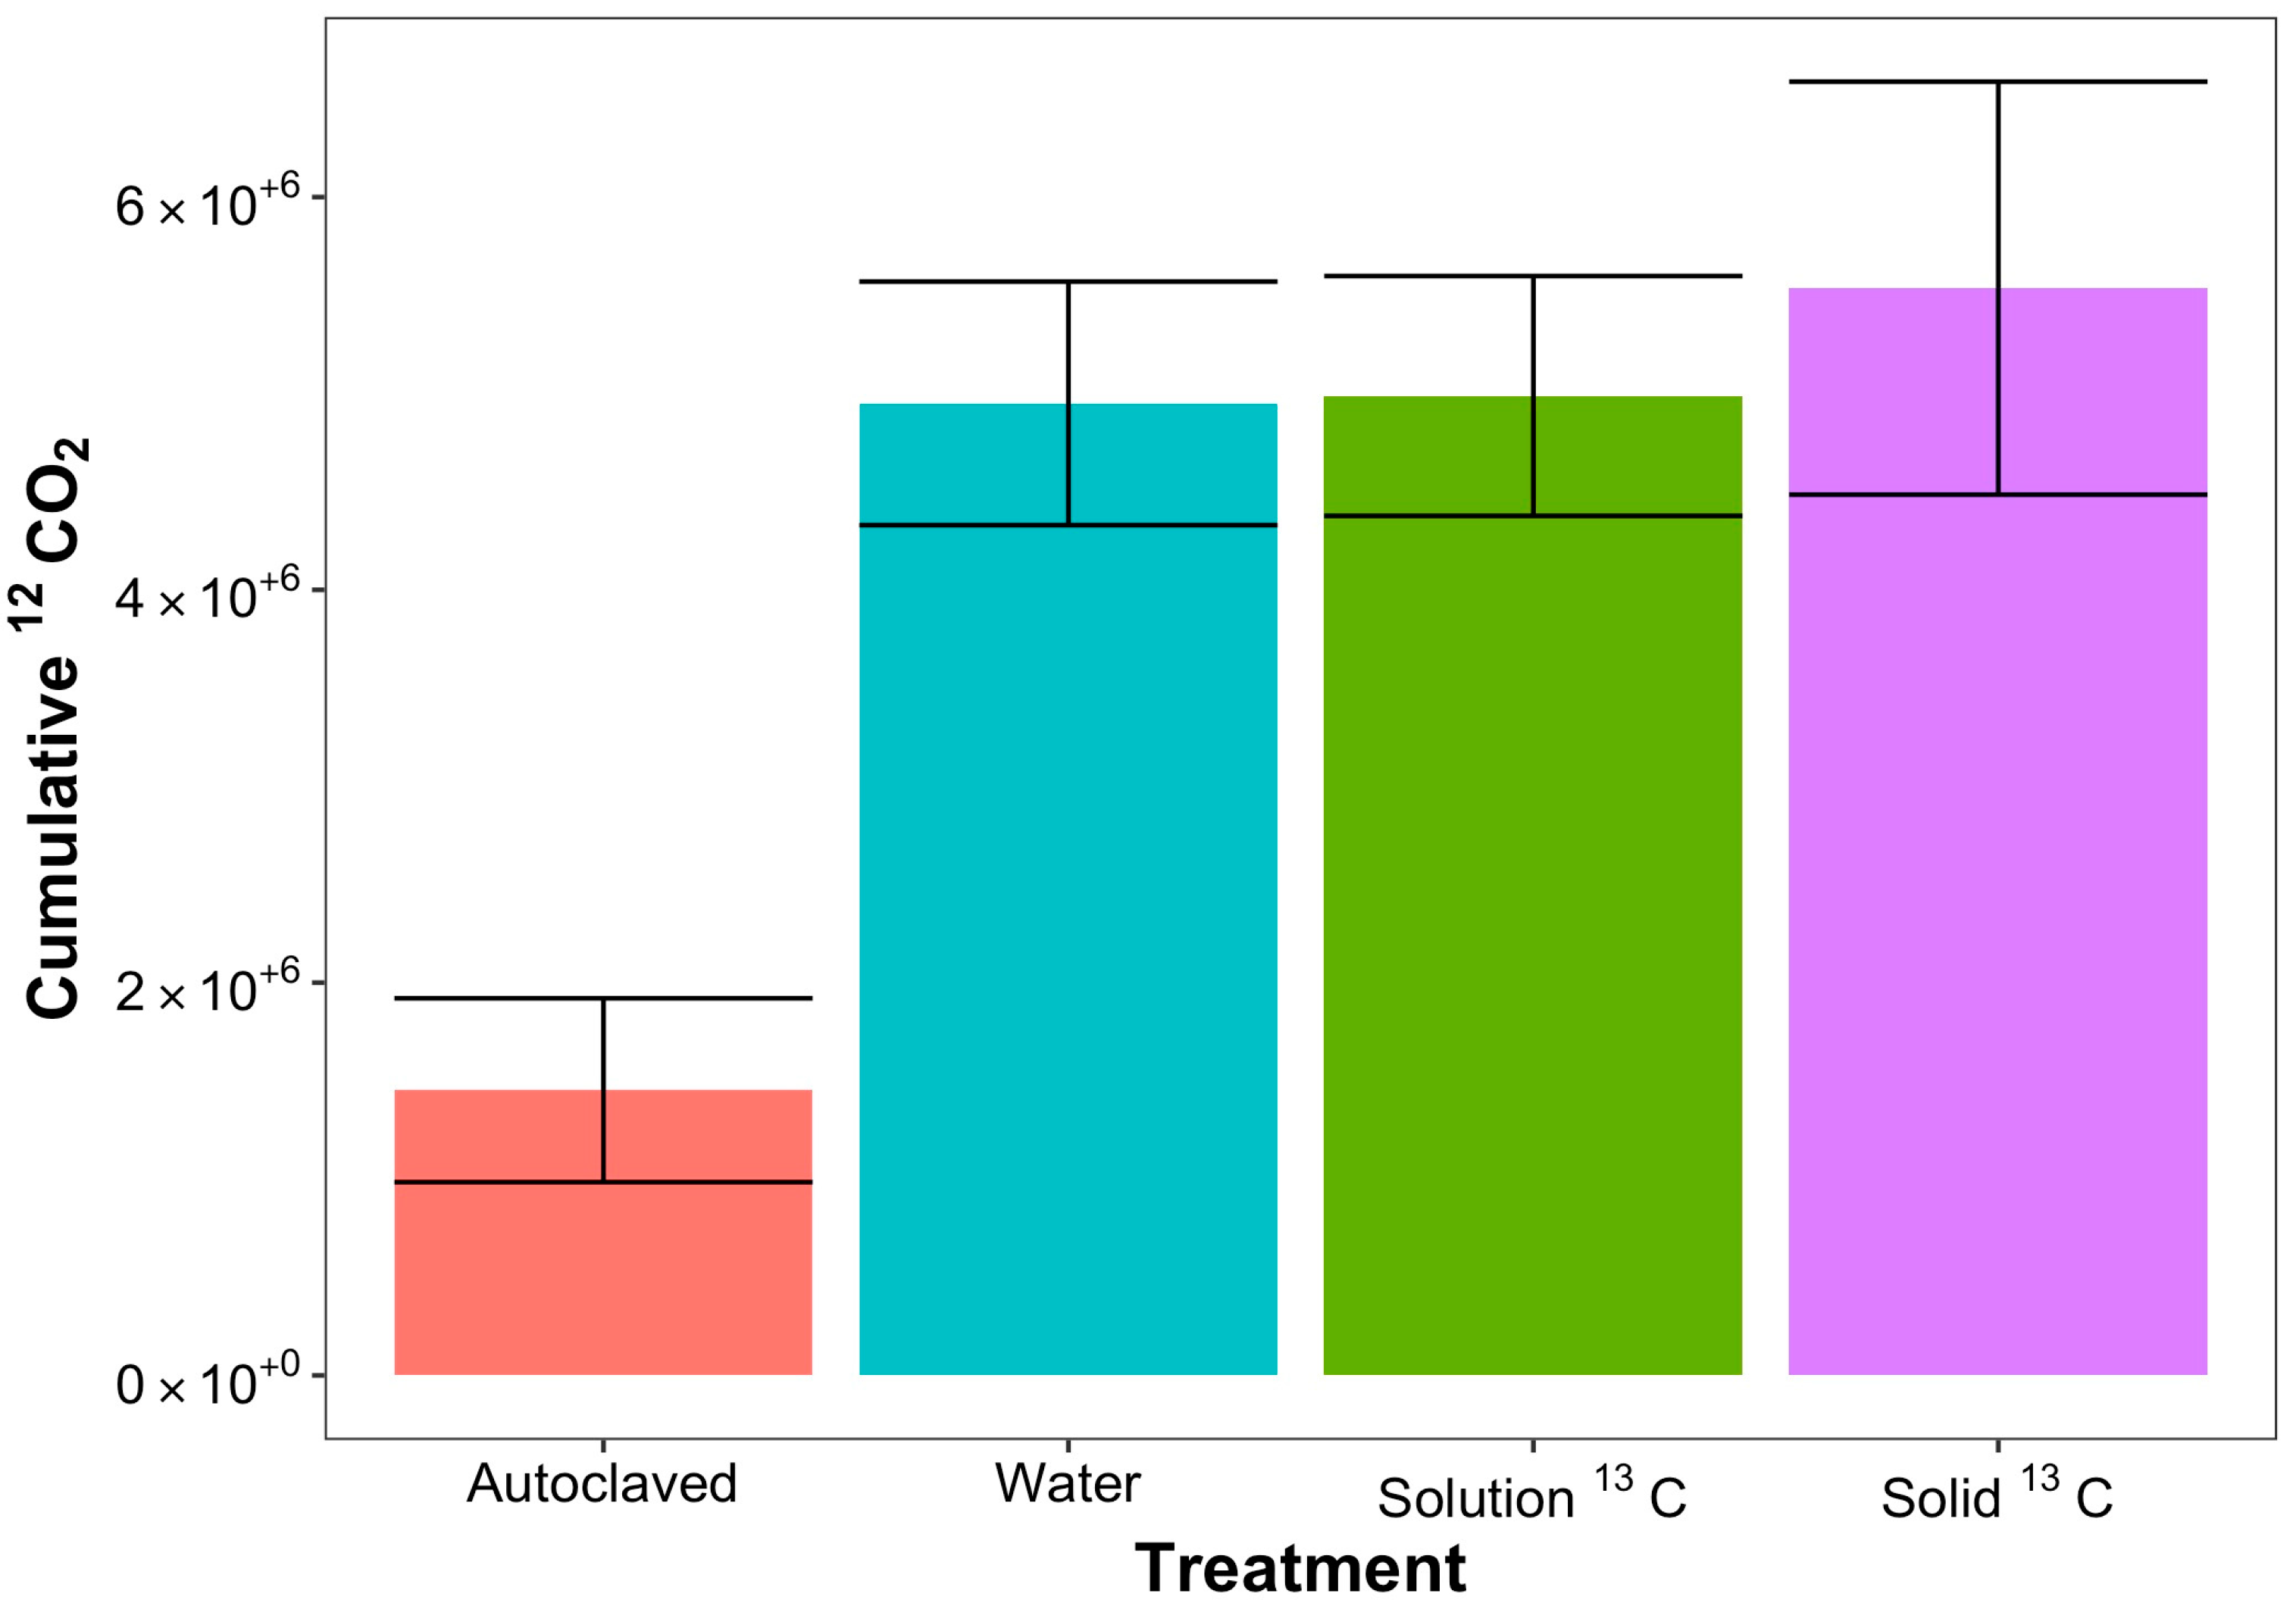
| 12CO2 | ||||
|---|---|---|---|---|
| Autoclaved | Water | Solution 13C | Solid 13C | |
| Rate: ppm CO2/min: 0–15 min | 49.31 ± 13.80 | 83.28 ± 14.51 | 66.89 ± 12.05 | 84.16 ± 15.36 |
| Rate: ppm CO2/min: 15–90 min | −5.91 ± 1.94 | −4.42 ± 2.15 | −0.95 ± 1.57 | −3.46 ± 1.72 |
| Rate: ppm CO2/min: 300–360 min | −0.19 ± 0.10 | −0.29 ± 0.21 | −0.66 ± 0.05 | −0.05 ± 0.29 |
| Cumulative: ppm CO2: 0–15 min | 180,910.4 ± 54,105.69 | 303,464.3 ± 58,168.41 | 233,231.7 ± 50,054.46 | 303,105.2 ± 58,366.17 |
| Cumulative: ppm CO2: 15–90 min | 696,171.9 ± 181,511.2 | 1,563,636 ± 171,505.3 | 1,453,573 ± 164,849.5 | 1,673,091 ± 228,794.6 |
| Cumulative: ppm CO2: 300–360 min | 60,161.04 ± 19,173.33 | 555,203.4 ± 90,076.06 | 592,211.3 ± 31,433.3 | 670,661.1 ± 90,516.3 |
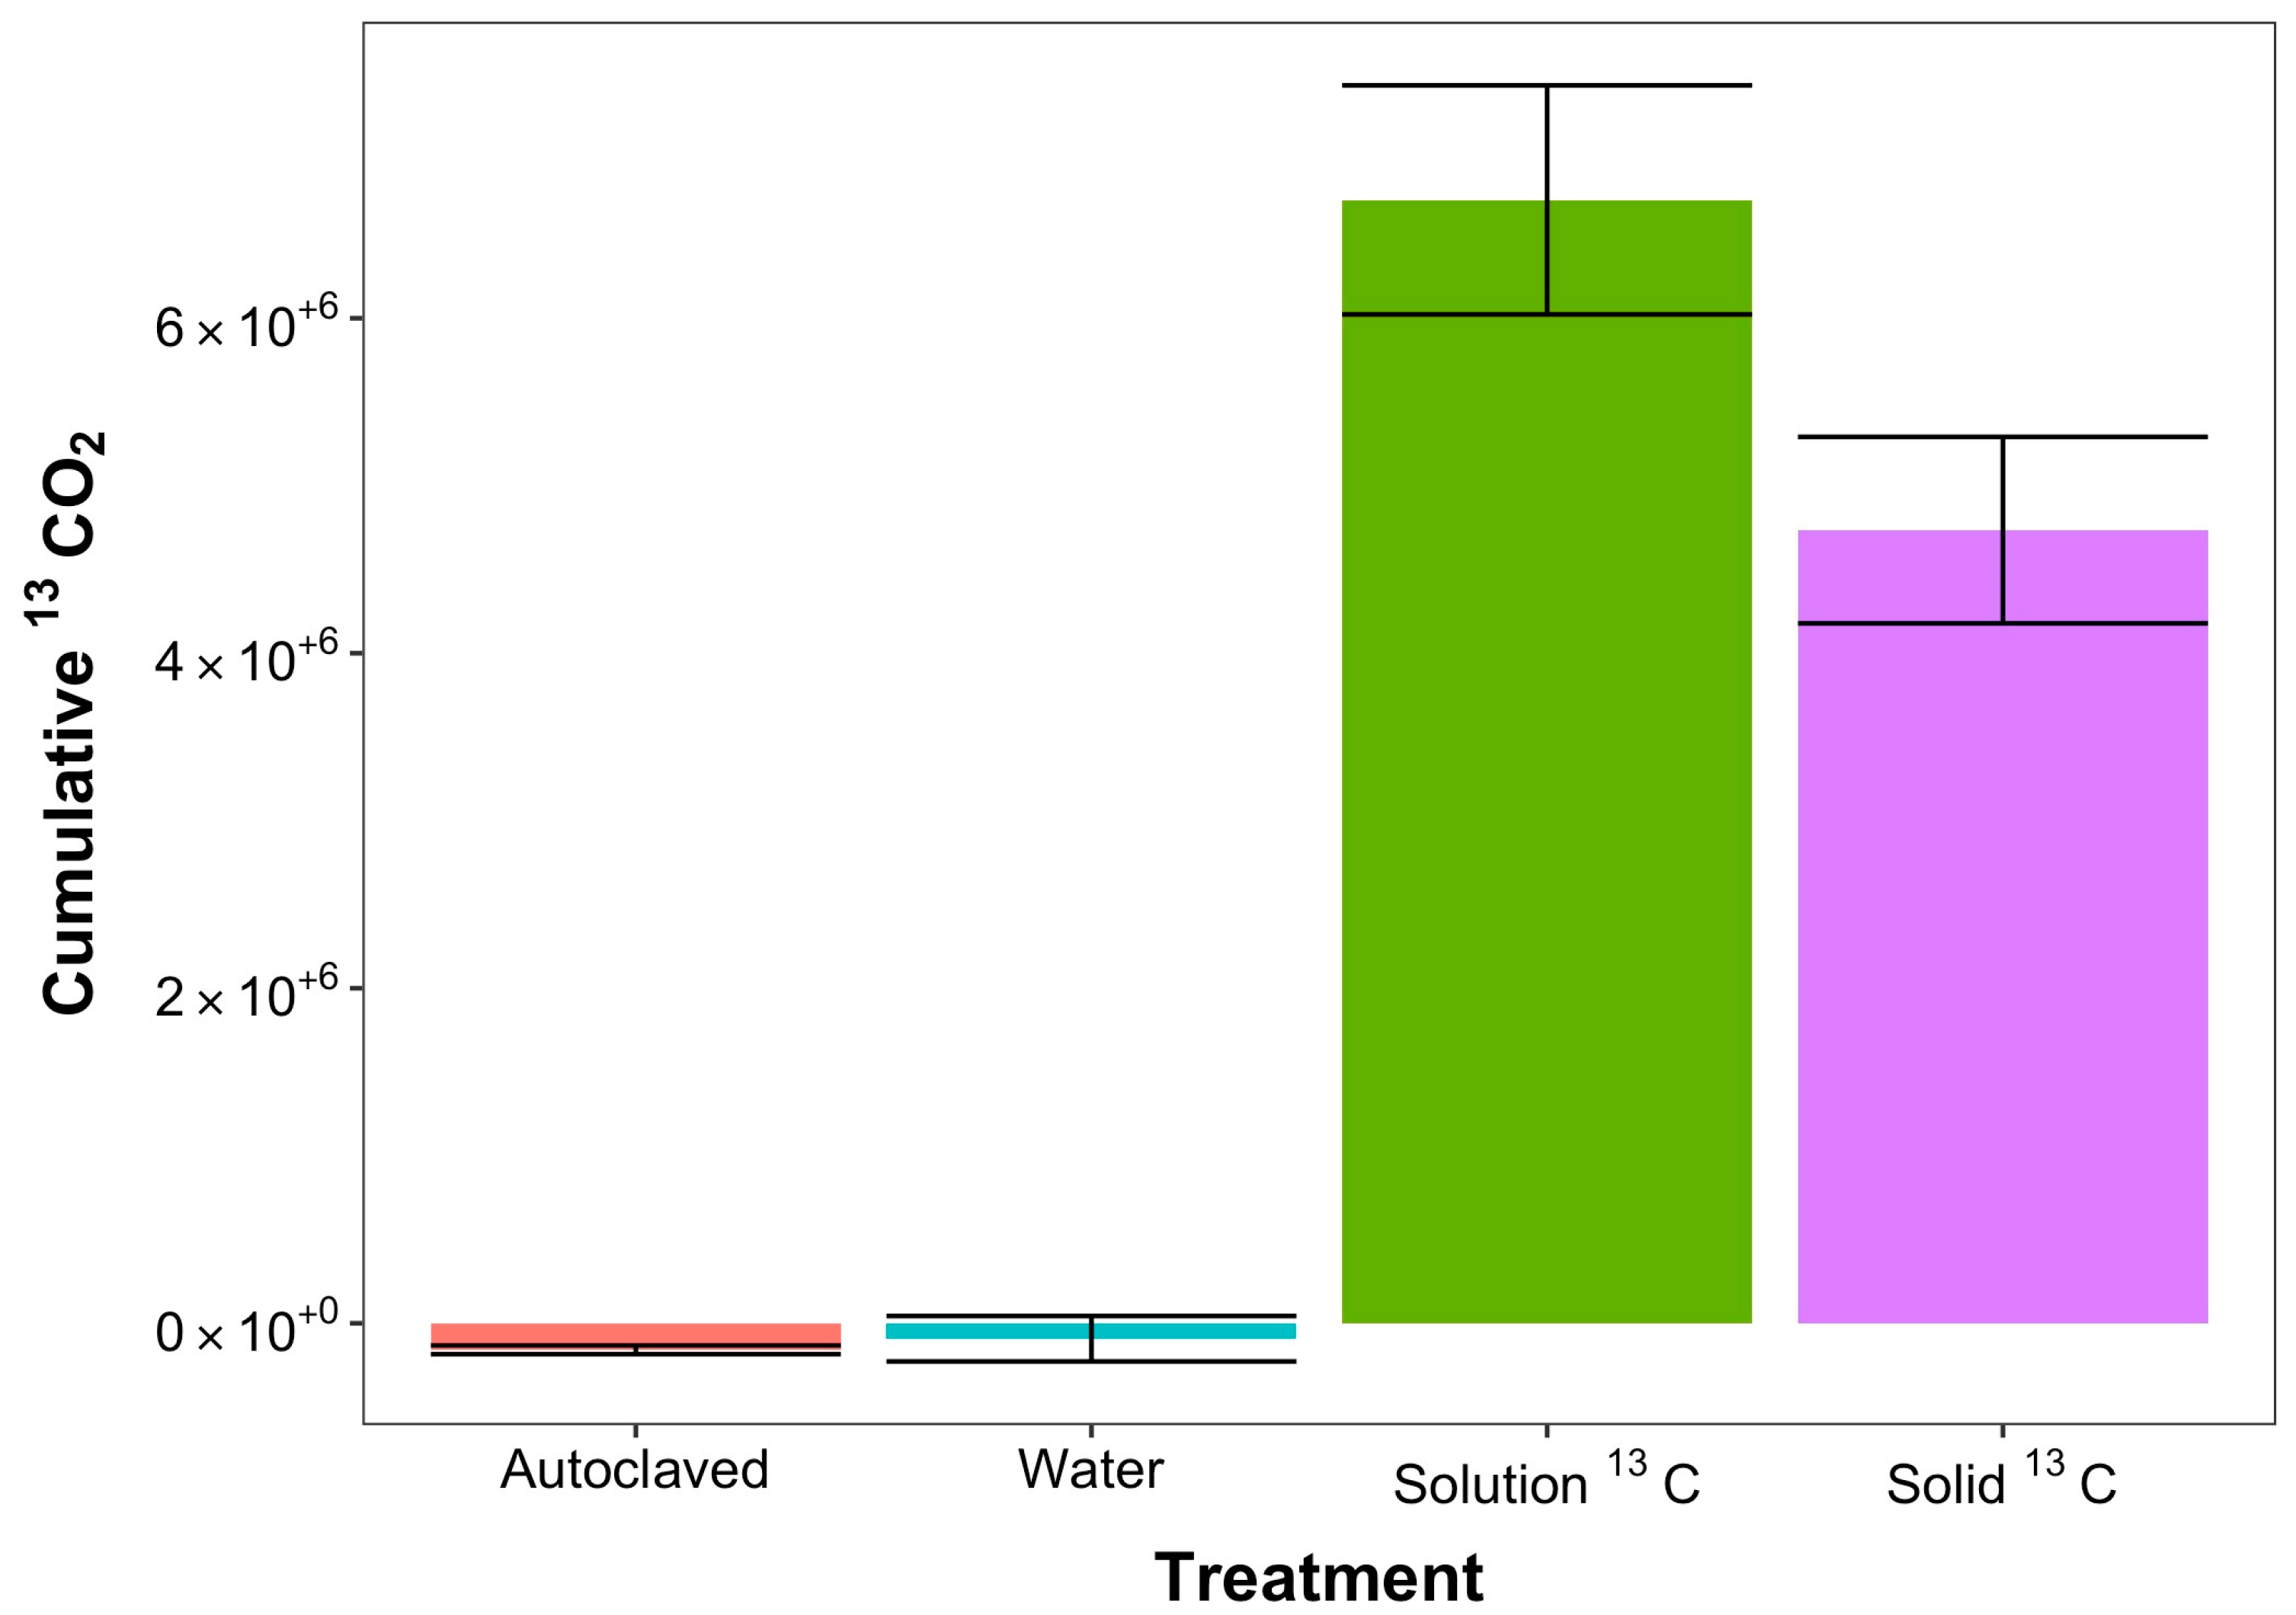
| 13CO2 | ||||
| Autoclaved | Water | Solution 13C | Solid 13C | |
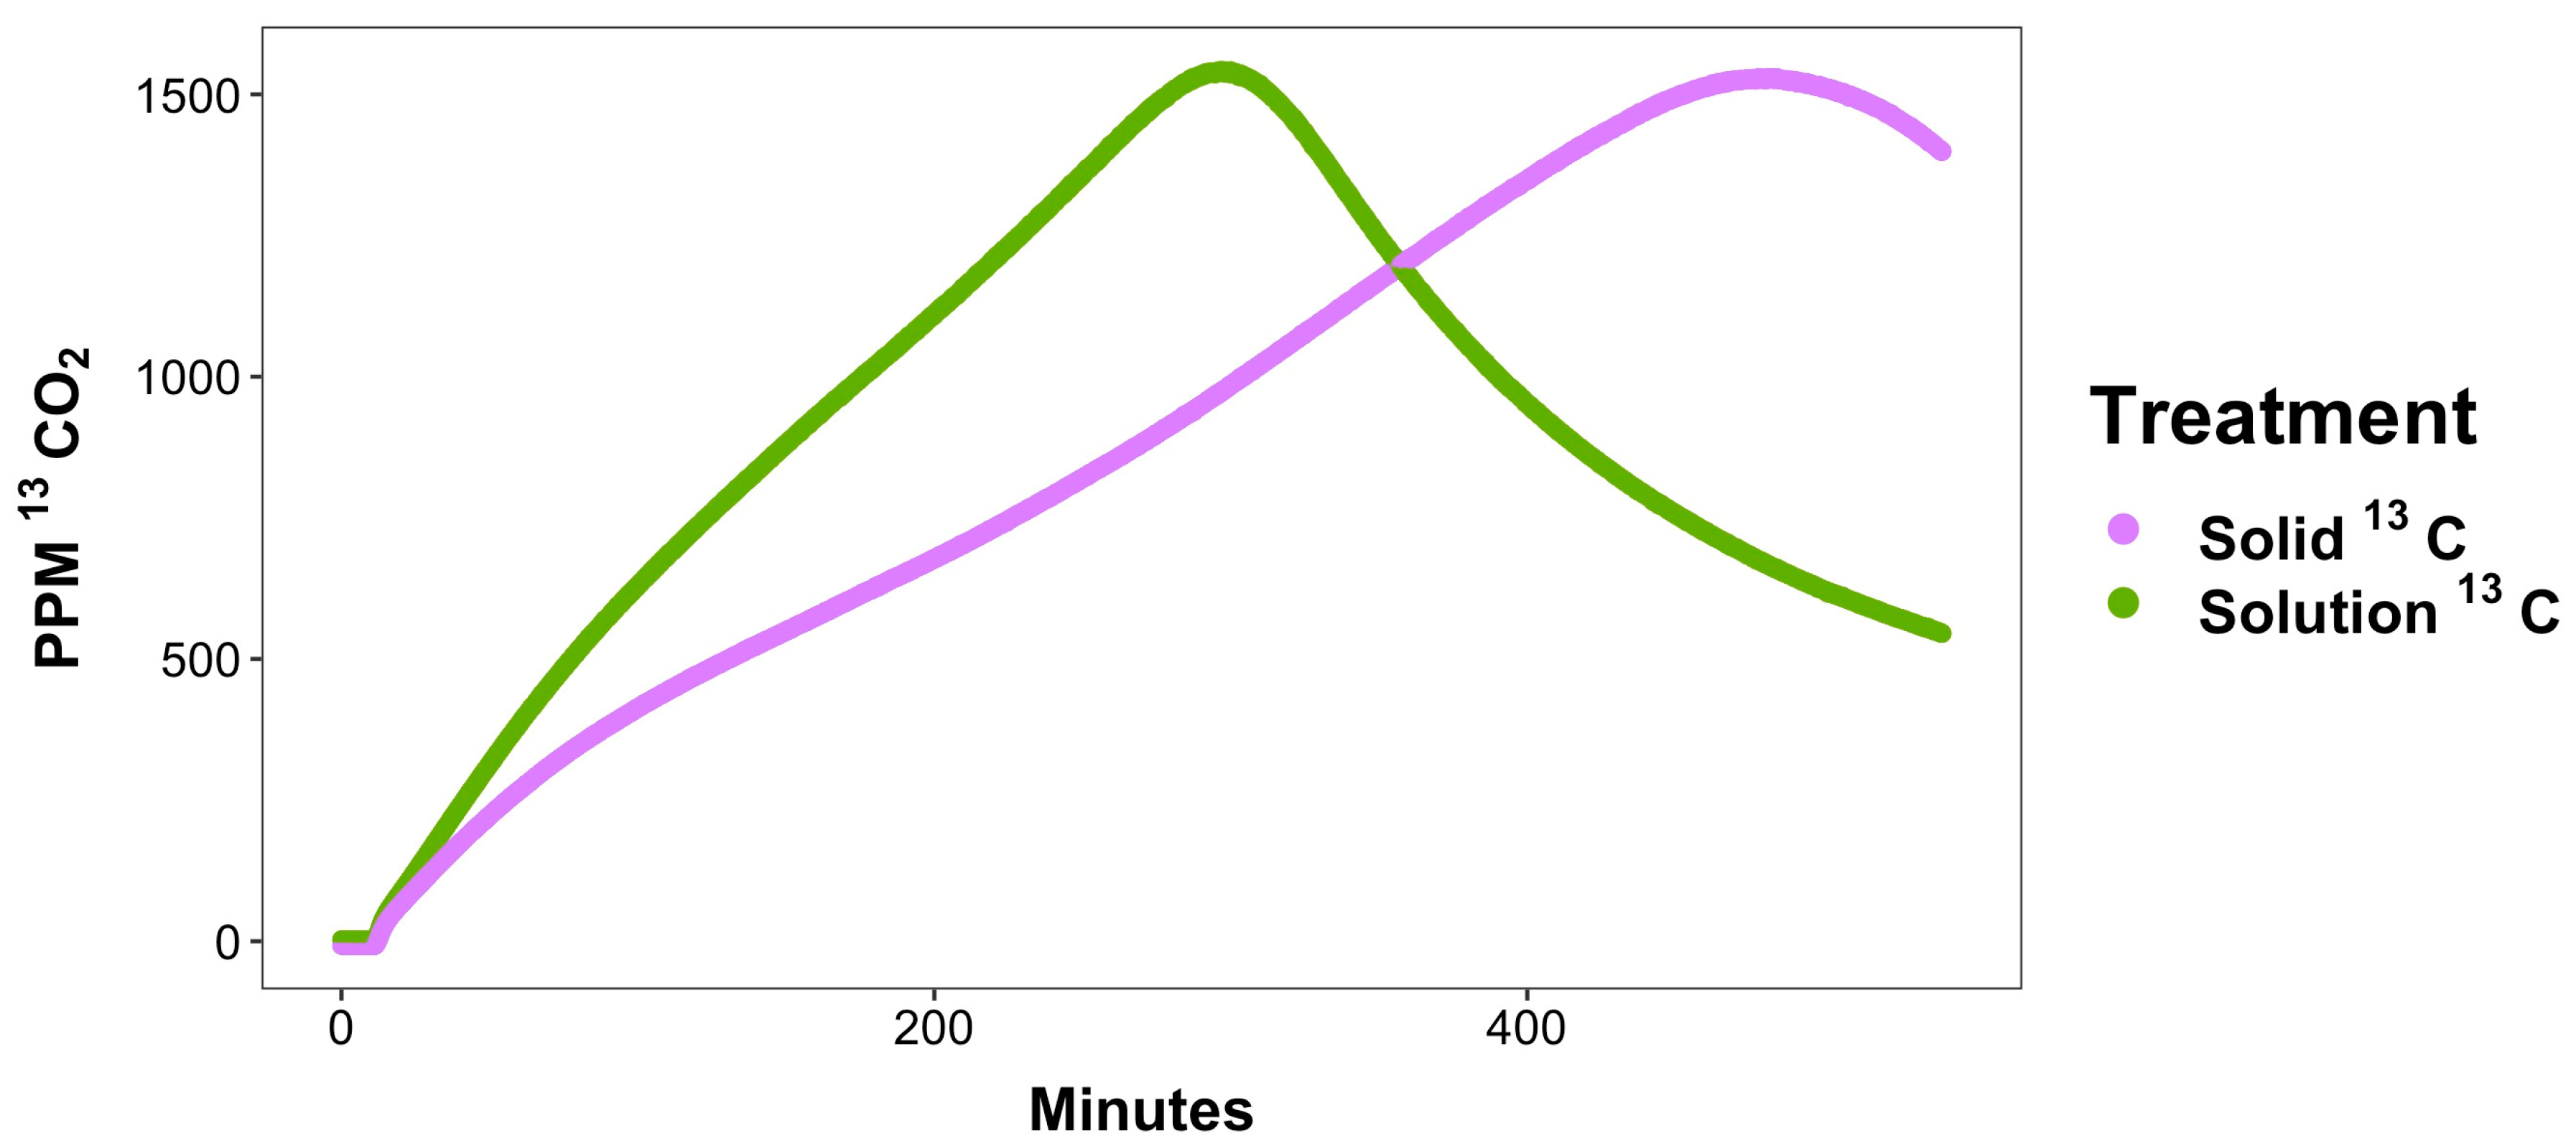
| Rate: ppm CO2/min: 0–15 min | 0.85 ± 0.21 | 1.31± 0.22 | 7.86 ± 0.55 | 6.85 ± 0.57 |
| Rate: ppm CO2/min: 15–90 min | −0.12 ± 0.02 | −0.16 ± 0.08 | 6.49 ± 0.31 | 4.26 ± 0.24 |
| Rate: ppm CO2/min: 300–360 min | −0.04 ± 0.02 | −0.03 ± 0.03 | −6.86 ± 0.96 | 3.69 ± 0.80 |
| Cumulative: ppm CO2: 0–15 min | −3542.3 ± 1102.07 | 1047.22 ± 5920.18 | 15,962.34 ± 5920.18 | 14,631.52 ± 3971.39 |
| Cumulative: ppm CO2: 15–90 min | −21,799.99 ± 5225 | −142.2 ± 7872.39 | 550,644.1 ± 55,425.45 | 408,071.2 ± 34,657.65 |
| Cumulative: ppm CO2: 300–360 min | −33,876.62 ± 3446.91 | −28,168.73 ± 21,098.52 | 1,552,464 ± 62,269.63 | 1,362,448 ± 103,241.9 |
Disclaimer/Publisher’s Note: The statements, opinions and data contained in all publications are solely those of the individual author(s) and contributor(s) and not of MDPI and/or the editor(s). MDPI and/or the editor(s) disclaim responsibility for any injury to people or property resulting from any ideas, methods, instructions or products referred to in the content. |
© 2023 by the authors. Licensee MDPI, Basel, Switzerland. This article is an open access article distributed under the terms and conditions of the Creative Commons Attribution (CC BY) license (https://creativecommons.org/licenses/by/4.0/).
Share and Cite
Smith, M.L.; Weitz, K.K.; Thompson, A.M.; Jansson, J.K.; Hofmockel, K.S.; Lipton, M.S. Real-Time and Rapid Respiratory Response of the Soil Microbiome to Moisture Shifts. Microorganisms 2023, 11, 2630. https://doi.org/10.3390/microorganisms11112630
Smith ML, Weitz KK, Thompson AM, Jansson JK, Hofmockel KS, Lipton MS. Real-Time and Rapid Respiratory Response of the Soil Microbiome to Moisture Shifts. Microorganisms. 2023; 11(11):2630. https://doi.org/10.3390/microorganisms11112630
Chicago/Turabian StyleSmith, Montana L., Karl K. Weitz, Allison M. Thompson, Janet K. Jansson, Kirsten S. Hofmockel, and Mary S. Lipton. 2023. "Real-Time and Rapid Respiratory Response of the Soil Microbiome to Moisture Shifts" Microorganisms 11, no. 11: 2630. https://doi.org/10.3390/microorganisms11112630