Article

Large-Scale Integration of Amplicon Data Reveals Massive Diversity within Saprospirales, Mostly Originating from Saline Environments

by
Rafaila Nikola Mourgela
1,
Antonios Kioukis
2,
Mohsen Pourjam
3 and
Ilias Lagkouvardos
2,3,4,*
1
School of Chemical and Environmental Engineering, Technical University of Crete, 73100 Chania, Greece
2
Department of Microbiology and Microbial Pathogenesis, School of Medicine, University of Crete, 71500 Heraklion, Greece
3
ZIEL Institute of Food and Health, Technical University of Munich, 85354 Freising, Germany
4
Institute of Marine Biology, Biotechnology and Aquaculture, Hellenic Centre for Marine Research, 71500 Heraklion, Greece
*
Author to whom correspondence should be addressed.
Microorganisms 2023, 11(7), 1767; https://doi.org/10.3390/microorganisms11071767
Submission received: 14 April 2023 / Revised: 26 June 2023 / Accepted: 1 July 2023 / Published: 6 July 2023

Abstract

:
The order Saprospirales, a group of bacteria involved in complex degradation pathways, comprises three officially described families: Saprospiraceae, Lewinellaceae, and Haliscomenobacteraceae. These collectively contain 17 genera and 31 species. The current knowledge on Saprospirales diversity is the product of traditional isolation methods, with the inherited limitations of culture-based approaches. This study utilized the extensive information available in public sequence repositories combined with recent analytical tools to evaluate the global evidence-based diversity of the Saprospirales order. Our analysis resulted in 1183 novel molecular families, 15,033 novel molecular genera, and 188 K novel molecular species. Of those, 7 novel families, 464 novel genera, and 1565 species appeared in abundances at ≥0.1%. Saprospirales were detected in various environments, such as saline water, freshwater, soil, various hosts, wastewater treatment plants, and other bioreactors. Overall, saline water was the environment showing the highest prevalence of Saprospirales, with bioreactors and wastewater treatment plants being the environments where they occurred with the highest abundance. Lewinellaceae was the family containing the majority of the most prevalent species detected, while Saprospiraceae was the family with the majority of the most abundant species found. This analysis should prime researchers to further explore, in a more targeted way, the Saprospirales proportion of microbial dark matter.

1. Introduction

In the last two decades, numerous studies have reported the presence of bacteria belonging to the order of Saprospirales in various artificial and natural ecosystems. Bacteria belonging to Saprospirales can be found in natural ecosystems such as marine and freshwater environments, and soils [1,2,3,4,5,6,7,8,9,10,11,12,13,14,15,16,17,18,19,20,21,22]. Furthermore, several studies have reported that Saprospirales members can be found in wastewater treatment plants, and especially in activated sludge and anaerobic ammonium oxidation reactors [23,24,25,26,27,28,29,30,31,32,33,34,35]. Regarding the latter, hydrolysis of proteins, denitrification, aromatic compound degradation, and organic matter decomposition are confirmed capabilities of certain bacteria belonging to the order Saprospirales [30,32,33,34,35,36,37].
The order Saprospirales belongs to the class of Saprospiria and comprises three families: Saprospiraceae, Lewinellaceae, and Haliscomenobacteraceae [38]. Both Lewinellaceae and Haliscomenobacteraceae comprise three genera: Flavilitoribacter, Neolewinella, and Lewinella; and Haliscomenobacter, Phaeodactylibacter, and Portibacter, respectively [3,6,7,8,9,10,11,15,17,22,24,38,39,40]. On the other hand, Saprospiraceae comprises four valid published genera: Aureispira, Membranihabitans, Rubidimonas, and Saprospira, and seven candidate genera: Candidatus Aquirestis, Candidatus Epiflobacter, Candidatus Brachybacter, Candidatus Opimibacter, Candidatus Parvibacillus, Candidatus Defluviibacterium, and Candidatus Vicinibacter [12,13,14,16,20,21,23,26,41,42]. As far as the classified species are concerned, the genus of Flavilitoribacter contains Flavilitoribacter nigricans, the genus of Lewinella contains Lewinella cohaerens, and Neolewinella contains twelve species: Neolewinella agarilytica, Neolewinella antarctica, Neolewinella aquimaris, Neolewinella aurantiaca, Neolewinella lacunae, Neolewinella litorea, Neolewinella lutea, Neolewinella marina, Neolewinella maritima, Neolewinella persica, and Neolewinella xylanilytica [3,6,7,8,9,10,11,38,39,40,43]. Portibacter contains Portibacter lacus and Portibacter marinus, Haliscomenobacter contains Candidatus Haliscomenobacter calcifugiens and Haliscomenobacter hydrossis, and Phaeodactylibacter contains Phaeodactylibacter luteus and Phaeodactylibacter xiamenensis [12,15,17,22,24,40]. Regarding the genera belonging to the family of Saprospiraceae, Aureispira contains two classified species: Aureispira marina and Aureispira maritima [13,14]. Each of the genera Membranihabitans, Rubidimonas and Saprospira contain one classified species: Membranihabitans marinus, Rubidimonas crustatorum, and Saprospira grandis, respectively [16,21,41,42]. The genus of Candidatus Aquirestis contains Candidatus Aquirestis calciphila, while the genus of Candidatus Epifloribacter does not contain any classified species [12,23]. Finally, Candidatus Brachybacter algidus, Candidatus Opimibacter skivensis, Candidatus Opimibacter iunctus, Candidatus Parvibacillus calidus, Candidatus Defluviibacterium haderslevense, Candidatus Vicinibacter proximus and Candidatus Vicinibacter affinis were proposed by Kondrotaite et al. [26].
The diversity of Saprospirales has been described using traditional isolation methods. As with most microbial taxa, it is expected that a higher number of undescribed species exist within Saprospirales that are simply uncultivable with our current protocols. In recent decades, the advances in next-generation sequencing have led to the production of vast numbers of sequences that have accumulated in public repositories. In total, this integrated information represents a thorough global sampling effort. Databases, such as IMNGS, contain 16S rRNA microbial profiles from more than 500,000 pre-processed samples across the globe. In this study, the extensive information provided by public repositories was combined with recent analytical tools to evaluate the global diversity of the microbial order Saprospirales. The predicted novel sequence types, combined with environmental origin metadata, allowed for the first global assessment of the ecology and diversity of the order in question.

2. Materials and Methods

To create the initial dataset of sequences associated with the order of Saprospirales, we executed taxonomy and similarity queries in the IMNGS and SILVA databases [44,45]. As both of the aforementioned databases are not up to date with the recent splitting of the Saprospirales order, the search term was limited to “Saprospiraceae”. Regarding the taxonomy query, sequences classified as the family of interest were extracted from SILVA. These sequences were also used as the input in IMNGS for the similarity query. The gathered sequences (n = 988 K) were dereplicated, and then aligned and reclassified using SINA (v.1.7.2) with SILVA SSU database (v.138) [46]. Reclassification took place to update the taxonomy information to retain the sequences belonging to the Saprospirales order. Following this, the novel tool “taxonomy informed clustering” (TIC) [47] was used to process the sequencing data. TIC is a new clustering algorithm that first procedurally divides taxonomically annotated sequences into bins of the same taxonomy down to the genus level. Then, it performs incremental clustering using the sequences confined within the same taxonomy level to avoid contamination of the clusters with sequences with clearly different phylogenetic origin but otherwise overall sequence similarity above the set cut-off levels.
Since different studies use different sequencing technologies or different primers, the resulting 16S rRNA gene fragments do not always overlap. To identify the most represented region of the 16S rRNA gene in our dataset, we calculated the representation of each position in the SINA multiple sequence alignment as the sum of all bases in that position. After identification of the most represented region, all sequences were trimmed around these positions. The sequences with more than 80% of the number of bases that aligned with those Escherichia coli would have in this region were selected for further analysis. All sequences that did not cover or partially covered that region were removed.
The 16S reference sequences of 24 known Saprospirales species were obtained directly from the NCBI and the SILVA databases. For the 7 remaining described species, their 16S rRNA gene sequence was extracted from their respective genomes using BLAST, with the 16S reference sequence of Aureispira Maritima as a query. Finally, the 31 reference 16S sequences were aligned and trimmed around the selected SINA positions.
Traditionally, the cut-offs of 97%, 95%, and 90% 16S rRNA gene similarity are used to denote sufficient evolutionary divergence for the classification of distinct species, genera, and families respectively. Nevertheless, smaller regions of the 16S rRNA gene do not always mirror the evolutionary information captured by the whole gene. Adjusting similarity cut-offs for selected regions is important to avoid over or underestimation of diversity. For the selected region of the 16S rRNA gene, we evaluated the corresponding similarity cut-offs to be used for clustering of species, genera, and families, based on the actual sequence distances among all known Saprospirales species. We found that the existing known species, when compared over the selected region, showed 96% similarity among species of the same genus, 92% similarity among species across genera of the same family, and 90% similarity among species belonging to different families, on average. Those values were used as clustering cut-offs in TIC for determining the diversity of molecular species (sOTUs), molecular genera (gOTUs), and molecular families (fOTUs), respectively.
For the ecological analysis, the metadata for each sequence in our dataset, available in the IMNGS database, was used. We extracted information from IMNGS related to the environment where each molecular species (sOTU) was detected (prevalence), as well as their abundances in each of those samples. The ecological analysis was focused on the sOTUs with an abundance of ≥0.1% in at least one sample. Samples with unclear origins were manually determined by following their sequence read archive (SRA) accession numbers in SRA site (https://www.ncbi.nlm.nih.gov/sra, Accessed during January 2023). Manually assembled systems, such as laboratory-cultivated photosynthetic mats and biofilms on polymer material surfaces, were removed from the ecological analysis. We considered only the samples derived from natural environments as well as artificial environments such as wastewater treatment plants. Briefly, the natural environments in which the Saprospirales species were detected were saline water, saline water sediments, and beach sand (hereafter referred to as “saline water”), freshwater and freshwater sediments (referred to as “freshwater”), soil, air, terrestrial flora and fauna (referred as “plant” and “host”, respectively), as well as saline water flora and fauna (referred as “plant saline water” and “host saline water”, respectively). In addition, Saprospirales species were detected in samples derived from wastewater treatment plants, bioreactors, activated sludges, and fermentation processes (referred to as a “bioreactor”).
Finally, known species were assigned to formed sOTUs when BLAST similarity was above 98%. Some species were not distinguishable in the selected region as they were assigned to the same sOTU. In the text, those undistinguishable sOTUs carry both the names of the closest known species, i.e., Neolewinella marina/litorea, Neolewinella persica/agarilytica, Portibacter lacus/marinus, and Vicinibacter affinis/proximus.
The general workflow that was followed (Figure 1) can be easily adapted to other taxonomic groups of interest, simplifying future microbial diversity studies.

3. Results

3.1. Processing Results

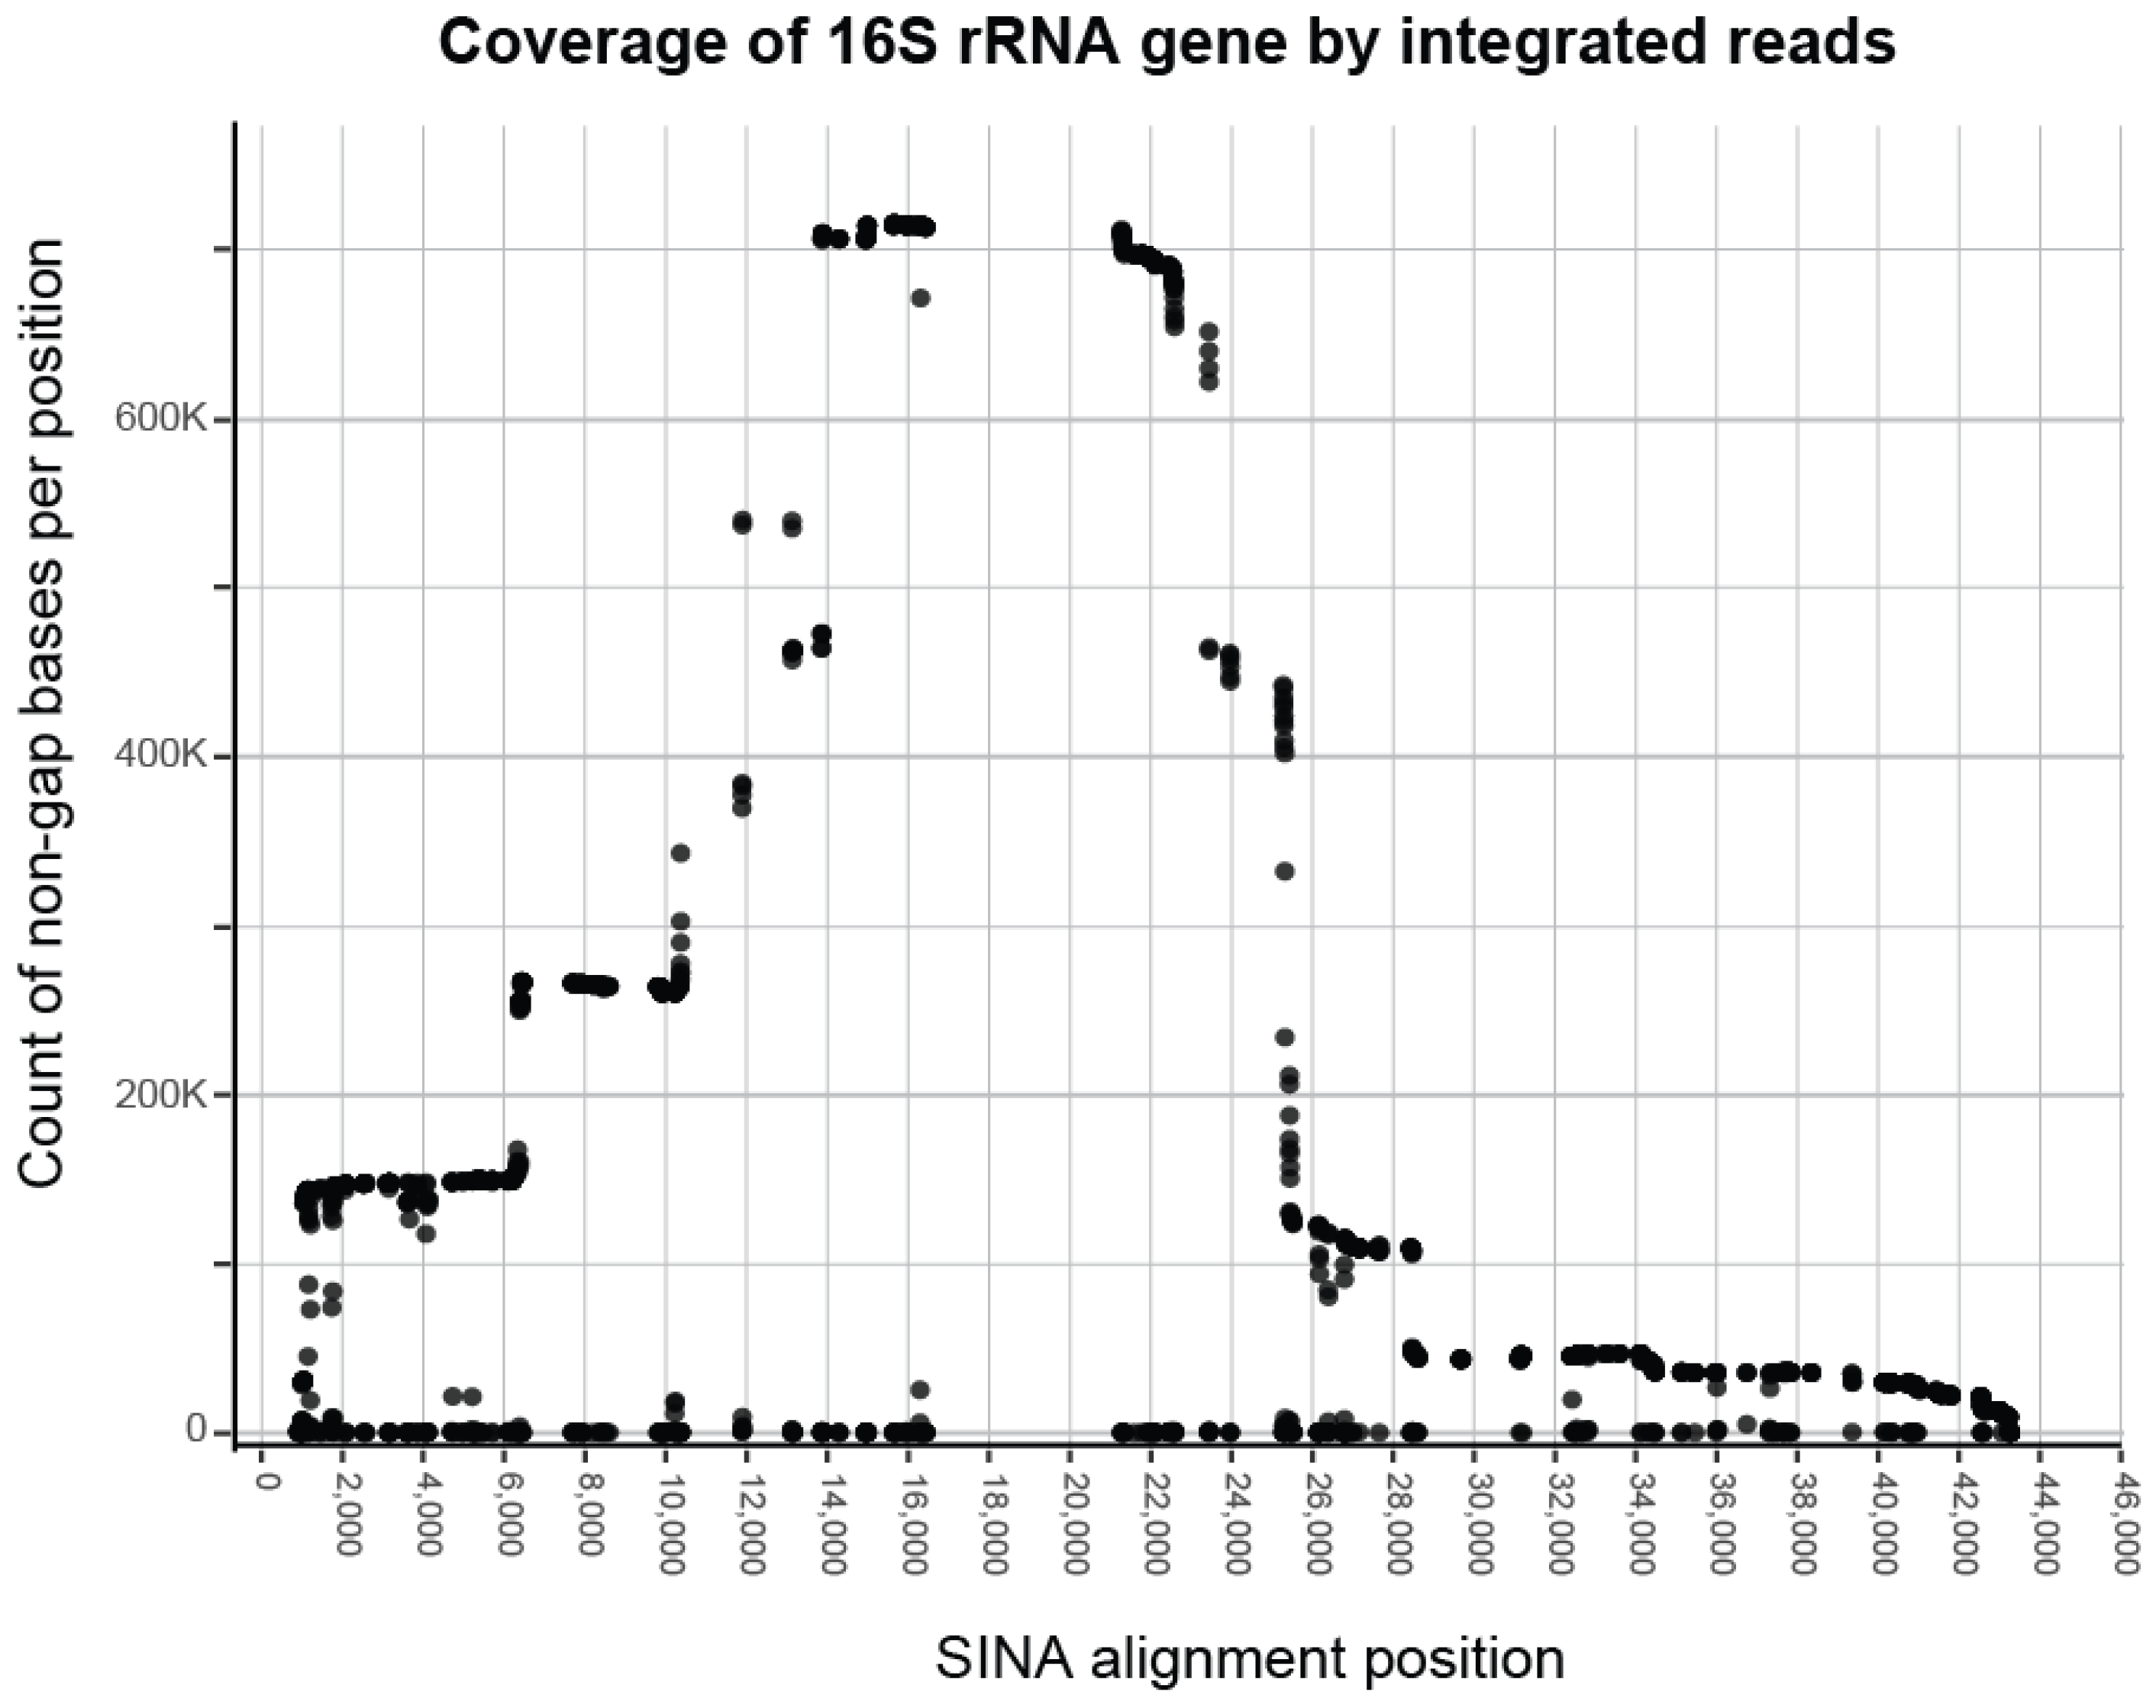
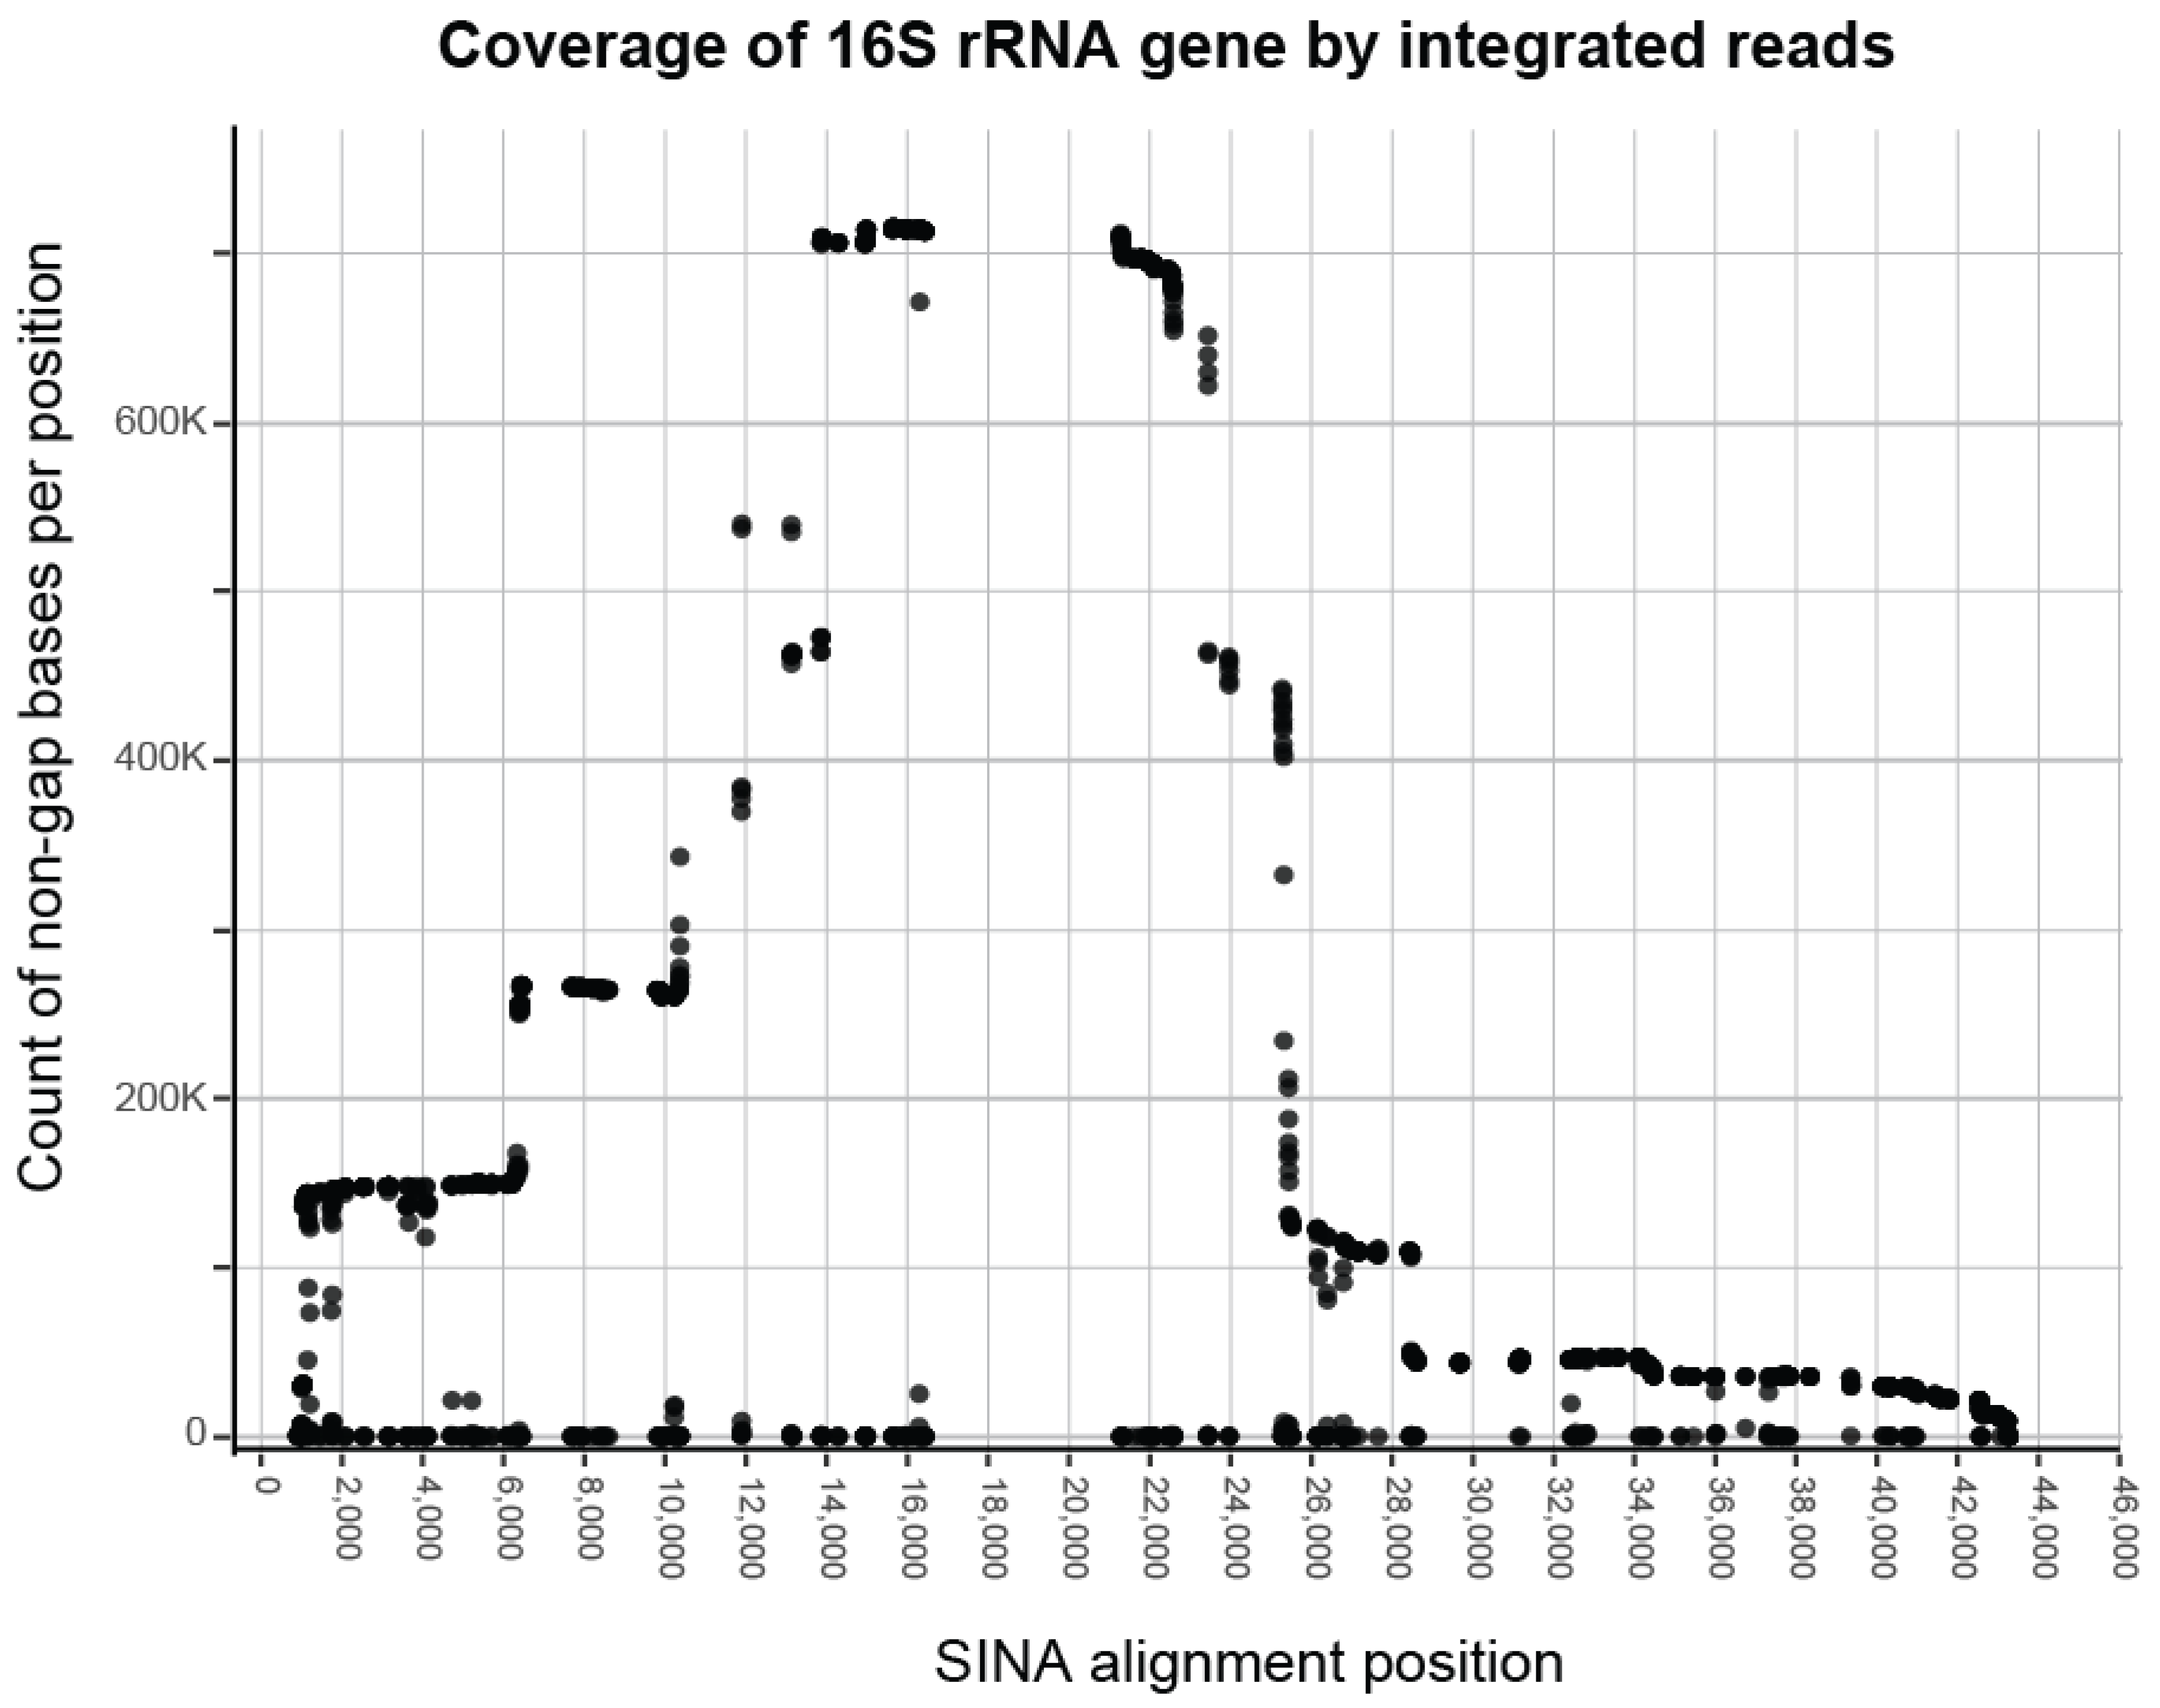
The evaluation of the most represented region of 16S rRNA gene sequences in our Saprospirales dataset pointed to a region spanning the 10 K to 25.5 K positions of the complete SINA alignment (Figure 2). Our estimation of expected bases across this region, using the SINA-aligned 16S rRNA gene of E. coli, was 282 bases. Following our requirement for an 80% minimum coverage over this region, we exclude every sequence that had less than 229 bases around our selected positions. After eliminating sequences targeting different regions, our final dataset was limited to 691 K, from 988 K sequences initially.
The incremental taxonomy bounded clustering of the final sequencing data with TIC resulted in 118 K novel molecular species (sOTUs), 9 K molecular genera (gOTUs), and 1269 families (fOTUs) (A FASTA formatted file “Saprospirales_diversity.zip” with all the sOTUs and their assigned taxonomy is available in the Supplementary Materials). Characterization of species, genera, and families, when referring to the results of our analysis, should always be considered as short forms of “clusters of sequences with similarities over the selected region equivalent to the corresponding taxonomic level”. Therefore, our sOTUs, gOTUs, and fOTUs are not equivalent to official taxonomies. The sequences clustered in one sOTU at 96% similarity could belong to multiple biological species. This means that our method tended to underestimate the diversity compared to how common practices (ANI, phylogeny, function) would determine how the diversity of biological species is assigned to all isolates carrying the variants of the 16S rRNA gene in a dataset.

3.2. Analysis of Results

There were 204 K samples, out of 500 K pre-processed samples in the IMNGS database, that covered our selected region of interest. Within those, Saprospirales were found in almost 13% of IMNGS samples (Figure 3). Specifically, 48% of freshwater samples, 33% of saline water samples, 26% of plant samples, 22% of soil-derived samples, and 1% of samples were found to be positive, originating from hosts (terrestrial fauna). Furthermore, it was found that the 13% of samples marked as “other” were positive, which included samples derived from different environments such as wastewater treatment plants, bioreactors, activated sludges, fermentation processes, air, and saline water flora and fauna.
Regarding the predicted number of molecular families, genera, and species belonging to the order of Saprospirales, a small percentage of species appeared in abundance at ≥0.1% (Table 1). Only nine families had species with an abundances of ≥0.1%, including the three known families, meaning that only the 0.71% of the predicted families had at least one species with an abundance of ≥0.1%. Similarly, 479 genera (3.18% of the predicted genera) had at least one species with an abundance of ≥0.1%, including all known genera except for Rubidimonas and Saprospira. Overall, 1565 species (1.33% of the predicted species) presented an abundance of ≥0.1%.
To be more specific, and considering only sOTUs with an abundance of ≥0.1%, they were distributed in 132 genera belonging to Saprospiraceae, including 9 out of 11 known genera in the family; in 186 genera belonging to Lewinellaceae; and 150 genera to Haliscomenobacteraceae, including all known genera to both families (Table 2). The remaining seven unknown families had 1 to 4 genera, resulting in 11 genera with a species abundance of ≥0.1%. Overall, regardless of the species abundance, most of the predicted genera were classified as Lewinellaceae.
Regardless of species abundance, almost all predicted species were classified to known families (Table 3). Specifically, 98% of the predicted species and 99% of species with abundances of ≥0.1% were classified as the three known families. Concerning these two groups, most of the species classified to Saprospiraceae belonged to known genera (53% and 56% with a ≥0.1% species abundance, respectively), while most of the species classified to Lewinellaceae and to Haliscomenobacteraceae belonged to unknown genera (56% and 59% with ≥0.1% species abundance, and 80% and 68% with ≥0.1% species abundance, respectively) (Table 3 and Table 4).
In particular, almost 82% of the unknown families had only one species, while 0.17% of the unknown families had more than 51 species classified to each of them (Figure 4). Furthermore, almost 17% of the unknown families had 2 to 10 species, while the rest had 11 to 50 species. On the other hand, all unknown families with a species abundance of ≥0.1% had less than 10 species. To be more specific, these seven unknown families had one to six species each. Five families had one species, one family had two species and the last unknown family had six species classified to it. Moreover, the aforementioned family had five genera, while the rest of these families had only one. Regarding the known families, the majority of the unknown genera within the three known families had 2 to 10 species each, regardless of their abundance (Figure 4). The latter also applies to the known genera of these families, except for Saprospiraceae species with an abundance of ≥0.1%. In this case, most of the known genera had either 2 to 10 species or at least 51 species.
Regarding the environmental distribution of Saprospirales families, saline water was the environment where most species were present and had their maximum abundance (Figure 5). Briefly, for Haliscomenobacteraceae the descending order of environments according to species prevalence was saline water > host saline water > freshwater > bioreactor > plant saline water > soil > air > host. Similarly, for Lewinellaceae the corresponding descending order was saline water > bioreactor > host saline water > freshwater > soil > plant saline water > air = host, and for Saprospiraceae, it was saline water > bioreactor > freshwater > soil > host saline water > host > plant saline water. As far as the environments with the maximum species abundance for each known family are concerned, the respective descending orders were: for Haliscomenobacteraceae, saline water > host saline water > freshwater > bioreactor > plant saline water > soil > air > host > plant, for Lewinellaceae, saline water > bioreactor > freshwater > host saline water > soil > plant saline water > host > air = plant, and for Saprospiraceae, saline water > bioreactor > freshwater > soil > host saline water > plant saline water > host > plant. Collectively, concerning the unknown families (7 families containing 11 species), the descending order of environments according to species prevalence and maximum abundance was saline water > plant saline water > soil > host saline water = host.
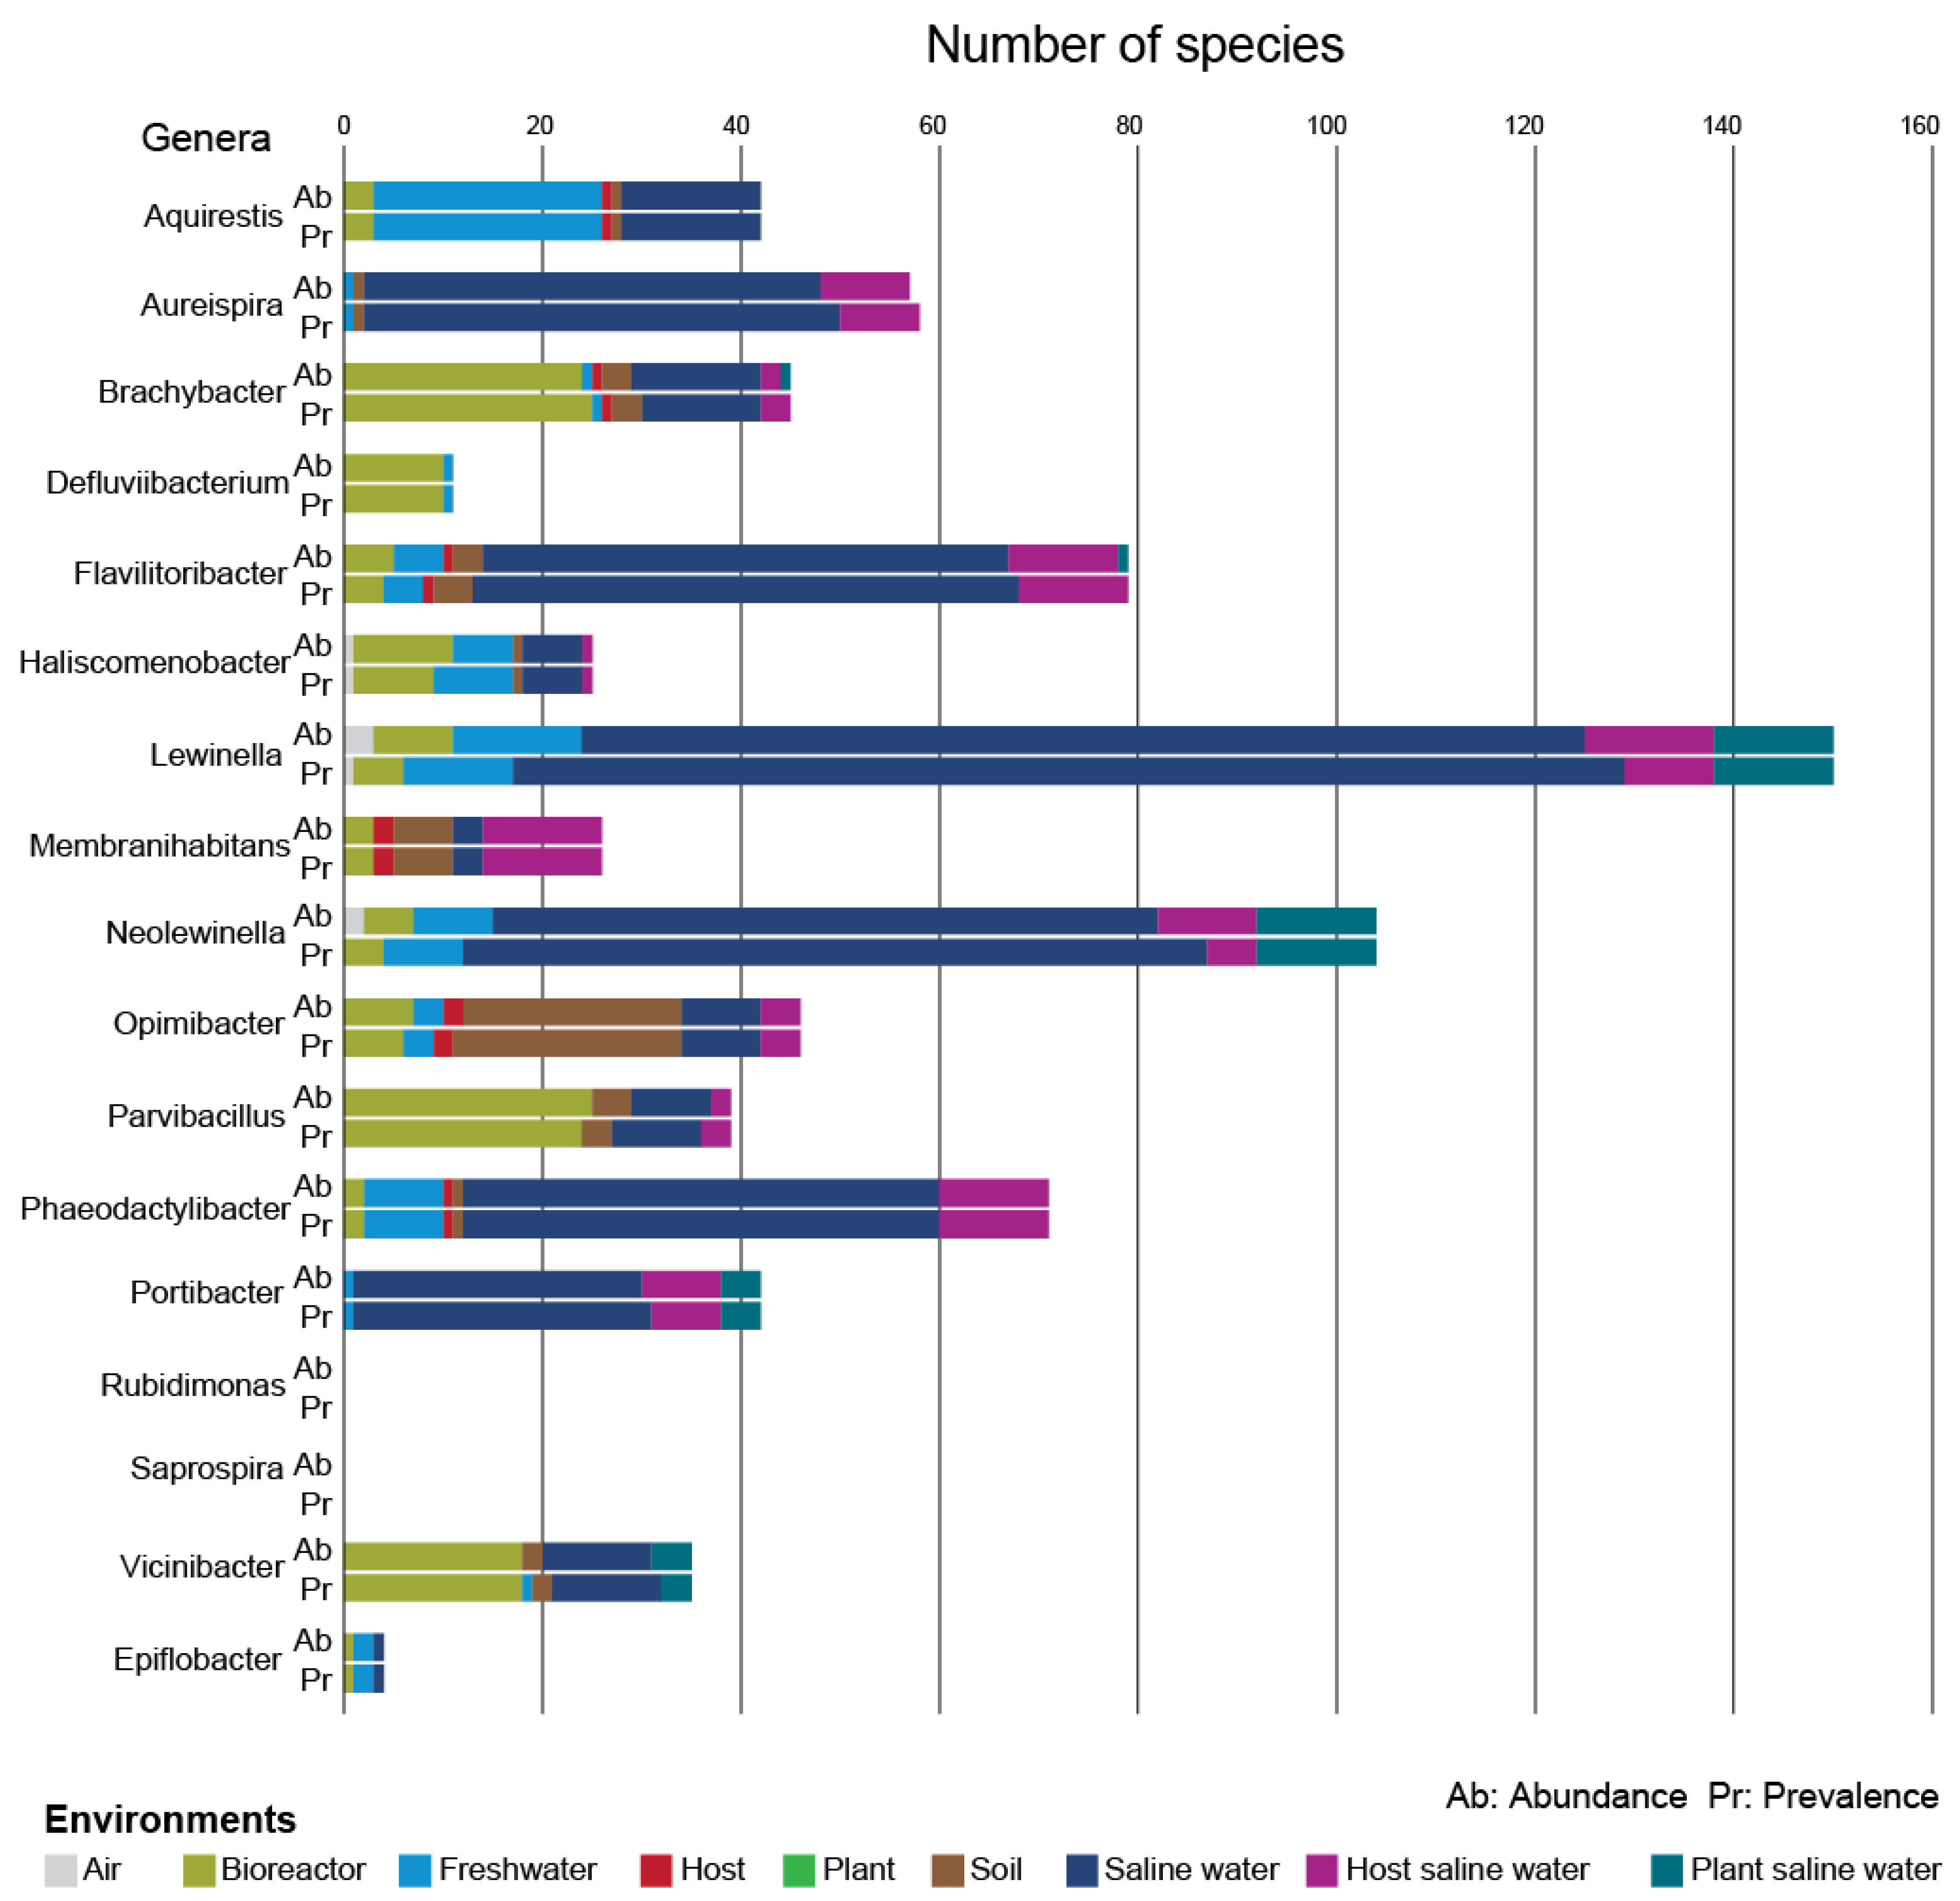
As far as the known genera are concerned, the most prevalent environments, as well as the maximum abundance environments with the greatest number of species, were found to be different for each genus (Figure 6). It is noted that the number of species belonging to the known genera and with abundances of ≥0.1% was 681 (Table 3). For Aquirestis, the descending order of environments according to the number of species detected in each environment was freshwater > saline water > bioreactor > soil = host. For Aureispira, the corresponding descending order was saline water > host saline water > soil = freshwater. For Brachybacter, the descending order according to species maximum abundance environment was bioreactor > saline water > soil > host saline water > freshwater = host = plant saline water, while the corresponding descending order according to species prevalence was almost the same, i.e., bioreactor > saline water > soil > host saline water > freshwater = host. For Defluviibacterium, the respective order was bioreactor > freshwater. For Membranihabitans, the descending order of environments was host saline water > soil > saline water = bioreactor > host. For Epiflobacter, the order was freshwater > saline water = bioreactor, whilst for Opimibacter, the order was soil > saline water > bioreactor > host saline water > freshwater > host. Concluding for Saprospiraceae, for Vicinibacter species, the descending order of environments according to their prevalence was bioreactor > saline water > plant saline water > soil > freshwater, whilst for maximum abundance environments, the corresponding order was almost the same, i.e., bioreactor > saline water > plant saline water > soil. Regarding the family of Lewinellaceae, for Lewinella species, the descending order of environments according to their maximum abundance was saline water > freshwater = host saline water > plant saline water > bioreactor > air, while according to their prevalence, the order was saline water > plant saline water > freshwater > host saline water > bioreactor > air. For Neolewinella, the descending order of environments regarding species prevalence was saline water > plant saline water > freshwater > host saline water > bioreactor, while for maximum abundance environments, the corresponding order was saline water > plant saline water > host saline water > freshwater > bioreactor > air. Similarly, for Flavilitoribacter, the orders of environments were saline water > host saline water > bioreactor = freshwater = soil > host, and saline water > host saline water > bioreactor = freshwater > soil > host. Regarding the family of Haliscomenobacteraceae, for Haliscomenobacter species, the descending order of environments according to their prevalence was bioreactor = freshwater > saline water > host saline water = soil = air, while according to their maximum abundance, the order was bioreactor > freshwater = saline water > host saline water = soil = air. For Phaeodactylibacter, the corresponding descending order of environments was saline water > host saline water > freshwater > bioreactor > soil = host. Finally, for Portibacter, the order of environments was saline water > host saline water > plant saline water > freshwater.
As far as the unknown genera are concerned, regardless of their classification in terms of families, saline water was the environment where most species of these genera were present and had their maximum abundance (Figure 7). It is noted that, for species abundance of ≥0.1%, the total number of unknown genera belonging to the three known families, as well as to the unknown families, was 462; the species belonging to them were 884 (Table 2 and Table 3). To be more specific regarding their environmental distribution, 53.24% of the species belonging to these unknown genera were found in saline water, and 51.33% of the species had their maximum abundance in samples derived from saline water. On the other hand, the remaining environments appeared in smaller percentages, i.e., freshwater, 12.27% and 12.17%; bioreactor, 12.73% and 13.33%; saline water hosts, 11.11% and 12.05%; soil, 6.02% and 5.91%; saline water plants, 3.47% and 3.71%; air, 0.58%; and terrestrial hosts, 0.58% and 0.70%, respectively. Furthermore, 0.23% of species had their maximum abundance in samples derived from plants.
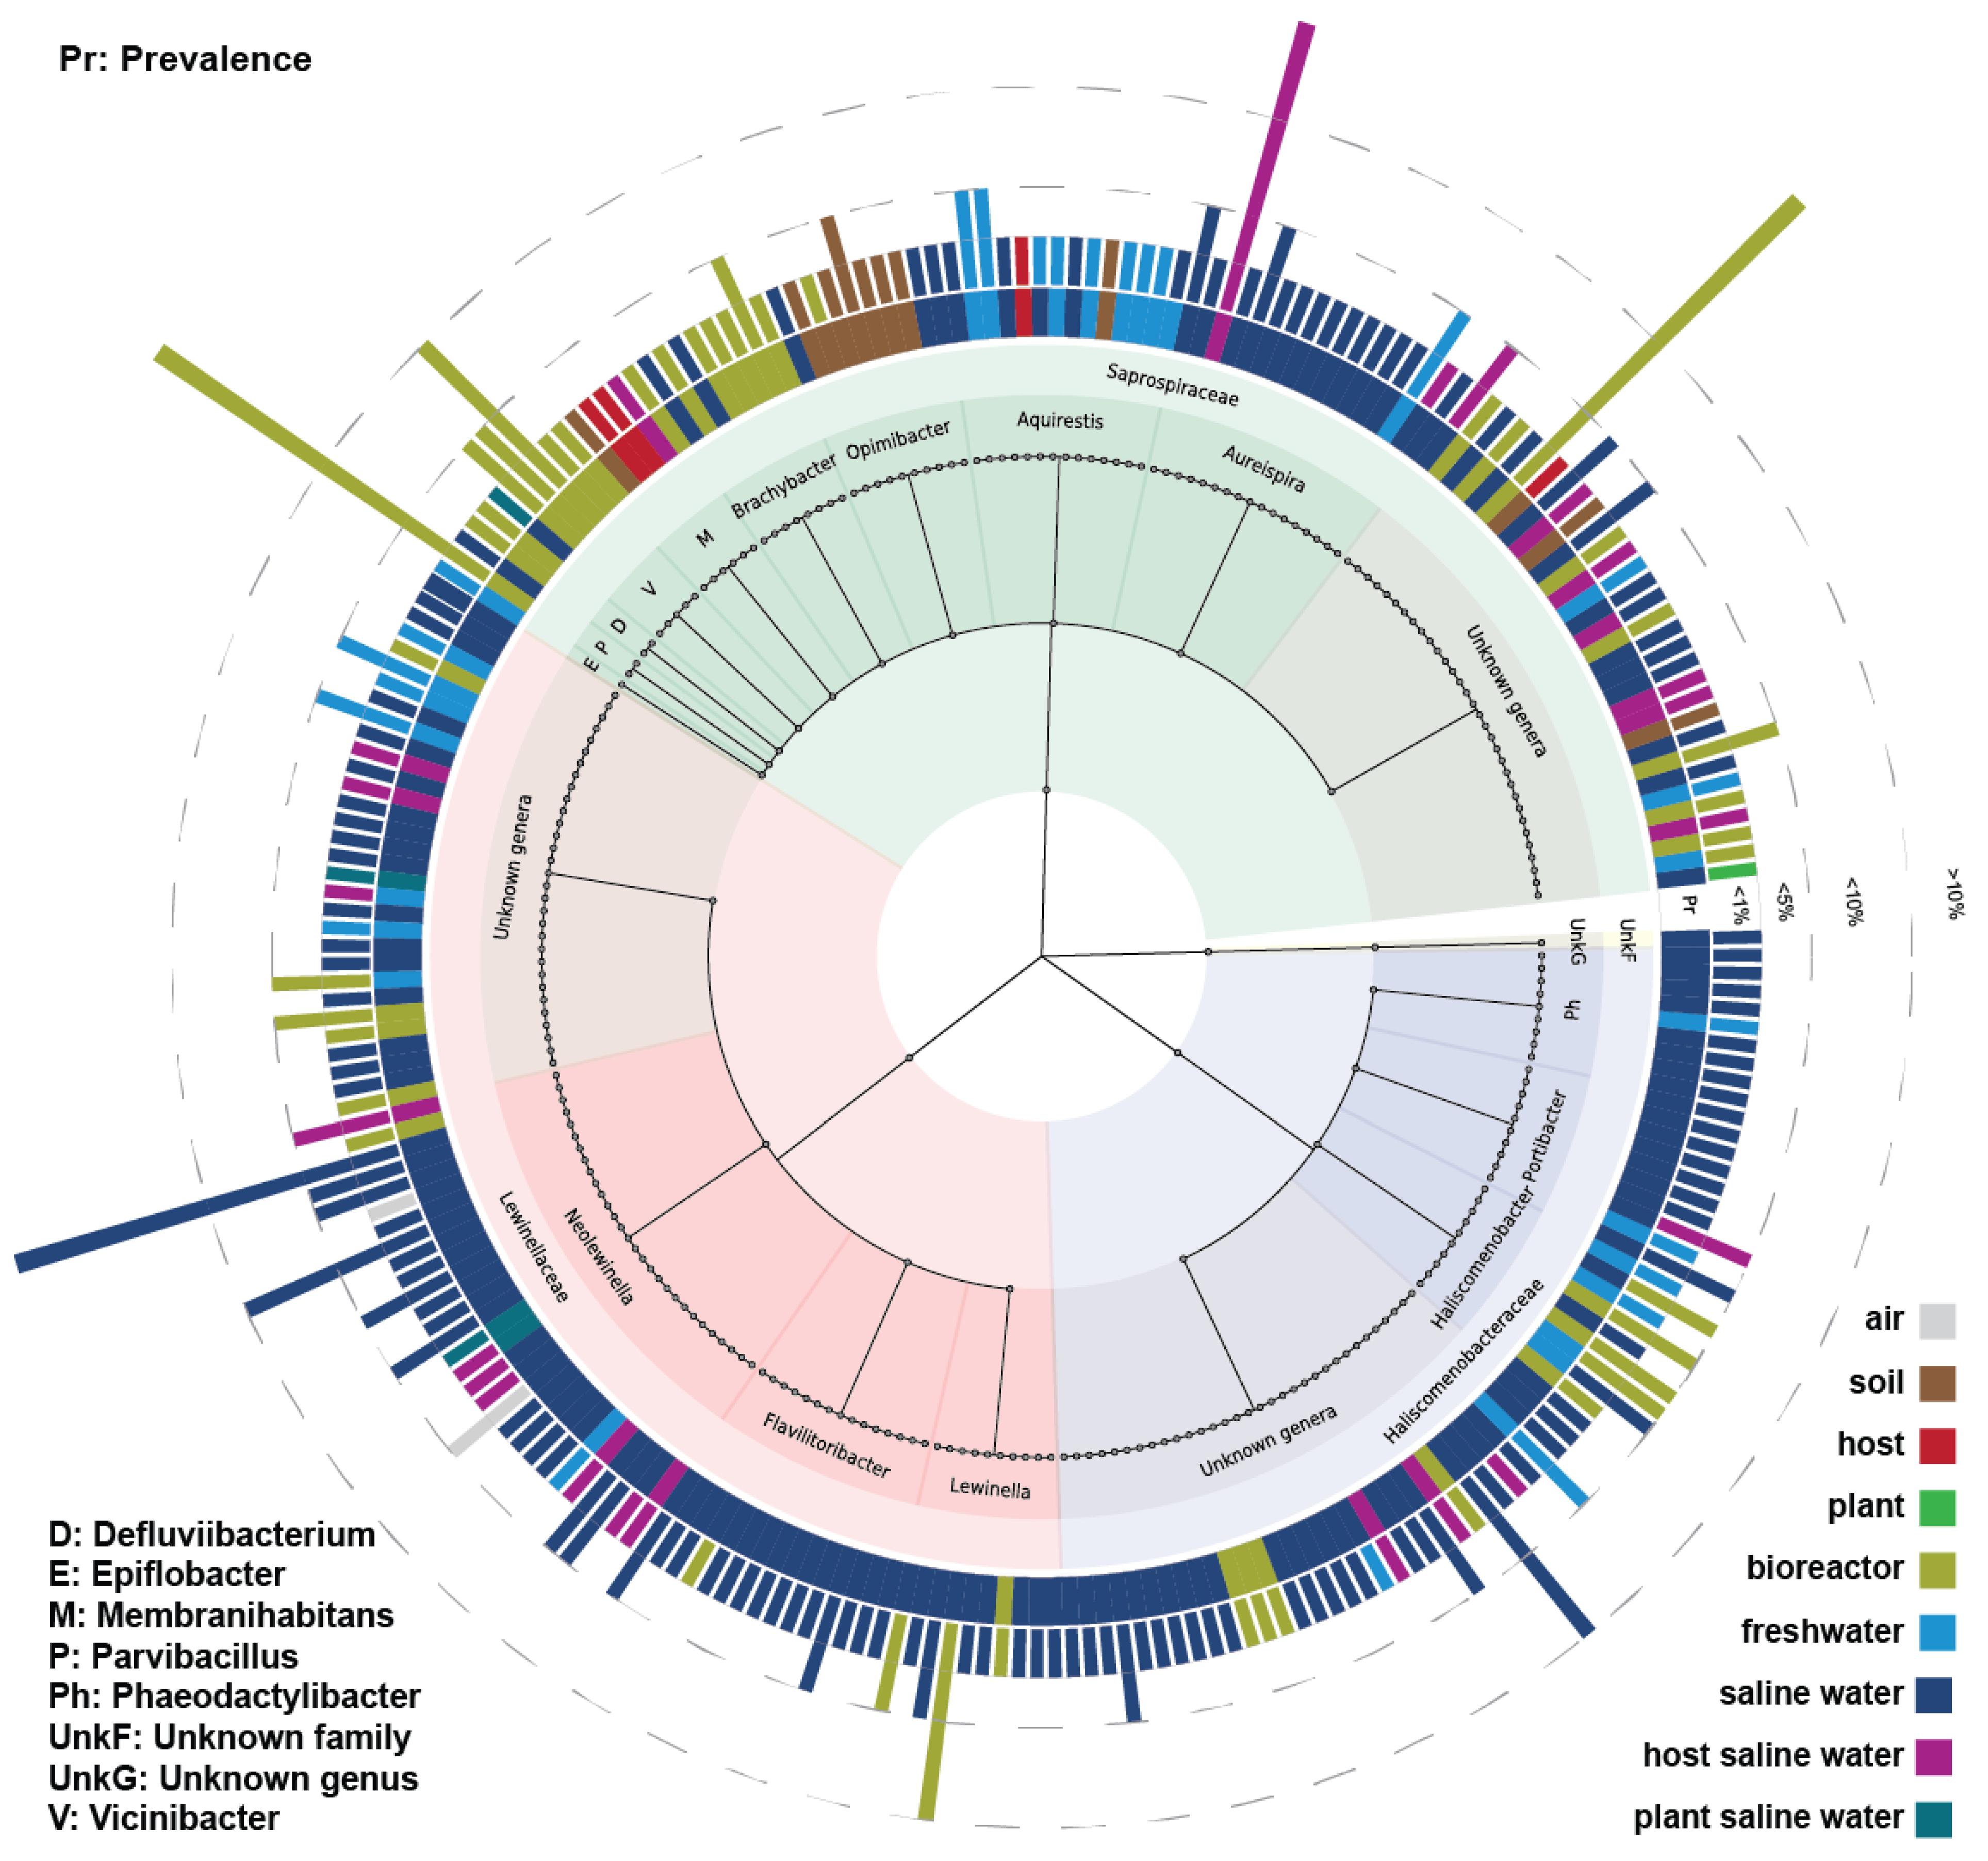
Cosmopolitan species, i.e., species that appeared at least in 50 samples, constituted almost 16% of species with an abundance of ≥0.1%, i.e., 244 species out of 1565 species. Most of the cosmopolitan species showed maximum abundances between 0.1% and 1%, while fewer cosmopolitan species showed maximum abundances between 1% and 5%, and even fewer species showed maximum abundances above 5% (Figure 8). Specifically, eight species showed maximum abundances above 5%, four of which had abundances above 10%. As mentioned previously, saline water was both the most prevalent environment and the environment where the majority of species had their maximum abundance, followed by environments related to bioreactors and freshwater. Further analysing the cosmopolitan species, almost all species belonged to known families, except one species that belonged to an unknown family. Furthermore, 97 species belonged to Saprospiraceae, 32 of which belonged to unknown genera; 85 species belonged to Lewinellaceae, 31 of which belonged to unknown genera; and 61 species belonged to Haliscomenobacteraceae, 32 of which belonged to unknown genera.
The known genera that correspond to these cosmopolitan species showed environmental preferences, unlike unknown genera that had species detected in a variety of environments (Figure 8). Specifically, Aureispira showed an environmental preference for saline water; Aquirestis showed an environmental preference for freshwater; Opimibacter, for soil; Brachybacter and Vicinibacter, for bioreactor-related environments; and Membranihabitans, for terrestrial hosts. Defluviibacterium had few cosmopolitan species, and almost all of them were detected in bioreactors and wastewater treatment plants. In addition, Epiflobacter was detected solely in freshwater. Parvibacillus was equally detected in saline water and bioreactor-related environments. On the other hand, unknown genera belonging to Saprospiraceae could be found in saline water, soil, freshwater, hosts, bioreactors, and wastewater treatment plants. Regarding the Lewinellaceae family, Neolewinella, Lewinella, and Flavilitoribacter showed environmental specificity in saline water, while unknown genera could be found in saline water, freshwater, bioreactors, and wastewater treatment plants. Regarding Haliscomenobacteraceae, both Portibacter and Phaeodactylibacter showed an environmental preference for saline water, while Haliscomenobacter was found in freshwater, bioreactors, and wastewater treatment plants. Haliscomenobacteraceae unknown genera could be detected in saline water, freshwater, bioreactors, and wastewater treatment plants. Finally, the one species that belonged to the unknown family was found in freshwater.
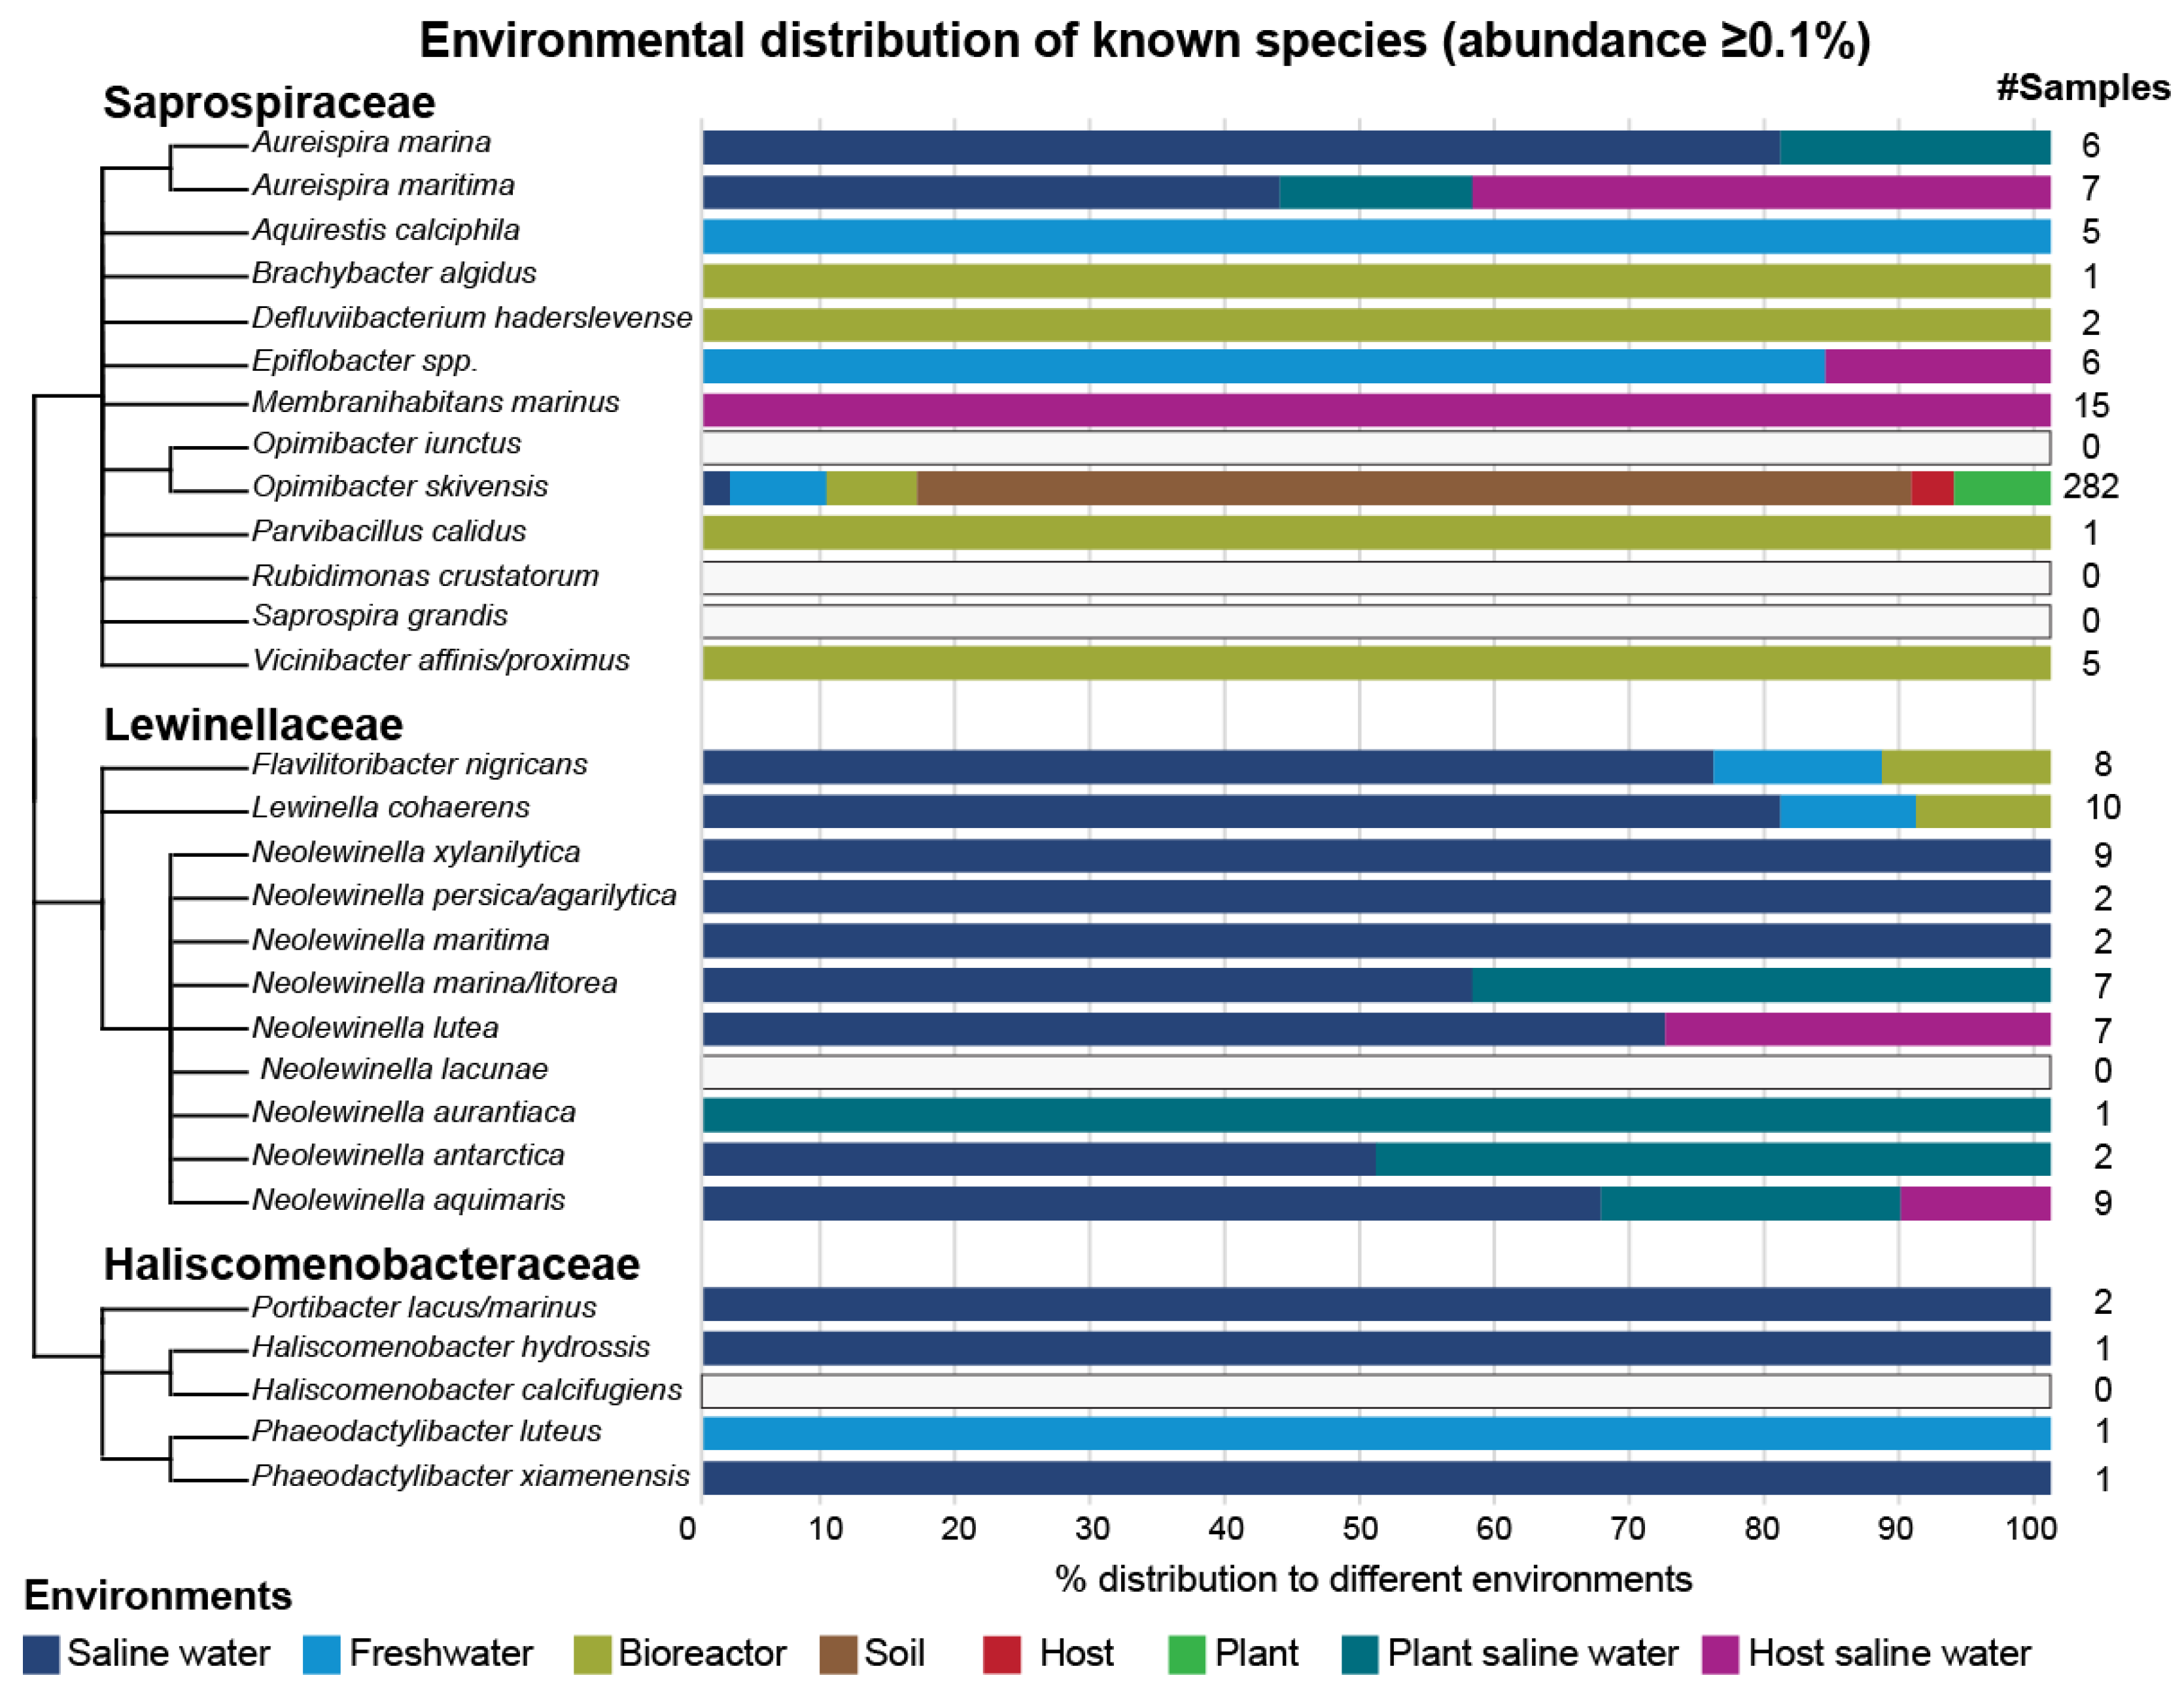
Twenty-eight known species were represented by twenty-four sOTUs clusters (Table 5). After further analysing these known species, the number of positive samples with a species abundance of ≥0.1% ranged from 1 to 282 samples; in addition, their maximum abundances ranged from 0.11% to 4.84%. Saline water was the most prevalent environment, as well as the environment where most of these species had their maximum abundance. (Table 5 and Figure 9). In general, Brachybacter algidus, Defluviibacterium haderslevense, Parvibacillus calidus, and Vicinibacter affinis/Proximus, all of which belong to the family of Saprospiraceae, were found in samples that originated from wastewater treatment plants and bioreactors. Aureispira marina, Aureispira maritima, and Membranihabitans marinus were found in saline-water-related environments, while Aquirestis calciphila was found exclusively in freshwater samples. Species belonging to the genus of Epiflobacter were found in freshwater and saline water hosts. In contrast, Opimibacter skivensis was found in all detected environments, i.e., soil, freshwater, bioreactors, plants, and saline water. Lewinella cohaerens and Flavilitoribacter nigricans appeared in a variety of unrelated environments, unlike the rest of the Lewinellaceae species, which were found only in saline-water-related environments. In particular, both Lewinella cohaerens and Flavilitoribacter nigricans were found in samples related to bioreactors, and activated sludge, freshwater, and saline water. Both species were more prevalent in samples originating from saline water and had their maximum abundance in samples from a nitrifying bioreactor and activated sludge, respectively. On the other hand, all known Haliscomenobacteraceae species appeared either in saline water (Portibacter lacus/marinus, Haliscomenobacter hydrossis and Phaeodactylibacter xiamenensis) or in freshwater (Phaeodactylibacter luteus). Opimibacter iunctus, Rubidimonas crustatorum, Saprospira grandis, Haliscomenobacter calcifugiens, and Neolewinella lacunae were not detected above a 0.1% abundance in any sample, therefore they lacked environmental distribution.
The prevalence of known species was not uniform across the environments, indicating varying levels of niche specificity. For example, Aquirestis calciphila and Vicinibacter affinis/proximus appeared in five samples, all of which were derived from freshwater, and bioreactor and wastewater treatment processes, respectively. Aureispira marina and Aureispira maritima were found in six and seven samples, respectively, originating from saline-water-related environments, specifically saline water, and saline water flora and fauna. Epiflobacter species were found in six samples, the majority of which originated from freshwater-related environments. In addition, Membranihabitans marinus appeared in fifteen samples derived from saline water hosts. Further, Opimibacter skivensis was detected mainly in soil (211 out of 282 samples). It was also found in bioreactors, plants, freshwater, and saline water. Also, Neolewinella xylanilytica, Neolewinella aquimaris, Neolewinella marina/litorea, and Neolewinella lutea appeared in seven to nine samples, all of which were derived from saline-water-related environments. Lewinella cohaerens and Flavilitoribacter nigricans were found in ten and eight samples, respectively, the majority of which were derived from saline water.
Opimibacter skivensis was also the most prevalent species in this study, as it appeared in 3066 samples, 282 of which had abundances of ≥0.1% (Table 6). Moreover, almost 75% of samples were derived from the soil. Opimibacter skivensis appeared to be low in abundance, as its maximum abundance was 1.53%. Flavilitoribacter nigricans and Neolewinella aquimaris were also among the top 20 most prevalent species, which appeared in 315 samples (8 samples with ≥0.1% species abundance) and 256 samples (9 samples with ≥0.1% species abundance), respectively. The dominant environment for both species was saline water. On the other hand, Flavilitoribacter nigricans was found to be most abundant in bioreactor processes, while Neolewinella aquimaris was most abundant in saline water. Unlike Opimibacter skivensis, both Flavilitoribacter nigricans and Neolewinella aquimaris had low maximum abundances, specifically 0.22% and 0.33%, respectively. Overall, for the top 20 most prevalent species, the most prevalent environment, and the environment where most species had their maximum abundance was saline water (Table 6).
Unlike the top 20 most prevalent species, all of the top 20 most abundant species remained unidentified (Table 7). Species abundance ranged from 5.89% to 28.02%. In addition, the most prevalent environments were saline water and bioreactor processes, while the environment where most species had their maximum abundance detected was in samples derived from bioreactor processes. To sum up, saline water may be the environment with the highest prevalence, but bioreactors and wastewater-treatment-related processes had the most abundance (Table 6 and Table 7). Finally, Lewinellaceae is the family that contained the majority of the most prevalent species (Table 6), while Saprospiraceae is the family that contained the majority of the most abundant species (Table 7).

4. Discussion

Saprospirales can indeed be found in various environments, such as saline water, freshwater, soil, bioreactors, and wastewater treatment plants, as has been already mentioned in various studies [1,2,3,4,5,6,7,8,9,10,11,12,13,14,15,16,17,18,19,20,21,22,23,24,25,26,27,28,29,30,31,32,33,34,35]. In addition, air, plants, as well as terrestrial and saline water hosts are also potential environments for Saprospirales. In this work, we present that saline water was the environment that Saprospirales were most prevalent in, but bioreactors and wastewater treatment plants were the environments in which they were found in the highest abundance. Furthermore, Lewinellaceae is the family that contains the majority of the most prevalent species, while Saprospiraceae is the family that contains the majority of the most abundant species.
Regarding cosmopolitan species, i.e., species that appeared at least in 50 samples, saline water was the environment with the highest prevalence, where the majority of species had their maximum abundance, followed by bioreactor-related environments and freshwater. In general, almost all known genera that belong to Saprospiraceae, Lewinellaceae, and Haliscomenobacteraceae showed environmental preferences that corresponded with already published studies. For instance, Aquirestis showed an environmental preference for freshwater [12]; Aureispira showed an environmental preference for saline water [13,14]; and Brachybacter, Defluviibacterium, and Vicinibacter showed environmental specificity in bioreactors and wastewater treatment plants [26]. Furthermore, Neolewinella, Lewinella, Flavilitoribacter, Portibacter, and Phaeodactylibacter showed environmental specificity in saline water [3,7,8,9,10,11,15,17,22,43]. Haliscomenobacter appeared in saline water, freshwater, bioreactors, and wastewater treatment plants, which agrees with the previous studies that associate this genus with wastewater treatment plants and freshwater environments. [12,24,25]. On the other hand, Membranihabitans showed environmental specificity in terrestrial hosts, which opposes the findings of previous studies; Li et al. [16], and Béziat et al., found Membranihabitans in saline water environments. Opimibacter showed environmental specificity in soil. Parvibacillus appeared equally in saline water and activated sludge, while Kondrotaite et al. [26] related these with the wastewater treatment plants. Finally, Epiflobacter appeared in freshwater, while Xia et al. [23] associated this genus with activated sludge.
Twenty-eight known species were represented by twenty-four sOTUs clusters (≥ 0.1% species abundance). Therefore, not all described species could be detected in this integrated analysis as abundant constituents of microbial communities across the more than 200 K samples tested. If this observation was extended to the 1565 species-level clusters formed that were detected in abundances of ≥0.1%, we could safely and conservatively estimate that the global Saprospirales diversity is at least 2000 species. Concerning the niche assignment of known species, it agrees to a high extent with that of already published studies. Specifically, concerning Saprospiraceae, Aquirestis calciphila was found in freshwater samples [12], and Aureispira marina and Aureispira maritima were found in saline-water-related environments [13,14]. In particular, Aureispira maritima was found to be most prevalent in saline water hosts and most abundant in saline-water-derived samples, while Aureispira marina had both a prevalence and maximum abundance in saline water. Brachybacter algidus, Defluviibacterium haderslevense, Parvibacillus calidus, and Vicinibacter affinis/proximus were found in samples that originated from wastewater treatment plants and bioreactors, as reported by Kondrotaite et al. [26]. Membranihabitans marinus was found in saline water hosts, which was in alignment with the studies of Li et al. [16] and Béziat et al. [49]. On the other hand, Opimibacter skivensis was found in a variety of environments, especially in soil samples. Kondrotaite et al. [26] reported that this species should be found in wastewater treatment plants. Opimibacter skivensis was found in 282 samples with an abundance of ≥0.1%, 211 samples of which were derived from soils, while 18 samples were derived from bioreactor-related and wastewater-treatment-related samples. It was also found in plants, hosts, freshwater, and saline water. Regarding Haliscomenobacteraceae, both Phaeodactylibacter xiamenensis, and Portibacter lacus were found in saline water samples, as already published studies indicate [17,22]. Contrary to the aforementioned information, we detected Phaeodactylibacter luteus in freshwater, while Lei et al. [15] isolated Picochlorum sp. from saline water alga, and Ma et al. [29] found it in wastewater-related environments. Haliscomenobacter hydrossis was detected in saline water environments, while it has been reported that this species is usually found in activated sludge [24,25]. Finally, regarding Lewinellaceae, all species appeared to be most prevalent and most abundant in saline water environments, except Lewinella cohaerens and Flavilitoribacter nigricans. These had maximum abundances in samples from a nitrifying bioreactor and activated sludge, respectively, despite being more prevalent in samples originating from saline water. However, Khan et al. [43] associated both species with marine environments. Unlike the rest of the Lewinellaceae species, both Lewinella cohaerens and Flavilitoribacter nigricans appeared in a variety of unrelated environments, i.e., in samples related to bioreactors and activated sludge, freshwater, and saline water. Regarding the remaining Lewinellaceae species, our results conformed with those of previous studies. Neolewinella persica/agarilytica, Neoewinella antarctica, Neolewinella aquimaris, Neolewinella aurantiaca, Neolewinella lutea, Neolewinella marina/litorea, Neolewinella maritima, and Neolewinella xylanilytica were found in saline water samples and saline-water-related environments, such as saline water sediments, saline water flora and fauna, and beach sand [3,7,8,9,10,11,43]. Concluding the analysis of known species, the number of positive samples (with species abundance of ≥0.1%) ranged from 1 to 282 samples; in addition, their maximum abundance ranged from 0.11% to 4.84% (Table 5).
Although it cannot be determined by incidence data such as in our analysis, the extensive diversity observed in aquatic and especially saline environments could be attributed to dissolved organic carbon (DOC). The amount and complexity of DOC in aquatic systems, if mirrored by diverse metabolic pathways distributed in various microorganisms, could explain some of the remarkable diversity of Saprospirales revealed by our analysis. Ecological reasons, like niche connectivity and increased dispersion through oceanic currents, as well as the role of oceans as the principal terminal reservoir of rainwater, may also play a role. Saprospirales species collected through precipitation across the land are eventually pooled in coastal seas. Currents can then contribute to the dispersal of those species across the connected oceanic bodies. Nevertheless, further investigation is needed to elucidate the observed high diversity and prevalence of Saprospirales in aquatic systems.

5. Conclusions

The introduction of next-generation sequencing allowed for high-throughput microbial profiling of environments of interest, represented, to a large extent, by the targeted sequencing of 16S rRNA gene amplicons. The relative cost efficiency and methodological simplicity led to a geometric increase in studies covering a wide range of environments around the globe. Integrating that wealth of information and reutilizing it as a unified resource for new questions is not only a very powerful approach but is also energy- and cost-effective. It is our duty as a research community to show that we can achieve the most out of the datasets we spend millions to create.
We have applied a similar integrating procedure in the past, although more demanding in execution, to the bacterial phylum Chlamydiota [50]. Over the years, the available datasets grow and novel databases and tools have been introduced that enable a much more streamlined querying of the global sequencing repositories. In this study, we showed that applying the tool TIC [47] over the half a million amplicon datasets in IMNGS [45] can readily give us insights into the diversity and ecological distribution of selected taxonomic groups like the order Saprospirales.
Future efforts should be focused on the targeted isolation of those novel members for their functional characterization and the elucidation of the ecological reasons behind that high diversity. In addition, further automatization of the pipeline used will allow further insights into other important microbial taxa that are still hindered by the limitations of isolation-based characterizations.

Supplementary Materials

The following supporting information can be downloaded at: https://www.mdpi.com/article/10.3390/microorganisms11071767/s1, Saprospirales_diversity.zip.

Author Contributions

Conceptualization, I.L. and R.N.M.; methodology, I.L.; software, A.K. and M.P.; formal analysis, R.N.M.; resources, A.K. and M.P.; data curation, A.K. and M.P.; writing—original draft preparation, R.N.M.; writing—review and editing, R.N.M., A.K., M.P. and I.L.; visualization, R.N.M. and I.L.; supervision, I.L. All authors have read and agreed to the published version of the manuscript.

Funding

This project has received funding from the Hellenic Foundation for Research and Innovation (HFRI) and the General Secretariat for Research and Technology (GSRT) under grant agreement No 710.

Data Availability Statement

The data presented in this study are openly available at https://www.imngs.org/ and https://www.arb-silva.de/ (accessed on October 2022).

Conflicts of Interest

The authors declare no conflict of interest.

References

  1. Schauer, M.; Hahn, M.W. Diversity and phylogenetic affiliations of morphologically conspicuous large filamentous bacteria occurring in the pelagic zones of a broad spectrum of freshwater habitats. Appl. Environ. Microbiol. 2005, 71, 1931–1940. [Google Scholar] [CrossRef] [PubMed] [Green Version]
  2. Schauer, M.; Kamenik, C.; Hahn, M.W. Ecological differentiation within a cosmopolitan group of planktonic freshwater bacteria (SOL cluster, Saprospiraceae, Bacteroidetes). Appl. Environ. Microbiol. 2005, 71, 5900–5907. [Google Scholar] [CrossRef] [PubMed] [Green Version]
  3. Lee, S.D. Lewinella agarilytica sp. nov., a novel marine bacterium of the phylum Bacteroidetes, isolated from beach sediment. Int. J. Syst. Evol. Microbiol. 2007, 57, 2814–2818. [Google Scholar] [CrossRef] [PubMed] [Green Version]
  4. Lian, J.; Steinert, G.; de Vree, J.; Meijer, S.; Heryanto, C.; Bosma, R.; Wijffels, R.H.; Barbosa, M.J.; Smidt, H.; Sipkema, D. Bacterial diversity in different outdoor pilot plant photobioreactor types during production of the microalga Nannochloropsis sp. CCAP211/78. Appl. Microbiol. Biotechnol. 2022, 106, 2235–2248. [Google Scholar] [CrossRef]
  5. Gerdts, G.; Brandt, P.; Kreisel, K.; Boersma, M.; Schoo, K.L.; Wichels, A. The microbiome of North Sea copepods. Helgol. Mar. Res. 2013, 67, 757–773. [Google Scholar] [CrossRef] [Green Version]
  6. Sung, H.R.; Lee, J.M.; Kim, M.; Shin, K.S. Lewinella xylanilytica sp. nov., a member of the family Saprospiraceae isolated from coastal seawater. Int. J. Syst. Evol. Microbiol. 2015, 65 Pt 10, 3433–3438. [Google Scholar] [CrossRef] [PubMed]
  7. Oh, H.M.; Lee, K.; Cho, J.C. Lewinella antarctica sp. nov., a marine bacterium isolated from Antarctic seawater. Int. J. Syst. Evol. Microbiol. 2009, 59, 65–68. [Google Scholar] [CrossRef] [Green Version]
  8. Jung, Y.T.; Lee, J.S.; Yoon, J.H. Lewinella aquimaris sp. nov., isolated from seawater. Int. J. Syst. Evol. Microbiol. 2016, 66, 3989–3994. [Google Scholar] [CrossRef]
  9. Kim, I.; Chhetri, G.; Kim, J.; Kang, M.; Seo, T. Lewinella aurantiaca sp. nov., a carotenoid pigment-producing bacterium isolated from surface seawater. Int. J. Syst. Evol. Microbiol. 2020, 70, 6180–6187. [Google Scholar] [CrossRef]
  10. Park, S.; Won, S.M.; Yoon, J.H. Lewinella litorea sp. nov., isolated from marine sand. Int. J. Syst. Evol. Microbiol. 2020, 70, 246–250. [Google Scholar] [CrossRef]
  11. Kang, H.; Kim, H.; Joung, Y.; Joh, K. Lewinella maritima sp. nov., and Lewinella lacunae sp. nov., novel bacteria from marine environments. Int. J. Syst. Evol. Microbiol. 2017, 67, 3603–3609. [Google Scholar] [CrossRef] [PubMed]
  12. Hahn, M.W.; Schauer, M. ‘Candidatus Aquirestis calciphila’ and ‘Candidatus Haliscomenobacter calcifugiens’, filamentous, planktonic bacteria inhabiting natural lakes. Int. J. Syst. Evol. Microbiol. 2007, 57, 936–940. [Google Scholar] [CrossRef] [PubMed]
  13. Hosoya, S.; Arunpairojana, V.; Suwannachart, C.; Kanjana-Opas, A.; Yokota, A. Aureispira maritima sp. nov., isolated from marine barnacle debris. Int. J. Syst. Evol. Microbiol. 2007, 57, 1948–1951. [Google Scholar] [CrossRef] [PubMed]
  14. Hosoya, S.; Arunpairojana, V.; Suwannachart, C.; Kanjana-Opas, A.; Yokota, A. Aureispira marina gen. nov., sp. nov., a gliding, arachidonic acid-containing bacterium isolated from the southern coastline of Thailand. Int. J. Syst. Evol. Microbiol. 2006, 56, 2931–2935. [Google Scholar] [CrossRef] [PubMed] [Green Version]
  15. Lei, X.; Li, Y.; Wang, G.; Chen, Y.; Lai, Q.; Chen, Z.; Zhang, J.; Liao, P.; Zhu, H.; Zheng, W.; et al. Phaeodactylibacter luteus sp. nov., isolated from the oleaginous microalga Picochlorum sp. Int. J. Syst. Evol. Microbiol. 2015, 65 Pt 8, 2666–2670. [Google Scholar] [CrossRef]
  16. Li, X.; Liu, Y.; Chen, Z.; Liu, L.Z.; Liu, Z.P. Membranicola marinus gen. nov., sp. nov., a new member of the family Saprospiraceae isolated from a biofilter in a recirculating aquaculture system. Int. J. Syst. Evol. Microbiol. 2016, 66, 1275–1280. [Google Scholar] [CrossRef] [Green Version]
  17. Chen, Z.; Lei, X.; Lai, Q.; Li, Y.; Zhang, B.; Zhang, J.; Zhang, H.; Yang, L.; Zheng, W.; Tian, Y.; et al. Phaeodactylibacter xiamenensis gen. nov., sp. nov., a member of the family Saprospiraceae isolated from the marine alga Phaeodactylum tricornutum. Int. J. Syst. Evol. Microbiol. 2014, 64 Pt 10, 3496–3502. [Google Scholar] [CrossRef] [Green Version]
  18. Jiang, X.; Ma, H.; Zhao, Q.L.; Yang, J.; Xin, C.Y.; Chen, B. Bacterial communities in paddy soil and ditch sediment under rice-crab co-culture system. AMB Express 2021, 11, 163. [Google Scholar] [CrossRef]
  19. Vortsepneva, E.; Chevaldonné, P.; Klyukina, A.; Naduvaeva, E.; Todt, C.; Zhadan, A.; Tzetlin, A.; Kublanov, I. Microbial associations of shallow-water Mediterranean marine cave Solenogastres (Mollusca). PeerJ 2021, 9, e12655. [Google Scholar] [CrossRef]
  20. Su, Y.; Lv, J.L.; Yu, M.; Ma, Z.H.; Xi, H.; Kou, C.L.; He, Z.C.; Shen, A.L. Long-term decomposed straw return positively affects the soil microbial community. J. Appl. Microbiol. 2020, 128, 138–150. [Google Scholar] [CrossRef] [Green Version]
  21. Yoon, J.; Katsuta, A.; Kasai, H. Rubidimonas crustatorum gen. nov., sp. nov., a novel member of the family Saprospiraceae isolated from a marine crustacean. Antonie van Leeuwenhoek 2012, 101, 461–467. [Google Scholar] [CrossRef] [PubMed]
  22. Yoon, J.; Matsuo, Y.; Kasai, H.; Yokota, A. Portibacter lacus gen. nov., sp. nov., a new member of the family Saprospiraceae isolated from a saline lake. J. Gen. Appl. Microbiol. 2012, 58, 191–197. [Google Scholar] [CrossRef] [PubMed] [Green Version]
  23. Xia, Y.; Kong, Y.; Thomsen, T.R.; Halkjær Nielsen, P. Identification and ecophysiological characterization of epiphytic protein-hydrolyzing Saprospiraceae (“Candidatus Epiflobacter” spp.) in activated sludge. Appl. Environ. Microbiol. 2008, 74, 2229–2238. [Google Scholar] [CrossRef] [Green Version]
  24. Van Veen, W.L.; Van Der Kooij, D.; Geuze, E.C.; Van der Vlies, A.W. Investigations on the sheathed bacterium Haliscomenobacter hydrossis gen. n., sp. n., isolated from activated sludge. Antonie van Leeuwenhoek 1973, 39, 207–216. [Google Scholar] [CrossRef] [PubMed]
  25. Mori, T.; Masuzawa, N.; Kondo, K.; Nakanishi, Y.; Chida, S.; Uehara, D.; Katahira, M.; Takeda, M. A heterodimeric hyaluronate lyase secreted by the activated sludge bacterium Haliscomenobacter hydrossis. Biosci. Biotechnol. Biochem. 2023, 87, 256–266. [Google Scholar] [CrossRef]
  26. Kondrotaite, Z.; Valk, L.C.; Petriglieri, F.; Singleton, C.; Nierychlo, M.; Dueholm, M.K.; Nielsen, P.H. Diversity and Ecophysiology of the Genus OLB8 and Other Abundant Uncultured Saprospiraceae Genera in Global Wastewater Treatment Systems. Front. Microbiol. 2022, 13, 917553. [Google Scholar] [CrossRef]
  27. Speth, D.R.; Guerrero-Cruz, S.; Dutilh, B.E.; Jetten, M.S. Genome-based microbial ecology of anammox granules in a full-scale wastewater treatment system. Nat. Commun. 2016, 7, 11172. [Google Scholar] [CrossRef] [Green Version]
  28. Zeng, T.; Wang, L.; Zhang, X.; Song, X.; Li, J.; Yang, J.; Chen, S.; Zhang, J. Characterization of Microbial Communities in Wastewater Treatment Plants Containing Heavy Metals Located in Chemical Industrial Zones. Int. J. Environ. Res. Public Health 2022, 19, 6529. [Google Scholar] [CrossRef]
  29. Ma, K.; Li, X.; Bao, L.; Li, X.; Cui, Y. The performance and bacterial community shifts in an anaerobic-aerobic process treating purified terephthalic acid wastewater under influent composition variations and ambient temperatures. J. Clean. Prod. 2020, 276, 124190. [Google Scholar] [CrossRef]
  30. De Carluccio, M.; Sabatino, R.; Eckert, E.M.; Di Cesare, A.; Corno, G.; Rizzo, L. Co-treatment of landfill leachate with urban wastewater by chemical, physical and biological processes: Fenton oxidation preserves autochthonous bacterial community in the activated sludge process. Chemosphere 2023, 313, 137578. [Google Scholar] [CrossRef]
  31. Wang, D.; Tao, L.; Yang, J.; Xu, Z.; Yang, Q.; Zhang, Y.; Liu, X.; Liu, Q.; Huang, J. Understanding the interaction between triclocarban and denitrifiers. J. Hazard. Mater. 2021, 401, 123343. [Google Scholar] [CrossRef]
  32. Li, C.; Liu, X.; Du, M.; Yang, J.; Lu, Q.; Fu, Q.; Dandan, H.; Zhao, W.; Wang, D. Peracetic acid promotes biohydrogen production from anaerobic dark fermentation of waste activated sludge. Sci. Total Environ. 2022, 844, 156991. [Google Scholar] [CrossRef] [PubMed]
  33. Zhang, W.; Liu, X.; Liu, L.; Lu, H.; Wang, L.; Tang, J. Effects of microplastics on greenhouse gas emissions and microbial communities in sediment of freshwater systems. J. Hazard. Mater. 2022, 435, 129030. [Google Scholar] [CrossRef]
  34. Yang, C.; Zhang, L.; Hu, S.; Diao, Y.; Jin, X.; Jin, P.; Chen, C.; Wu, X.; Wang, X.C. Electro-dissolved ozone flotation (E-DOF) integrated anoxic/oxic membrane reactor for leachate treatment from a waste transfer station. Environ. Sci. Pollut. Res. 2022, 29, 55803–55815. [Google Scholar] [CrossRef] [PubMed]
  35. Yuan, L.; Tan, L.; Shen, Z.; Zhou, Y.; He, X.; Chen, X. Enhanced denitrification of dispersed swine wastewater using Ca(OH) 2-pretreated rice straw as a solid carbon source. Chemosphere 2022, 305, 135316. [Google Scholar] [CrossRef]
  36. Nielsen, P.H.; Mielczarek, A.T.; Kragelund, C.; Nielsen, J.L.; Saunders, A.M.; Kong, Y.; Hansen, A.A.; Vollertsen, J. A conceptual ecosystem model of microbial communities in enhanced biological phosphorus removal plants. Water Res. 2010, 44, 5070–5088. [Google Scholar] [CrossRef]
  37. Xu, X.J.; Wu, Y.N.; Xiao, Q.Y.; Xie, P.; Ren, N.Q.; Yuan, Y.X.; Lee, D.J.; Chen, C. Simultaneous removal of NOX and SO2 from flue gas in an integrated FGD-CABR system by sulfur cycling-mediated Fe (II) EDTA regeneration. Environ. Res. 2022, 205, 112541. [Google Scholar] [CrossRef] [PubMed]
  38. Hahnke, R.L.; Meier-Kolthoff, J.P.; García-López, M.; Mukherjee, S.; Huntemann, M.; Ivanova, N.N.; Woyke, T.; Kyrpides, N.C.; Klenk, H.P.; Göker, M. Genome-based taxonomic classification of Bacteroidetes. Front. Microbiol. 2016, 7, 2003. [Google Scholar] [CrossRef] [Green Version]
  39. García-López, M.; Meier-Kolthoff, J.P.; Tindall, B.J.; Gronow, S.; Woyke, T.; Kyrpides, N.C.; Hahnke, R.L.; Göker, M. Analysis of 1,000 type-strain genomes improves taxonomic classification of Bacteroidetes. Front. Microbiol. 2019, 10, 2083. [Google Scholar] [CrossRef] [Green Version]
  40. Huang, Z.; Hong, Q.; Lai, Q.; Zhang, Q. Portibacter marinus sp. nov., isolated from the sediment on the surface of plastics and proposal of a novel genus Neolewinella gen. nov. based on the genome-based phylogeny of the family Lewinellaceae. Int. J. Syst. Evol. Microbiol. 2022, 72, 005561. [Google Scholar] [CrossRef]
  41. Deshmukh, U.B.; Oren, A. Proposal of Membranihabitans gen. nov. as a replacement name for the illegitimate prokaryotic generic name Membranicola Li et al. 2016. Int. J. Syst. Evol. Microbiol. 2022, 72, 005576. [Google Scholar] [CrossRef] [PubMed]
  42. Gross, J. Über freilebende Spironemaceen. Mitteilungen Zoologischen Station Neapel 1911, 20, 188–203. [Google Scholar]
  43. Khan, S.T.; Fukunaga, Y.; Nakagawa, Y.; Harayama, S. Emended descriptions of the genus Lewinella and of Lewinella cohaerens, Lewinella nigricans and Lewinella persica, and description of Lewinella lutea sp. nov. and Lewinella marina sp. nov. Int. J. Syst. Evol. Microbiol. 2007, 57, 2946–2951. [Google Scholar] [CrossRef] [Green Version]
  44. Quast, C.; Pruesse, E.; Yilmaz, P.; Gerken, J.; Schweer, T.; Yarza, P.; Peplies, J.; Glöckner, F.O. The SILVA ribosomal RNA gene database project: Improved data processing and web-based tools. Nucleic Acids Res. 2012, 41, D590–D596. [Google Scholar] [CrossRef] [PubMed]
  45. Lagkouvardos, I.; Joseph, D.; Kapfhammer, M.; Giritli, S.; Horn, M.; Haller, D.; Clavel, T. IMNGS: A comprehensive open resource of processed 16S rRNA microbial profiles for ecology and diversity studies. Sci. Rep. 2016, 6, 33721. [Google Scholar] [CrossRef] [Green Version]
  46. Pruesse, E.; Peplies, J.; Glöckner, F.O. SINA: Accurate high-throughput multiple sequence alignment of ribosomal RNA genes. Bioinformatics 2012, 28, 1823–1829. [Google Scholar] [CrossRef] [PubMed] [Green Version]
  47. Kioukis, A.; Pourjam, M.; Neuhaus, K.; Lagkouvardos, I. Taxonomy Informed Clustering, an Optimized Method for Purer and More Informative Clusters in Diversity Analysis and Microbiome Profiling. Front. Bioinform. 2022, 2, 864597. [Google Scholar] [CrossRef]
  48. Asnicar, F.; Weingart, G.; Tickle, T.L.; Huttenhower, C.; Segata, N. Compact graphical representation of phylogenetic data and metadata with GraPhlAn. PeerJ 2015, 3, e1029. [Google Scholar] [CrossRef]
  49. Béziat, N.S.; Duperron, S.; Halary, S.; Azede, C.; Gros, O. Bacterial ectosymbionts colonizing gills of two Caribbean mangrove crabs. Symbiosis 2022, 85, 105–114. [Google Scholar] [CrossRef]
  50. Lagkouvardos, I.; Weinmaier, T.; Lauro, F.M.; Cavicchioli, R.; Rattei, T.; Horn, M. Integrating metagenomic and amplicon databases to resolve the phylogenetic and ecological diversity of the Chlamydiae. ISME J. 2014, 8, 115–125. [Google Scholar] [CrossRef] [Green Version]
Figure 1. Schematic overview of the workflow followed for the diversity analysis of Saprospirales order.
Microorganisms 11 01767 g001
Figure 2. Agglomerative coverage of integrated sequences over their SINA alignment. The y-axis (counts) indicates the number of times a base has been found in the multiple sequence alignment for the respective position. Consecutive high counts correspond to regions overrepresented in the integrated dataset. Considering this, the most represented region spanned from the position 10 K to 25.5 K in the alignment. All aligned sequences were trimmed around these positions, and those left with a sufficient number of bases were selected for further analysis.
Microorganisms 11 01767 g002
Figure 3. Saprospirales positivity (%) on IMNGS samples. The total number of samples that existed in the IMNGS database in the selected region is 204,510. These samples are categorized in the IMNGS database according to their environment of origin. In this plot, each bar represents the percentage of samples that were found to be positive for Saprospirales in each environmental category of IMNGS.
Microorganisms 11 01767 g003aMicroorganisms 11 01767 g003b
Figure 4. Distribution of the number of species within unknown families, unknown genera, and known genera. The three plots present the percentage of unknown families, unknown genera, and known genera that have only 1 species (blue), 2 to 10 species (orange), 11 to 50 species (grey), and more than 51 species (green).
Microorganisms 11 01767 g004
Figure 5. Environmental preferences by known families with species abundance ≥0.1%. Pr corresponds to prevalence (dominant environment), while Ab corresponds to maximum abundance environment. Each bar represents the number of species found in each corresponding environment.
Microorganisms 11 01767 g005
Figure 6. Environmental preferences by known genera with species abundance ≥0.1%. Pr corresponds to prevalence (dominant environment), while Ab corresponds to maximum abundance environments. Each bar represents the number of species found in each corresponding environment.
Microorganisms 11 01767 g006
Figure 7. Environmental distribution of unknown genera with species abundance >0.1%. The total amount of unknown genera with species abundance >0.1% was 479 and the species belonging to them were 885. These genera belong to the three known families, as well as to the unknown families. (A) The pie chart presents the environmental distribution according to species prevalence. (B) The pie chart presents the environmental distribution according to the species’ maximum abundance environment. Each environmental percentage corresponds to the number out of the total number of species that (A) had their prevalence in the corresponding environment and (B) had their maximum abundance in the corresponding environment.
Microorganisms 11 01767 g007
Figure 8. Taxonomic tree representing the environmental distribution of species appearing in at least in 50 samples each. All presented species had abundances ≥0.1%, i.e., in this diagram, 249 species out of 1565 species are presented. The diagram was created using GraPhlAn [48]. Species are presented according to the family and the genus they belong to. The inner circle of environments corresponds to species prevalence (Pr), while the rest of the circles correspond to species abundance and to the respective environment, i.e., the second circle corresponds to species abundances <1%, the third circle corresponds to abundances < 5%, and the last circle corresponds to abundances <10%.
Microorganisms 11 01767 g008
Figure 9. Environmental distribution (%) of known species. At the end of each bar the number of samples that these species were found in abundances of ≥0.1% are presented. Opimibacter iunctus, Rubidimonas crustatorum, Saprospira grandis, Haliscomenobacter calcifugiens, and Neolewinella lacunae were not found in any samples; therefore, they lack environmental distribution.
Microorganisms 11 01767 g009
Table 1. Predicted global sequenced-based diversity of molecular families, genera, and species within the order Saprospirales. The last column presents the number of predicted taxa containing species with abundance ≥0.1%.
KnownPredictedPredicted (≥0.1%)
Families3127210
Genera1715,049479
Species32118,0621565
Table 2. Predicted global sequenced-based diversity of genera belonging to known and unknown families within the order Saprospirales.
FamiliesKnownPred.Pred. %Pred. (≥0.1%)Pred. % (≥0.1%)
Saprospiraceae11448329.79%13227.56%
Lewinellaceae3543036.08%18638.83%
Haliscomenobacteraceae3367524.42%15031.32%
Unknown familiesNA1461 *9.71%11 **2.30%
* Distributed to 1183 unknown families, ** distributed to 7 unknown families.
Table 3. Predicted global sequenced-based diversity of species belonging to known and unknown families within the order Saprospirales.
FamiliesKnownPred.Pred. %Pred. (≥0.1%)Pred. % (≥0.1%)
Saprospiraceae1439,33233.31%55335.34%
Lewinellaceae1342,92136.36%56436.04%
Haliscomenobacteraceae533,19128.11%43527.76%
Unknown familiesNA2618 *2.22%13 **0.83%
* Distributed to 1183 unknown families, ** distributed to 7 unknown families.
Table 4. Predicted global sequenced-based diversity of species belonging to known and unknown genera inside known families of Saprospirales.
Known FamiliesGeneraKnownPred.Pred. %Pred. (≥0.1%)Pred. % (≥0.1%)
SaprospiraceaeAquirestis137953.21%422.68%
Aureispira236553.10%583.71%
Brachybacter137963.22%452.88%
Defluviibacterium11090.09%110.70%
Membranihabitans137393.17%261.66%
Opimibacter219071.62%473.00%
Parvibacillus126972.28%432.75%
Rubidimonas143.4 × 10−3%00.00%
Saprospira1170.01%00.00%
Vicinibacter212611.07%352.24%
Epiflobacter0340.03%40.26%
Unknown generaNA18,318 *15.52%242 **15.46%
LewinellaceaeFlavilitoribacter133662.85%815.18%
Lewinella138503.26%462.94%
Neolewinella1111,5119.75%1056.71%
Unknown generaNA24,194 *320.49%332 *421.21%
HaliscomenobacteraceaeHaliscomenobacter126902.28%251.60%
Phaeodactylibacter225352.15%714.54%
Portibacter212951.10%422.68%
Unknown generaNA26,671 *522.59%297 *618.98%
* Distributed to 4472 unknown genera, ** distributed to 123 unknown genera, *3 distributed to 5427 unknown genera, *4 distributed to 183 unknown genera, *5 distributed to 3672 unknown genera, *6 distributed to 147 unknown genera.
Table 5. Known species assignment to sOTUs, with BLAST similarity above 98%. Each known species was assigned the ecological parameters of the respective sOTU. Symbol #, when present, stands for “The absolute number of” the corresponding entity.
FamilyGenusSpeciesSOTU ID# Positive
Samples
(Abund. ≥ 0.1%)
Dominant
Environment
Maximum
Abundance
Environment
Maximum
Abundance
eSaprospiraceaeAquirestisAquirestis calciphilaSOTU895freshwaterfreshwater4.37%
AureispiraAureispira marinaSOTU4126saline watersaline water0.48%
AureispiraAureispira maritimaSOTU4117saline watersaline water3.41%
BrachybacterBrachybacter algidusSOTU501bioreactorbioreactor0.36%
DefluviibacteriumDefluviibacterium haderslevenseSOTU2032bioreactorbioreactor0.56%
EpiflobacterEpiflobacter spp. SOTU41236freshwaterfreshwater0.56%
MembranihabitansMembranihabitans marinusSOTU20715host saline waterhost saline water1.26%
OpimibacterOpimibacter skivensisSOTU225282soilsoil1.53%
ParvibacillusParvibacillus calidusSOTU681bioreactorbioreactor0.11%
VicinibacterVicinibacter affinis/proximusSOTU835bioreactorbioreactor1.63%
LewinellaceaeFlavilitoribacterFlavilitoribacter nigricansSOTU2908saline waterbioreactor0.22%
LewinellaLewinella cohaerensSOTU20910saline waterbioreactor1.39%
NeolewinellaNeolewinella antarcticaSOTU3842saline waterplant saline water0.88%
NeolewinellaNeolewinella aquimarisSOTU3159saline watersaline water0.33%
NeolewinellaNeolewinella aurantiacaSOTU3441plant saline waterplant saline water0.21%
NeolewinellaNeolewinella luteaSOTU3097saline watersaline water4.84%
NeolewinellaNeolewinella marina/litoreaSOTU857saline waterplant saline water0.61%
NeolewinellaNeolewinella maritimaSOTU3262saline watersaline water0.72%
NeolewinellaNeolewinella persica/agarilyticaSOTU3302saline watersaline water0.40%
NeolewinellaNeolewinella xylanilyticaSOTU3389saline watersaline water2.67%
HaliscomenobacteraceaeHaliscomenobacterHaliscomenobacter hydrossisSOTU2361saline watersaline water0.91%
PhaeodactylibacterPhaeodactylibacter luteusSOTU191freshwaterfreshwater0.36%
PhaeodactylibacterPhaeodactylibacter xiamenensisSOTU181saline watersaline water0.17%
PortibacterPortibacter lacus/marinusSOTU4162saline watersaline water0.17%
Table 6. The 20 most prevalent species accompanied by their respective information regarding the environment of prevalence, the maximum abundance environment and the corresponding maximum abundance, and the number of samples identified. The sOTUs with BLAST similarity above 98% were assigned to known species. Symbol #, when present, stands for “The absolute number of” the corresponding entity.
FamilyGenusSpeciesSOTU ID# Positive Samples# Positive Samples (Abundance ≥ 0.1%)Environment of PrevalenceMax Abundance EnvironmentMax Abundance
SaprospiraceaeOpimibacterOpimibacter skivensisSOTU2253066282soilsoil1.53%
LewinellaceaeNeolewinellaUnknown speciesSOTU30651625saline watersaline water12.20%
LewinellaceaeNeolewinellaUnknown speciesSOTU30742020saline watersaline water1.82%
LewinellaceaeFlavilitoribacterUnknown speciesSOTU435341527saline watersaline water2.52%
LewinellaceaeNeolewinellaUnknown speciesSOTU3214089saline watersaline water1.43%
SaprospiraceaeAureispiraUnknown speciesSOTU41433320saline watersaline water0.90%
LewinellaceaeNeolewinellaUnknown speciesSOTU338433231saline watersaline water1.03%
SaprospiraceaeGOTU74Unknown speciesSOTU552032714saline watersaline water2.43%
LewinellaceaeFlavilitoribacterFlavilitoribacter nigricansSOTU2903158saline waterbioreactor0.22%
SaprospiraceaeAquirestisUnknown speciesSOTU11228711freshwatersaline water0.31%
HaliscomenobacteraceaeHaliscomenobacterUnknown speciesSOTU27728521freshwaterfreshwater0.45%
SaprospiraceaeGOTU946Unknown speciesSOTU52727212soilsoil0.42%
HaliscomenobacteraceaePhaeodactylibacterUnknown speciesSOTU1181126512saline watersaline water0.71%
LewinellaceaeNeolewinellaUnknown speciesSOTU31026313saline waterair0.39%
LewinellaceaeNeolewinellaNeolewinella aquimarisSOTU3152569saline watersaline water0.33%
HaliscomenobacteraceaeGOTU588Unknown speciesSOTU41892533saline watersaline water0.41%
SaprospiraceaeAquirestisUnknown speciesSOTU1872462saline waterfreshwater0.36%
LewinellaceaeFlavilitoribacterUnknown speciesSOTU185424310saline watersaline water0.35%
LewinellaceaeLewinellaUnknown speciesSOTU2202344saline waterbioreactor7.92%
HaliscomenobacteraceaePortibacterUnknown speciesSOTU106072332saline watersaline water1.62%
Table 7. The 20 most abundant species accompanied by their respective information regarding the environment of prevalence, the maximum abundance environment and the corresponding maximum abundance, and the number of samples identified. The sOTUs with BLAST similarity above 98% were assigned to known species. Symbol #, when present, stands for “The absolute number of” the corresponding entity.
FamilyGenusSpeciesSOTU ID# Positive Samples# Positive Samples (Abundance ≥ 0.1%)Environment of PrevalenceMax. Abundance EnvironmentMax. Abundance
SaprospiraceaeParvibacillusUnknown speciesSOTU5123025bioreactorbioreactor28.02%
SaprospiraceaeAureispiraUnknown speciesSOTU413711host saline waterhost saline water22.60%
SaprospiraceaeGOTU1969Unknown speciesSOTU8356511bioreactorbioreactor21.73%
SaprospiraceaeParvibacillusUnknown speciesSOTU8021bioreactorbioreactor14.97%
LewinellaceaeGOTU1025Unknown speciesSOTU13902271saline watersaline water12.90%
SaprospiraceaeGOTU42Unknown speciesSOTU56520514bioreactorbioreactor12.72%
LewinellaceaeNeolewinellaUnknown speciesSOTU30651625saline watersaline water12.20%
HaliscomenobacteraceaePhaeodactylibacterUnknown speciesSOTU653saline watersaline water11.92%
SaprospiraceaeGOTU741Unknown speciesSOTU7213498saline watersaline water11.79%
SaprospiraceaeGOTU4577Unknown speciesSOTU5033661bioreactorbioreactor10.01%
SaprospiraceaeParvibacillusUnknown speciesSOTU57112bioreactorbioreactor9.33%
LewinellaceaeNeolewinellaUnknown speciesSOTU3121053saline watersaline water9.23%
LewinellaceaeGOTU755Unknown speciesSOTU1453973bioreactorbioreactor8.93%
LewinellaceaeLewinellaUnknown speciesSOTU2202344saline waterbioreactor7.92%
HaliscomenobacteraceaeGOTU423Unknown speciesSOTU42257123saline watersaline water7.45%
LewinellaceaeNeolewinellaUnknown speciesSOTU14993211freshwaterfreshwater7.37%
SaprospiraceaeBrachybacterUnknown speciesSOTU31327bioreactorbioreactor7.31%
HaliscomenobacteraceaeGOTU2075Unknown speciesSOTU32764122freshwaterbioreactor7.12%
LewinellaceaeGOTU6152Unknown speciesSOTU7259741bioreactorbioreactor6.24%
HaliscomenobacteraceaeGOTU62Unknown speciesSOTU49171243saline watersaline water5.89%
Disclaimer/Publisher’s Note: The statements, opinions and data contained in all publications are solely those of the individual author(s) and contributor(s) and not of MDPI and/or the editor(s). MDPI and/or the editor(s) disclaim responsibility for any injury to people or property resulting from any ideas, methods, instructions or products referred to in the content.