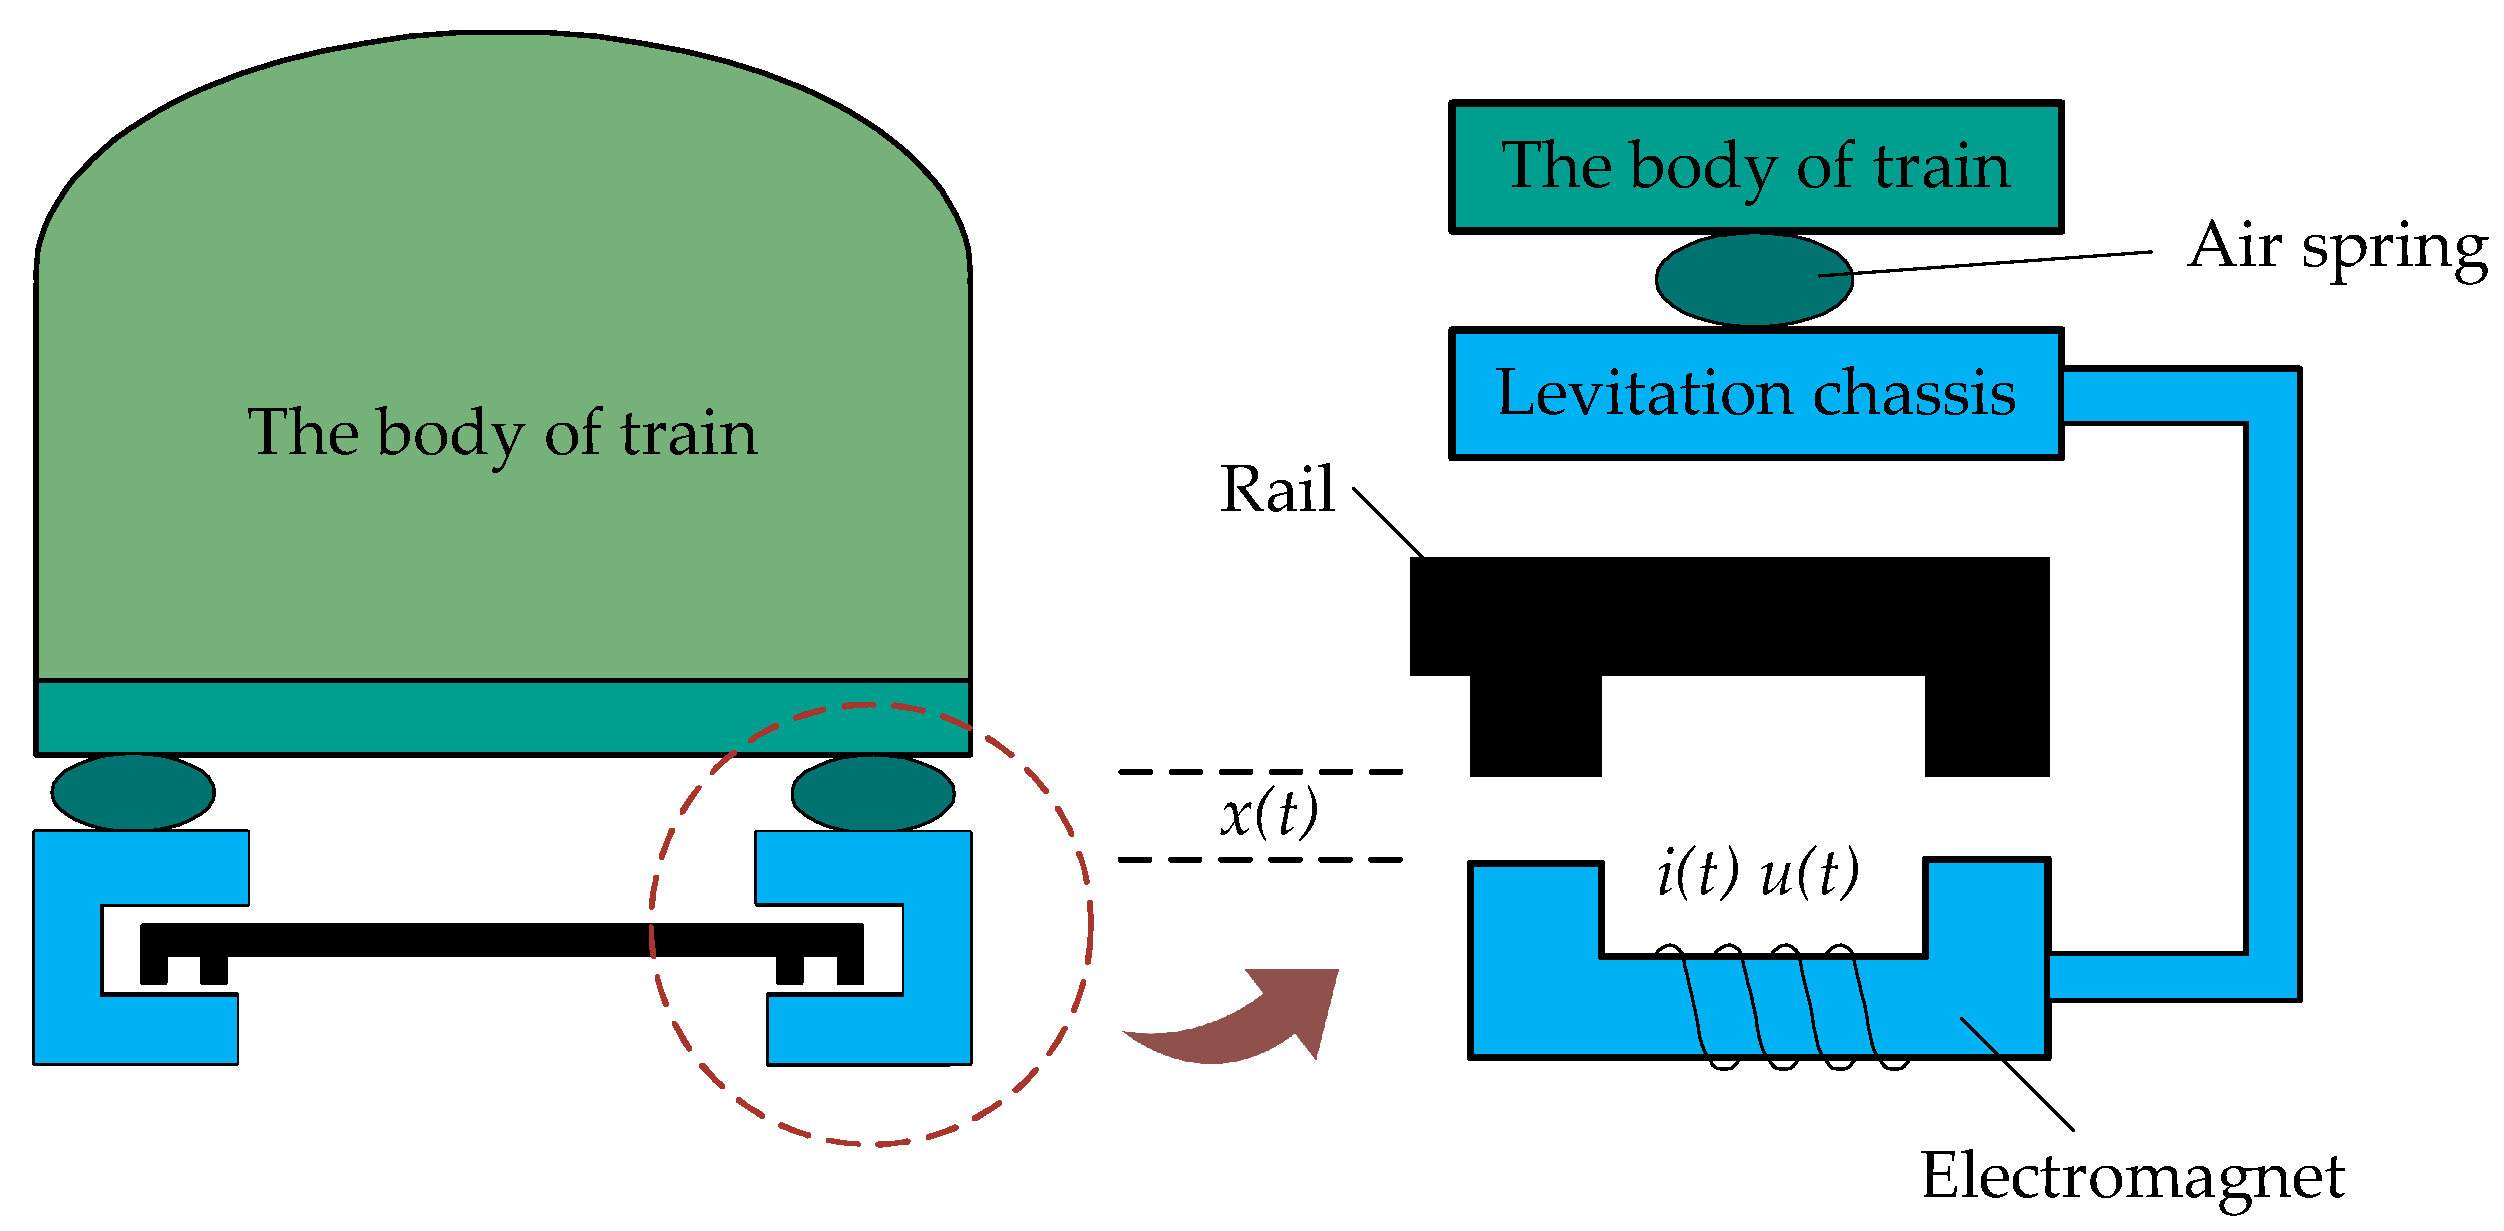
1. Introduction
Maglev trains are a class of transportation systems that employ electromagnetic forces in lieu of mechanical contact to achieve levitation, propulsion, and braking. They offer several advantages, including low vibration and noise, strong grade-climbing capability, and reduced turning radius [
1,
2,
3]. Since the 1960s, countries such as Germany, Japan, and the United States have successively initiated research and development of maglev transportation systems, whereas China and South Korea entered the field at a relatively later stage. Following sustained and extensive research efforts, maglev technology has evolved into multiple parallel technical pathways, including permanent magnet suspension, electromagnetic suspension, and electrodynamic suspension, encompassing a wide range of operational speeds from medium- and low-speed to high-speed regimes. As a mode of public transportation, maglev trains are subject to stringent safety requirements [
4,
5]. In medium- and low-speed maglev train systems, the suspension system constitutes a critical component for ensuring stable operation, and its performance directly affects the safety and smoothness of train operation [
6]. Research aimed at enhancing the performance of maglev train suspension systems has primarily progressed along two directions. The first direction focuses on system structure and control methodologies, seeking to improve the inherent dynamic performance of the suspension system through optimization of suspension parameters, design of novel suspension structures, or refinement of control strategies. The second direction addresses the performance degradation induced by multiple factors such as track irregularities and vehicle load variations, which can compromise the safe and stable operation of maglev trains. From the perspective of performance evaluation, this direction assesses system states, identifies performance deterioration, and provides a basis for predictive maintenance.
With respect to structural and control methodologies, extensive work has been conducted by researchers worldwide on parameter matching and dynamic design of suspension systems. Yao et al. optimized bogie suspension parameters for lateral robust stability under extreme wheel-rail wear conditions [
7]. Yang et al. developed an ISD seat suspension with skyhook inerter control to suppress low-frequency vibrations in commercial vehicles [
8]. Zhang et al. proposed a longitudinally mounted air spring (LFMAS) structure for maglev trains, reducing vibration and energy consumption while enhancing stability [
9,
10]. Park addressed the issue of low-damped carbody oscillation in high-speed railway vehicles using a genetic algorithm, increasing the minimum damping ratio from 5.7% to 15.6% [
11]. He et al. proposed a configuration optimization method for passive-active combined suspensions, achieving Pareto optimality between ride comfort and active force requirements [
12]. These studies demonstrate effective approaches to improving vehicle suspension system performance through hardware parameter optimization and structural innovation.
In the area of performance evaluation, the primary task is to extract effective performance indicators from the operational data of the suspension system. In general, performance indicators for suspension system control loops can be classified into three categories: deterministic indicators, stochastic indicators, and robustness indicators [
13]. Among these, stochastic indices characterize the statistical properties of control loop performance and reflect the operational state of the system based on measured data. This data-driven characterization is inherently non-intrusive and does not rely on precise model information, making it a particularly effective approach for performance evaluation. Extensive research has been conducted in this domain. Therefore, this approach is a favorable method for performance evaluation. The approach originates from the minimum variance control performance index proposed by Harris [
14]. Subsequently, researchers have extended the minimum variance benchmark and developed a variety of evaluation methods [
15,
16,
17]. These methods have also been introduced into the stochastic performance assessment of maglev train suspension systems [
18]. To date, numerous studies have been conducted on the performance evaluation of maglev train suspension systems.
Song et al. investigated a data-driven method for performance assessment of electromagnetic suspension system control loops, introduced visualization techniques, and carried out performance evaluation based on measured data [
19]. Liu et al. proposed an autoregressive moving average model for the suspension control system and determined control system performance and operating status using the minimum variance criterion in conjunction with maglev data [
20]. Ni et al. proposed a data-driven control loop performance evaluation method based on fractal analysis and validated its effectiveness through a case study using field data collected during the commissioning phase of a commercial operating line [
21]. Wen et al. designed a performance evaluation method for maglev train suspension control systems based on the minimum entropy criterion and verified its effectiveness with measured data [
22]. Zhou et al. conducted a data-based study on performance evaluation methods for EMS maglev control systems, applied gray relational analysis to achieve precise suspension performance assessment, and performed verification using measured data [
23]. Zhai et al. designed a comprehensive evaluation method for high-speed maglev train suspension systems based on the fuzzy analytic hierarchy process, collected operational data from a high-speed maglev test line, and validated the method’s effectiveness and feasibility [
24]. Xu et al. conducted a quantitative evaluation of control loop performance degradation using a data-driven approach and developed a data-driven real-time H∞ norm estimation and optimization method for closed-loop systems aimed at performance degradation recovery [
25]. Collectively, these studies demonstrate the effectiveness of data-driven approaches, all validated with measured data, reflecting a strong orientation toward engineering applications. However, further research remains possible in areas such as deeper data mining and the expansion of evaluation dimensions.
Meanwhile, in the field of state modeling and monitoring for complex systems, probabilistic model-based methods, particularly Gaussian mixture models (GMM), offer new perspectives for addressing the aforementioned issues. In 1894, Pearson first proposed the double GMM, representing the early concept of mixture models [
26]. In the 1990s, the expectation-maximization (EM) algorithm was introduced for GMM parameter estimation, overcoming the optimization difficulties caused by latent variables, and has since become a mainstream tool in machine learning and statistics [
27]. In practice, GMM is widely used for performance evaluation across various fields due to its ability to effectively handle multimodal distributions and heterogeneous data. For instance, Maliuk et al. proposed a rolling bearing fault diagnosis method based on GMM, improving the accuracy of fault feature extraction [
28]. Hong et al. applied GMM to functional movement screening assessment in the medical field [
29]. Duan et al. proposed a performance evaluation method for mixed-flow turbines based on a GMM-based health state model [
30]. Xu et al. developed an effective airframe damage assessment method using GMM for aviation structural damage evaluation [
31]. Pati et al. employed a Gaussian mixture model to enhance image recognition and segmentation capabilities, thereby improving the performance of computer-aided diagnosis [
32]. Garrido et al. employed a Gaussian mixture model for performance detection of under-constrained cable-driven parallel robots, achieving a 100% true positive rate and a 95.4% average true negative rate, while exhibiting higher robustness [
33].
From the above work, it can be seen that GMM has inherent advantages in processing multimodal data, which aligns well with the multiple operating states of suspension systems. On this basis, to further broaden the performance evaluation methods for maglev trains, this paper proposes a comprehensive evaluation method for the suspension system of medium- and low-speed maglev trains based on GMM, using traditional performance evaluation indices as features.
3. Data-Driven Comprehensive Evaluation Method Based on GMM
The GMM is an unsupervised learning approach grounded in probabilistic statistics and is widely employed in data clustering, density estimation, and anomaly detection. Its fundamental premise is that complex data distributions can be represented as a weighted superposition of multiple Gaussian (normal) distributions, thereby capturing the overall statistical characteristics of the data.
For maglev suspension systems, multiple operational states—such as steady levitation, mild disturbances, and dynamic regulation—naturally exhibit statistical properties that align well with the GMM framework. Motivated by this correspondence, this paper adopts the GMM as the foundational model and constructs feature vectors for the suspension system by incorporating an improved R index and the τ-distance index. On this basis, a comprehensive evaluation method is developed that jointly accounts for suspension stability and smoothness.
3.1. Principles of GMM
Conventional Gaussian distribution models assume that data are concentrated around a single dominant mode. However, real-world engineering data—such as vibration and noise signals in maglev suspension systems—often exhibit complex characteristics, including multimodality and asymmetry. By superimposing multiple Gaussian components, the GMM is capable of flexibly approximating arbitrary continuous probability distributions, rendering it particularly suitable for modeling multimodal data.
Let the observed data be denoted as
. The probability density function of the GMM is as follows:
Here, denotes the number of Gaussian components, and represents the mixing coefficient of the -th component, satisfying , which reflects the contribution weight of each component to the overall distribution. The term denotes the probability density function of the -th Gaussian component, where is the mean vector that determines the central location of the component, and is the covariance matrix that characterizes its shape.
In the parameter estimation stage, the EM algorithm is employed to iteratively optimize the GMM parameters
. The estimation process aims to maximize the log-likelihood function of the observed data, as expressed below:
This algorithm ensures that the model can stably capture the multimodal characteristics of the suspension system’s vibration data, thereby providing a reliable density estimation foundation for subsequent state clustering and anomaly detection.
In determining the optimal number of mixture components, this study employs the Bayesian Information Criterion (BIC) and the Akaike Information Criterion (AIC) to mitigate the subjectivity associated with manual selection. Specifically, BIC is adopted as the primary criterion, with AIC serving as a supplementary reference. The distinction between the two lies in their penalty terms, which results in BIC favoring more parsimonious model structures, whereas AIC tends to select comparatively more complex models [
35].
3.2. Design of a Comprehensive Evaluation Framework Based on Gaussian Mixture Models and Performance Indices
The GMM-based comprehensive evaluation method for the suspension system proposed in this paper considers two key aspects, namely the suspension gap and the gap acceleration. By computing the improved
R index and the
τ-distance index, feature representations of gap and acceleration data are extracted to facilitate a joint assessment of system stability and smoothness [
36,
37]. The improved
R index is defined as follows:
Here, denotes the forgetting factor, which specifies the weighting assigned to the current observation. The term represents the gap error, defined as the deviation between the actual gap and the target gap. The improved R index primarily characterizes fluctuations in the suspension gap by segmenting the data into temporal windows and computing the ratio between preceding and current windows. By evaluating the proximity of this ratio to the ideal value of 1, an intuitive assessment of control performance can be achieved.
The
τ-distance index is defined as follows:
Here, denotes the normalized five-dimensional feature vector of acceleration, comprising the standard deviation, root mean square, mean value, range, and variance. The τ-distance index is primarily designed to extract representative features from the gap acceleration signal, which are conducive to characterizing the overall fluctuation behavior of smoothness-related acceleration. A smaller τ-distance indicates smoother acceleration variations, whereas larger values imply increased fluctuation.
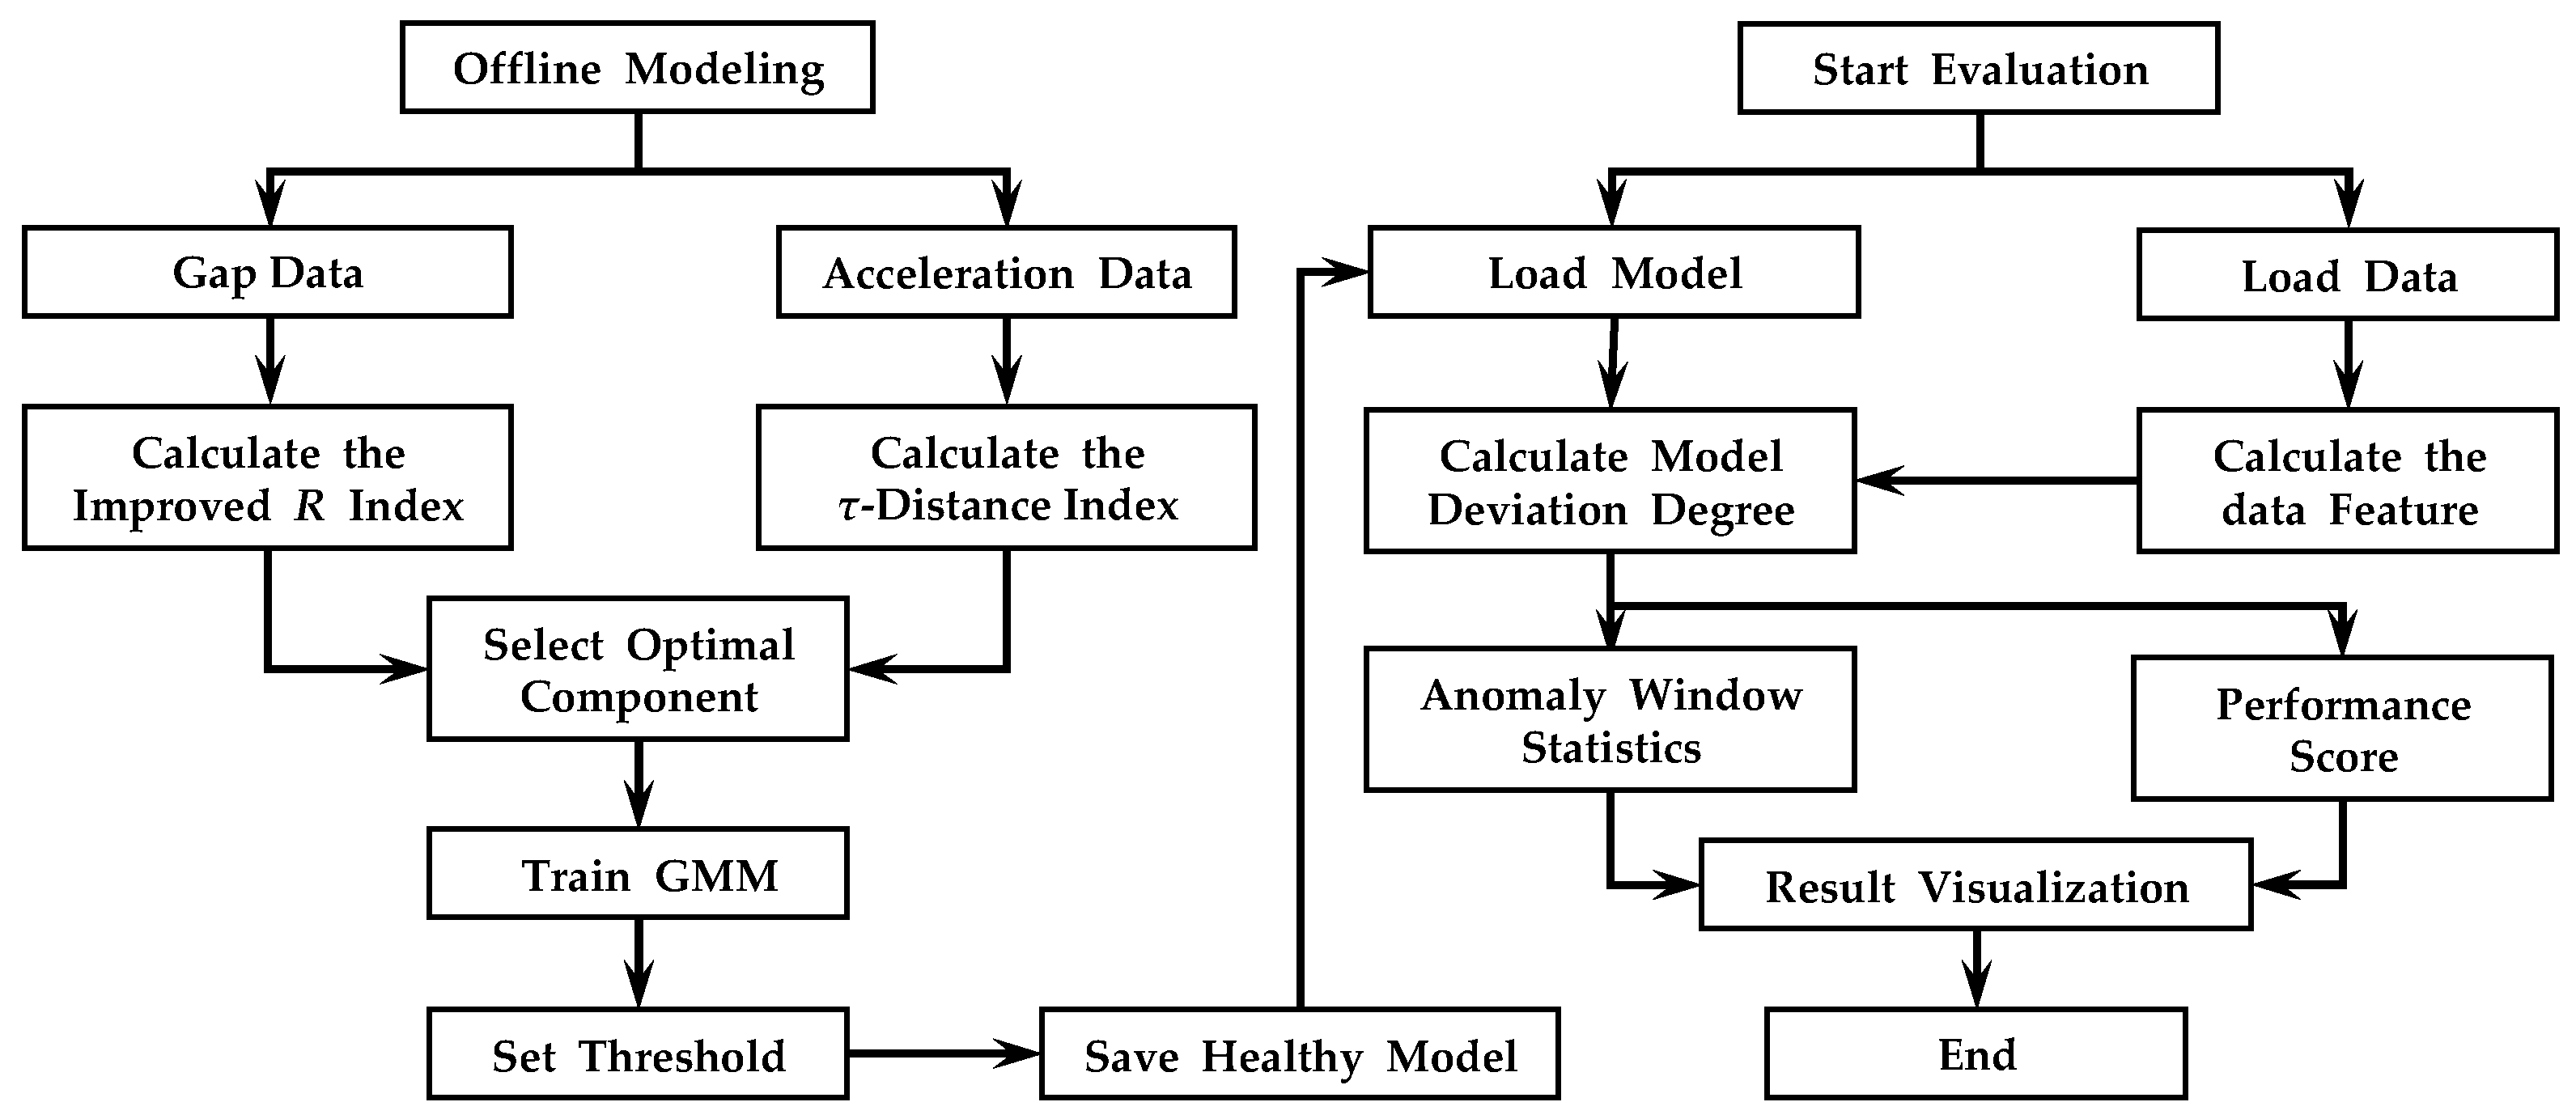
The comprehensive evaluation framework proposed in this paper consists of two stages: offline modeling and online comprehensive assessment. The offline procedure is outlined as follows:
Gap and acceleration data under healthy operating conditions of the suspension system are collected and segmented into time windows, within which feature extraction is performed.
The optimal number of mixture components is determined based on the BIC/AIC criteria to accurately capture the intrinsic operating modes of the suspension system.
The GMM is trained using the EM algorithm, yielding model parameters such as the log-likelihood values and data normalization statistics.
A threshold determination strategy is applied, whereby model thresholds are established based on the obtained log-likelihood values, resulting in the construction and storage of a baseline healthy model.
The comprehensive assessment stage follows a procedure analogous to that of offline modeling. Specifically, features are extracted from the evaluation window, and performance assessment results are obtained by comparing log-likelihood values against predefined thresholds, in conjunction with spatial clustering characteristics.
The overall workflow of the proposed comprehensive evaluation method is illustrated in
Figure 2.
4. Experiment and Analysis
To validate the effectiveness and accuracy of the proposed performance evaluation framework, this paper utilizes operational data collected from the Fenghuang Maglev Express. First, suspension gap and electromagnet acceleration data under stable operating conditions are selected to construct a healthy dataset for training the GMM. In conjunction with other performance evaluation methods, the improved R index and τ-distance index are computed and subsequently standardized to serve as the input feature vector for the GMM.
4.1. Training of GMM Benchmark Model Using Health Data
4.1.1. Training Data Preparation
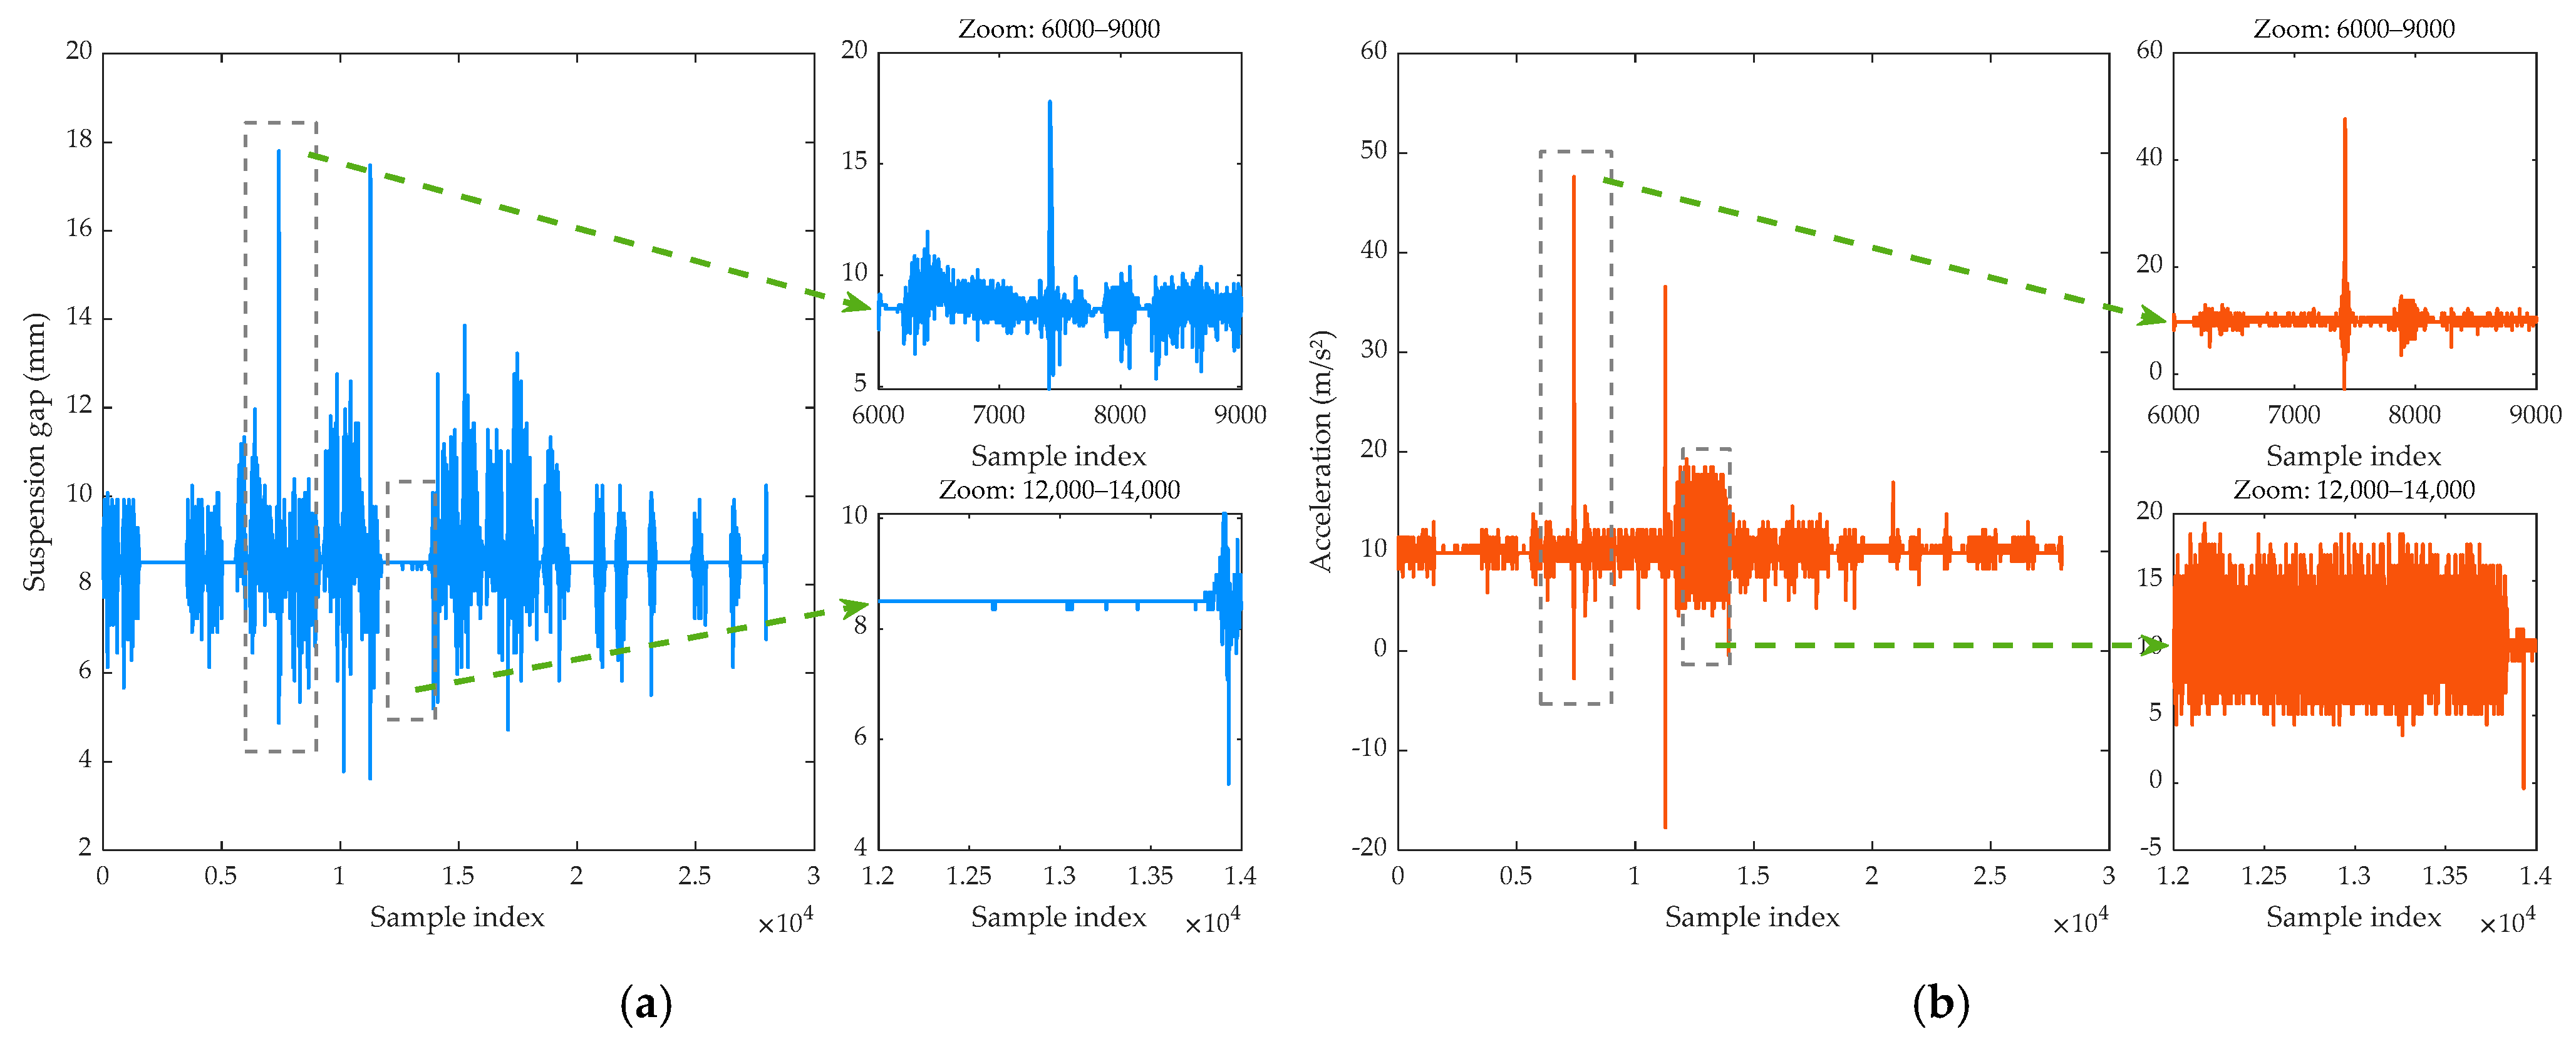
To satisfy the requirements for constructing the GMM, this paper extracts over 30,000 data points from the stable operation phase of the train for feature extraction and modeling. The suspension gap sensor and accelerometer employed in this study for data acquisition have a sampling frequency of 15 Hz, with the measurement direction oriented vertically. The suspension gap sensor features a measurement range of 0–16 mm, while the accelerometer has a range of ±10 g. The operational status of the suspension electromagnet reflected by the data is illustrated in
Figure 3:
The parameters configured for training the GMM in this paper are listed in
Table 1.
4.1.2. GMM Training and Validation Analysis
Following the offline modeling procedure described above, the two extracted indicators are used as inputs and trained using the EM algorithm, with the optimal number of components selected based on the BIC/AIC criteria.
In the preliminary experiment, a dataset containing instances of the suspension system in a levitation failure (landing) state was used for training. However, the resulting GMM exhibited a scattered distribution in the feature space, with significant overlap among components, leading to poor discriminative performance in subsequent evaluations. Further analysis revealed that the suspension failure state differs fundamentally from the normal operational state in terms of motion characteristics and air gap features, with its data distribution lying far from the cluster of normal operating data, effectively forming statistical outliers or independent modes. Incorporating such data into the training process not only compels the GMM to allocate additional Gaussian components to fit these anomalous patterns but also interferes with the accurate modeling of the core operational states.
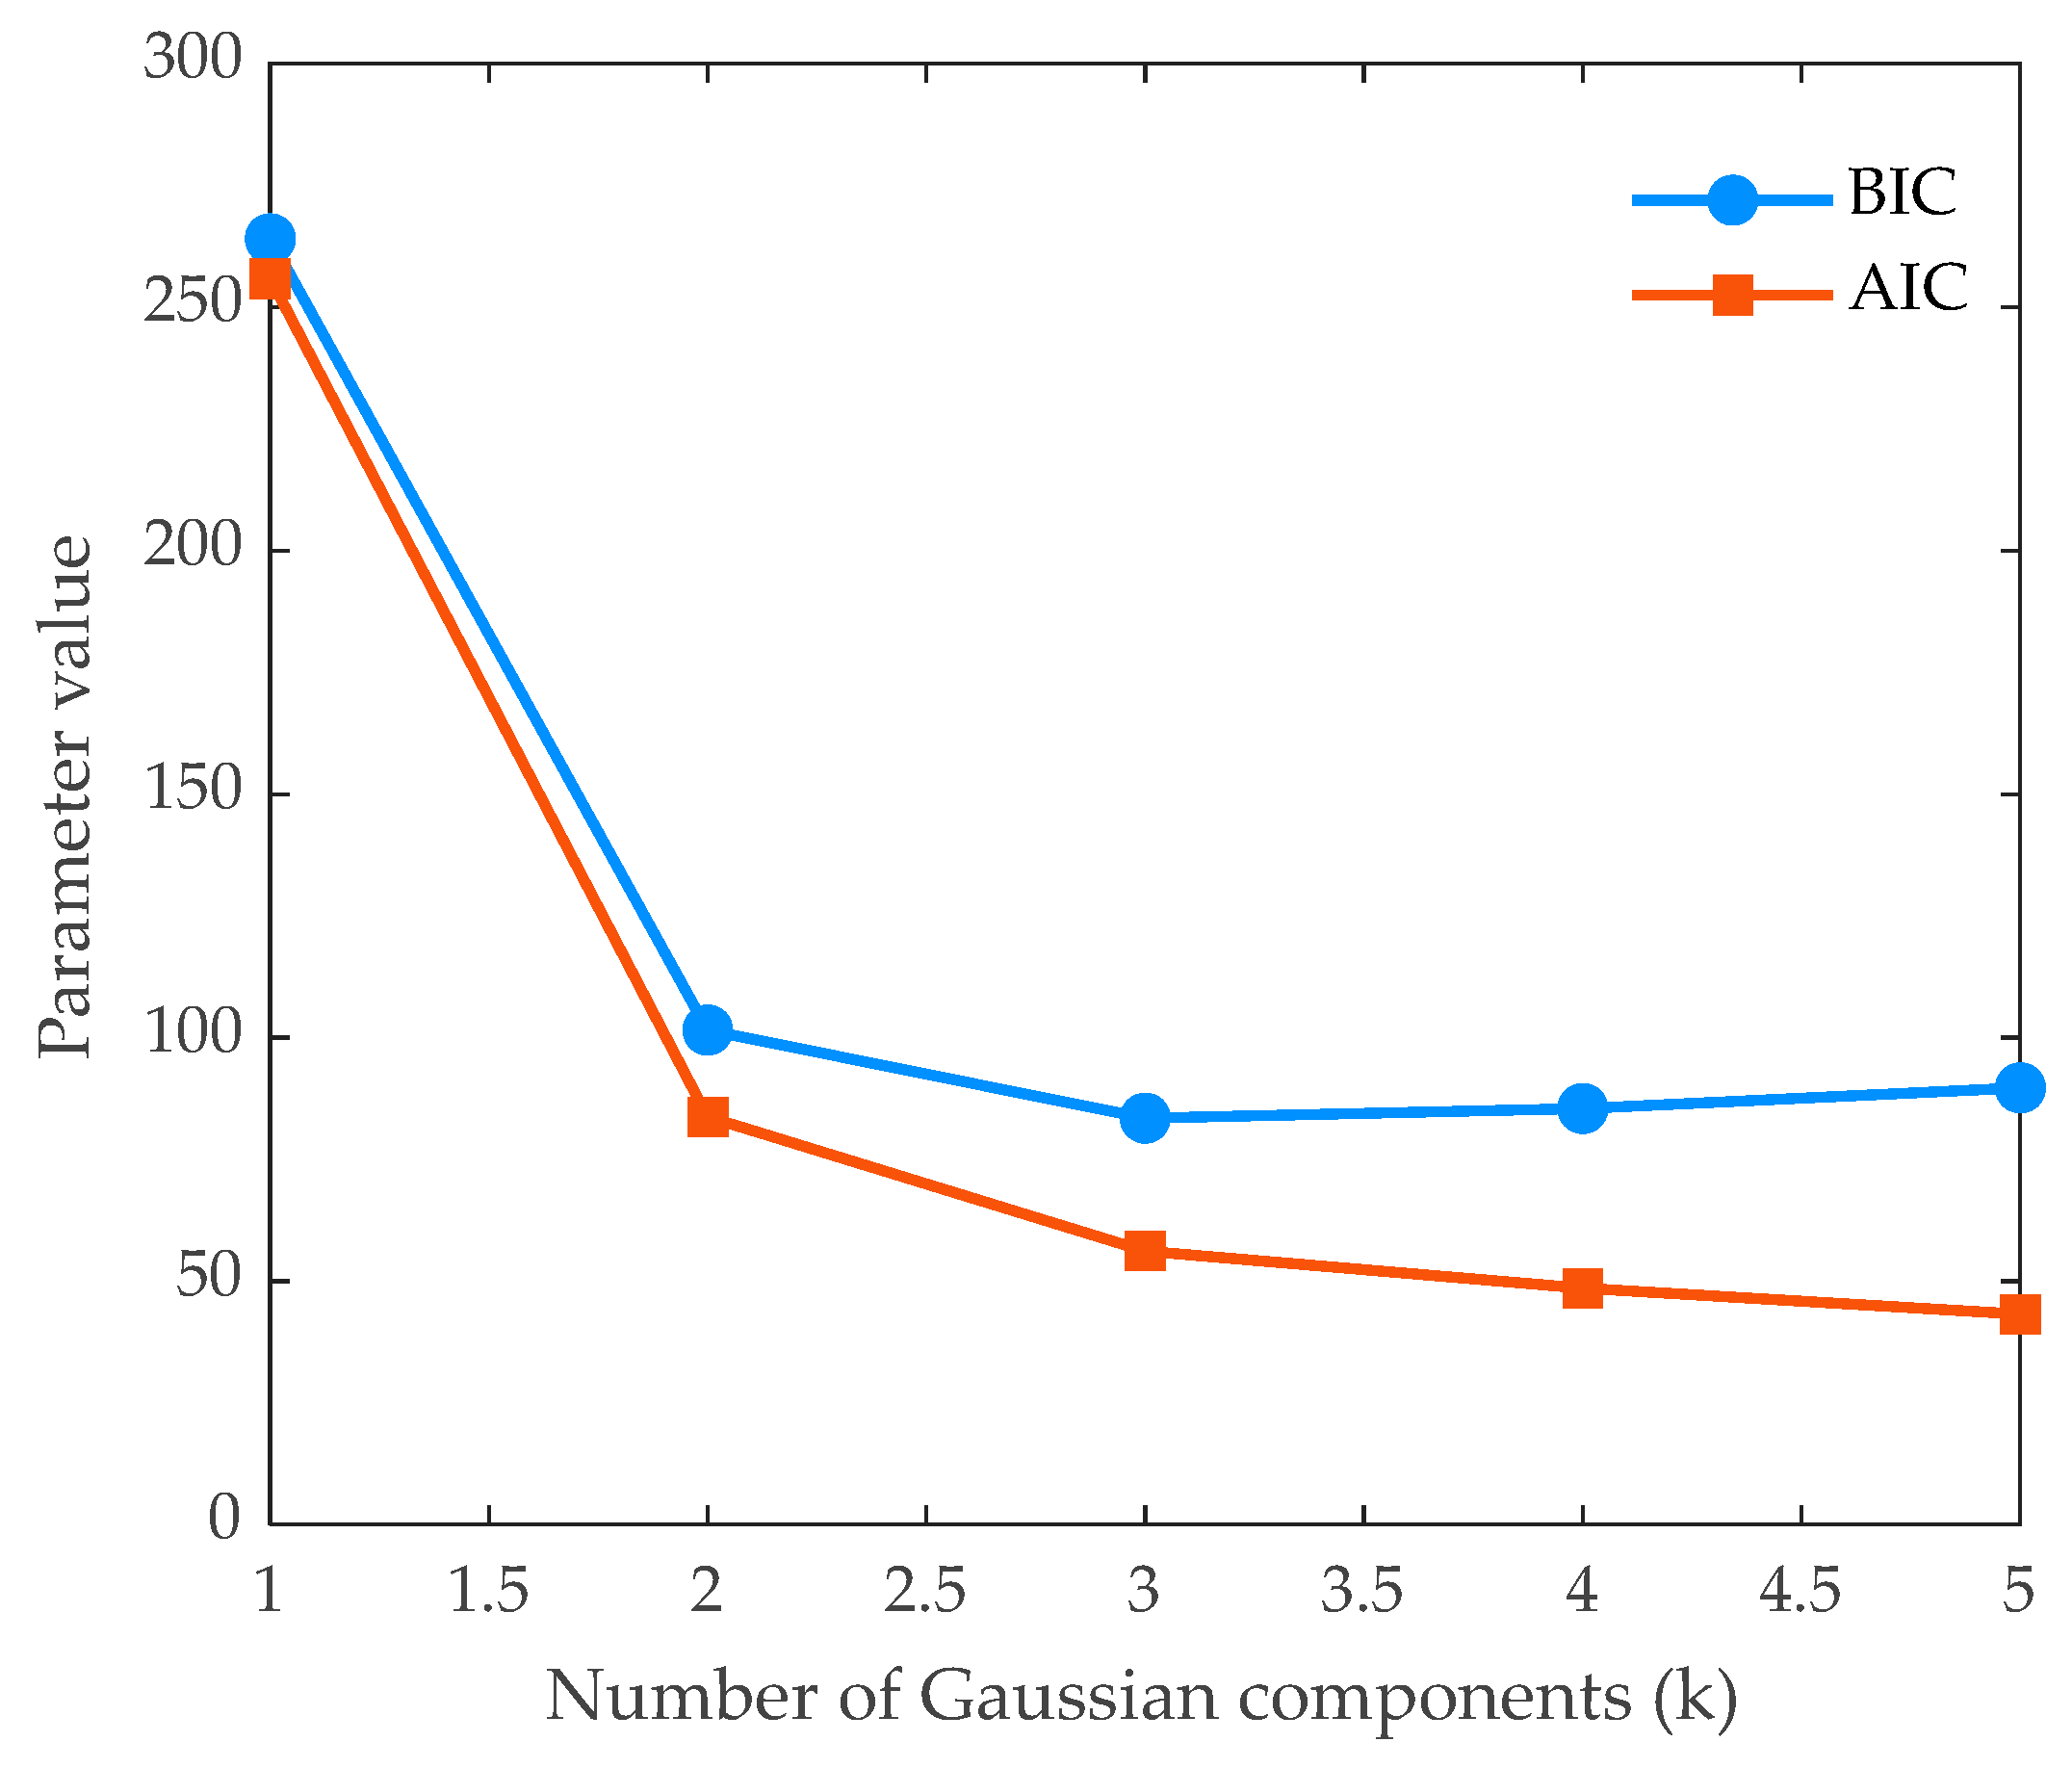
When the suspension system is in the levitation failure (landing) state, both the suspension gap and the gap acceleration remain nearly constant, with the suspension gap deviating notably from the normal levitation range. Therefore, the three-sigma rule is employed to set thresholds for the suspension gap and gap acceleration, thereby eliminating non-target state data associated with the landing condition and ensuring that the data used for modeling correspond to the state of effective and stable levitation operation. After filtering, the computed BIC and AIC values are shown in
Figure 4.
The BIC and AIC curves exhibit a clear inflection point at , with the trend of the curves aligning with expectations. Subsequent evaluation results confirm that the GMM model trained with this selected value of possesses favorable performance discriminability.
The two features—namely the improved
R index and the
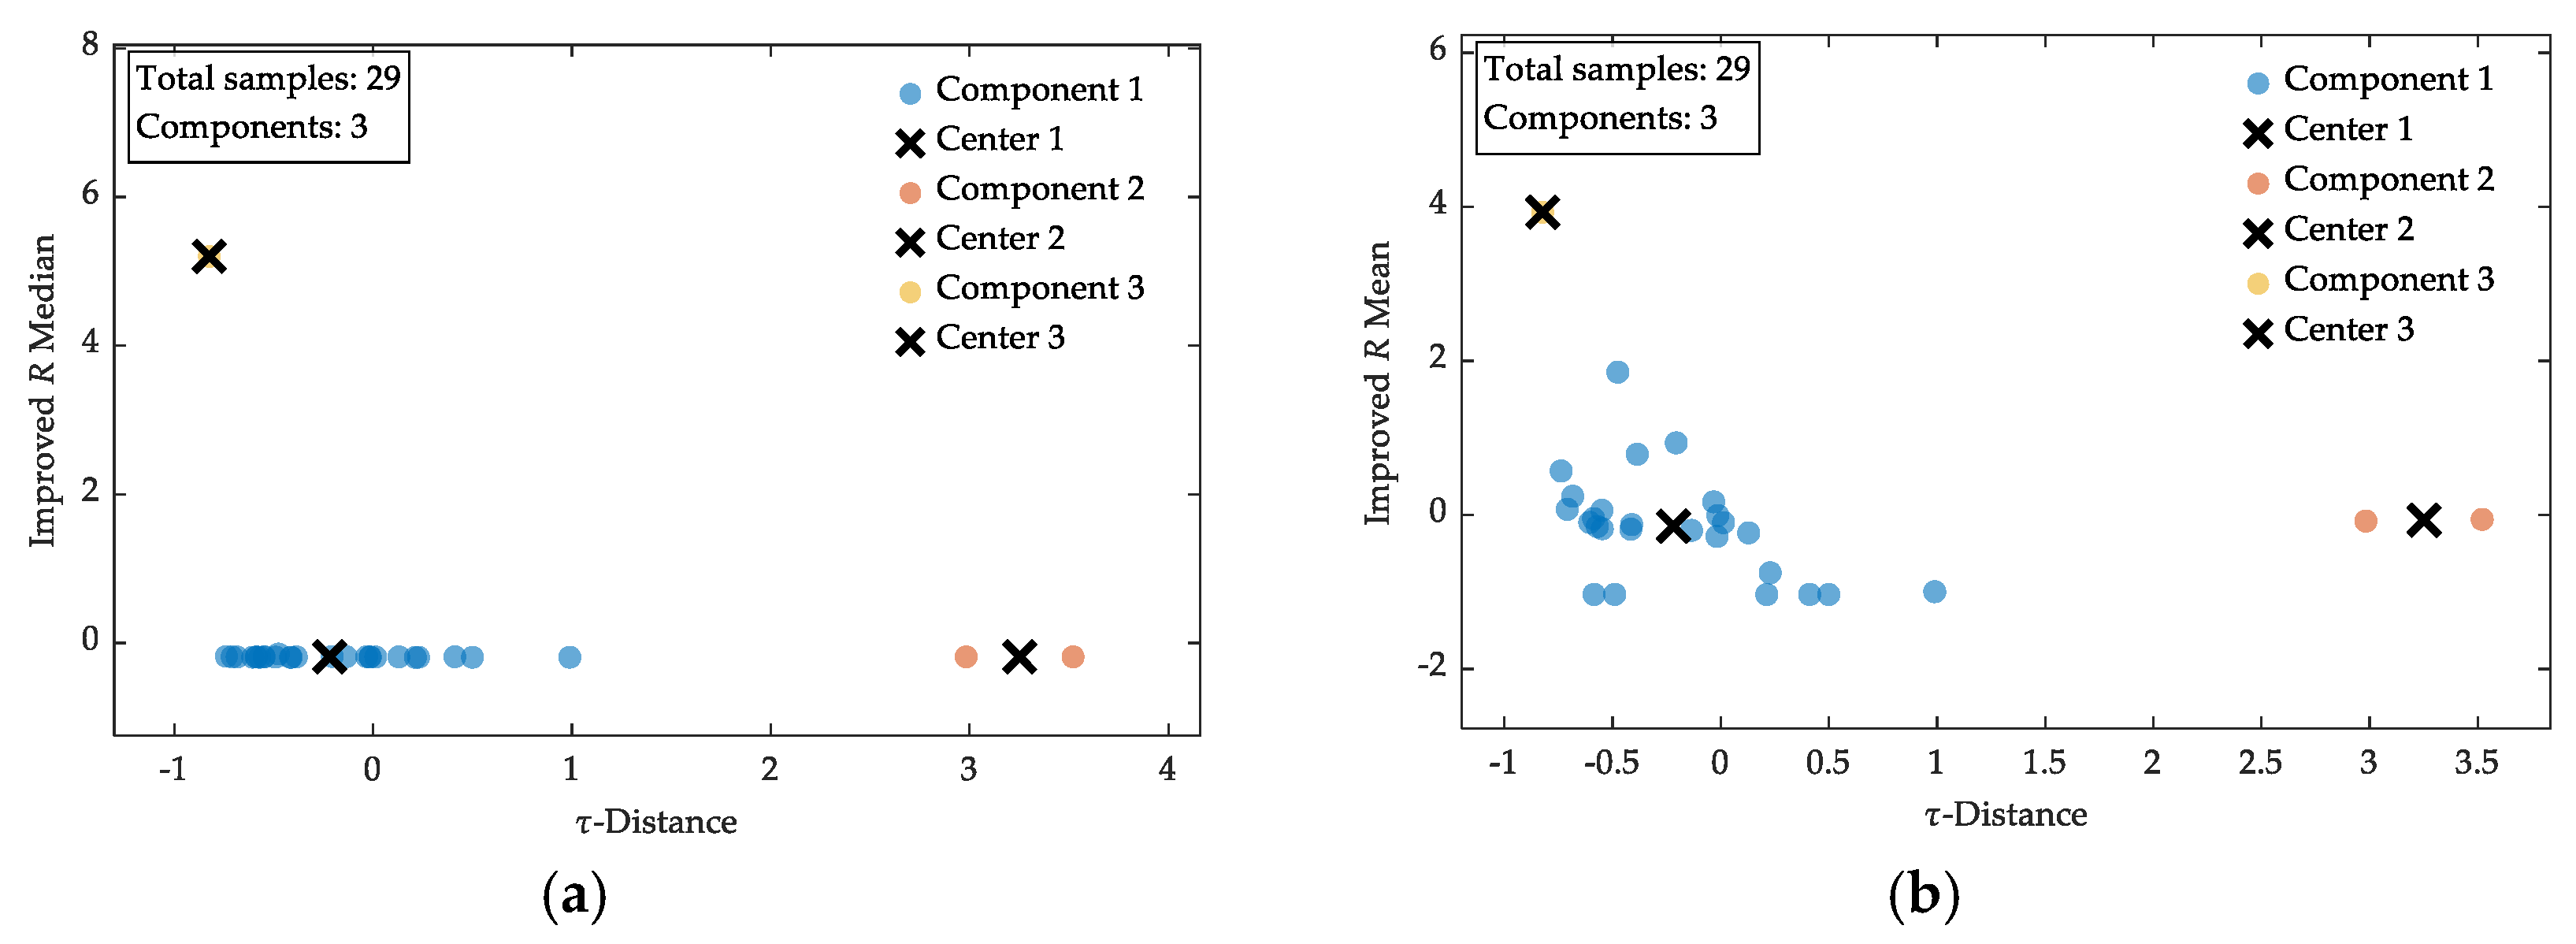
τ-distance index—were extracted using a sliding window approach. Their distribution is illustrated in
Figure 5. As can be observed from the figure, the data features distinctly form three clusters, which corroborates the appropriateness of the component number selected by the BIC and AIC criteria.
Further analysis is conducted on the motion modes corresponding to the three components. Component 1 corresponds to the motion mode with the highest proportion. A comparison with the raw data reveals that this mode is generally in a relatively stable state, where both the suspension gap and acceleration exhibit certain fluctuations while remaining essentially stable overall. Component 2 corresponds to a motion mode appearing only in two data points. Within these windows, the gap fluctuation is relatively small, whereas the acceleration undergoes rapid oscillations, indicating that the system is in a state of dynamic adjustment during this period. Component 3 corresponds to only a single data point, which represents the most stable suspension gap and the smallest acceleration fluctuation in the raw data, signifying a phase of steady levitation.
4.1.3. Health Threshold Determination
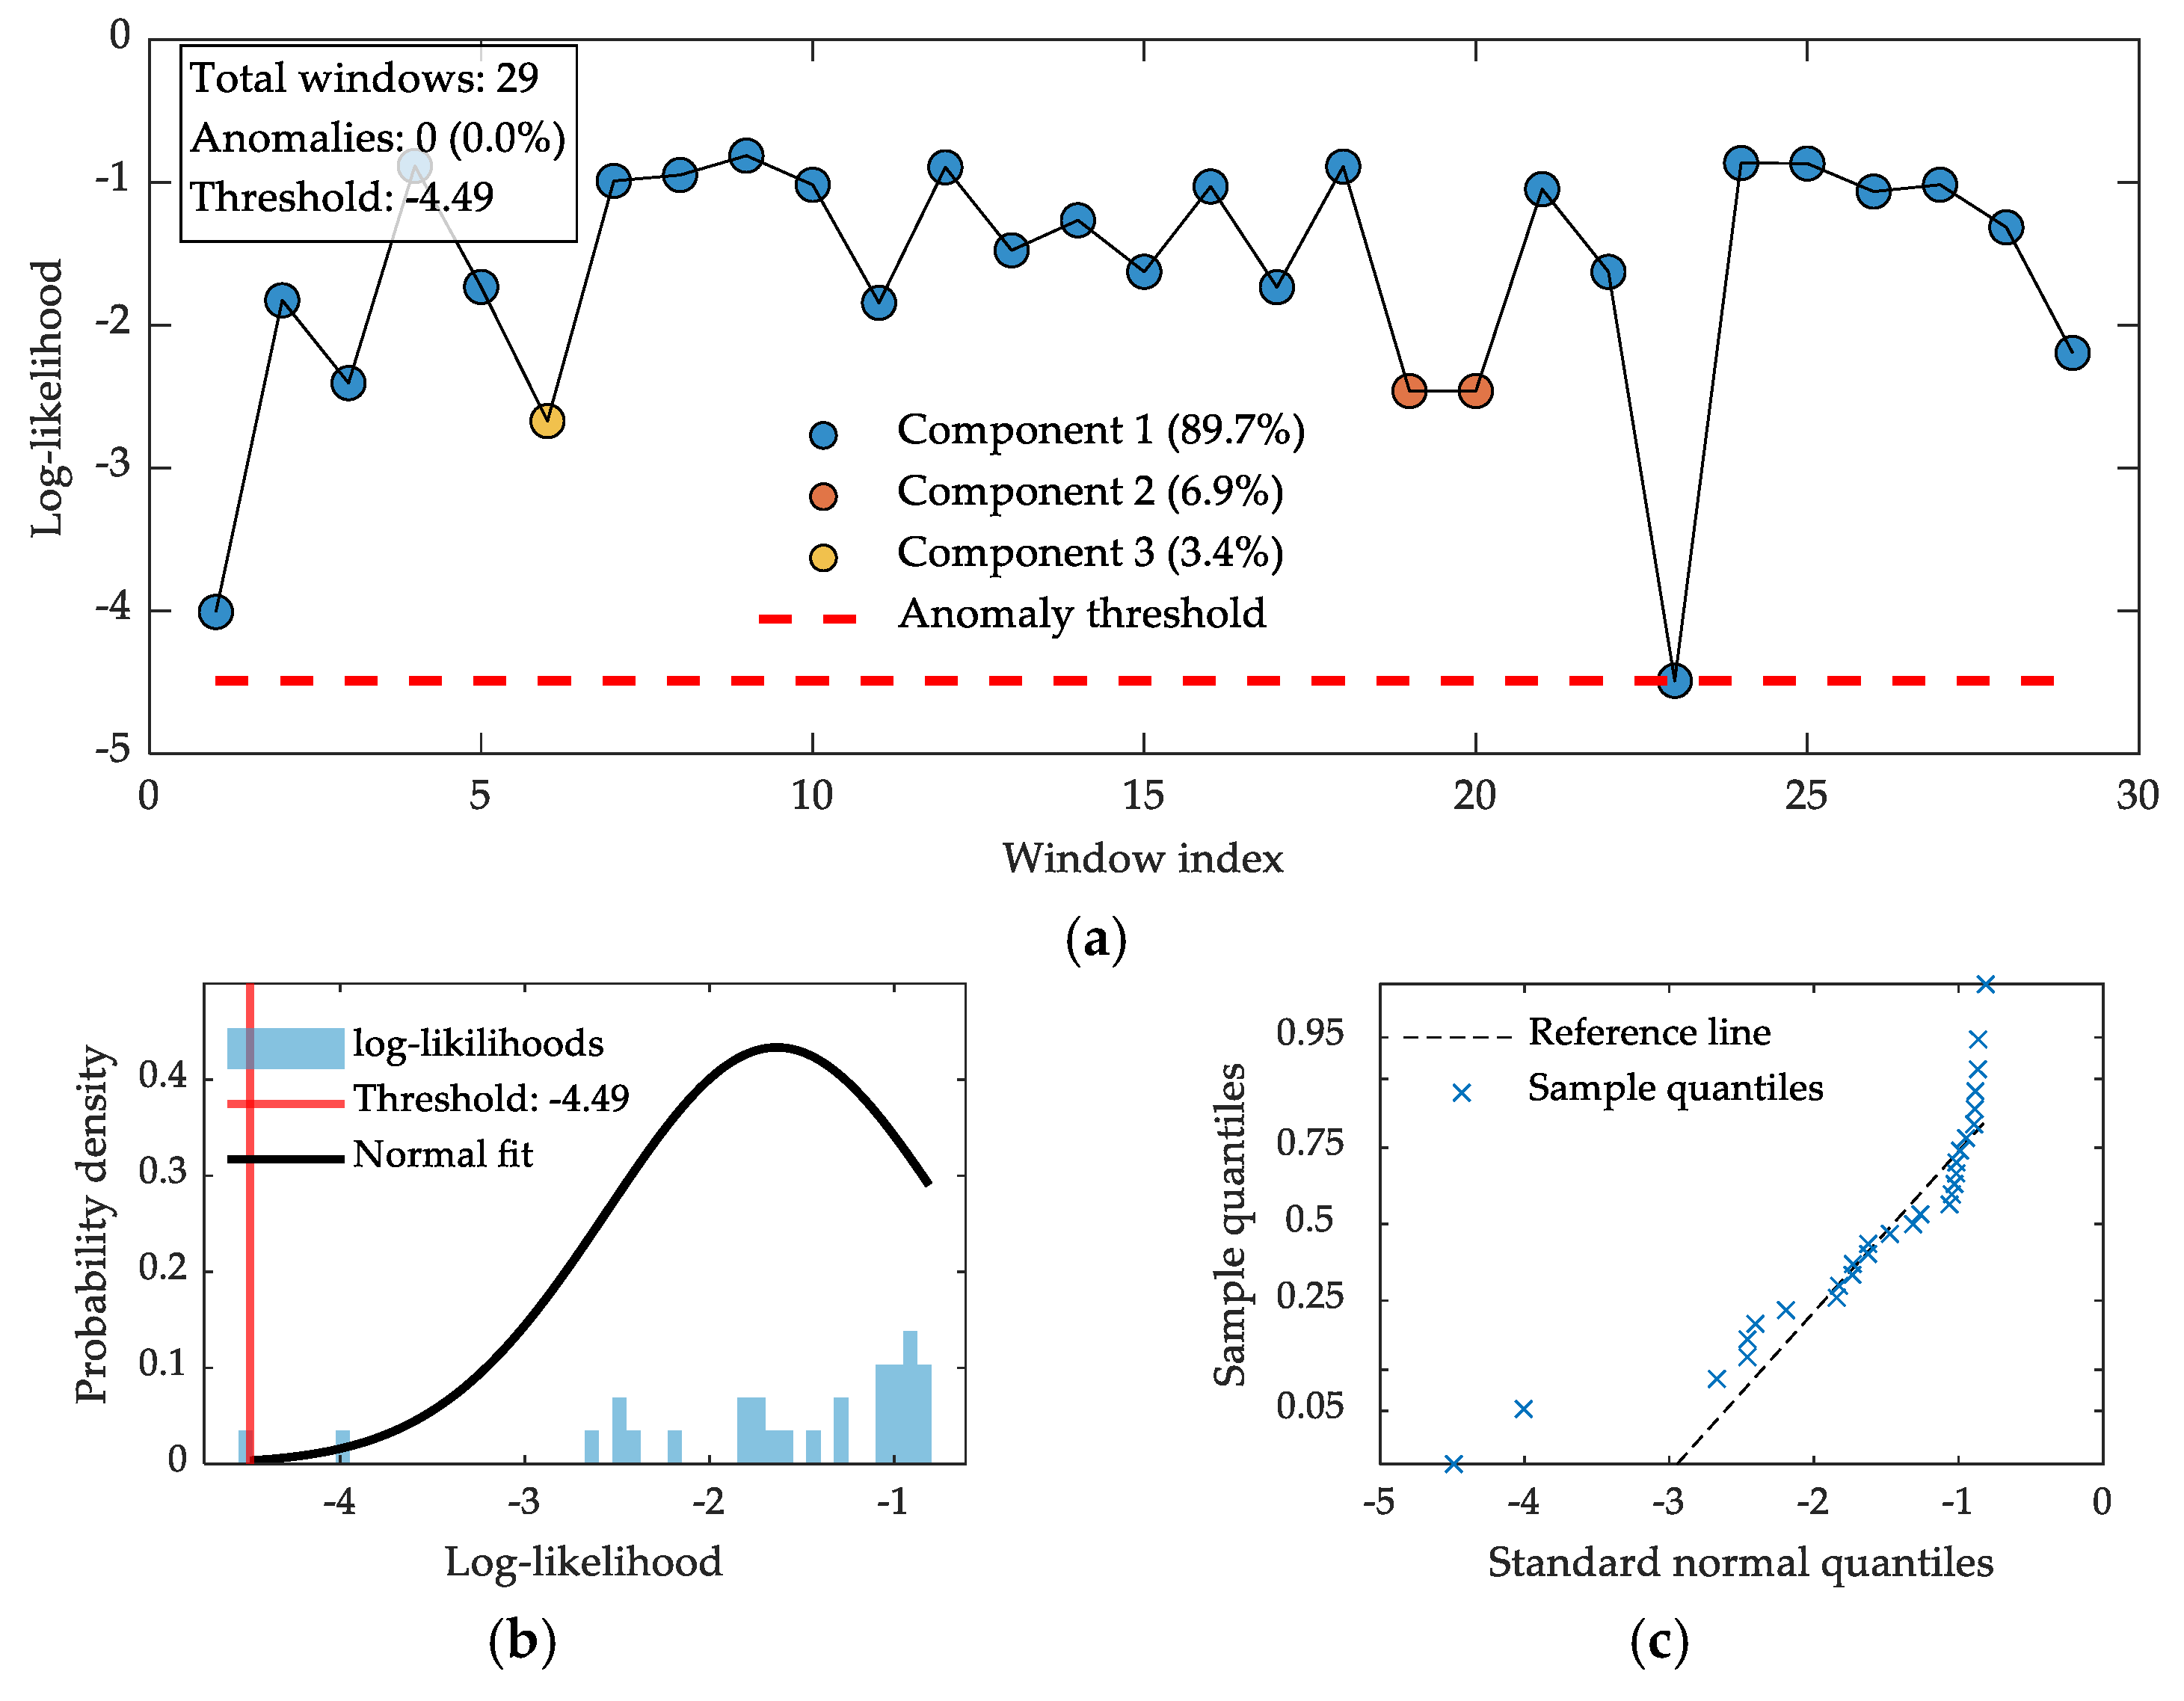
The determination of the health threshold is based on the distribution of log-likelihood values derived from the healthy dataset. First, the overall characteristics and distribution properties of the log-likelihood values of the healthy data are examined, as illustrated in
Figure 6.
The determination of the health threshold is based on the distribution of log-likelihood values obtained from the healthy dataset. An examination of the overall characteristics and distributional properties of these log-likelihood values reveals a left-skewed distribution, rather than an ideal normal distribution. To address this distributional characteristic, three threshold determination methods are compared in this study:
Percentile method: the α-th percentile of the log-likelihood values of the healthy data is adopted. This method does not assume any specific distributional form and relies solely on empirical distribution.
Three-sigma rule: based on the normality assumption, the threshold is set as the mean minus three times the standard deviation. Given that the actual distribution of log-likelihood values is non-normal, the threshold derived from this method tends to be overly conservative.
Minimum-ratio method: taking into account the left-skewed nature of the distribution, the threshold is determined using a minimum-ratio approach.
Table 2 presents the threshold calculation results for different datasets.
To ensure high sensitivity of the evaluation system (i.e., minimizing the false negative rate), a conservative selection strategy is adopted: the final threshold is taken as the minimum value among the three methods, with a safety lower bound not lower than the minimum observed value in the healthy data. This strategy ensures high sensitivity to early performance degradation, avoids inappropriate threshold settings due to violations of distributional assumptions, and provides a consistent and reliable evaluation benchmark in practical applications. It can be observed that, owing to the non-normality of the log-likelihood values, the threshold derived from the three-sigma rule tends to be excessively low; consequently, the final threshold is set as the minimum value among the data.
4.2. Comprehensive Evaluation Results and Analysis
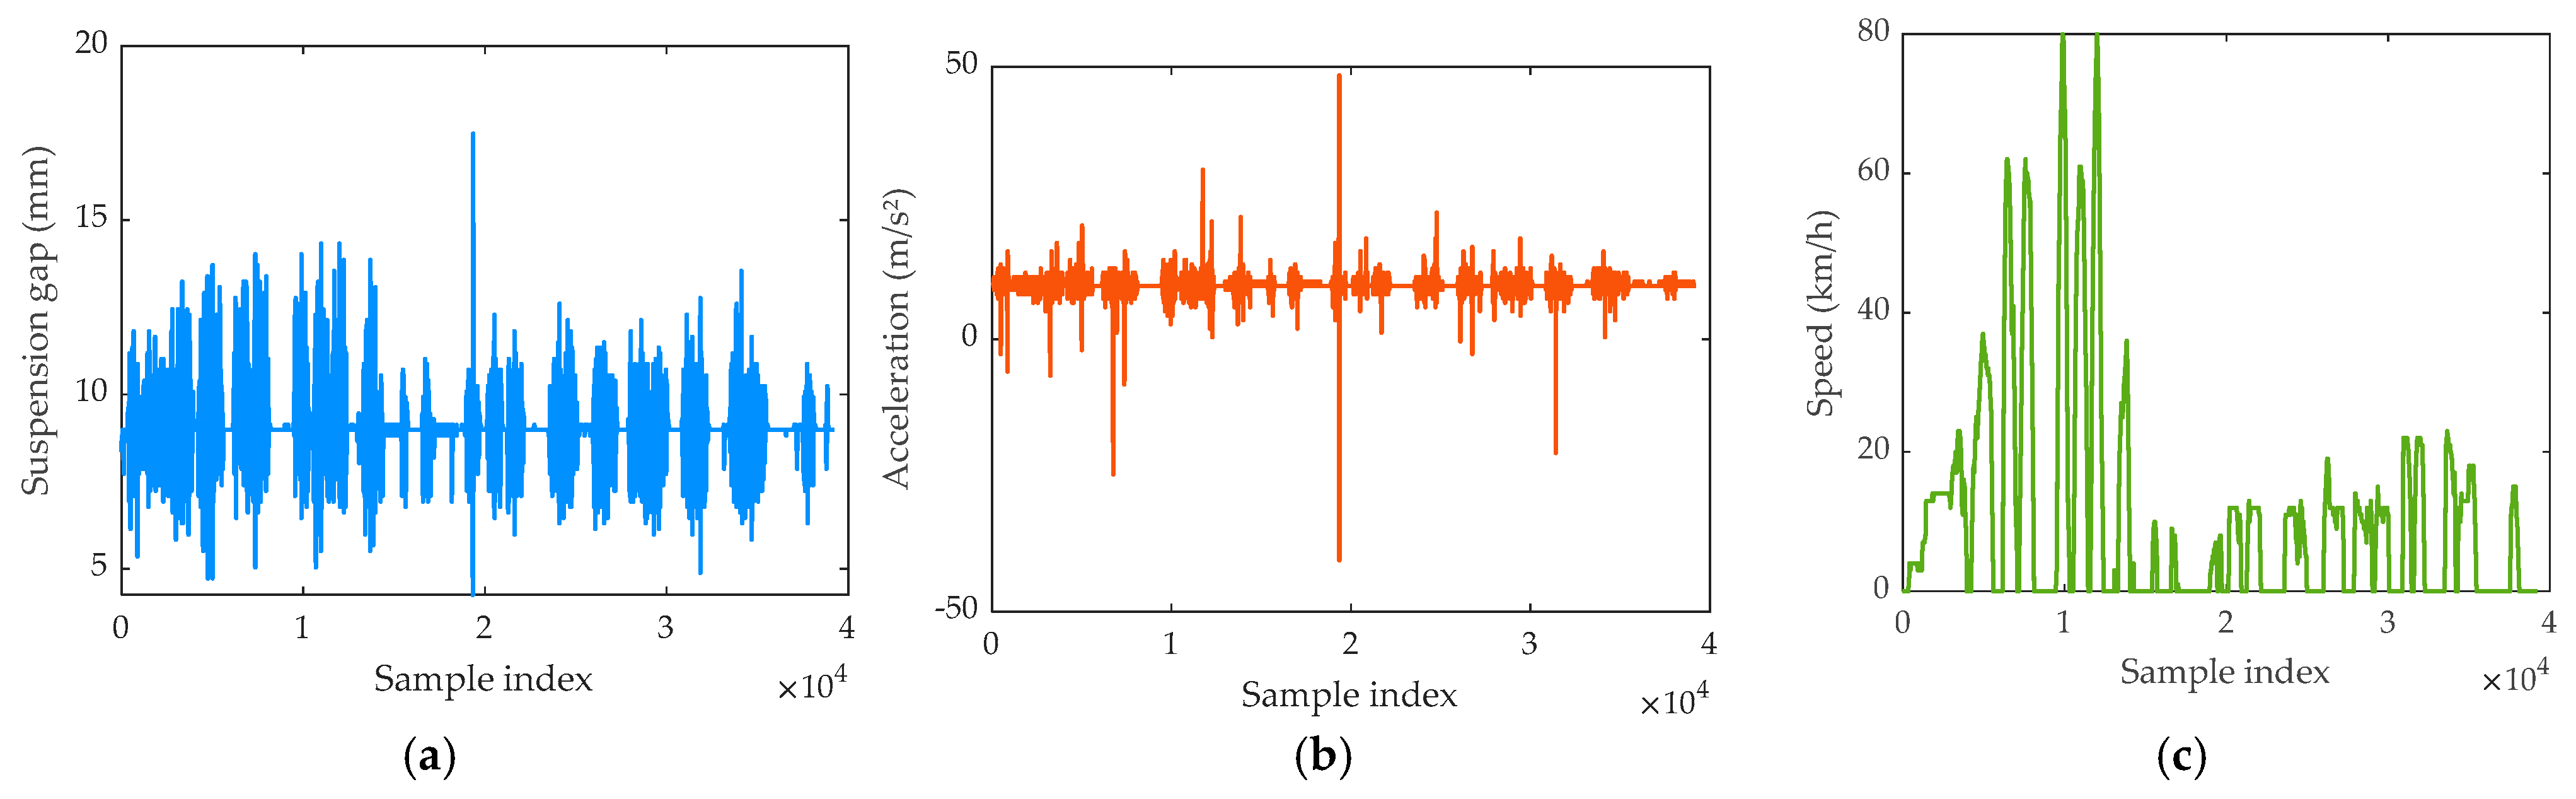
The evaluation data selected in this paper are derived from field measurements acquired from the Fenghuang Maglev Express. The operating speed ranges from 0 to 60 km/h under no-load conditions. As illustrated in
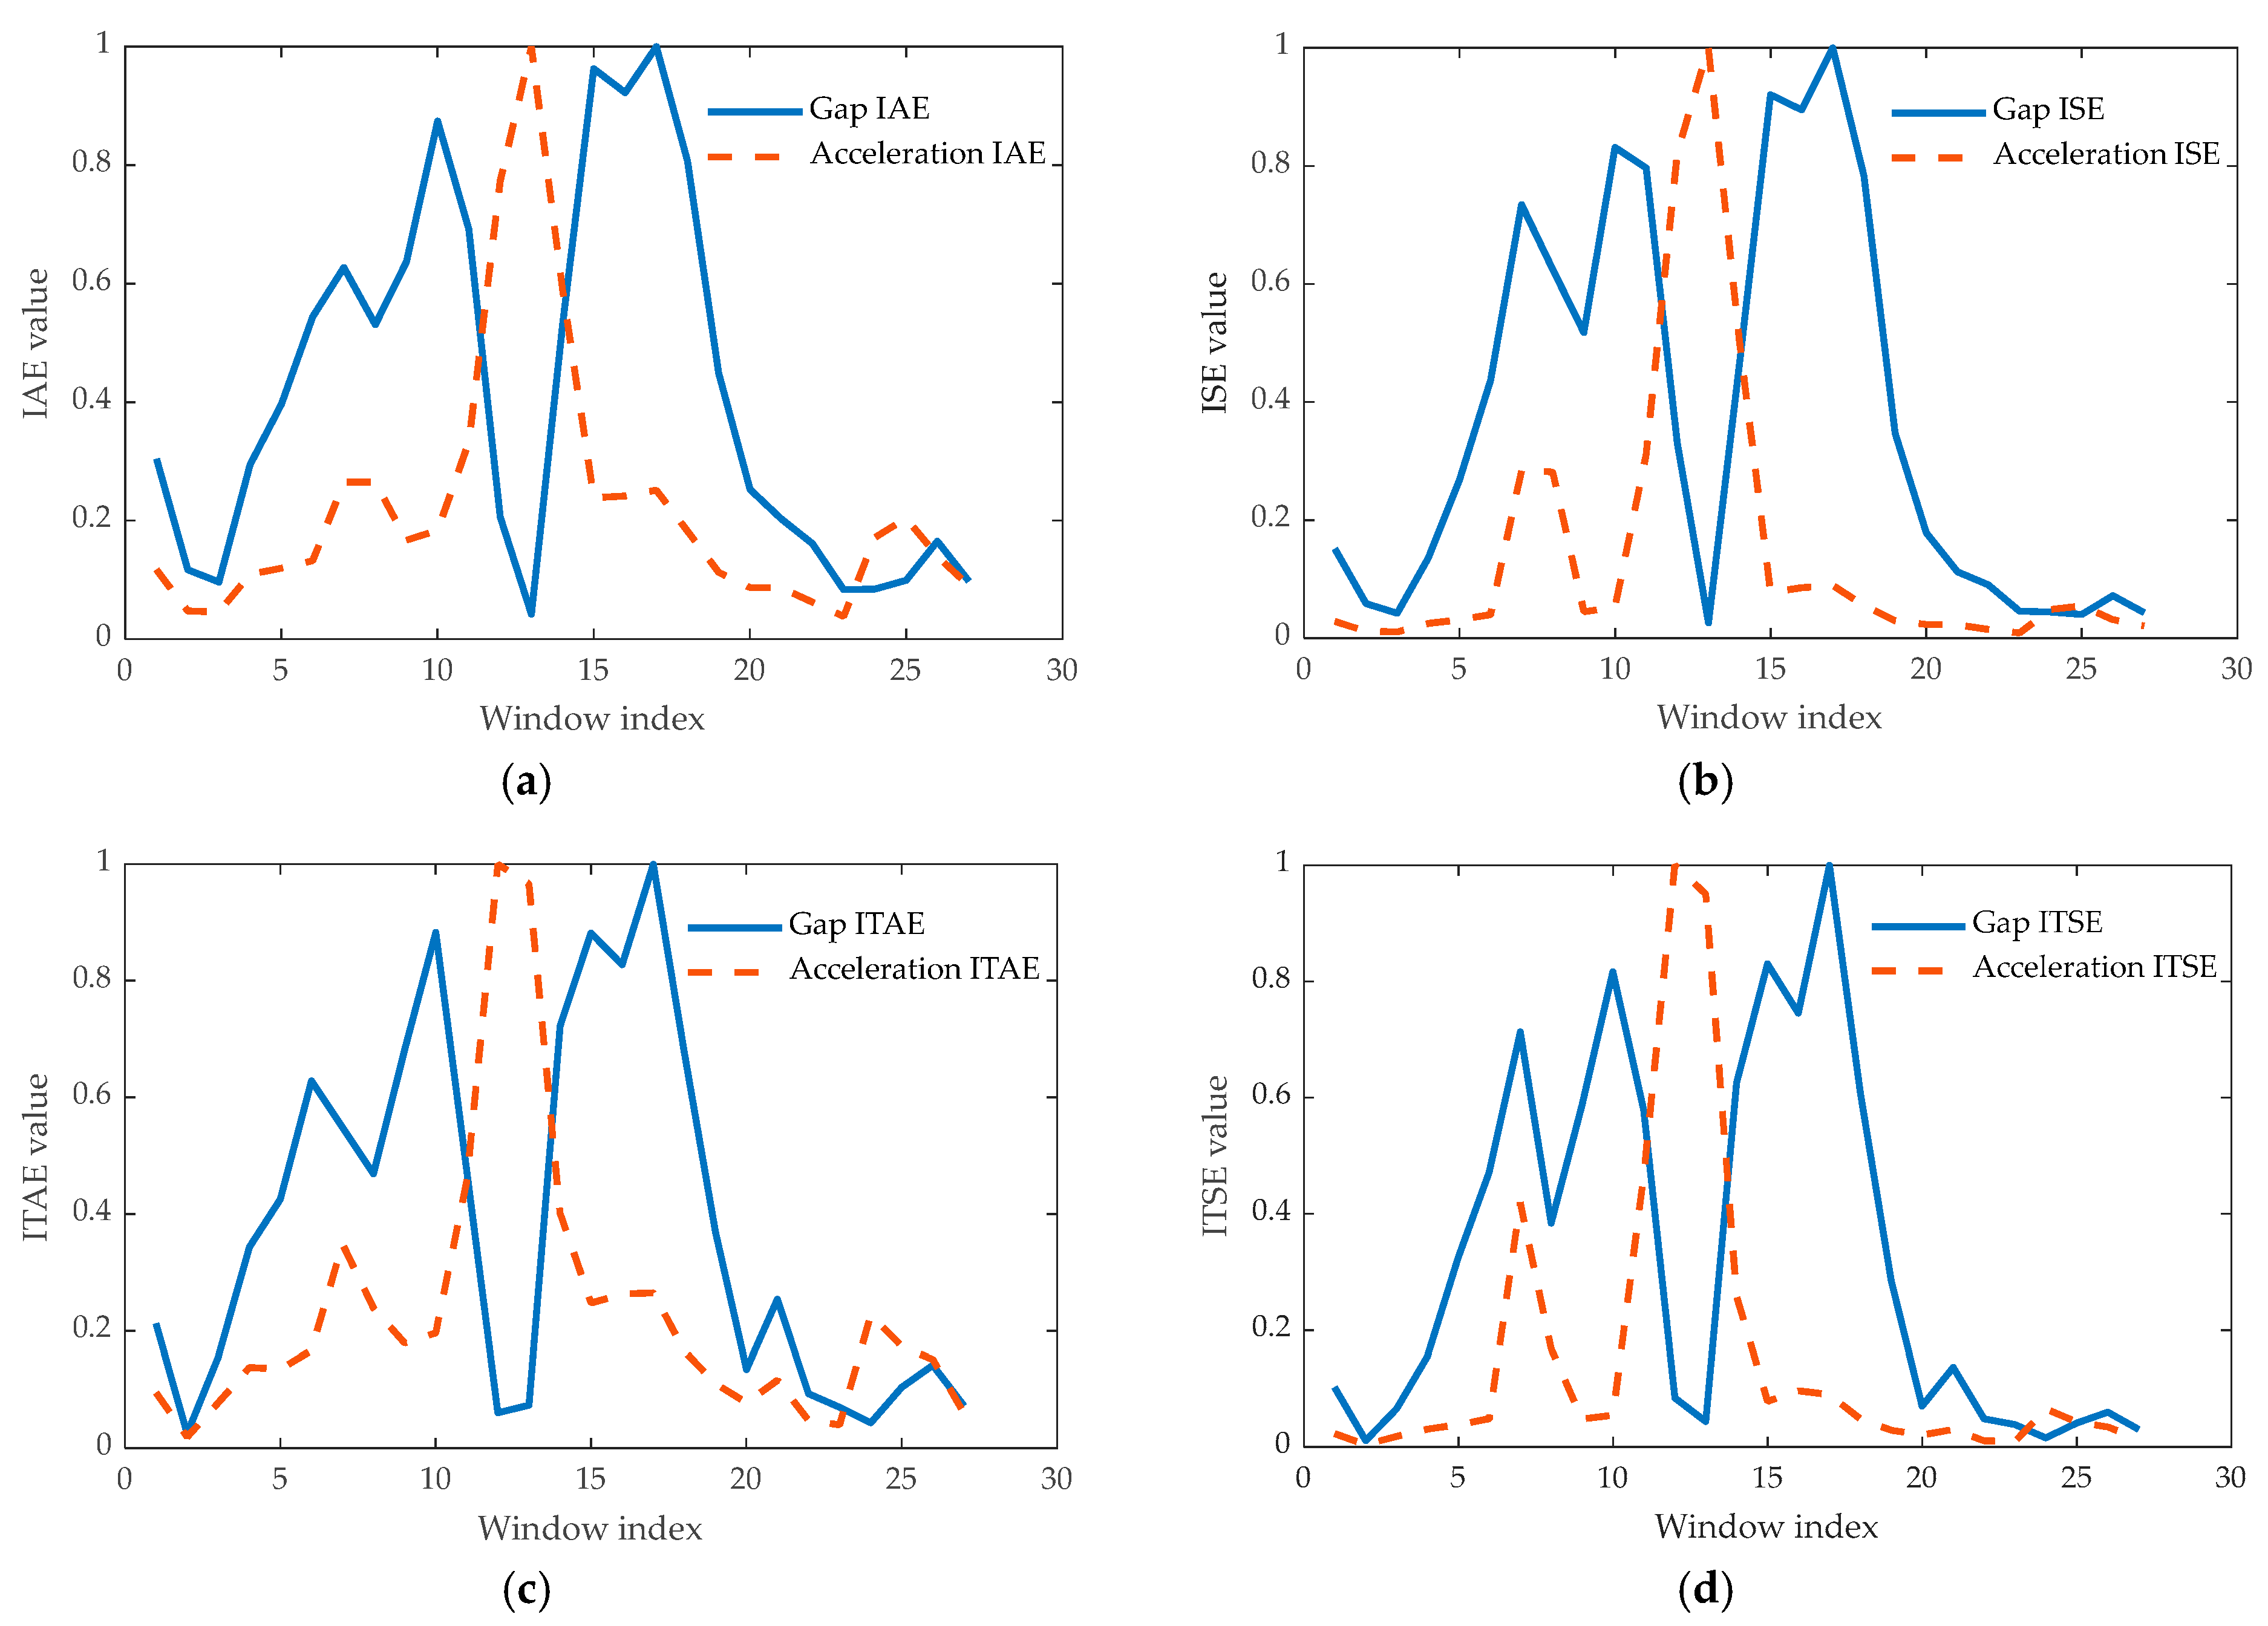
Figure 7, this segment of operational data encompasses various operating conditions, including stable operation, minor disturbances, and severe fluctuations, thereby exhibiting a certain degree of generalizability. To validate the effectiveness of the proposed method, four error integral performance indices were selected for comparative validation. The computed results of these indices are presented in
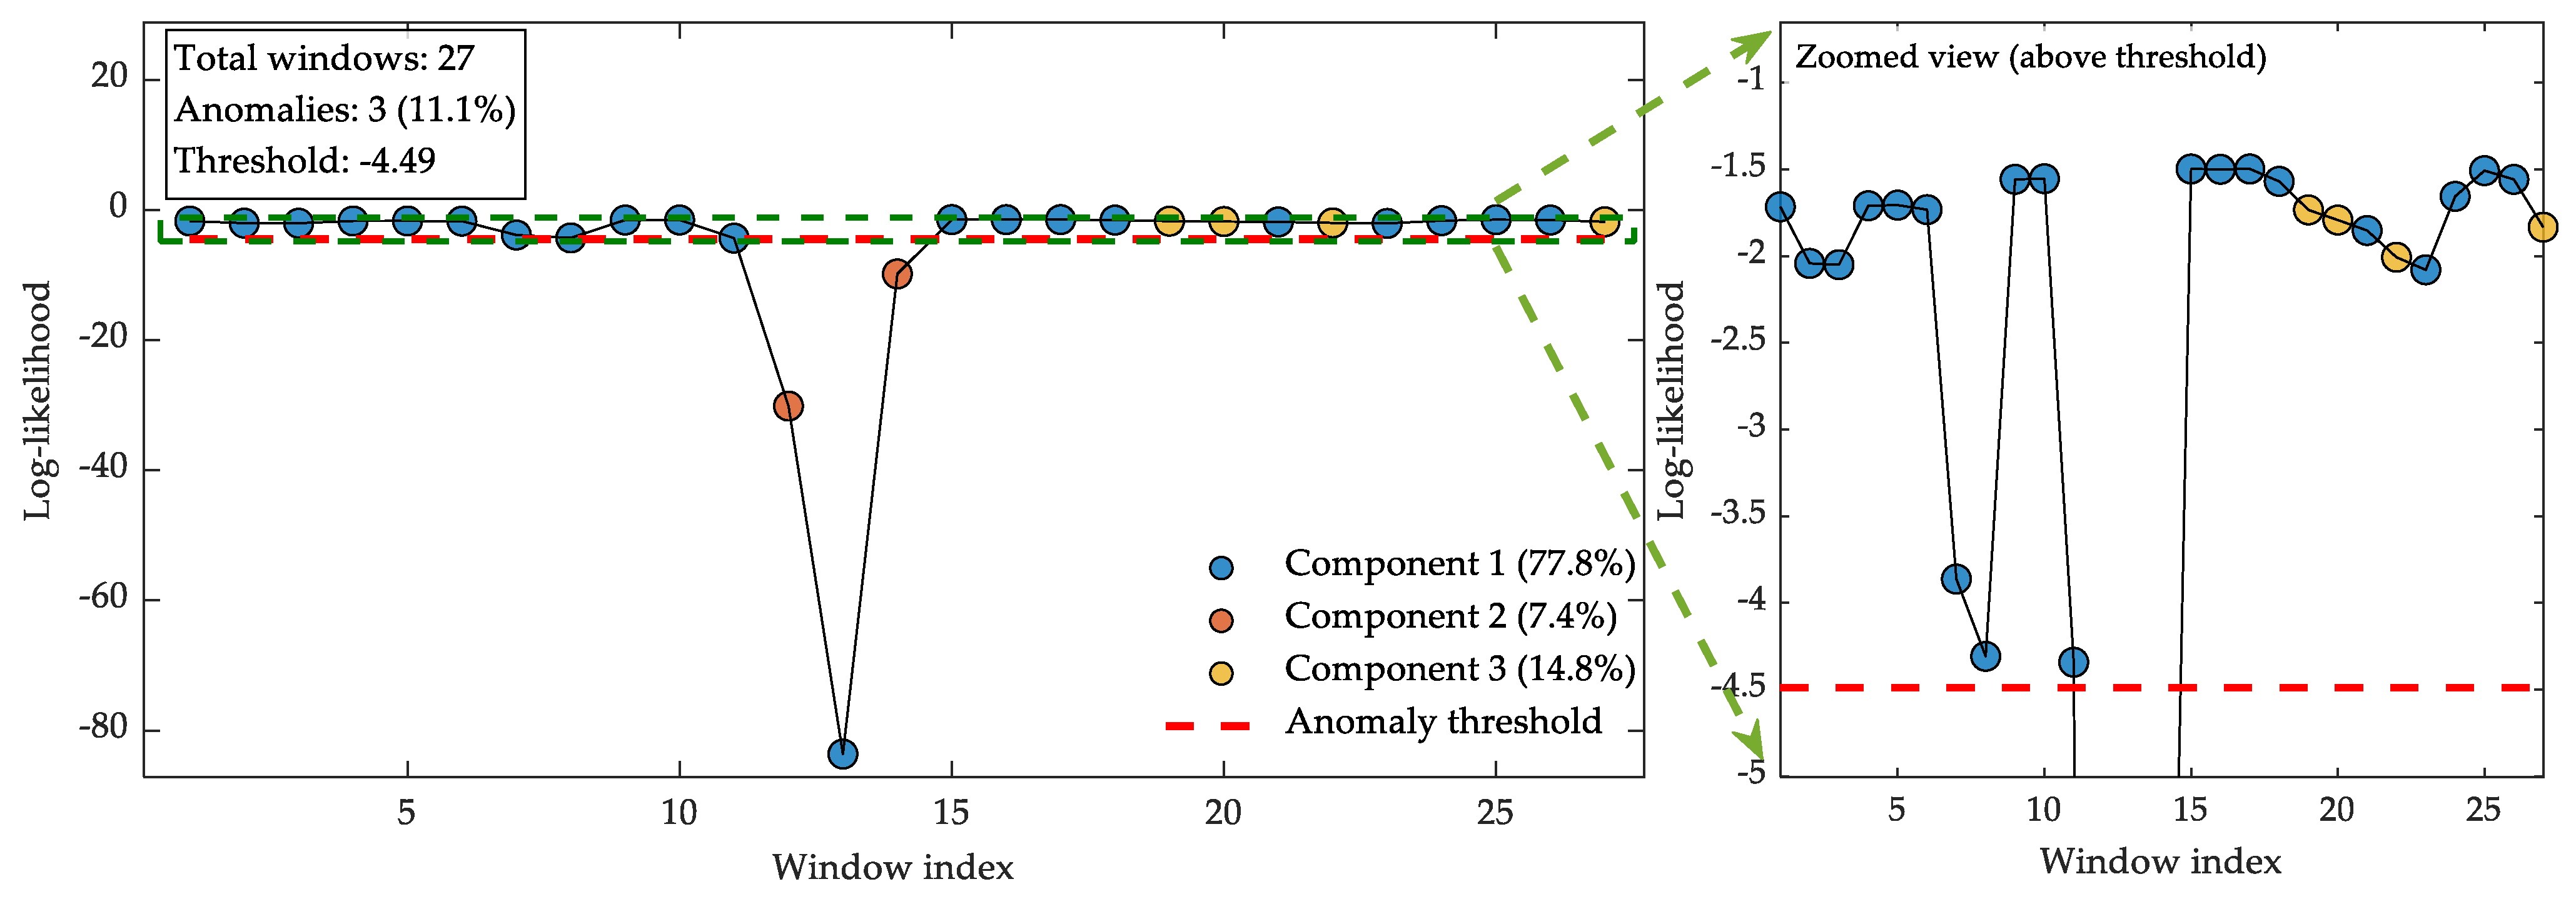
Figure 8. Based on the trained GMM, the suspension data were evaluated, and the comprehensive evaluation and log-likelihood values are presented in
Figure 9.
A comparison with traditional performance evaluation indices reveals that, in terms of overall trend, the proposed GMM-based comprehensive evaluation framework exhibits strong holistic assessment capability, demonstrating high consistency with the error integral performance indices.
4.2.1. Analysis of Computing Time
To verify the real-time performance of the proposed method in engineering applications, the computation time of the GMM-based indices is statistically analyzed. The experiments are conducted on the MATLAB R2024b platform, with the runtime environment consisting of an 11th Gen Intel(R) Core(TM) i7-1195G7 @ 2.90 GHz (2.92 GHz) processor and 16 GB of RAM. A sliding time window is adopted for online processing of the test data, yielding a total of 27 time windows.
Table 3 summarizes the distribution of the computation time for the GMM-based indices across the time windows. The total computation time is 0.2455 s, with an average of only 0.0091 s per window. The maximum single-window computation time is 0.2054 s (the first window, which includes the overhead of model loading and initialization), and the median computation time is 0.0003 s. Except for the first window, the computation time for all remaining windows is significantly shorter than the window step size, indicating that the proposed method meets the requirements for online real-time monitoring. Furthermore, the standard deviation of the computation time is 0.0394 s, demonstrating that the computational load of the method remains stable under different operating conditions and that it is feasible for online deployment in engineering practice. Based on these results, this section further analyzes the evaluation performance of the GMM-based method for the suspension system.
4.2.2. Analysis of Motion Mode Recognition
The evaluation results presented in this paper assess the motion modes of the measured data. Overall, the suspension system predominantly operates in the state corresponding to Component 1, i.e., a relatively stable condition, which is consistent with the data. Among the time windows, windows 19, 20, 22, and 27 are classified as the motion state of Component 3, namely the steady levitation phase. Examination of the raw data reveals that within these four windows, the overall suspension gap exhibits minor fluctuations and remains at the nominal levitation gap for most of the time, accompanied by small acceleration fluctuations—findings that are in good agreement with the evaluation results. Windows 12 and 14 are identified as corresponding to Component 2 (i.e., the dynamic adjustment phase); however, their log-likelihood values fall below the health threshold, indicating anomalies. A detailed analysis of this phenomenon will be presented in the subsequent log-likelihood analysis section. Overall, the baseline model established from healthy data can accurately identify the motion states of the suspension system, thereby significantly enhancing the interpretability of the proposed evaluation method.
4.2.3. Log-Likelihood Analysis
Since the four error integral performance indices exhibit consistent trends, two of them, namely IAE and ISE, are selected for comparative presentation. The comprehensive analysis results are shown in
Table 4.
Among the first ten windows, we first compare the initial three windows, in which the conventional performance evaluation indices exhibit relatively low values, and the suspension system operates most stably in the second and third windows. In contrast, the log-likelihood values derived from the GMM for the second and third windows are notably distinct from those of the first window, indicating that the operating mode in these windows deviates slightly from the established health model. Further analysis reveals that, owing to multiple factors such as track irregularities and vehicle load variations, the suspension system remains in a state of dynamic adjustment for a larger proportion of its operation, a characteristic also preserved in the healthy dataset. Consequently, within the GMM framework, the operating mode characterized by maintaining a nominally rated suspension gap with minimal acceleration fluctuation is clearly distinguished from the dynamic adjustment mode, yielding comparatively lower log-likelihood values while still remaining within the healthy operating regime. In the seventh and eighth windows, pronounced fluctuations are distinctly observable compared to the other windows. The error integral performance indices exhibit relatively high values, which align with the evaluation results obtained from the proposed comprehensive evaluation framework. Owing to a substantial deviation in the operational mode from the established GMM, a clear discrepancy is evident in the log-likelihood assessment. Nevertheless, as the system remains within the healthy operating range, no early warning is triggered.
Next, comparing the eleventh to fourteenth time windows, it can be observed that the proposed comprehensive evaluation framework yields an extremely low assessment near the thirteenth window, at which point a discrepancy arises between this evaluation and the error integral performance indices. Examination of the measured data reveals that within this segment, the fluctuations in gap and acceleration remain within normal ranges; however, the gap fluctuation of the suspension system is nearly zero, while the acceleration is concurrently undergoing pronounced oscillations—a phenomenon clearly inconsistent with the actual operational state, potentially indicating anomalies in the gap sensor or accelerometer. This suggests that, in addition to enabling comprehensive assessment of the suspension system, the GMM trained on healthy operational data can also serve a certain early-warning and monitoring function.
Finally, attention is directed to the evaluation results for the fifteenth through twenty-ninth time windows. Comparing the three data points corresponding to the fifteenth, sixteenth, and seventeenth windows, the error integral performance indices for acceleration indicate substantial fluctuations in acceleration across these three windows, while the error integral performance indices for gap exhibit slight differences, suggesting that the motion states of the suspension system within these windows are highly similar—a finding consistent with the results obtained from the proposed evaluation framework. In contrast, at the twenty-second data point, the fluctuations in both suspension gap and acceleration are comparatively smaller, representing a motion state distinct from that observed in the aforementioned three windows, thereby yielding a more pronounced differentiation in the evaluation outcomes. This observation further substantiates the effectiveness of the proposed method.
4.2.4. Experimental Analysis Results Under Different Operating Conditions
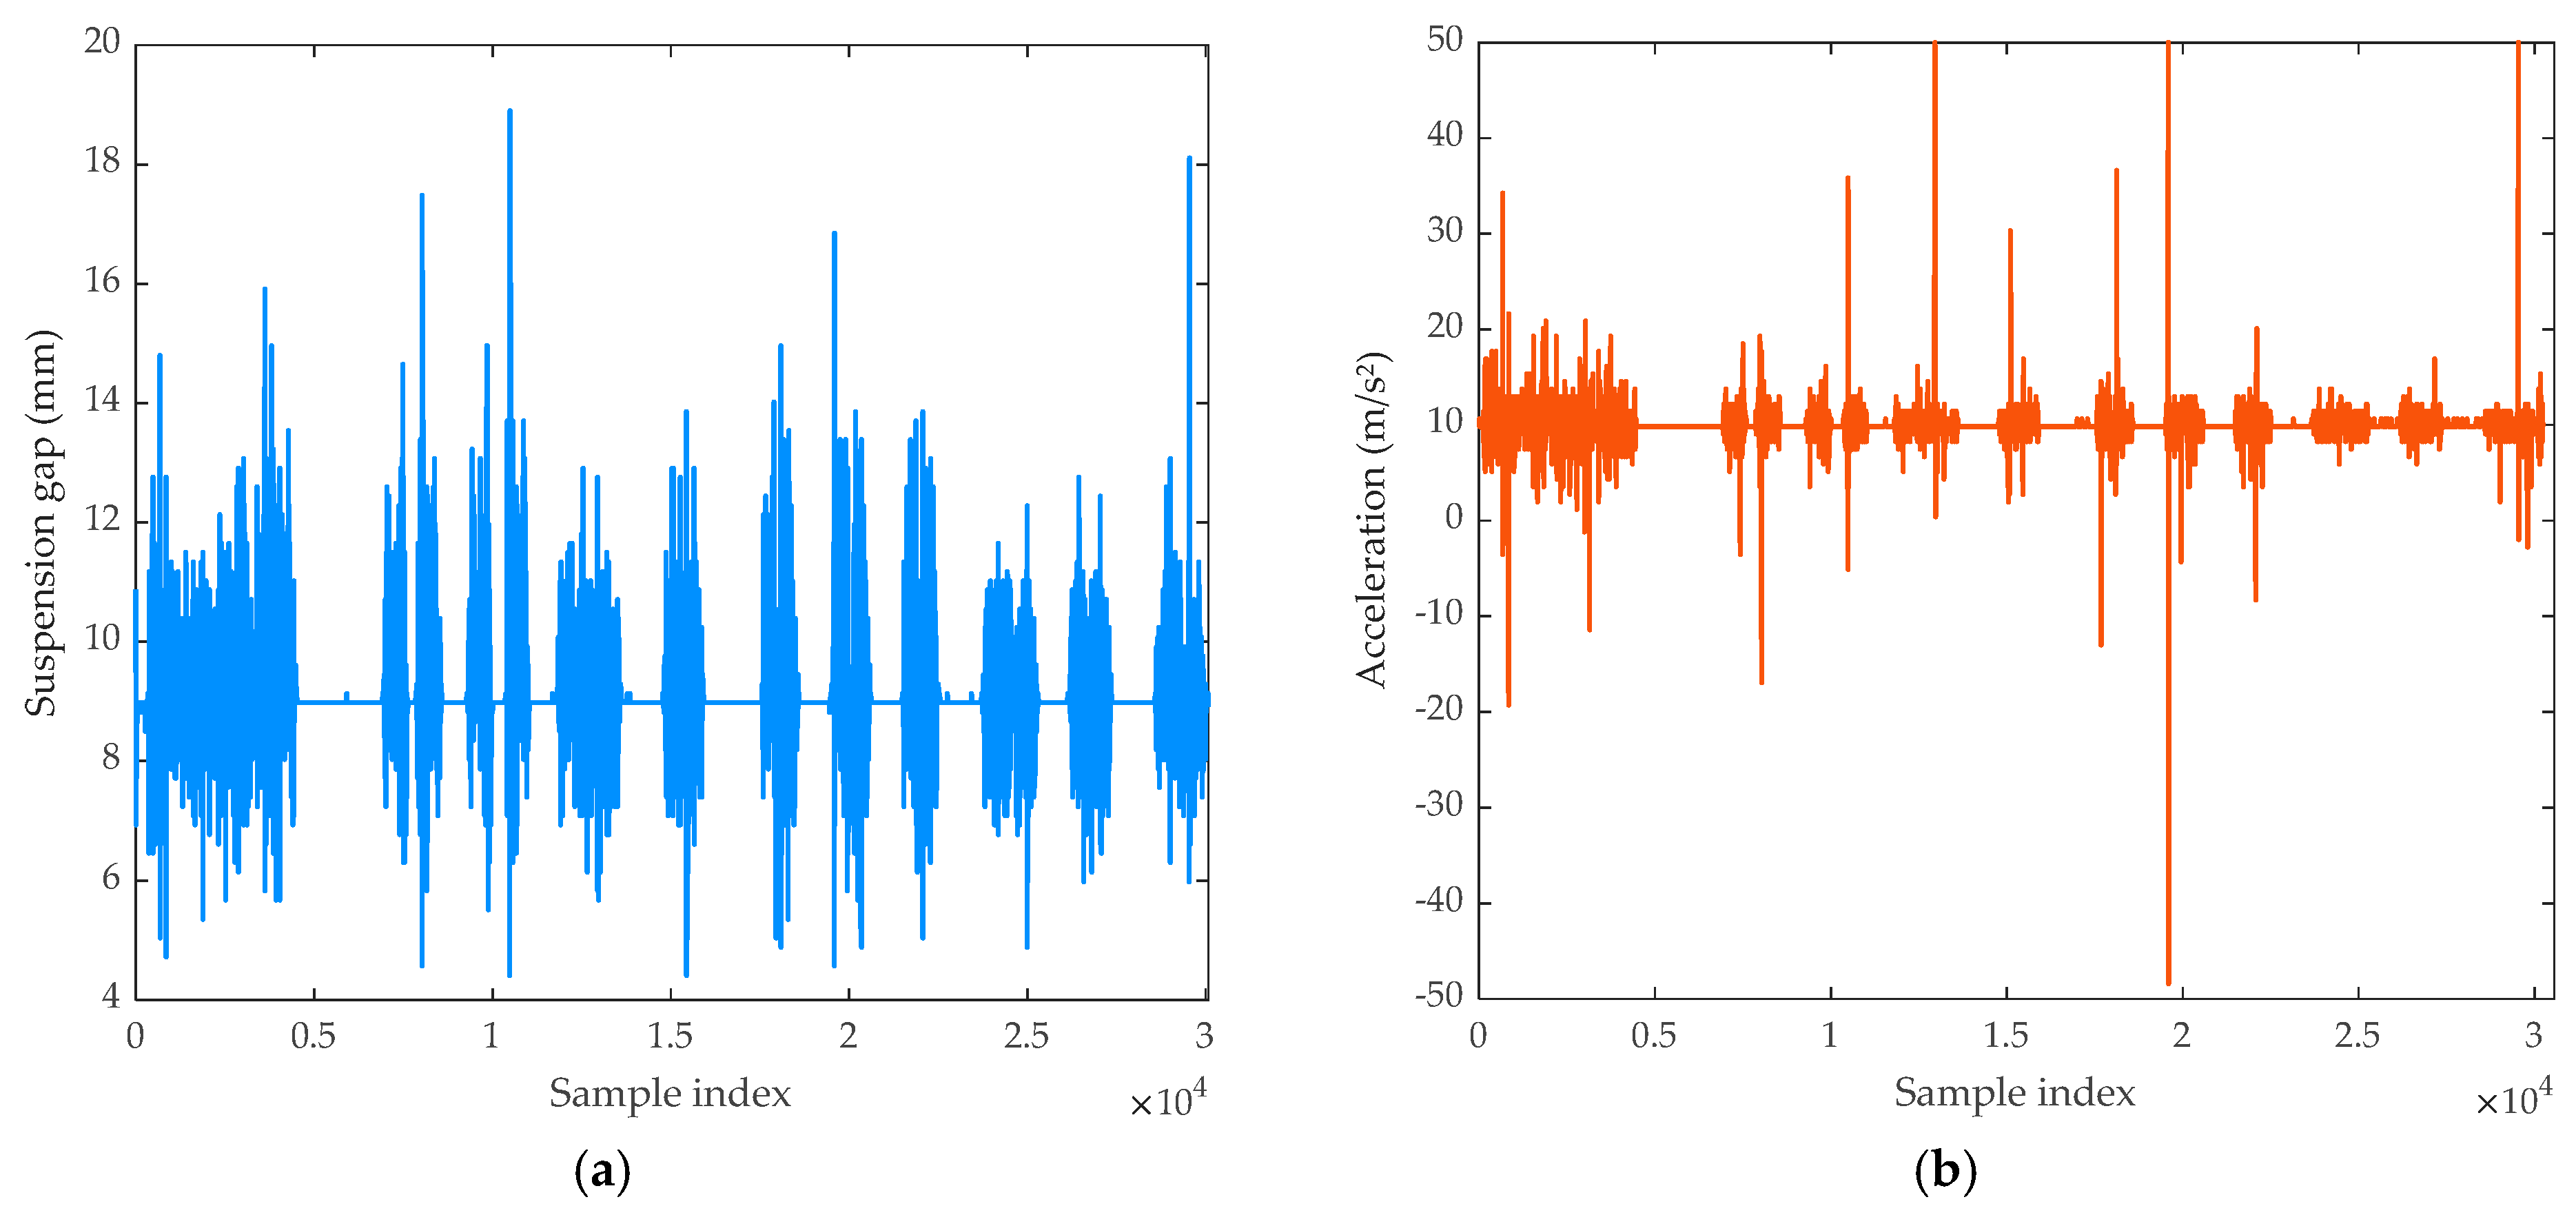
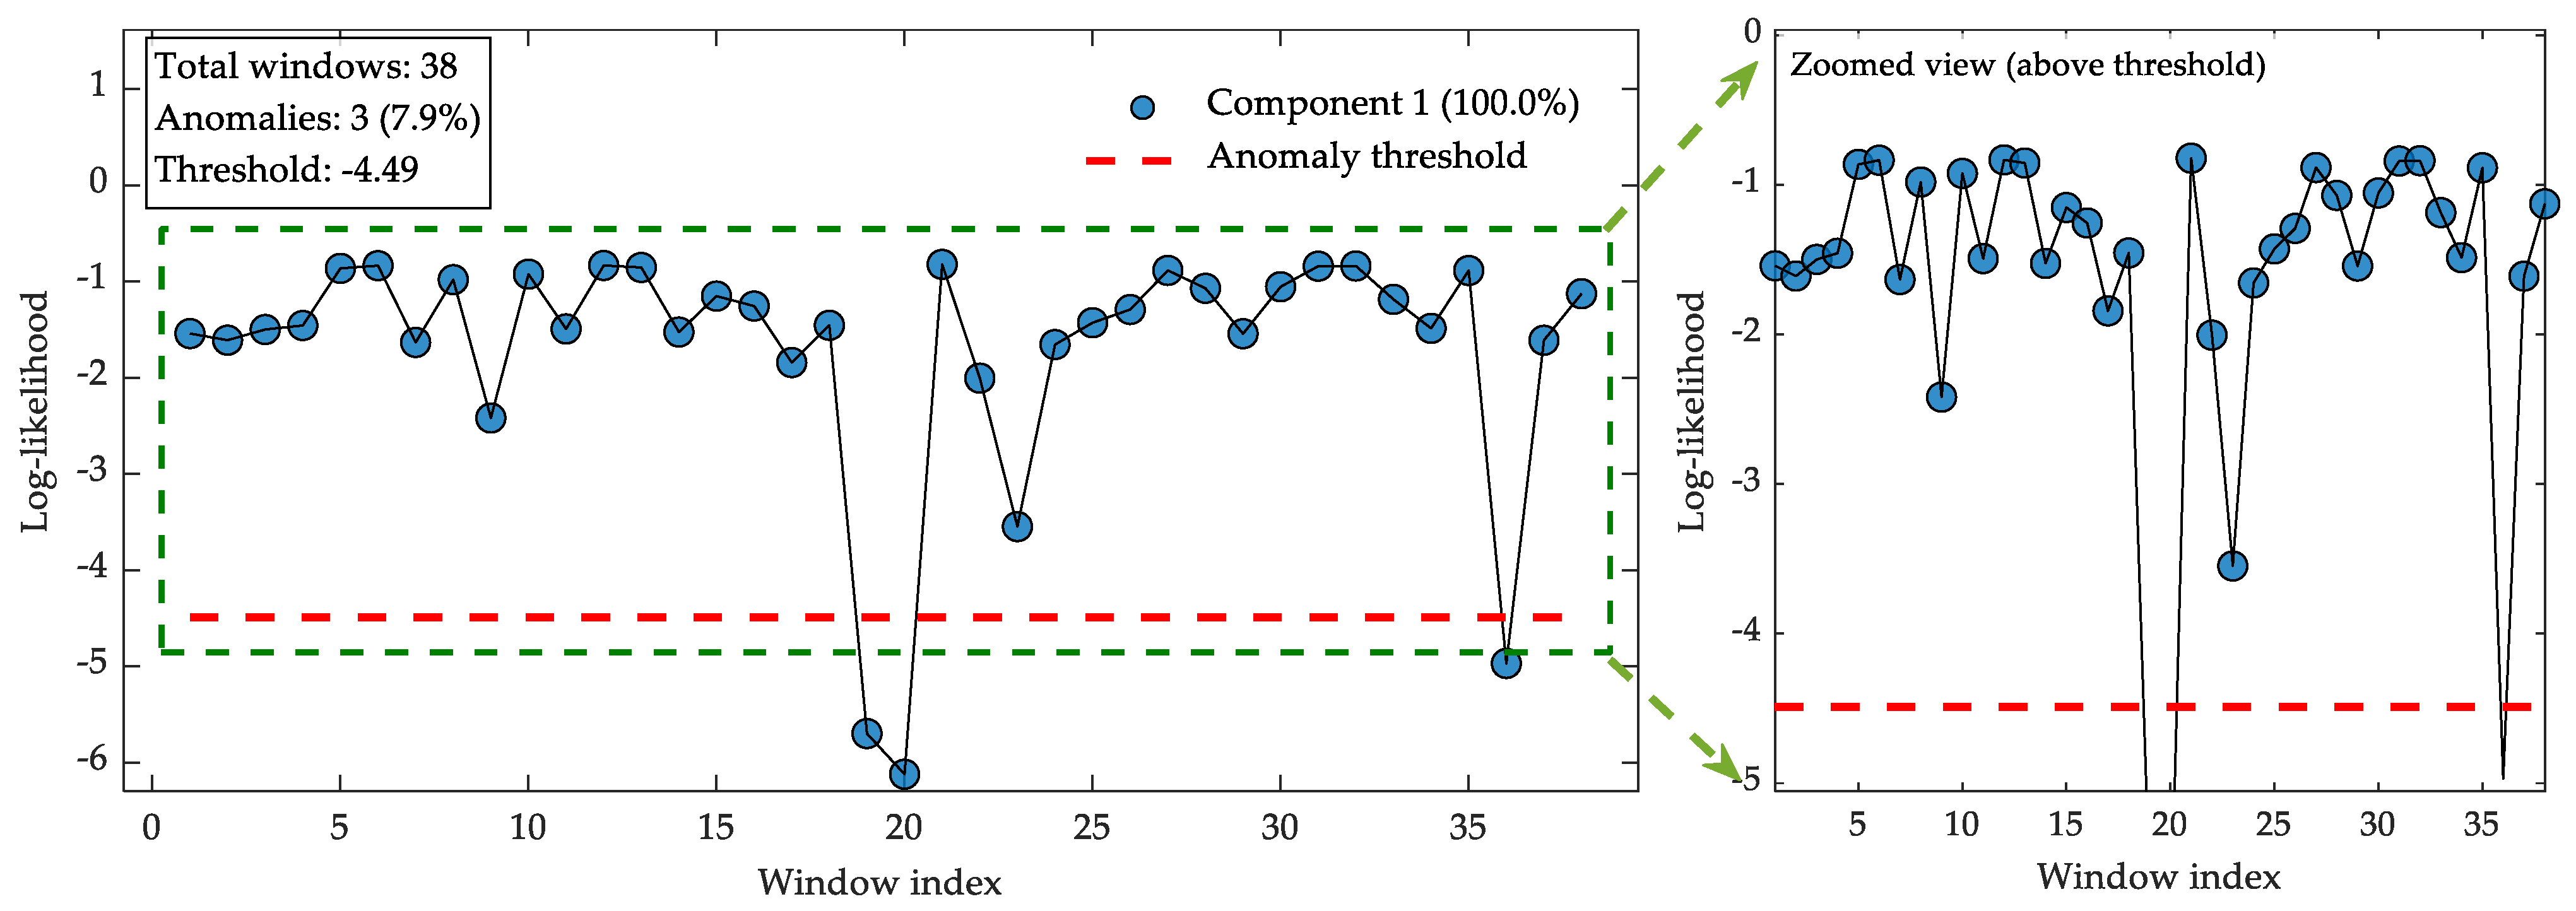
To further validate the robustness of the proposed evaluation method, the operating conditions of the suspension system are adjusted in this study. Specifically, the stiffness of the track beam is reduced from 3000 to 1500, the load is set to full load, and the speed is varied within the range of 0 to 80 km/h. The raw operational data and the corresponding comprehensive evaluation results under each condition are shown in
Figure 10 and
Figure 11, respectively. As can be observed from the evaluation results, the GMM baseline model established from the original healthy data continues to provide reasonable performance assessments even when the track beam stiffness, load, and operating speed are all altered. The evaluation outcomes exhibit a high degree of consistency with the actual trends in the air gap and acceleration of the suspension system, accurately reflecting the system’s operational state. In some time windows, the performance score falls briefly below the health threshold. Further analysis indicates that this phenomenon is attributable to the intrinsic dynamic regulation of the suspension system and does not exhibit a systematic dependence on external parameters such as speed or stiffness. These results demonstrate that the proposed method possesses favorable adaptability to varying operating conditions.
4.3. Summary
Based on the experimental results presented above, the proposed GMM-based performance evaluation method for suspension systems demonstrates significant advantages in the following aspects.
First, the proposed method exhibits enhanced capability in motion mode identification. Compared with conventional error integral performance indices, it can effectively distinguish multiple motion modes—namely, the steady levitation mode, the dynamic adjustment mode, and the relatively stable mode—thereby providing a more refined classification for system state analysis. Second, it improves anomaly detection ability. The method offers richer decision-making information for fault tracing and state discrimination. In the 13th time window, the air gap fluctuation is nearly zero while the acceleration oscillates violently. Conventional error integral indices, which focus solely on the cumulative error of a single signal, fail to detect this anomaly. In contrast, the proposed method, based on the joint probability distribution of the two indices, acutely captures the significant deviation of this operating condition from the normal model, thereby validating the sensitivity of the GMM framework in recognizing abnormal states. Third, it achieves both real-time performance and engineering applicability. Computational efficiency analysis shows that on an 11th-generation Intel Core i7 processor, the GMM-based indices require, on average, only approximately 0.009 s per window, with a maximum single-window computation time of 0.205 s (including initialization), which is far smaller than the sampling step size, fully satisfying the engineering requirements for online real-time monitoring. Fourth, it offers strong interpretability of evaluation results. The log-likelihood values and performance scores output by the proposed method carry clear probabilistic meanings. Together with the motion mode identification results, they enable a more intuitive understanding of the current system state, the degree of deviation from the normal operating baseline, and potential sources of anomalies, overcoming the limitation of conventional indices that provide numerical values without interpretation. Fifth, it avoids the drawbacks of model-based approaches. By comparing the results with suspension system data under different operating conditions, the method is verified to possess favorable applicability.
In summary, the proposed GMM-based comprehensive evaluation method, while maintaining high computational efficiency, integrates multi-source information, achieves automatic motion mode identification, enhances sensitivity to early abnormal states, and provides probabilistic and interpretable evaluation outputs. It thus offers more comprehensive and reliable technical support for online performance assessment and condition monitoring of maglev train suspension systems.
5. Conclusions
This paper proposes a comprehensive evaluation framework for suspension systems based on the Gaussian Mixture Model (GMM), using the improved R index and τ-distance index as foundational features. By training the GMM on healthy operational data, a set of data-driven state models is established, and the framework was validated using measured data from the suspension system. Experimental results demonstrate that the proposed framework can accurately identify various operational states of the suspension system, including steady-state suspension, dynamic adjustment, fluctuation enhancement, and suspected sensor anomalies. Compared with conventional error integral performance indicators, the proposed method exhibits superior sensitivity to early performance degradation and sensor faults, providing timely alerts in scenarios where traditional indicators fail. The evaluation outcomes show high consistency with both traditional methods and the actual system state, while the probabilistic outputs offer clear physical interpretability. Computational efficiency analysis confirms that the method meets the requirements for online real-time monitoring. To further verify the robustness of the proposed method, additional tests were conducted under varying operating conditions, including changes in track beam stiffness, full load, and different speeds. The results indicate that the GMM model trained on original healthy data maintains good evaluation performance across these diverse conditions, with assessment outcomes highly consistent with the actual suspension system behavior. By adopting a purely data-driven approach, this method compensates for the limitations of model-dependent techniques and enables effective real-time monitoring and early warning.
Nevertheless, several limitations remain. The framework is highly dependent on the quality of the collected healthy operational data, and its generalizability to other vehicle types has not been fully verified. Therefore, for applications involving significantly different vehicle structures or line conditions, retraining the GMM with local healthy data is recommended. Future work will focus on online model updating, outlier elimination, and cross-vehicle validation.